jaman north district - statistical service ahafo... · iii preface and acknowledgement no...
TRANSCRIPT

JAMAN NORTH DISTRICT

ii
Copyright © 2014 Ghana Statistical Service

iii
PREFACE AND ACKNOWLEDGEMENT
No meaningful developmental activity can be undertaken without taking into account the
characteristics of the population for whom the activity is targeted. The size of the population
and its spatial distribution, growth and change over time, in addition to its socio-economic
characteristics are all important in development planning.
A population census is the most important source of data on the size, composition, growth
and distribution of a country’s population at the national and sub-national levels. Data from
the 2010 Population and Housing Census (PHC) will serve as reference for equitable
distribution of national resources and government services, including the allocation of
government funds among various regions, districts and other sub-national populations to
education, health and other social services.
The Ghana Statistical Service (GSS) is delighted to provide data users, especially the
Metropolitan, Municipal and District Assemblies, with district-level analytical reports based
on the 2010 PHC data to facilitate their planning and decision-making.
The District Analytical Report for the Jaman North District is one of the 216 district census
reports aimed at making data available to planners and decision makers at the district level. In
addition to presenting the district profile, the report discusses the social and economic
dimensions of demographic variables and their implications for policy formulation, planning
and interventions. The conclusions and recommendations drawn from the district report are
expected to serve as a basis for improving the quality of life of Ghanaians through evidence-
based decision-making, monitoring and evaluation of developmental goals and intervention
programmes.
For ease of accessibility to the census data, the district report and other census reports
produced by the GSS will be disseminated widely in both print and electronic formats. The
report will also be posted on the GSS website: www.statsghana.gov.gh.
The GSS wishes to express its profound gratitude to the Government of Ghana for providing
the required resources for the conduct of the 2010 PHC. While appreciating the contribution
of our Development Partners (DPs) towards the successful implementation of the Census, we
wish to specifically acknowledge the Department for Foreign Affairs, Trade and
Development (DFATD) formerly the Canadian International Development Agency (CIDA)
and the Danish International Development Agency (DANIDA) for providing resources for
the preparation of all the 216 district reports. Our gratitude also goes to the Metropolitan,
Municipal and District Assemblies, the Ministry of Local Government, Consultant Guides,
Consultant Editors, Project Steering Committee members and their respective institutions for
their invaluable support during the report writing exercise. Finally, we wish to thank all the
report writers, including the GSS staff who contributed to the preparation of the reports, for
their dedication and diligence in ensuring the timely and successful completion of the district
census reports.
Dr. Philomena Nyarko
Government Statistician

iv
TABLE OF CONTENTS
PREFACE AND ACKNOWLEDGEMENT ........................................................................iii
LIST OF TABLES .................................................................................................................. vi
LIST OF FIGURES ............................................................................................................... vii
ACRONYMS AND ABBREVIATIONS .............................................................................viii
EXECUTIVE SUMMARY ..................................................................................................... x
CHAPTER ONE: INTRODUCTION ................................................................................... 1
1.1 Background of the District .......................................................................................... 1
1.2 Physical Features ......................................................................................................... 1
1.3 Political and Administrative Structures....................................................................... 3
1.4 Social and Cultural Structure ...................................................................................... 3
1.5 Economy...................................................................................................................... 3
1.6 Census Methodology, Concepts and Definitions ........................................................ 4
1.7 Organization of the Report ........................................................................................ 14
CHAPTER TWO: DEMOGRRAPHIC CHARACTERISTICS ...................................... 16
2.1 Introduction ............................................................................................................... 16
2.2 Population Size and Distribution .............................................................................. 16
2.3 Age-Sex Structure ..................................................................................................... 17
2.4 Fertility, Mortality and Migration ............................................................................. 18
CHAPTER THREE: SOCIAL CHARACTERISTICS .................................................... 25
3.1 Introduction ............................................................................................................... 25
3.2 Household size, composition and structure ............................................................... 25
3.3 Marital Status ............................................................................................................ 27
3.4 Nationality ................................................................................................................. 31
3.5 Religious Affiliation. ................................................................................................. 31
3.6 Literacy and Education.............................................................................................. 32
CHAPTER FOUR: ECONOMIC CHARACTERISTICS ............................................... 36
4.1 Introduction ............................................................................................................... 36
4.2 Economic Activity Status .......................................................................................... 36
4.3 Occupation of employed persons .............................................................................. 38
4.4 Industry of Employed Persons .................................................................................. 39
4.5 Employment Status of Employed Persons ................................................................ 40
4.6 Employment Sector ................................................................................................... 41
CHAPTER FIVE: INFORMATION COMMUNICATION TECHNOLOGY .............. 42
5.1 Introduction ............................................................................................................... 42
5.2 Ownership of Mobile Phones .................................................................................... 42
5.3 Use of Internet ........................................................................................................... 42
5.4 Household Ownership of Desktop or Laptop Computer ........................................... 42
CHAPTER SIX: DISABILITY ........................................................................................... 44
6.1 Introduction ............................................................................................................... 44
6.2 Population with Disability ......................................................................................... 44
v
6.3 Type of Disability...................................................................................................... 45
6.4 Distribution by Type of Locality ............................................................................... 45
6.5 Disability and Activity Status ................................................................................... 45
6.6 Disability, Education and Literacy ............................................................................ 46
CHAPTER SEVEN: AGRICULTURAL ACTIVITIES ................................................... 48
7.1 Introduction ............................................................................................................... 48
7.2 Households in Agriculture ........................................................................................ 48
7.3 Types of Farming Activities ...................................................................................... 48
7.4 Types of livestock and other animals reared. ............................................................ 49
CHAPTER EIGHT: HOUSING CONDITIONS ............................................................... 50
8.1 Introduction ............................................................................................................... 50
8.2 Housing Stock ........................................................................................................... 50
8.3 Type of Dwelling and Ownership Status Arrangements ........................................... 51
8.4 Construction Material ................................................................................................ 52
8.5 Room Occupancy ...................................................................................................... 54
8.6 Access to Utilities and Household Facilities ............................................................. 55
8.7 Main Source of Water for Drinking and for other Domestic Purposes ..................... 56
8.8 Bathing and Toilet Facilities ..................................................................................... 57
8.9 Methods of Waste Disposal....................................................................................... 58
CHAPTER NINE: SUMMARY OF FINDINGS, CONCLUSIONS AND POLICY
RECOMMENDATIONS ..................................................................... 60
9.1 Introduction ............................................................................................................... 60
9.2 Demographic Characteristics .................................................................................... 60
9.3 Housing Conditions ................................................................................................... 62
9.4 Conclusion ................................................................................................................. 65
REFERENCES ....................................................................................................................... 67
APPENDICES ........................................................................................................................ 68
LIST OF CONTRIBUTORS ................................................................................................ 72

vi
LIST OF TABLES
Table 2.1: Population by Age, sex and type of locality .......................................................... 17 Table 2.2: Reported total fertility rate, general fertility rate and crude birth rate by district . 19 Table 2.3: Female population 12 years and older by age, children ever born, children
surviving and sex of child ..................................................................................... 20 Table 2.4: Total population, deaths in households and crude death rate by district ............... 21 Table 2.5: Cause of death by district ...................................................................................... 22 Table 2.6: Birthplace by duration of residence of migrants .................................................... 24 Table 3.1: Household size by locality of residence ................................................................ 25
Table 3.2: Household population by composition and sex ..................................................... 26 Table 3.3: Household population by structure and sex ........................................................... 27 Table 3.4: Persons 12 years and older by sex, age-group and marital status .......................... 28
Table 3.5: Persons 12 years and older by sex, marital status and level of education ............. 29 Table 3.6: Persons 12 years and older by sex, marital status and economic activity status ... 30 Table 3.7: Population by nationality and sex .......................................................................... 31 Table 3.8: Population by religion and sex .............................................................................. 31 Table 3.9: Population 11 years and older by sex, age and literacy status ............................... 32 Table 3.10:Population 3 years and older by level of education, school attendance and sex ... 35
Table 4.1: Population 15 years and older by activity status and sex ...................................... 37 Table 4.2: Population 15 years and older by sex, age and activity status ............................... 38 Table 4.3: Employed population 15 years and older by occupation and sex .......................... 39
Table 4.4: Employed population 15 years and older by Industry and Sex ............................. 40 Table 4.5: Employed population 15 years and older by employment status and sex ............. 41
Table 4.6: Employed population 15 years and older by employment sector and sex ............. 41 Table 5.1: Population 12 years and older by mobile phone ownership, internet facility
usage, and sex ........................................................................................................ 42 Table 5.2: Households having desktop/laptop computers by sex of head of household ........ 43 Table 6.1: Population by type of locality, disability type and sex .......................................... 44
Table 6.2: Persons 15 years and older with disability by economic activity status and sex ... 46
Table 6.3: Population 3 years and older by sex, disability type and level of education ......... 47 Table 7.1: Agricultural activities of households by locality ................................................... 49 Table 7.2: Distribution of livestock, other animals and keepers............................................. 49 Table 8.1: Stock of houses and households by type of locality .............................................. 50 Table 8.2: Type of occupied dwelling unit by sex of household head and type of locality ... 51
Table 8.3: Ownership status of dwelling by sex of household head and type of locality .... 52 Table 8.4: Main construction material for outer wall of dwelling unit by type of locality .... 52 Table 8.5: Main construction materials for the floor of dwelling unit by type of locality ..... 53 Table 8.6: Main construction material for roofing of dwelling unit by type of locality ......... 54
Table 8.7: Household size and number of sleeping rooms occupied in dwelling unit ........... 54 Table 8.8: Main source of lighting of dwelling unit by type of locality ................................. 55 Table 8.9: Main source of cooking fuel, and cooking space used by households .................. 56
Table 8.10:Main source of water of dwelling unit for drinking and other domestic purposes ................................................................................................................. 57 Table 8.11:Type of toilet facility and bathing facility used by household by type of locality 58 Table 8.12:Method of solid and liquid waste disposal by type of locality .............................. 59 Table A.1: Distribution of households engaged in tree growing or crop farming by type of crop and population engaged ............................................................................. 68

vii
Table A2: Total population, Sex, number of households and houses in the 20 largest
communities .......................................................................................................... 70 Table A3: Population by age groups in the 20 largest communities ...................................... 71
LIST OF FIGURES
Figure 1.1: Relief Map of Jaman North District ....................................................................... 2
Figure 2.1: Population Pyramid .............................................................................................. 18
Figure 2.2: Reported age specific death rates by sex .............................................................. 23
Figure 3.1: School attendance by sex ..................................................................................... 34
Figure 7.1: Households in agriculture by type of locality ...................................................... 48

viii
ACRONYMS AND ABBREVIATIONS
ASFR Age Specific Fertility Rate
CBR Crude Birth Rate
CDR Crude Death Rate
CERSGIS Centre for Remote Sensing and Geographic Information System
CEPS Customs Excise and Preventive Service
CHPS Community Based Health Planning and Services
CIDA Canadian International Development Agency
CSIR Council for Scientific and Industrial Research
DANIDA Danish International Development Agency
DC Degree Celsius
DFID Department for International Development
DMTDP District Medium Term Development Plan
DPs Development Partners
ECOWAS Economic Community of West African States
EU European Union
GFR General Fertility Rate
GNPC Ghana National Petroleum Corporation
GSGDA Ghana Shared Growth Development Agenda
GSS Ghana Statistical Service
GYEEDA Ghana Youth Employment and Entrepreneurial Development Agency
HND Higher National Diploma
ICT Information Communication Technology
ISSER Institute of Statistical, Social and Economic Research
JHS Junior High School
JSS Junior Secondary School
Km2 Kilometer Square
KVIP Kumasi Ventilated Improved Pit

ix
L.I Legislative Instrument
MDAs Ministries, Departments and Agencies
MDGs Millennium Development Goals
MSE Micro and Small Scale Enterprise
MTDP Medium Term Development Plan
N North
NCTAC National Census Technical Advisory Committee
NCSC National Census Steering Committee
NDPC National Development Planning Commission
NGOs Non-Governmental Organizations
No. Number
OPD: Out Patient Department.
PDA Portable Digital Assistant
PES Post Enumeration Survey
PHC Population Housing Census
PPP Public Private Partnership
PWDs Persons with Disability
SHS Senior High School
SRI Soil Research Institute
SSS Senior Secondary School
TFR Total Fertility Rate
UN United Nations
UNFPA United Nations Population Fund
W West
WC Water Closet

x
EXECUTIVE SUMMARY
Introduction
The District Census Report is the first of its kind since the first post-independence census was
conducted in 1960. The report provides basic information about the Municipality. It gives a
brief background of the district, describing its physical features, political and administrative
structure, socio-cultural structure and economy. Using data from the 2010 Population and
Housing Census (2010 PHC), the report discusses the population characteristics of the
Municipality, fertility, mortality, migration, marital status, literacy and education, economic
activity status, occupation, employment; Information Communication Technology (ICT),
disability, agricultural activities and housing conditions of the district. The key findings of the
analysis are as follows (references are to the relevant sections of the report).
Population size, structure and composition
The population of Jaman North, according to the 2010 Population and Housing Census, is
83,059 representing 3.6 percent of the region’s population. Males constitute 48.1 percent and
females represent 51.9 percent. The proportion of the population living in urban localities
(52.5%) is slightly higher than that living in rural localities (47.5) of the district. The district has
a sex ratio of 92.4. The population of the district is youthful (almost 40.0% of the population is
below 15 years) depicting a broad base population pyramid which tapers off with a small
number of elderly persons (60 years and older) representing 7.6 percent. The total age
dependency ratio for the district is 83.6, the age dependency ratio for rural localities is higher
(92.5) than that of urban localities (76.2).
Fertility, mortality and migration
The Total Fertility Rate for the district (3.3) is slightly lower, compared to the regional fertility
rate of 3.6. The General Fertility Rate is 82.6 births per 1000 women aged 15-49 years. The
Crude Birth Rate (CBR) is 21 per 1000 population. The crude death rate for the district is 8
deaths per 1000. Accident/violence/homicide/suicide account for 6.2 percent of all deaths while
other causes contribute to 93.8 percent of deaths. Majority of migrants (58.9 percent) living in
the district were born in elsewhere in the region while 41.1 percent were born elsewhere in
another region. For migrants born elsewhere in another region, those born in Western have the
highest proportion (32.1%) followed by that who were born in Upper West.
Household Size, composition and structure
The district has a household population of 82,074, representing 3.6 percent of total households
in the region. The average household size in the district is 5 persons per household. Children
constitute the largest proportion of the household structure accounting for 44.7 percent of the
household population. Spouses form about 7.7 percent. The proportion of households who live
in extended household structure (head, spouse(s), children and head’s relatives) constitute the
largest proportion (24.2%) than that of any other type of household structure. Nuclear
households (head, spouse(s) and children) constitute only 12.1 percent.
Marital status
There are more people (48.8%), 12 years and older, who have never married than those
married (37.1%). Persons who are widowed constitute 5.4 percent of the district population.
Divorced persons make up 4.0 percent while those in consensual relationships constitute 3.7

xi
percent. The highest percentages (46.8 and 40.2) of married persons either had no education
or attained only basic education respectively. Only 28.7 percent of persons who have never
married are employed, as compared to 56.0 percent who are unemployed.
Nationality
The proportion of Ghanaians by birth in the district is 95.2 percent. Those who have
naturalised constitute less than one percent while those dual nationality are 1.9 percent of the
total population of the district.
Literacy and education
Of the population 11 years and above, 71.7 percent are literates and 28.3 percent are non-
literates. The proportion of literate males (81.2%) is higher than that of females (63.3%).
Almost seven out of ten people (68.8%) indicate they can speak and write both English and
Ghanaian languages. Of the population aged 3 years and above (48,131) in the district, 22.2
percent has attended school in the past and 46.1 percent are currently attending. A higher
proportion of males (51.6%) are currently attending school than females (41.4%).
Economic Activity Status
About 70.3 percent of the population aged 15 years and older are economically active and
29.7 percent are economically not active. Of the economically active population, 96.8 percent
are employed while 3.2 percent are unemployed. For those who are economically not active,
a larger percentage of them are students (67.0%), 14.6% perform household duties and 8.0
percent are either too young or old to work. About seven out of ten (69.4) of unemployed
persons in the district are seeking work for the first time.
Occupation
Of the employed population, the highest proportion (71.6%) are engaged as skilled
agricultural, forestry and fishery workers. The second highest are those engaged in service
and sales. Those engaged in craft and related trades constitute 10.0 percent and 4.4 percent
are engaged as professionals.
Employment status and sector
Of the population 15 years and older, highest proportion (53.1%) are self-employed without
employees, 22.1 percent are employees, 12.4 percent are contributing family workers and 5.0
percent are self-employed with employees. Higher proportion of females are self-employed
without employees (57.9%) compared to 48.0 percent for males. The proportion of females
who are employees (6.1%) is however smaller than that of male employees (13.8%). The
private informal sector is the largest employer in the district, employing 91.5 percent of the
population. Public sector is the next highest employer, engaging 5.6 percent of the employed
population.
Information Communication Technology
Of the population 12 years and above, 41.8 percent have mobile phones. Males who own
mobile phones constitute 48.4 percent as compared to 36.1 percent of females. Only about 2.2
percent of the population 12 years and older use internet facilities in the district and a 4.2
percent of the total households in the have desktop/laptop computers.
xii
Disability
About 2.7 percent of the total population of the district has one form of disability or the other.
Almost equal proportions of both female and male in the population suffer disability. The
types of disability in the Municipality include sight, hearing, speech, physical, intellect, and
emotion. Sight disability is the commonest form of disability in the district, affecting about
31 percent of the disable population. The second commonest is physical disability which also
affects 29.2 percent. Many forms of the disabilities, including emotional, physical, hearing
and sight affect higher proportions of female than males. About 57.3 percent of the disable
population are employed and 0.8 percent unemployed. In terms of education, 52.3 percent of
them in the district have never attended school.
Agriculture
About 81.7 percent of households in the district are engaged in agriculture. In the rural
localities, as high as 91.4 percent of households are agricultural households while in the
urban localities, 73.1 percent are into agriculture. Most (99.0%) of the agricultural
households in the district are involved in crop farming. Poultry (chicken) is the dominant
animal (58.1 percent of all animals) kept by the higher proportion (39.0%) of households in
the district.
Housing
The housing stock of Jaman North district is 10,020 representing 3.0 percent of the total
number of houses in the Brong Ahafo Region. The average number of persons per house is
about 8, compared to 7 persons for the entire region.
Type, tenancy arrangement and ownership of dwelling units
The highest proportion (69.4%) of dwelling units in the district are compound houses; 24.7
percent are separate houses and 3.2 percent are semi-detached houses. About 46 percent of
the dwelling units in the district are owned by members of the household; 39.2 percent are
owned by relatives who are not household members and 12.5 percent are owned by other
private individuals. Only one percent are owned by public or government.
Material for construction of outer wall, floor and roof
The main construction material for outer walls of dwelling units in the district are
mud/brick/earth which constitute 46.7 percent and cement/concrete which accounts for 46.0
percent of outer walls of dwelling units. Cement (85.9%) and mud/earth (13.1%) are the two
main materials used in the construction of floors of dwelling units in the district. Metal sheets
are the commonest main roofing materials, constituting about 91.8 percent of roofing
materials of dwellings. The second commonest is thatch/palm leaf or raffia which are used
for roofing 2.2 percent of dwellings.
Room occupancy
One sleeping room occupancy is the commonest among all households with sizes between
one and six. About 92.3 percent of single member households occupy dwelling units with
one sleeping room. About 10.4 percent of households with 10 or more members occupy
single rooms in the district.

xiii
Utilities and household facilities
The three main sources of lighting for most households are flashlight/torch (48.6% of
households), electricity (44.3%), and kerosene lamp (5.5%). Most households in the district
use two main sources of cooking fuel; wood, used by 72.4 percent of households and
charcoal used by 15.9 percent. Gas is the third commonly used fuel for cooking for almost
four percent of households. The use of wood is more common among rural households than
those in urban localities. Whereas 89.5 percent of rural households depend on wood for
cooking fuel, 57.3 percent of those in urban localities use it for cooking. There are four main
sources of drinking water in the district which include borehole//pump/tube well, used by
55.3 percent of households, public tap/standpipe (20.1%), pipe-borne outside dwelling, used
by 14.4 percent of households and pipe-borne inside dwelling which is used by 4.8 percent of
households.
The commonest toilet facility is used by 56.6 percent of households in the district and that is
public toilet. The use of pit-latrine is the second commonest. Only 9.2 percent of households
in the district has no toilet facility. As high as 41.6 percent of households in the district share
separate bathrooms in the same house while only 21.3 percent own bathrooms for their
exclusive use.
Waste disposal
The most widely used method of solid waste disposal is by public dump (open space)
accounting for 74.7 percent households in the district. Sixteen percent of households also use
public dump (container) which constitute the second widely used method of solid waste
disposal. Only two percent of households dump their solid waste indiscriminately. House to
house waste collection accounts for 4.5 percent of households. For liquid waste disposal,
throwing waste onto the street is the commonest (61.5% of households) and throwing onto
the compound is done by 34.0 percent, the second commonest method.

1
CHAPTER ONE
INTRODUCTION
1.1 Background of the District
Jaman North District was created out of the then Jaman south District in 2004 under the
Legislative Instrument (LI) 1779 of 2004.The Assembly exists to effectively mobilize
resources to spearhead development to improve the living conditions of the people through
promotion of agriculture, good governance and development of the human capital base.
1.2 Physical Features
1.2.1 Location and Size
The district is located between latitude 7’40” N and 8’ 27”N, and longitude 2’30”W and 2’
60” W.The district is physically located to the North-Western part of the Brong Ahafo
Region. It shares boundaries with Tain District to the North-East, Jaman South District to the
South-West and Berekum District to the South-East. It is bordered on the East to the La Cote
d’Ivoire. The district capital, Sampa is located about 119km from Sunyani the regional
capital while it is 504 km from Accra, the national capital.
1.2.2 Relief and Drainage
The relief of the district is generally undulating, rising between 150 and 600 meters above sea
level. The isolated hills are located around Asuokor, Goka and Suma-Ahenkro. These hills
are believed to contain gold deposits and are waiting to be exploited for development of the
district.
The drainage pattern of the district is largely dendritic and flows in a south and south eastern
direction as depicted in Figure 1.1 below. The major river in the district is the Tain whilst a
number of minor streams abound in the district. Unfortunately, the water bodies are seasonal
which implies that they cannot be relied upon for provision of irrigation to promote
continuous and year-round farming
1.2.3 Climate
Lying within the wet semi-equatorial region, the district experiences a mean annual rainfall
ranging between 120mm to 178mm. The district enjoys bi-modal rainfall patterns with the
major one occurring between April to July and the minor one between September to October
each year. Relative humidity is generally high, ranging between 70 to 80 percent during the
rainy season. The month of August usually experiences a short dry season with the major one
occurring between November to March. Average annual temperature is about 260
Celsius.
1.2.4 Vegetation
The vegetation of the district is characterized by two main ecological zones. The major
vegetation is the woodland consisting of widely dispersed short trees and grasses/shrubs. This
covers the greater part of the total land area of the district. This part of the land is suitable for
the cultivation of cashew, yam, cassava, rice, beans and groundnut. The semi-deciduous
forest also consists of secondary forest that is suitable for the cultivation of plantain,
cocoyam, cassava and yam. It is in this area that major timber species such as Odum, Wawa,
Mahogany and Teak harvested in the district are found.

2
Figure 1.1: Relief Map of Jaman North District
Source: Ghana Statistical Service, GIS

3
1.3 Political and Administrative Structures
By statutory declaration as contained in the Local Government Act 1993, Act 462, the Jaman
North District Assembly is the highest planning, political and administrative authority in the
district. The Assembly has a total membership of thirty-nine (39) with 27 elected members
and 12 appointees. The DCE is both the political and administrative head of the Assembly
and is ably supported by the Co-ordinating Director and other staff of the Assembly.
As part of deepening decentralization, democracy and good governance in the district, seven
(7) sub-structures are in place to ensure grassroots and popular participation in the
development process. They are Sampa Town Council, Nafana East Area Council, Suma Area
Council and Goka Area Council. Others are Asiri-Jankufa Area Council, Nafana West Area
Council and Kwatwoma Area Council all shown in Figure 1.2 below. There are a number of
thiry-five unit (35) committees that supports both the area councils and the Assembly in the
discharge of their duties.
1.4 Social and Cultural Structure
1.4.1 Traditional setup
The District is largely composed of two main ethnic groups, the Bonos and the Nafanas. The
Bonos constitute the majority of the population and the Nafanas (Nfantra) are the minority
group. In Akan political system there are series of hierarchical levels of authority which
operates from the family unit through the lineage until the final authority, the omanhene or
paramount chief. Territorially, the three independent polity in the district comprises a
principal town or capital, surrounded by outlying subordinate towns and villages. The three
traditional councils in the Jaman North District are the Nafana (with its headquarters at
Sampa), Suma (Headquarters at Suma and Kwatwoma (with its headquarters at Seketia). The
headquarters is the official residence of the paramount chief or omanhene, and avenue of all
important meetings and rituals involving the whole “oman”.
The omanhene works in consultation with other council of elders namely, the Kontihene,
Akwamuhene, Twafo hene, Adontenhene, Ankobeahene ,Kyidomhene, Gyasehene and the
Okyeame who acts as the spokes person to the chief.
1.4.2 Ethnicity and Language
The District is largely composed of two main ethnic groups, the Bonos and the Nafanas. The
Bonos constitute the majority of the population and the Nafanas (Nfantra) are the minority
group. The common festivals celebrated among the traditional area within the district include
the Gombe Dance by Moslems to select wives at Sampa and the yam festival which is called
the Sumbgee is celebrated annually.
1.5 Economy
1.5.1 Economic activities/potential
Agriculture is the dominant economic activity in the district. It employs more than 70 percent
of the total population within the labor force. Thus it is the major source of livelihood for
majority of people in the District. The major sectors of agriculture in the district are crop
farming and livestock rearing. These are discussed below.

4
The major crops cultivated in the District are yam, maize, cassava, rice, cocoyam and
plantain. The commonest vegetables and spices also produced are pepper, groundnut,
tomatoes and garden eggs with cashew nut being the main cash crop. The district produces
many tonnes of cashew annually but unfortunately the produce are carted and exported
annually in their raw state by both local and foreign merchants. This practice is seriously
affecting comparative economic development of the District. Presently, some of the cashew
nuts are processed into nuts under subsistence levels at Kabile and Jamera.
1.5.2 Social Infrastructure
Electricity supply is gradually improving in the district. Out of the 7 area council capitals,
five, are connected to the national grid and all towns and villages along the Sampa-Drobo
trunk road enjoy electricity. Other communities that have electricity are Jankufa and
Asuokor. The district has a total number of 144 schools comprising of 84 primary schools, 54
Junior High Schools and 6 Secondary Schools (comprising public (4) and private (2)
schools). There are 11 private Junior High Schools and 19 private primary schools and 65
public primary whiles the public Junior High School are 43 in number.
There is only one government hospital in the district and 5 other health facilities which
comprise of two clinics and three CHIP compounds. These other health facilities are scattered
around the various communities in the district that makes health care accessibility residents in
the district.
1.5.3 Transportation
The District has total road network of about 330 kilometres(km) made up of 265km of feeder
roads and 65km of highways. The road network in the district lives much to be desired
making transportation very uncomfortable, time consuming and costly.
1.5.4 Tourism
The district has immense tourism potentials that can be exploited to the benefit of the district.
The sacred Baobab tree and the Missionary cemetery located at Sampa. Others are the cave at
Koti believed to be the origin of the people of Koti, the sacred forest at Kaabre, the Ghana-La
Cote d’Ivoire border at Sampa and a Mango tree located at Korase reported to be the largest
Mango tree in the region.
1.6 Census Methodology, Concepts and Definitions
1.6.1 Introduction
Ghana Statistical Service (GSS) was guided by the principle of international comparability
and the need to obtain accurate information in the 2010 Population and Housing Census
(2010 PHC). The Census was, therefore, conducted using all the essential features of a
modern census as contained in the United Nations Principles and Recommendations for
countries taking part in the 2010 Round of Population and Housing Censuses.
Experience from previous post independence censuses of Ghana (1960, 1970, 1984 and 2000)
was taken into consideration in developing the methodologies for conducting the 2010 PHC.
The primary objective of the 2010 PHC was to provide information on the number,
distribution and social, economic and demographic characteristics of the population of Ghana
necessary to facilitate the socio-economic development of the country.

5
1.6.2 Pre-enumeration activities
Development of census project document and work plans
A large scale statistical operation, such as the 2010 Population and Housing Census required
meticulous planning for its successful implementation. A working group of the Ghana
Statistical Service prepared the census project document with the assistance of two
consultants. The document contains the rationale and objectives of the census, census
organisation, a work plan as well as a budget. The project document was launched in
November 2008 as part of the Ghana Statistics Development Plan (GSDP) and reviewed in
November 2009.
Census secretariat and committees
A well-structured management and supervisory framework that outlines the responsibilities
of the various stakeholders is essential for the effective implementation of a population and
housing census. To implement the 2010 PHC, a National Census Secretariat was set up in
January 2008 and comprised professional and technical staff of GSS as well as staff of other
Ministries, Departments and Agencies (MDAs) seconded to GSS. The Census Secretariat was
primarily responsible for the day-to-day planning and implementation of the census activities.
The Secretariat had seven units, namely; census administration, cartography, recruitment and
training, publicity and education, field operations and logistics management, data processing,
and data analysis and dissemination.
The Census Secretariat was initially headed by an acting Census Coordinator engaged by the
United Nations Population Fund (UNFPA) in 2008 to support GSS in the planning of the
Census. In 2009, the Census Secretariat was re-organised with the Government Statistician
as the National Chief Census Officer and overall Coordinator, assisted by a Census
Management Team and a Census Coordinating Team. The Census Management Team had
oversight responsibility for the implementation of the Census. It also had the responsibility of
taking critical decisions on the census in consultation with other national committees. The
Census Coordinating Team, on the other hand, was responsible for the day-to-day
implementation of the Census programme.
A number of census committees were also set up at both national and sub-national levels to
provide guidance and assistance with respect to resource mobilization and technical advice.
At the national level, the committees were the National Census Steering Committee (NCSC),
the National Census Technical Advisory Committee (NCTAC) and the National Census
Publicity and Education Committee (NCPEC). At the regional and district levels, the
committees were the Regional Census Implementation Committee and the District Census
Implementation Committee, respectively.
The Regional and District Census Implementation Committees were inter-sectoral in their
composition. Members of the Committees were mainly from decentralized departments with
the Regional and District Coordinating Directors chairing the Regional Census
Implementation Committee and District Census Implementation Committee, respectively.
The Committees contributed to the planning of district, community and locality level
activities in areas of publicity and field operations. They supported the Regional and District
Census Officers in the recruitment and training of field personnel (enumerators and
supervisors), as well as mobilizing logistical support for the census.

6
Selection of Census topics
The topics selected for the 2010 Population and Housing Census were based on
recommendations contained in the UN Principles and Recommendations for 2010 Round of
Population and Housing Censuses and the African Addendum to that document as well as the
needs of data users. All the core topics recommended at the global level, i.e., geographical
and internal migration characteristics, international migration, household characteristics,
demographic and social characteristics such as age, date of birth, sex, and marital status,
fertility and mortality, educational and economic characteristics, issues relating to disability
and housing conditions and amenities were included in the census.
Some topics that were not considered core by the UN recommendations but which were
found to be of great interest and importance to Ghana and were, therefore, included in the
2010 PHC are religion, ethnicity, employment sector and place of work, agricultural activity,
as well as housing topics, such as, type of dwelling, materials for outer wall, floor and roof,
tenure/holding arrangement, number of sleeping rooms, cooking fuel, cooking space and
Information Communication Technology (ICT).
Census mapping
A timely and well implemented census mapping is pivotal to the success of any population
and housing census. Mapping delineates the country into enumeration areas to facilitate
smooth enumeration of the population. The updating of the 2000 Census Enumeration Area
(EA) maps started in the last quarter of 2007 with the acquisition of topographic sheets of all
indices from the Survey and Mapping Division of the Lands Commission. In addition, digital
sheets were also procured for the Geographical Information System Unit.
The Cartography Unit of the Census Secretariat collaborated with the Survey and Mapping
Division of the Lands Commission and the Centre for Remote Sensing and Geographic
Information Services (CERSGIS) of the Department of Geography and Resource
Development, University of Ghana, to determine the viability of migrating from analog to
digital mapping for the 2010 PHC, as recommended in the 2000 PHC Administrative Report.
Field cartographic work started in March 2008 and was completed in February 2010.
Development of questionnaire and manuals
For effective data collection, there is the need to design appropriate documents to solicit the
required information from respondents. GSS consulted widely with main data users in the
process of the questionnaire development. Data users including MDAs, research institutions,
civil society organisations and development partners were given the opportunity to indicate
the type of questions they wanted to be included in the census questionnaire.
Documents developed for the census included the questionnaire and manuals, and field
operation documents. The field operation documents included Enumerator’s Visitation
Record Book, Supervisor’s Record Book, and other operational control forms. These record
books served as operational and quality control tools to assist enumerators and supervisors to
control and monitor their field duties respectively.
Pre-tests and trial census
It is internationally recognized that an essential element in census planning is the pre-testing
of the questionnaire and related instructions. The objective of the pre-test is to test the
questionnaire, the definition of its concepts and the instructions for filling out the
questionnaire.

7
The census questionnaire was pre-tested twice in the course of its development. The first pre-
test was carried out in March 2009 to find out the suitability of the questions and the
instructions provided. It also tested the adequacy and completeness of the responses and how
respondents understood the questions. The second pre-test was done in 10 selected
enumeration areas in August, 2009. The objective of the second pre-test was to examine the
sequence of the questions, test the new questions, such as, date of birth and migration, and
assess how the introduction of ‘date of birth’ could help to reduce ‘age heaping’. With regard
to questions on fertility, the pre-tests sought to find out the difference, if any, between proxy
responses and responses by the respondents themselves. Both pre-tests were carried in the
Greater Accra Region. Experience from the pre-tests was used to improve the final census
questionnaire.
A trial census which is a dress rehearsal of all the activities and procedures that are planned
for the main census was carried out in October/November 2009. These included recruitment
and training, distribution of census materials, administration of the questionnaire and other
census forms, enumeration of the various categories of the population (household,
institutional and floating population), and data processing. The trial census was held in six
selected districts across the country namely; Saboba (Northern Region), Chereponi (Northern
Region), Sene (Brong Ahafo Region), Bia (Western Region), Awutu Senya (Central
Region), and Osu Klottey Sub-Metro (Greater Accra Region). A number of factors were
considered in selecting the trial census districts. These included: administrative boundary
issues, ecological zone, and accessibility, enumeration of floating population/outdoor-
sleepers, fast growing areas, institutional population, and enumeration areas with scattered
settlements.
The trial census provided GSS with an opportunity to assess its plans and procedures as well
as the state of preparedness for the conduct of the 2010 PHC. The common errors found
during editing of the completed questionnaires resulted in modifications to the census
questionnaire, enumerator manuals and other documents. The results of the trial census
assisted GSS to arrive at technically sound decisions on the ideal number of persons per
questionnaire, number of persons in the household roster, migration questions, placement of
the mortality question, serial numbering of houses/housing structures and method of
collection of information on community facilities. Lessons learnt from the trial census also
guided the planning of the recruitment process, the procedures for training of census field
staff and the publicity and education interventions.
1.6.3 Census Enumeration
Method of enumeration and field work
All post- independence censuses (1960, 1970, 1984, and 2000) conducted in Ghana used the
de facto method of enumeration where people are enumerated at where they were on census
night and not where they usually reside. The same method was adopted for the 2010 PHC.
The de facto count is preferred because it provides a simple and straight forward way of
counting the population since it is based on a physical fact of presence and can hardly be
misinterpreted. It is thought that the method also minimizes the risks of under-enumeration
and over enumeration. The canvasser method, which involves trained field personnel visiting
houses and households identified in their respective enumeration areas, was adopted for the
2010 PHC.
The main census enumeration involved the canvassing of all categories of the population by
trained enumerators, using questionnaires prepared and tested during the pre-enumeration

8
phase. Specific arrangements were made for the coverage of special population groups, such
as the homeless and the floating population. The fieldwork began on 21st September 2010
with the identification of EA boundaries, listing of structures, enumeration of institutional
population and floating population.
The week preceding the Census Night was used by field personnel to list houses and other
structures in their enumeration areas. Enumerators were also mobilized to enumerate
residents/inmates of institutions, such as, schools and prisons. They returned to the
institutions during the enumeration period to reconcile the information they obtained from
individuals and also to cross out names of those who were absent from the institutions on
Census Night. Out-door sleepers (floating population) were also enumerated on the Census
Night.
Enumeration of the household population started on Monday, 27th
September, 2010.
Enumerators visited houses, compounds and structures in their enumeration areas and started
enumerating all households including visitors who spent the Census Night in the households.
Enumeration was carried out in the order in which houses/structures were listed and where
the members of the household were absent, the enumerator left a call-back-card indicating
when he/she would come back to enumerate the household. The enumeration process took off
smoothly with enumerators poised on completing their assignments on schedule since many
of them were teachers and had to return to school. However, many enumerators ran short of
questionnaires after a few days’ work.
Enumeration resumed in all districts when the questionnaire shortage was resolved and by
17th
October, 2010, enumeration was completed in most districts. Enumerators who had
finished their work were mobilized to assist in the enumeration of localities that were yet to
be enumerated in some regional capitals and other fast growing areas. Flooded areas and
other inaccessible localities were also enumerated after the end of the official enumeration
period. Because some enumeration areas in fast growing cities and towns, such as, Accra
Metropolitan Area, Kumasi, Kasoa and Techiman were not properly demarcated and some
were characterized by large EAs, some enumerators were unable to complete their assigned
tasks within the stipulated time.
1.6.4 Post Enumeration Survey
In line with United Nations recommendations, GSS conducted a Post Enumeration Survey
(PES) in April, 2011 to check content and coverage error. The PES was also to serve as an
important tool in providing feedback regarding operational matters such as concepts and
procedures in order to help improve future census operations. The PES field work was
carried out for 21 days in April 2011 and was closely monitored and supervised to ensure
quality output. The main findings of the PES were that:
97.0 percent of all household residents who were in the country on Census Night (26th
September, 2010) were enumerated.
1.3 percent of the population was erroneously included in the census.
Regional differentials are observed. Upper East region recorded the highest coverage
rate of 98.2 percent while the Volta region had the lowest coverage rate of 95.7
percent.
Males (3.3%) were more likely than females (2.8%) to be omitted in the census. The
coverage rate for males was 96.7 percent and the coverage rate for females was 97.2

9
percent. Also, the coverage rates (94.1%) for those within the 20-29 and 30-39 age
groups are relatively lower compared to the coverage rates of the other age groups.
There was a high rate of agreement between the 2010 PHC data and the PES data for
sex (98.8%), marital status (94.6%), relationship to head of household (90.5%) and
age (83.0%).
1.6.5 Release and dissemination of results
The provisional results of the census were released in February 2011 and the final results in
May 2012. A National Analytical report, six thematic reports, a Census Atlas, 10 Regional
Reports and a report on Demographic, Social, Economic and Housing were prepared and
disseminated in
2013.
1.6.6 Concepts and Definitions
Introduction
The 2010 Population and Housing Census of Ghana followed the essential concepts and
definitions of a modern Population and Housing Census as recommended by the United
Nations (UN). It is important that the concepts, definitions and recommendations are adhered
to since they form the basis upon which Ghana could compare her data with that of other
countries.
The concepts and definitions in this report cover all sections of the 2010 Population and
Housing Census questionnaires (PHC1A and PHC1B). The sections were: geographical
location of the population, Household and Non-household population, Literacy and
Education, Emigration, Demographic and Economic Characteristics, Disability, Information
and Communication Technology (ICT), Fertility, Mortality, Agricultural Activity and
Housing Conditions.
The concepts and definitions are provided to facilitate understanding and use of the data
presented in this report. Users are therefore advised to use the results of the census within the
context of these concepts and definitions.
Region
There were ten (10) administrative regions in Ghana during the 2010 Population and Housing
Census as they were in 1984 and 2000.
District
In 1988, Ghana changed from the local authority system of administration to the district
assembly system. In that year, the then existing 140 local authorities were demarcated into
110 districts. In 2004, 28 new districts were created; this increased the number of districts in
the country to 138. In 2008, 32 additional districts were created bringing the total number of
districts to 170. The 2010 Population and Housing Census was conducted in these 170
administrative districts (these are made-up of 164 districts/municipals and 6 metropolitan
areas). In 2012, 46 new districts were created to bring the total number of districts to 216.
There was urgent need for data for the 46 newly created districts for planning and decision-
making. To meet this demand, the 2010 Census data was re-programmed into 216 districts
after carrying out additional fieldwork and consultations with stakeholders in the districts
affected by the creation of the new districts.

10
Locality
A locality was defined as a distinct population cluster (also designated as inhabited place,
populated centre, settlement) which has a NAME or LOCALLY RECOGNISED STATUS. It
included fishing hamlets, mining camps, ranches, farms, market towns, villages, towns, cities
and many other types of population clusters, which meet the above criteria. There were two
main types of localities, rural and urban. As in previous censuses, the classification of
localities into ‘urban’ and ‘rural’ was based on population size. Localities with 5,000 or more
persons were classified as urban while localities with less than 5,000 persons were classified
as rural.
Population
The 2010 Census was a “de facto” count and each person present in Ghana, irrespective of
nationality, was enumerated at the place where he/she spent the midnight of 26th September
2010.
Household
A household was defined as a person or a group of persons, who lived together in the same
house or compound and shared the same house-keeping arrangements. In general, a
household consisted of a man, his wife, children and some other relatives or a house help who
may be living with them. However, it is important to remember that members of a household
are not necessarily related (by blood or marriage) because non-relatives (e.g. house helps)
may form part of a household.
Head of Household
The household head was defined as a male or female member of the household recognised as
such by the other household members. The head of household is generally the person who has
economic and social responsibility for the household. All relationships are defined with
reference to the head.
Household and Non-household population
Household population comprised of all persons who spent the census night in a household
setting. All persons who did not spend the census night in a household setting (except
otherwise stated) were classified as non-household population. Persons who spent census
night in any of the under listed institutions and locations were classified as non-household
population:
(a) Educational Institutions
(b) Children's and Old People’s Homes
(c) Hospitals and Healing Centres
(d) Hotels
(e) Prisons
(f) Service Barracks
(g) Soldiers on field exercise
(h) Floating Population: The following are examples of persons in this category:

11
i. All persons who slept in lorry parks, markets, in front of stores and offices, public
bathrooms, petrol filling stations, railway stations, verandas, pavements, and all
such places which are not houses or compounds.
ii. Hunting and fishing camps.
iii. Beggars and vagrants (mentally sick or otherwise).
Age
The age of every person was recorded in completed years disregarding fractions of days and
months. For those persons who did not know their birthdays, the enumerator estimated their
ages using a list of district, regional and national historical events.
Nationality
Nationality is defined as the country to which a person belongs. A distinction is made
between Ghanaians and other nationals. Ghanaian nationals are grouped into Ghanaian by
birth, Ghanaian with dual nationality and Ghanaian by naturalization. Other nationals are
grouped into ECOWAS nationals, Africans other than ECOWAS nationals, and non-
Africans.
Ethnicity
Ethnicity refers to the ethnic group that a person belonged to. This information is collected
only from Ghanaians by birth and Ghanaians with dual nationality. The classification of
ethnic groups in Ghana is that officially provided by the Bureau of Ghana Languages and
which has been in use since the 1960 census.
Birthplace
The birthplace of a person refers to the locality of usual residence of the mother at the time of
birth. If after delivery a mother stayed outside her locality of usual residence for six months
or more or had the intention of staying in the new place for six or more months, then the
actual town/village of physical birth becomes the birthplace of the child.
Duration of Residence
Duration of residence refers to the number of years a person has lived in a particular place.
This question is only asked of persons not born in the place where enumeration took place.
Breaks in duration of residence lasting less than 12 months are disregarded. The duration of
residence of persons who made multiple movements of one (1) year or more is assumed to be
the number of years lived in the locality (town or village) since the last movement.
Religion
Religion refers to the individual’s religious affiliation as reported by the respondent,
irrespective of the religion of the household head or the head’s spouse or the name of the
person. No attempt was made to find out if respondents actually practiced the faith they
professed.
12
Marital Status
Marital status refers to the respondent’s marital status as at Census Night. The question on
marital status was asked only of persons 12 years and older. The selection of the age limit of
12 years was based on the average age at menarche and also on the practice in some parts of
the country where girls as young as 12 years old could be given in marriage.
Literacy
The question on literacy referred to the respondent's ability to read and write in any language.
A person was considered literate if he/she could read and write a simple statement with
understanding. The question on literacy was asked only of persons 11 years and older.
Education
School Attendance
Data was collected on school attendance for all persons three (3) years and older. School
attendance refers to whether a person has ever attended, was currently attending or has never
attended school. In the census, school meant an educational institution where a person
received at least four hours of formal education.
Although the lower age limit of formal education is six years for primary one, eligibility for
the school attendance question was lowered to three years because pre-school education has
become an important phenomenon in the country.
Level of Education
Level of education refers to the highest level of formal school that a person ever attended or
was attending. This information was obtained for persons 3 years and older.
Activity Status
Activity status refers to economic or non-economic activity of respondents during the 7 days
preceding census night. Information on type of activity was collected on persons 5 years and
older. A person was regarded as economically active if he/she:
a. Worked for pay or profit or family gain for at least 1 hour within the 7 days preceding
Census Night. This included persons who were in paid employment or self-
employment or contributing family workers.
b. Did not work, but had jobs to return to.
c. Were unemployed.
The economically not active were persons who did not work and were not seeking for work.
They were classified by reasons for not being economically active. Economically not active
persons included homemakers, students, retired persons, the disabled and persons who were
unable to work due to their age or ill-health.
Occupation
This referred to the type of work the person was engaged in at the establishment where he/she
worked. This was asked only of persons 5 years and older who worked 7 days before the
census night, and those who did not work but had a job to return to as well as those
unemployed who had worked before. All persons who worked during the 7 days before the
census night were classified by the kind of work they were engaged in. The emphasis was on

13
the work the person did during the reference period and not what he/she was trained to do.
For those who did not work but had a job to return to, their occupation was the job they
would go back to after the period of absence. Also, for persons who had worked before and
were seeking for work and available for work, their occupation was on the last work they did
before becoming unemployed. If a person was engaged in more than one occupation, only the
main one was considered.
Industry
Industry referred to the type of product produced or service rendered at the respondent’s work
place. Information was collected only on the main product produced or service rendered in
the establishment during the reference period.
Employment Status
Employment status refers to the status of a person in the establishment where he/she currently
works or previously worked. Eight employment status categories were provided: employee,
self-employed without employees, self-employed with employees, casual worker,
contributing family worker, apprentice, domestic employee (house help). Persons who could
not be classified under any of the above categories were classified as “other”.
Employment Sector
This refers to the sector in which a person worked. The employment sectors covered in the
census were public, private formal, private informal, semi-public/parastatal, NGOs and
international organizations.
Disability
Persons with disability were defined as those who were unable to or were restricted in the
performance of specific tasks/activities due to loss of function of some part of the body as a
result of impairment or malformation. Information was collected on persons with visual/sight
impairment, hearing impairment, mental retardation, emotional or behavioural disorders and
other physical challenges.
Information Communication Technology (ICT)
ICT questions were asked for both individuals and households. Persons having mobile
phones refer to respondents 12 years and older who owned mobile phones (irrespective of the
number of mobile phones owned by each person). Persons using internet facility refers to
those who had access to internet facility at home, internet cafe, on mobile phone or other
mobile device. Internet access is assumed to be not only via computer, but also by mobile
phones, PDA, game machine and digital television.
Households having Personal Computers/Laptops refer to households who own
desktops/laptop computers. The fixed telephone line refers to a telephone line connecting a
customer’s terminal equipment (e.g. telephone set, facsimile machine) to the public switch
telephone network.
Fertility
Two types of fertility data were collected: lifetime fertility and current fertility. Lifetime
fertility refers to the total number of live births that females 12 years and older had ever had
during their life time. Current fertility refers to the number of live births that females 12-54
years old had in the 12 months preceding the Census Night.

14
Mortality
Mortality refers to all deaths that occurred in the household during the 12 months preceding
the Census Night. The report presents information on deaths due to accidents, violence,
homicide and suicide. In addition, data were collected on pregnancy-related deaths of
females 12-54 years.
Agriculture
The census sought information on household members who are engaged in agricultural
activities, including the cultivation of crops or tree planting, rearing of livestock or breeding
of fish for sale or family consumption. Information was also collected on their farms, types of
crops and number and type of livestock.
Housing Conditions and Facilities
The UN recommended definition of a house as “a structurally separate and independent place
of abode such that a person or group of persons can isolate themselves from the hazards of
climate such as storms and the sun’’ was adopted. The definition, therefore, covered any type
of shelter used as living quarters, such as separate houses, semi-detached houses,
flats/apartments, compound houses, huts, tents, kiosks and containers.
Living quarters or dwelling units refer to a specific area or space occupied by a particular
household and therefore need not necessarily be the same as the house of which the dwelling
unit may be a part.
Information collected on housing conditions included the type of dwelling unit, main
construction materials for walls, floor and roof, holding/tenure arrangement, ownership type,
type of lighting, source of water supply and toilet facilities. Data was also collected on
method of disposal of solid and liquid waste.
1.7 Organization of the Report
The report consists of nine chapters. Chapter one provides basic information about the
district. It gives a brief background of the district, describing its physical features, political
and administrative structure, social and cultural structure, economy and the methodology and
concepts used in the report. Chapter two discusses the population size, composition and age
structure. It further discusses the migratory pattern in the district as well as fertility and
mortality.
In chapter three, the focus is on household size, composition and headship as well as the
marital characteristics and nationality of the inhabitants of the district. The chapter also
discusses the religious affiliations and the educational statuses of the members of the district.
Chapter four focuses on economic characteristics such as economic activity status,
occupation, industries and the employment status and sectors that the people are employed.

15
Information Communication Technology (ICT) is discussed in chapter five. It analyses
mobile phone ownership, internet use and ownership of desktop/laptop computers while
chapter six is devoted to Persons living with disabilities (PWDs) and their socio-demographic
characteristics. Chapter seven concentrates on the agricultural activities of the households,
describing the types of farming activities, livestock rearing and numbers of livestock reared.
In chapter eight, housing conditions such as housing stock, type of dwelling and construction
materials, room occupancy, holding and tenancy, lighting and cooking facilities, bathing and
toilet facilities, waste disposal and source of water for drinking or for other domestic use in
the district are discussed and analyzed in detail. The final chapter, Chapter nine presents the
summary of findings and conclusions. It also discusses the policy implications of the findings
for the district.

16
CHAPTER TWO
DEMOGRRAPHIC CHARACTERISTICS
2.1 Introduction
The characteristics of a population are crucial determinants in planning and formulation of
policies to facilitate development. The dynamics of fertility, mortality and migration are
critical in understanding the population size, composition and age-sex structures of a
population in any district. The objective of this chapter is to analyze the size, composition
and age-sex structure of the population in the Jaman North district.
2.2 Population Size and Distribution
Table 2.1 shows Population size and distribution by sex and type of locality of the Jaman
North district. The population of the district is 83,059 and it is composed of 48.1 percent
males and 51.9 percent females. More than 50 percent of the population (52.5%) lives in the
urban areas while 47.5 percent live in the rural areas.
2.2.1 Sex Ratio
The sex ratio of the district is 92.4 which imply that, there are 92.4 males per 100 females as
shown in Table 2.1. There are more males in the age group 0-24 years than females. At age
0-4 years, the sex ratios range between 102.8 males per 100 females and 101.0 males per 100
females. In the age group 65 years and older, the sex ratio is 63.2 which means that, there are
63.2 males per 100 females in this age group.
2.2.2 Age Dependency Ratio
The dependency ratio is one of the key indicators of socio-economic development. It is the
ratio of dependent population (those under 15 years and 65 years and older) to those in the
economically active group (15 to 64 years) in the population. The age-dependency ratio is
often used as an indicator to measure the economic burden the productive population must
carry1.
Dependency ratio relates to population in dependent ages (persons under 15 years and 65
years and older) and those in the productive ages (15-64) years.
The dependency ratio for the district is 83.6 per 100 persons in the economically active age
group (15-64 years) in the population. This means that there are approximately 84 persons in
the dependent ages for every 100 people in the working age group. The age dependency ratio
for the urban center is lower (76.2) than the rural area (92.5).
1 Arthur Haupt and Thomas T. Kane, PRB. Population Handbook , 2004

17
Table 2.1: Population by Age, sex and type of locality
Age Group
Sex Type of locality
Both
Sexes Percent Male Female
Sex
ratio
Urban Percent Rural Percent
All Ages 83,059 100.0 39,889 43,170 92.4
43,596 52.5 39,463 47.5
0 - 4 10,388 12.5 5,265 5,123 102.8
5,140
5,248
9 - 9 11,332 13.6 5,789 5,543 104.4
5,663
5,669
14 - 10 11,388 13.7 5,732 5,656 101.3
5,883
5,505
15 - 19 10,367 12.5 5,274 5,093 103.6
5,722
4,645
20 - 24 8,256 9.9 4,149 4,107 101
4,816
3,440
25 - 29 6,251 7.5 2,890 3,361 86
3,662
2,589
30 - 34 4,653 5.6 2,074 2,579 80.4
2,555
2,098
35 - 39 3,824 4.6 1,736 2,088 83.1
2,061
1,763
40 - 44 3,260 3.9 1,391 1,869 74.4
1,685
1,575
45 - 49 2,748 3.3 1,205 1,543 78.1
1,419
1,329
50 - 54 2,621 3.2 1,113 1,508 73.8
1,294
1,327
55 - 59 1,663 2 769 894 86
790
873
60 - 64 1,606 1.9 682 924 73.8
742
864
65 - 69 1,001 1.2 462 539 85.7
448
553
70 - 74 1,424 1.7 554 870 63.7
651
773
75 - 79 918 1.1 322 596 54
460
458
80 - 84 709 0.9 255 454 56.2
323
386
85+ 650 0.8 227 423 53.7
282
368
All Ages 83,059 100 39,889 43,170 92.4
43,596
39,463
0-14 33,108 39.9 16,786 16,322 102.8
16,686
16,422
15-64 45,249 54.5 21,283 23,966 88.8
24,746
20,503
65+ 4,702 5.7 1,820 2,882 63.2
2,164
2,538
Age-
dependency
ratio
83.6 87.4 80.1 76.2 92.5
Source: Ghana Statistical Service, 2010 Population and Housing census
2.3 Age-Sex Structure
An important tool for analyzing age and sex composition of a population is the age-sex
pyramid. Population pyramid is a graphical representation of the population by age and sex.
Figure 2.1 shows the population pyramid of Jaman North District. The shape closely mirrors
that of the national pyramid, and typical of developing countries. It has a broad base
gradually tapering off at the older ages. This is an indication of a youthful, growing
population. With increasing age, the age–sex structure looks slightly thinner r for the males
than for the females. For ages 0-14 and 20-24 years, there are more males than females

18
Figure 2.1: Population Pyramid
Source: Ghana Statistical Service, 2010 Population and Housing Census
2.4 Fertility, Mortality and Migration
2.4.1 Introduction
Fertility, mortality and migration are the three components of population change that
determine the size, age-sex composition and distribution of the population at a particular
point in time. Data on these three components are critical for planning the overall socio-
economic development in the district.
2.4.2 Fertility
Fertility refers to the number of live births a women can have. Two types of fertility data
were collected in the census; lifetime fertility and current fertility. Lifetime fertility refers to
the total number of live births that females 12 years and older had ever had during their life
time. Current fertility on the other hand refers to refers to the number of live births that
females 12-54 years old had in the 12 months preceding the Census Night.
The most commonly used measures of current fertility are the total fertility rate (TFR) and its
components age-specific fertility rate (ASFR). The TFR is defined as the number of children
a woman would have by the end of her childbearing years if she were to experience the
currently observed age-specific fertility rates.
Table 2.2 shows Total Fertility Rate (TFR), General Fertility Rate (GFR) and Crude Birth
Rate (CBR) by district. The data shows that there are 20,640 females in the reproductive age
6,000 4,000 2,000 0 2,000 4,000 6,000
0-4
5-9
10-14
15-19
20-24
25-29
30-34
35-39
40-44
45-49
50-54
55-59
60-64
65-69
70-74
75-79
80-84
85+
Population
Age
Female Male

19
12-54 years in Jaman North district. The number of birth in the last 12 months preceding
census night to women in their reproductive age is 1,747. The total fertility rate recorded in
the district is lower (2.9) than that of the region (3.6). This means that a woman living in
Jaman North district would have 2.9 children by the end of her reproductive period if the
current age specific fertility rates continue to prevail. With respect to Crude Birth Rate
(CBR), Jaman North recorded 21.0 per 1000.
Table 2.2: Reported total fertility rate, general fertility rate and crude birth rate
by district
District Population
Number of
women 15-
49 years
Number of
births in
last 12
months
Total
Fertility
Rate
*General
Fertility
Rate
**Crude
Birth
Rate
All Districts 2,310,983 572,813 60,685 3.58 105.9 26.3
Asunafo South 95,580 22,115 2,706 4.01 122.4 28.3
Asunafo North District 124,685 30,007 3,452 3.88 115.0 27.7
Asutifi 105,843 25,338 2,966 3.98 117.1 28.0
Dormaa District 159,789 40,619 4,303 3.61 105.9 26.9
Dormaa East 50,871 12,773 1,424 3.71 111.5 28.0
Tano South 78,129 18,766 2,257 3.99 120.3 28.9
Tano North 79,973 19,493 2,063 3.57 105.8 25.8
Sunyani District 123,224 36,146 2,644 2.61 73.1 21.5
Sunyani West 85,272 22,452 2,150 3.16 95.8 25.2
Berekum District 129,628 36,119 3,001 2.84 83.1 23.2
Jaman South 92,649 23,759 2,314 3.35 97.4 25.0
Jaman North 83,059 20,640 1,747 2.99 84.6 21.0
Tain 108,386 25,094 2,613 3.53 104.1 24.1
Wenchi District 89,739 22,028 2,188 3.36 99.3 24.4
Techiman District 206,856 55,139 5,698 3.47 103.3 27.5
Nkoranza South 100,929 24,772 3,000 4.00 121.1 29.7
Nkoranza North 65,895 14,779 1,915 4.41 129.6 29.1
Atebubu Amantin 105,938 24,760 2,940 4.01 118.7 27.8
Sene 118,810 26,820 3,304 4.18 123.2 27.8
Pru 129,248 30,261 2,981 3.43 98.5 23.1
Kintampo South 81,000 17,893 2,367 4.50 132.3 29.2
Kintampo North 95,480 23,040 2,652 3.89 115.1 27.8 Source: Ghana Statistical Service, 2010 Population and Housing Census
Note:* Number of live birth per 1,000 women aged 15-49 years
**Number of live birth per 1,000 population

20
General Fertility Rate
The general fertility rate (also called the fertility rate) is the number of live births per 1,000
women aged 15 - 49 years in a given year. The general fertility rate is a somewhat more
refined measure than the crude birth rate because it relates births to the age-sex group at risk
of giving birth (usually defined as women aged 15 - 49). The General fertility rate (GFR) for
the district is 84.6. This means that there 84.6 births per 1,000 women aged 15-49 years in
2010.
Children Ever Born (CEB)
The number of “children ever born” at various ages of a woman provides one measure of
fertility. Table 2.3 indicates women aged 12 years and older by age, the children ever born
and children surviving. The data revealed that, there are a total of 30,134 females 12 years
and older. It also shows that a total of 88,265 children were ever born in the district
comprising 44,468 males and 43,797 females. It is further observed that 73,145 children
comprising 36,490 males (82.1%) and 36,655 females (83.7%) out of the children ever born
survived. Age group 12-14 years recorded the least number of children ever born (12) and the
number of children surviving (8).
Table 2.3: Female population 12 years and older by age, children ever born,
children surviving and sex of child
Age
Number
of
Female
Children Ever Born Children Surviving
Both
Sexes Male Female
Both Sexes Male Female
Number Percent Number Percent Number Percent
All
Ages 161,410 88,265 44,468 43,797 73,145 82.9 36,490 82.1 36,655 83.7
12-14 20 12 6 6
8 66.7
4 66.7
4 66.7
15-19 908 478 249 229
430 90
220 88.4
210 91.7
20-24 5,011 2,664 1,411 1,253
2,347 88.1
1,192 84.5
1,155 92.2
25-29 10,216 5,355 2,697 2,658
4,861 90.8
2,403 89.1
2,458 92.5
30-34 14,418 7,568 3,840 3,728
6,850 90.5
3,449 89.8
3,401 91.2
35-39 16,613 8,745 4,458 4,287
7,868 90
3,961 88.9
3,907 91.1
40-44 19,161 10,216 5,219 4,997
8,945 87.6
4,541 87
4,404 88.1
45-49 18,204 9,737 4,842 4,895
8,467 87
4,168 86.1
4,299 87.8
50-54 18,731 10,235 5,247 4,988
8,496 83
4,318 82.3
4,178 83.8
55-59 11,529 6,353 3,166 3,187
5,176 81.5
2,567 81.1
2,609 81.9
60+ 46,599 26,902 13,333 13,569 19,697 73.2 9,667 72.5 10,030 73.9
Source: Ghana Statistical Service, 2010 Population and Housing Census
2.4.3 Mortality
Mortality refers to deaths that occur within a population at a particular time period. Data on
mortality provide an indication of the health status of the population as well as a measure of
the living conditions of the people. It also provides information on the potential growth of the
population in future. Table 2.4 shows total population, deaths in households and Crude Death
Rate (CDR) by district. Crude death rate is the number of deaths per 1,000 population in a
given year. The table shows that 627 deaths occurred in households 12 months preceding the
census night. The Crude Death Rate (CDR) is 7.6 per total 1000 population.

21
Table 2.4: Total population, deaths in households and
crude death rate by district
Districts Total
population
Deaths in
Households
Crude death
rate (per
1000)
All Districts 2,310,983 14,189 6.14
Asunafo South 95,580 472 4.94
Asunafo North 124,685 626 5.02
Asutifi 105,843 685 6.47
Dormaa District 159,789 1,057 6.61
Dormaa East 50,871 399 7.84
Tano South 78,129 542 6.94
Tano North 79,973 475 5.94
Sunyani District 123,224 455 3.69
Sunyani West 85,272 462 5.42
Berekum 129,628 858 6.62
Jaman South 92,649 514 5.55
Jaman North 83,059 627 7.55
Tain 108,386 757 6.98
Wenchi 89,739 704 7.84
Techiman 206,856 1,281 6.19
Nkoranza South 100,929 703 6.97
Nkoranza North 65,895 637 9.67
Atebubu Amantin 105,938 625 5.9
Sene 118,810 615 5.18
Pru 129,248 351 2.72
Kintampo South 81,000 671 8.28
Kintampo North 95,480 673 7.05
Source: Ghana Statistical Service, 2010 Population and Housing Census
2.4.4 Cause of Death by District
Table 2.5 presents the causes of death by district in Brong Ahafo region. There were 14,189
deaths 12 months before the census night in the region. The total deaths reported in the
district were 627. Deaths that occurred as a result of accident/violence/homicide/suicide in
the district constitute 6.2 percent which is lower than the regional rate of 8.7 percent. Deaths
that occurred due to other causes represent 93.8 percent of the total deaths in the district 12
months before the census.

22
Table 2.5: Cause of death by district
District
Total
deaths
Death due to
Accident/violen
ce/homicide/suic
ide
All other
causes
Brong Ahafo 14,189 8.7 91.3
Asunafo South 472 8.3 91.7
Asunafo North 626 10.4 89.6
Asutifi 685 7.6 92.4
Dormaa District 1,057 9.2 90.8
Dormaa East 399 8.8 91.2
Tano South 542 8.7 91.3
Tano North 475 6.9 93.1
Sunyani District 455 7.9 92.1
Sunyani West 462 15.2 84.8
Berekum 858 9.2 90.8
Jaman South 514 10.7 89.3
Jaman North 627 6.2 93.8
Tain 757 5.5 94.5
Wenchi 704 7.4 92.6
Techiman 1,281 10.8 89.2
Nkoranza South 703 11.5 88.5
Nkoranza North 637 4.7 95.3
Atebubu Amantin 625 9.9 90.1
Sene 615 9.1 90.9
Pru 351 6.3 93.7
Kintampo South 671 7.5 92.5
Kintampo North 673 8.2 91.8 Source: Ghana Statistical Service, 2010 Population and Housing Census
2.4.5 Age specific Death Rates by Sex
Figure 2.2 shows reported age specific death rates by sex in Jaman North district. The graph
shows that generally, death rate for males is higher than for females in the district. In age
group 0-4 (under five), the age specific death rate is high for males and females with that of
the males higher than the females. Age specific death for age group 5-9 reduced sharply for
both sexes. For age 10-14 the age specific death rate was at its lowest for both the male and
female sexes. From age 15-19 the age specific death rate for female rose gradually to a peak
at age 30-34 years with that of the female death rate higher than the males. Female deaths in
this age group may probably be attributed to maternal deaths. From age 50 years and older,
male age specific deaths continue to be higher than female deaths.

23
Figure 2.2: Reported age specific death rates by sex
Source: Ghana Statistical Service, 2010 Population and Housing Census
2.4.6 Migration
Migration is defined as the geographic movement of people across a specified boundary for
the purpose of establishing a new permanent or semi-permanent residence. In the 2010 PHC,
information was collected on the birth place, duration residence and place of enumeration of
the population in order to know those who are migrants.
Table 2.6 presents migrants by birthplace and duration of residence. The data shows that a
total of 10,582 of the district population are migrants. Out of the migrants population 6,228
persons were born elsewhere in the region whiles 1,398 were born outside the region. A
substantial number of the migrants (825) were also born outside the shores of Ghana.
Among the migrants who were born outside the Brong Ahafo region, the highest number
comes from Western Region (1398), followed by those from Upper West Region (981) and
Ashanti Region (651). On the average, the highest proportions (29.1%) of the migrants have
been in the district for a period between 1 to 4 years and 21.0 percent have stayed for less
than a year whiles 12.3 percent have stayed for 20 years and over.
0.000
0.010
0.020
0.030
0.040
0.050
0.060
Under5
5-9 10-14 15-19 20-24 25-29 30-34 35-39 40-44 45-49 50-54 55-59 60-64 65-69 70+
De
ath
s
Age
0.003 Male 0.003 Female

24
Table 2.6: Birthplace by duration of residence of migrants
Duration of residence (%)
Birthplace Number
Less
than 1
year 1-4 years
5-9
years
10-19
years
20+
years
Total 10, 582 21 29.1 16.3 14 12.3
Born elsewhere in the region 6, 228 22.2 29.6 18 14 16.2
Born elsewhere in another region:
Western 1,398 25.8 33.5 16.8 18.2 5.7
Central 167 22.2 27.5 19.2 18 13.2
Greater Accra 144 21.5 29.2 22.2 17.4 9.7
Volta 197 21.8 41.6 11.7 10.7 14.2
Eastern 174 17.2 39.7 14.9 13.2 14.9
Ashanti 651 28.1 318 13.5 14.3 12.3
Brong Ahafo 0 - - - - -
Northern 379 24.8 34.3 17.2 15.3 8.4
Upper East 263 28.1 30.4 15.6 17.5 8.4
Upper west 981 16.5 36.5 19.6 17.6 9.8
Outside Ghana 825 21.9 31.5 23.8 10.3 12.5
Source: Ghana Statistical Service, 2010 Population and Housing census
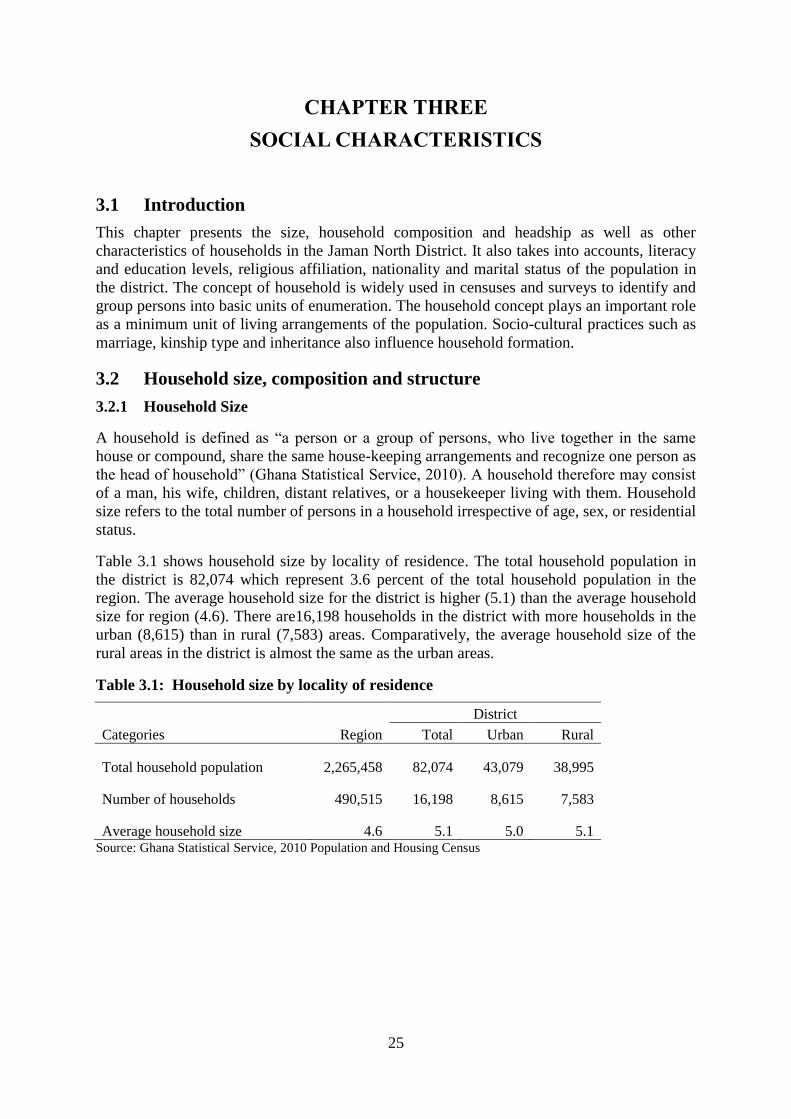
25
CHAPTER THREE
SOCIAL CHARACTERISTICS
3.1 Introduction
This chapter presents the size, household composition and headship as well as other
characteristics of households in the Jaman North District. It also takes into accounts, literacy
and education levels, religious affiliation, nationality and marital status of the population in
the district. The concept of household is widely used in censuses and surveys to identify and
group persons into basic units of enumeration. The household concept plays an important role
as a minimum unit of living arrangements of the population. Socio-cultural practices such as
marriage, kinship type and inheritance also influence household formation.
3.2 Household size, composition and structure
3.2.1 Household Size
A household is defined as “a person or a group of persons, who live together in the same
house or compound, share the same house-keeping arrangements and recognize one person as
the head of household” (Ghana Statistical Service, 2010). A household therefore may consist
of a man, his wife, children, distant relatives, or a housekeeper living with them. Household
size refers to the total number of persons in a household irrespective of age, sex, or residential
status.
Table 3.1 shows household size by locality of residence. The total household population in
the district is 82,074 which represent 3.6 percent of the total household population in the
region. The average household size for the district is higher (5.1) than the average household
size for region (4.6). There are16,198 households in the district with more households in the
urban (8,615) than in rural (7,583) areas. Comparatively, the average household size of the
rural areas in the district is almost the same as the urban areas.
Table 3.1: Household size by locality of residence
Categories
District
Region Total Urban Rural
Total household population 2,265,458 82,074 43,079 38,995
Number of households 490,515 16,198 8,615 7,583
Average household size 4.6 5.1 5.0 5.1 Source: Ghana Statistical Service, 2010 Population and Housing Census

26
3.2.2 Household Composition
Household population by composition and sex is presented in Table 3.2. The data shows that
the largest proportion (44.7%) of the household population is children of the head of
households followed by grandchildren of the head of household (13.8%). Head of
households constitute 19.7 percent of household population. Only 7.7 percent of the District’s
populations are the spouse of the head of the households. Only 1.4 percent of the household
population is not related to the head of household.
The Table further shows that heads who are males constitute 23.4 percent of household
population while female heads of households form 16.4 percent of household population. The
proportion of spouses varies by sex. Male spouses constitute a very small proportion (0.6%)
in relation to female spouses (14.3%).
Table 3.2: Household population by composition and sex
Household composition
Total Male Female
Number Percent Number Percent Number Percent
Head 16,198 19.7
9,200 23.4
6,998 16.4
Spouse (wife/husband) 6,323 7.7
223 0.6
6,100 14.3
Child (son/daughter) 36,683 44.7
18,789 47.7
17,894 41.9
Parent/Parent in-law 588 0.7
50 0.1
538 1.3
Son/Daughter in-law 204 0.3
62 0.2
142 0.3
Grandchild 11,308 13.8
5,630 14.3
5,678 13.3
Brother/Sister 3,250 4
1,753 4.5
1,497 3.5
Step child 749 0.9
402 1
347 0.8
Adopted/Foster child 509 0.6
281 0.7
228 0.5
Other relative 5,137 6.3
2,365 6
2,772 6.5
Non-relative 1,125 1.4 636 1.6 489 1.2
Source: Ghana Statistical Service, 2010 Population and Housing Census
3.2.2 Household Structure
Household population by structure and sex is shown in Table 3.3. The table shows that
extended family households (head, spouse(s), children and head’s relative) constitute the
largest (24.2%) followed by single parent extended (23.0%) and nuclear family (21.3%).
Head only forms only 3.0 percent of the households whiles head and spouse only constitute
less than one percent. The table further shows that, among the sexes, extended household
structure continues to be higher among the male and female households with 25.7 percent and
22.8 percent respectively. Households with head only are higher (4.2%) for the males than
their female counterparts (1.8%). On the other hand, single parent extended is high among
females (25.9%) than males (19.8%).
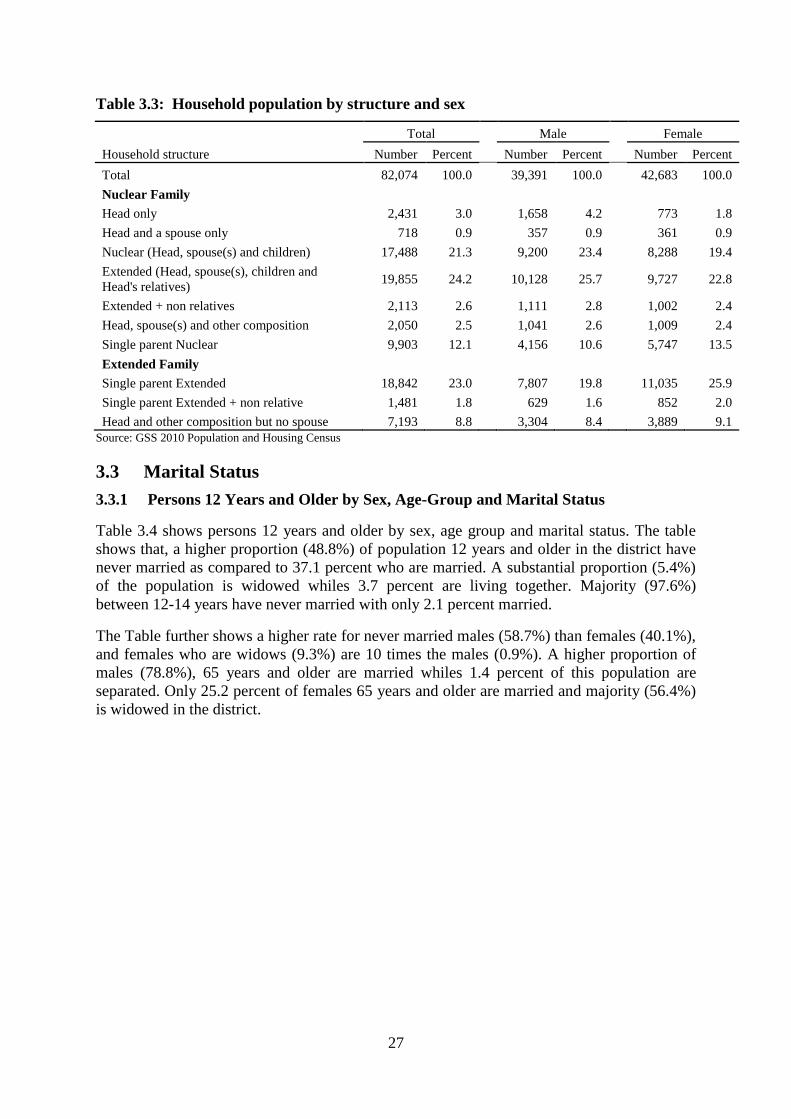
27
Table 3.3: Household population by structure and sex
Household structure
Total Male Female
Number Percent Number Percent Number Percent
Total 82,074 100.0
39,391 100.0
42,683 100.0
Nuclear Family
Head only 2,431 3.0
1,658 4.2
773 1.8
Head and a spouse only 718 0.9
357 0.9
361 0.9
Nuclear (Head, spouse(s) and children) 17,488 21.3
9,200 23.4
8,288 19.4
Extended (Head, spouse(s), children and
Head's relatives) 19,855 24.2
10,128 25.7
9,727 22.8
Extended + non relatives 2,113 2.6
1,111 2.8
1,002 2.4
Head, spouse(s) and other composition 2,050 2.5
1,041 2.6
1,009 2.4
Single parent Nuclear 9,903 12.1
4,156 10.6
5,747 13.5
Extended Family
Single parent Extended 18,842 23.0
7,807 19.8
11,035 25.9
Single parent Extended + non relative 1,481 1.8
629 1.6
852 2.0
Head and other composition but no spouse 7,193 8.8 3,304 8.4 3,889 9.1
Source: GSS 2010 Population and Housing Census
3.3 Marital Status
3.3.1 Persons 12 Years and Older by Sex, Age-Group and Marital Status
Table 3.4 shows persons 12 years and older by sex, age group and marital status. The table
shows that, a higher proportion (48.8%) of population 12 years and older in the district have
never married as compared to 37.1 percent who are married. A substantial proportion (5.4%)
of the population is widowed whiles 3.7 percent are living together. Majority (97.6%)
between 12-14 years have never married with only 2.1 percent married.
The Table further shows a higher rate for never married males (58.7%) than females (40.1%),
and females who are widows (9.3%) are 10 times the males (0.9%). A higher proportion of
males (78.8%), 65 years and older are married whiles 1.4 percent of this population are
separated. Only 25.2 percent of females 65 years and older are married and majority (56.4%)
is widowed in the district.

28
Table 3.4: Persons 12 years and older by sex, age-group and marital status
Sex/Age-
group Number Total
Never
married
Informal/
Consensual
union/Living
together Married Separated Divorced Widowed
Total 56,573 100.0 48.8 3.7 37.1 1.0 4.0 5.4
12 - 14 6,622 100.0 97.6 0.3 2.1 0.0 0.0 0.0
15 - 19 10,367 100.0 93.9 1.8 3.7 0.3 0.2 0.1
20 - 24 8,256 100.0 76.0 6.0 16.1 0.6 1.1 0.2
25 - 29 6,251 100.0 48.0 8.3 38.9 1.2 3.0 0.6
30 - 34 4,653 100.0 22.5 8.0 61.7 1.8 4.5 1.4
35 - 39 3,824 100.0 10.6 5.5 74.8 1.9 5.5 1.7
40 - 44 3,260 100.0 6.6 3.4 76.7 1.7 7.5 4.1
45 - 49 2,748 100.0 4.1 2.8 77.8 1.8 7.8 5.8
50 - 54 2,621 100.0 2.5 1.4 73.8 1.3 10.1 10.8
55 - 59 1,663 100.0 2.0 1.3 70.7 1.4 11.2 13.4
60 - 64 1,606 100.0 2.4 0.9 65.9 1.8 10.0 19.1
65+ 4,702 100.0 4.5 0.8 45.9 1.3 10.5 37.0
Male
Total 26,439 100.0 58.7 2.9 34.9 0.7 2.1 0.9
12 - 14 3,336 100.0 97.6 0.2 2.2 0.0 0.0 0.0
15 - 19 5,274 100.0 97.3 0.5 2.1 0.0 0.1 0.0
20 - 24 4,149 100.0 90.8 2.4 6.3 0.2 0.2 0.0
25 - 29 2,890 100.0 66.5 6.9 24.6 0.7 1.2 0.1
30 - 34 2,074 100.0 34.4 8.8 52.8 1.4 2.1 0.5
35 - 39 1,736 100.0 16.4 5.5 72.8 1.2 3.5 0.7
40 - 44 1,391 100.0 11.4 4.2 76.7 1.9 4.5 1.3
45 - 49 1,205 100.0 6.6 3.4 83.0 1.3 5.0 0.7
50 - 54 1,113 100.0 3.9 2.1 85.2 1.0 5.9 2.0
55 - 59 769 100.0 3.0 1.4 84.1 1.4 6.9 3.1
60 - 64 682 100.0 3.5 0.7 89.0 1.0 4.1 1.6
65+ 1,820 100.0 6.0 0.8 78.8 1.4 6.8 6.3
Female
Total 30,134 100.0 40.1 4.5 39.0 1.3 5.8 9.3
12 - 14 3,286 100.0 97.6 0.4 2.0 0.0 0.0 0.0
15 - 19 5,093 100.0 90.4 3.2 5.4 0.5 0.3 0.2
20 - 24 4,107 100.0 61.0 9.6 26.0 1.0 2.0 0.4
25 - 29 3,361 100.0 32.0 9.6 51.1 1.7 4.6 1.0
30 - 34 2,579 100.0 12.9 7.3 68.9 2.2 6.4 2.2
35 - 39 2,088 100.0 5.9 5.5 76.4 2.5 7.1 2.5
40 - 44 1,869 100.0 3.0 2.8 76.8 1.6 9.7 6.2
45 - 49 1,543 100.0 2.1 2.3 73.8 2.1 10.0 9.7
50 - 54 1,508 100.0 1.5 1.0 65.4 1.6 13.3 17.3
55 - 59 894 100.0 1.2 1.1 59.1 1.5 14.9 22.3
60 - 64 924 100.0 1.5 1.0 48.8 2.4 14.4 31.9
65+ 2,882 100.0 3.6 0.8 25.2 1.2 12.9 56.4 Source: Ghana Statistical Service, 2010 Population and Housing Census

29
3.3.2 Marital status and level of education
Table 3.5 represents persons 12 years and older by sex, marital status and level of education.
The data shows that 65.2 percent of persons who have never married had basic education,
21.8 had secondary education and 7.7 had no education. Of persons who are married, 46.8
percent had no education while 40.2 percent had basic education with less than one percent
having obtained tertiary education. A high proportion of widowed (85.3%) in the District
have no formal education.
In the male and female category the data shows that, there are more non-educated married
females (54.5%) than their male counterparts (36.9%). The Table reveals that with the
exception of the basic level of education, there are more married males in all the educational
levels than females. There are however, more males (1.3%) who have never been married in
the tertiary level compared with females accounting for less than a percentage (0.4%).
Table 3.5: Persons 12 years and older by sex, marital status and level of education
Sex/Marital status Number
All
levels
No
Education Basic1
Secon-
dary2
Voc/
Tech/
Comm
Post
middle/
secondary
certificate/
diploma3 Tertiary
4
Both Sexes
Total 56,573 100.0 29.2 51.4 14.2 1.6 2.8 0.8
Never married 27,597 100.0 7.7 65.2 21.8 1.6 2.8 0.9
Informal/Consensual
union/Living together 2,099 100.0 19.8 57.2 15.9 3.1 3.3 0.6
Married 20,984 100.0 46.8 40.2 7.2 1.7 3.3 0.9
Separated 568 100.0 45.4 44.5 5.6 1.4 2.1 0.9
Divorced 2,284 100.0 58.4 34.7 4.1 1.0 1.7 0.2
Widowed 3,041 100.0 85.3 13.3 1.0 0.2 0.3 0.0
Male
Total 26,439 100.0 19.4 55.3 17.7 1.9 4.2 1.5
Never married 15,508 100.0 7.4 63.2 23.0 1.7 3.4 1.3
Informal/Consensual
union/Living together 758 100.0 13.7 52.0 20.4 5.7 6.7 1.5
Married 9,220 100.0 36.9 44.0 9.5 2.1 5.5 2.0
Separated 177 100.0 40.7 44.6 6.8 1.7 3.4 2.8
Divorced 547 100.0 45.5 41.9 8.6 1.3 2.0 0.7
Widowed 229 100.0 65.1 28.8 6.1 0.0 0.0 0.0
Female
Total 30,134 100.0 37.9 48.0 11.1 1.2 1.6 0.2
Never married 12,089 100.0 8.1 67.9 20.3 1.4 2.0 0.4
Informal/Consensual
union/Living together 1,341 100.0 23.2 60.2 13.3 1.7 1.4 0.1
Married 11,764 100.0 54.5 37.2 5.3 1.3 1.6 0.1
Separated 391 100.0 47.6 44.5 5.1 1.3 1.5 0.0
Divorced 1,737 100.0 62.5 32.4 2.6 0.9 1.6 0.0
Widowed 2,812 100.0 87.0 12.0 0.5 0.2 0.3 0.0 Source: Ghana Statistical Service, 2010 Population and Housing Census
1 Basic: Primary, Middle and JSS/JHS
2 Secondary: SSS/SHS and Secondary
3 Post Middle/Sec. Cert./Diploma: Teacher training/ College of education, Agric, Nursing, University Diploma, HND,
etc.
4 Tertiary: Bachelors Degree and Post Graduate or higher

30
3.3.3 Persons 12 Years and Older by Sex, Marital Status and Economic
Activity Status
Table 3.6 presents persons 12 years and older by sex, marital status and economic activity
status in the district. The 2010 PHC results indicate that, a higher proportion (37.1%) of
employed persons 12 years and older are married. In terms of sex, a relatively high
percentage of married females (54.7%) than males (52.3%) are employed. This is followed by
28.7 percent of the employed population who have never been married. It further reveals that
33.8 percent of the unemployed population 12 years and older are married women compared
with 23.2 percent for unemployed men. A further 16,906 of persons, representing 83.0
percent of persons 12 years and older who are economically not active in the district have
never been married.
The data again show that 8.4 percent of the widows in the District are not economically
active compared with 0.6 percent for widowers.
Table 3.6: Persons 12 years and older by sex, marital status and economic
activity status
Total Employed Unemployed
Economically not
active
Sex/Marital status Number Percent Number Percent Number Percent Number Percent
Both Sexes
Total 56,573 100.0
35,084 100.0
1,115 100.0
20,374 100.0
Never married 27,597 48.8
10,067 28.7
624 56.0
16,906 83.0
Informal/Consensual
union/Living together 2,099 3.7
1,682 4.8
102 9.2
315 1.6
Married 20,984 37.1
18,807 53.6
327 29.3
1,850 9.1
Separated 568 1.0
477 1.4
15 1.4
76 0.4
Divorced 2,284 4.0
1,973 5.6
29 2.6
282 1.4
Widowed 3,041 5.4
2,078 5.9
18 1.6
945 4.6
Male
Total 26,439 100.0
16,230 100.0
470 100.0
9,739 100.0
Never married 15,508 58.7
6,264 38.6
336 71.5
8,908 91.5
Informal/Consensual
union/Living together 758 2.9
684 4.2
12 2.6
62 0.6
Married 9,220 34.9
8,493 52.3
109 23.2
618 6.4
Separated 177 0.7
155 1.0
4 0.9
18 0.2
Divorced 547 2.1
466 2.9
5 1.1
76 0.8
Widowed 229 0.9
168 1.0
4 0.9
57 0.6
Female
Total 30,134 100.0
18,854 100.0
645 100.0
10,635 100.0
Never married 12,089 40.1
3,803 20.2
288 44.7
7,998 75.2
Informal/Consensual
union/Living together 1,341 4.5
998 5.3
90 14.0
253 2.4
Married 11,764 39.0
10,314 54.7
218 33.8
1,232 11.6
Separated 391 1.3
322 1.7
11 1.7
58 0.6
Divorced 1,737 5.8
1,507 8.0
24 3.7
206 1.9
Widowed 2,812 9.3 1,910 10.1 14 2.2 888 8.4
Source: Ghana Statistical Service, 2010 Population and Housing Census

31
3.4 Nationality
Nationality is defined as the country to which a person belongs. A distinction is made
between Ghanaians and other nationals. Ghanaian nationals are grouped into Ghanaian by
birth, Ghanaian with dual nationality and Ghanaian by naturalization. Other nationals are
grouped into ECOWAS nationals, Africans other than ECOWAS nationals, and non-
Africans.
The table shows that, 97.7 percent of the population is Ghanaian. Nationals from the
ECOWAS countries constitute 1.3 percent of the population and less than one percent (0.5%)
of the population is from Africa other than ECOWAS. This pattern is the same for the males
and females nationals in the district
Table 3.7: Population by nationality and sex
Nationality
Both sexes Male Female
Number Percent Number Percent Number Percent
Total 83,059 100.0
39,889 100.0
43,170 100.0
Ghanaian by birth 79,111 95.2
37,947 95.1
41,164 95.4
Dual Nationality 1,543 1.9
753 1.9
790 1.8
Ghanaian by naturalization 491 0.6
230 0.6
261 0.6
ECOWAS 1,091 1.3
584 1.5
507 1.2
Africa other than ECOWAS 437 0.5
196 0.5
241 0.6
Other 386 0.5 179 0.4 207 0.5 Source: Ghana Statistical Service, 2010 and 2000 Population and Housing Census
3.5 Religious Affiliation.
Table 3.8 discusses population by religious affiliation and sex in Jaman North. The table
shows that, majority (83.5%) professes to Christianity, followed by Islam (13.0%). The
proportion of the population who professes not to adhere to any religion is 2.2 percent with
traditionalist forming 1.2 percent. Within the Christian community, Catholics form the
highest (35.9%), followed by Protestant (26.5%) and Pentecostal (18.4%). The male and
female categories also follow similar trend.
Table 3.8: Population by religion and sex
Religion
Both sexes Male Female
Number Percent Number Percent Number Percent
Total 83,059 100.0
39,889 100.0
43,170 100.0
No Religion 1,789 2.2
1,140 2.9
649 1.5
Catholic 29,793 35.9
14,164 35.5
15,629 36.2
Protestant (Anglican Lutheran etc.) 21,972 26.5
10,401 26.1
11,571 26.8
Pentecostal/Charismatic 15,310 18.4
7,058 17.7
8,252 19.1
Other Christians 2,216 2.7
1,086 2.7
1,130 2.6
Islam 10,823 13.0
5,389 13.5
5,434 12.6
Traditionalist 984 1.2
566 1.4
418 1.0
Other (Specify) 172 0.2 85 0.2 87 0.2
Source: Ghana Statistical Service, 2010 and 2000 Population and Housing Census

32
3.6 Literacy and Education
Education involves the adoption of procedures to help individuals to formally gain
knowledge, skills and values for the advancement of societies. Education positively
influences human resource and economic development. Countries therefore place emphasis
on educational policies and strive for their implementation.
3.6.1 Literacy
Table 3.9 presents the distribution of population 11 years and older by sex and literacy level
for the Jaman North. About 19 percent of the male population is non-literate whiles about 37
percent of the female population in the district are also non-literate. The Table further shows
that, the proportion of the non-literate persons in the various age groups increase with
advancing age reaching a peak at age 40-44 after which there is no clear trend. In terms of
sex, the majority of the literate populations are males. The data reveals that literate males
constitute 81 percent whiles the literate females population is 63 percent.
Among the literate population for both sexes, literacy in English and Ghanaian language is
dominant in age groups (11-14 year and 20-24 year groups). Literacy in Ghanaian language
only is highest among the 11-14 and 25-29 year group with 6.3 percent and 6.8 percent
respectively. Literacy in French and English Language is low across all age groups and sex.
Table 3.9: Population 11 years and older by sex, age and literacy status
Age group
None
(not
literate) Literate Total
English
only
Ghanaian
language
only
English and
Ghanaian
language
English
and
French
English/French
and Ghanaian
language
Both Sexes
Total 16,585 42,039 100.0 24 6.4 68.4 0.5 0.6
11-14 192 8,481 100.0 34.9 6.3 58.2 0.2 0.2
15-19 606 9,761 100.0 23.9 3.7 71.5 0.4 0.6
20-24 1,017 7,239 100.0 21.1 3.7 74 0.5 0.7
25-29 1,187 5,064 100.0 22 6.8 70 0.7 0.5
30-34 1,363 3,290 100.0 22.4 8.9 67.3 0.8 0.6
35-39 1,470 2,354 100.0 20.4 9.9 67.8 0.8 1.1
40-44 1,698 1,562 100.0 17.5 10.1 70.1 1.2 1.2
45-49 1,520 1,228 100.0 15.9 11.2 71.2 0.4 1.3
50-54 1,552 1,069 100.0 15.2 11.8 71.4 0.7 0.9
55-59 950 713 100.0 13.7 9.8 73.8 0.3 2.4
60-64 1,121 485 100.0 13.4 14.6 70.3 - 1.6
65+ 3,909 793 100.0 17.4 13.5 68.5 0.1 0.5
Male 5,145 22,291 100.0 22.1 5 71.5 0.6 0.9
11-14 72 4,261 100.0 34.3 5.7 59.6 0.3 0.2
15-19 248 5,026 100.0 22.4 2.9 73.6 0.4 0.7
20-24 380 3,769 100.0 18.7 2.7 77.2 0.5 0.9
25-29 376 2,514 100.0 20 4.5 74.1 0.8 0.6
30-34 400 1,674 100.0 20.1 6.2 71.8 1 0.9
35-39 385 1,351 100.0 19.7 7 71.2 0.9 1.3
40-44 444 947 100.0 16.1 6.7 73.9 1.5 1.9
45-49 443 762 100.0 14.8 7.2 75.3 0.7 2
50-54 458 655 100.0 13.6 8.4 75.9 0.9 1.2
55-59 298 471 100.0 12.7 8.1 75.4 0.4 3.4
60-64 363 319 100.0 10.7 10.3 76.5 - 2.5
65+ 1,278 542 100.0 13.7 11.4 74 0.2 0.7

33
Table 3.9: Population 11 years and older by sex, age and literacy status (Cont’d)
Age group
None
(not
literate) Literate Total
English
only
Ghanaian
language
only
English and
Ghanaian
language
English
and
French
English/French
and Ghanaian
language
Female 11,440 19,748 100.0 26.2 8.1 65 0.4 0.4
11-14 120 4,220 100.0 35.6 7 56.9 0.2 0.3
15-19 358 4,735 100.0 25.4 4.5 69.3 0.4 0.5
20-24 637 3,470 100.0 23.7 4.9 70.5 0.4 0.5
25-29 811 2,550 100.0 24 9.1 66 0.5 0.4
30-34 963 1,616 100.0 24.9 11.6 62.6 0.5 0.4
35-39 1,085 1,003 100.0 21.4 13.8 63.3 0.6 0.9
40-44 1,254 615 100.0 19.7 15.4 64.2 0.7 -
45-49 1,077 466 100.0 17.6 17.8 64.4 - 0.2
50-54 1,094 414 100.0 17.6 17.1 64.3 0.5 0.5
55-59 652 242 100.0 15.7 13.2 70.7 - 0.4
60-64 758 166 100.0 18.7 22.9 58.4 - -
65+ 2,631 251 100.0 25.5 17.9 56.6 - -
Source: Ghana Statistical Service, 2010 Population and Housing Census
3.6.2 Education
The acquisition of knowledge and skills through education is essential for the development of
the requisite human resources needed for accelerated socio-economic development. This
section presents information on the current levels of educational attainment in the Jaman
North district.
School attendance
Figure 3.1 is a graphical representation of school attendance by sex of persons 3 years and
older in Jaman North district. Of the total number of persons 3 years and older (83,030) in the
district, 20.2 percent had never been to school, 46.1 percent are currently in school while 33.7
percent attended school in the past. The proportion of females who have never attended
school is higher (26.2%) than the male (13.2%) proportions who have never attended school.
For the population which is currently attending school, the male proportion (51.6%) is more
than the female (41.4%). About 35.2 percent of the male population has attended school in
the past while for females it was 32.3 percent.

34
Figure 3.1: School attendance by sex
Source: Ghana Statistical Service, 2010 Population and Housing Census
Current school attendance
Table 3.10 shows the level of education for persons 3 years and older in the Jaman North
District. Over 80 percent (84.5%) of the population currently attending school (37,113) are in
the basic schools (nursery kindergarten, primary and JHS). The Table further shows that 48.3
percent of females in the district are currently in primary school compared with 45.0 percent
for males. Only 0.6 percent of the population of both males and females are in the
commercial/technical/commercial schools. The data reveals that the highest level of school
attained by majority (73.1%) of the population is primary and JHS/Middle. The proportion of
females (64.8%) who have attended primary and JHS in the past is higher than that of their
male counterparts (45.4%). However, with respect to Middle school and all the other higher
levels of education, the proportion of males who completed these levels is higher than
females.
20.2
13.2
26.2
46.1
51.6
41.4
33.7 35.2
32.3
0
10
20
30
40
50
60
Total Male Female
Percent
Never
Now
Past

35
Table 3.10: Population 3 years and older by level of education, school attendance and sex
Currently attending Attended in the past
Both sexes Male Female
Both sexes Male Female
Level of education Number Percent Number Percent Number Percent Number Percent Number Percent Number Percent
Total 37,113 100.0
19,473 100.0
17,640 100.0
21,758 100.0
11,379 100.0
10,379 100.0
Nursery 3,097 8.3
1,532 7.9
1,565 8.9
- -
- -
- -
Kindergarten 4,251 11.5
2,175 11.2
2,076 11.8
- -
- -
- -
Primary 17,276 46.5
8,760 45
8,516 48.3
4,565 21
1,903 16.7
2,662 25.6
JSS/JHS 7,373 19.9
3,963 20.4
3,410 19.3
7,340 33.7
3,269 28.7
4,071 39.2
Middle - - - -
- -
4,011 18.4
2,554 22.4
1,457 14
SSS/SHS 4,248 11.4
2,457 12.6
1,791 10.2
3,125 14.4
1,734 15.2
1,391 13.4
Secondary - - - -
- - 646 3
484 4.3
162 1.6
Vocational/
Technical/
Commercial
221 0.6
140 0.7
81 0.5
666 3.1
374 3.3
292 2.8
Post
middle/secondary
certificate
137 0.4
81 0.4
56 0.3
436 2
281 2.5
155 1.5
Tertiary 510 1.4 365 1.9 145 0.8 969 4.5 780 6.9 189 1.8
Source: Ghana Statistical Service, 2010 Population and Housing Census

36
CHAPTER FOUR
ECONOMIC CHARACTERISTICS
4.1 Introduction
Population census and demographic sample surveys are important sources of information on
the population. In the 2010 population and housing census, questions on economic activity
was asked of all persons 15 years and older who engaged in any activity for pay (cash or
kind) or profit or gain for at least one hour during the seven days preceding census night. This
chapter discusses economic characteristics of the population by locality type, marital status
and level of education in the district.
4.2 Economic Activity Status
The total population aged 15 years and older is made up of both economically active and the
economically not active. The total of the employed and the unemployed constitutes the
economically active population 15 years and older. The economically not active persons
include those who did not work and were not seeking for work. It also included full time
students; persons retired from work, persons too old and too young to work, the disabled and
homemakers.
Table 4.1 presents the population distribution of persons 15 years and older by sex and
economic activity status. The total population of persons 15 years and older is 49,951. The
economically active population constitutes 70.3 percent and the economically not active form
29.7 percent of the total population 15 years and older. Of the economically not active
population 96.8 percent are employed and 3.2 percent are unemployed. On the other hand,
out of the economically not active population 14.6 percent were engaged in household
chores. A high proportion (67.0%) of the economically not active population is in full time
education.
There are variations in the male (69.8%) and female (70.7%) category of the economically
active population in the district. Majority of the economically active population of each of the
sexes are employed in the district. The data also shows that a higher percentage (3.4%) of
females than males (2.9%) is unemployed. The proportion that is seeking work for the first
time and available for work is dominant in the group. There is a slight variation between the
employed male and female population of the district.

37
Table 4.1: Population 15 years and older by activity status and sex
Total Male Female
Activity status Number Percent Number Percent Number Percent
Total
49,951 100.0
23,103 100.0
26,848 100.0
Economically active 35,117 70.3
16,123 69.8
18,994 70.7
Employed 34,004 96.8
15,655 97.1
18,349 96.6
Worked 32,585 95.8
15,103 96.5
17,482 95.3
Did not work but had job to go
back to 1,350 4.0
518 3.3
832 4.5
Did voluntary work without pay 69 0.2
34 0.2
35 0.2
Unemployed 1,113 3.2
468 2.9
645 3.4
Worked before, seeking work
and available 341 30.6
134 28.6
207 32.1
Seeking work for the first time
and available 772 69.4
334 71.4
438 67.9
Economically not active 14,834 29.7
6,980 30.2
7,854 29.3
Did home duties (household
chore) 2,170 14.6
553 7.9
1,617 20.6
Full time education 9,936 67.0
5,475 78.4
4,461 56.8
Pensioner/Retired 119 0.8
71 1.0
48 0.6
Disabled/Sick 778 5.2
324 4.6
454 5.8
Too old/young 1,190 8.0
265 3.8
925 11.8
Other 641 4.3 292 4.2 349 4.4
Source: Ghana Statistical Service, 2010 Population and Housing Census.
Table 4.2 presents population 15 years and older by sex, age and economic activity status. In
the district, 68.1 percent of population 15 years and older are employed, 29.7 percent are
economically not active and 2.2 percent are unemployed. More than three quarters of the
employed population from age 25 to 64 years are employed and less than 20 percent in these
age groups are economically not active. Age group 15-19 has the least proportion (26.0%) of
persons who are employed and a large proportion (72.8%) of persons who are economically
not active. The same pattern can be observed of persons in age 20-24 where the employed
constitute 53.3 percent of the economically active population and the economically not active
represent almost 42 percent. The high proportion of persons in the economically not active
groups may be due to the presence of persons in full time education. The variations in the
male and female sexes follow the same pattern. The proportions of persons who are
employed in age group 15-19 and 20-24 are high in the female category than for males. Also
in the economically not active population, the proportions of males in the same age groups
are more than their female counterparts.

38
Table 4.2: Population 15 years and older by sex, age and activity status
Age group
All Status Employed Unemployed
Economically not
active
Number Percent Number Percent Number Percent Number Percent
Both sexes
Total 49,951 100.0
34,004 68.1
1,113 2.2
14,834 29.7
15 - 19 10,367 100.0
2,699 26.0
116 1.1
7,552 72.8
20 - 24 8,256 100.0
4,403 53.3
394 4.8
3,459 41.9
25 - 29 6,251 100.0
4,939 79.0
295 4.7
1,017 16.3
30 - 34 4,653 100.0
4,099 88.1
123 2.6
431 9.3
35 - 39 3,824 100.0
3,521 92.1
52 1.4
251 6.6
40 - 44 3,260 100.0
3,037 93.2
43 1.3
180 5.5
45 - 49 2,748 100.0
2,615 95.2
23 0.8
110 4.0
50 - 54 2,621 100.0
2,474 94.4
18 0.7
129 4.9
55 - 59 1,663 100.0
1,556 93.6
6 0.4
101 6.1
60 - 64 1,606 100.0
1,429 89.0
34 2.1
143 8.9
65+ 4,702 100.0
3,232 68.7
9 0.2
1,461 31.1
Male
Total 23,103 100.0
15,655 67.8
468 2.0
6,980 30.2
15 - 19 5,274 100.0
1,364 25.9
38 0.7
3,872 73.4
20 - 24 4,149 100.0
2,184 52.6
152 3.7
1,813 43.7
25 - 29 2,890 100.0
2,306 79.8
134 4.6
450 15.6
30 - 34 2,074 100.0
1,857 89.5
59 2.8
158 7.6
35 - 39 1,736 100.0
1,643 94.6
24 1.4
69 4.0
40 - 44 1,391 100.0
1,305 93.8
17 1.2
69 5.0
45 - 49 1,205 100.0
1,162 96.4
7 0.6
36 3.0
50 - 54 1,113 100.0
1,065 95.7
11 1.0
37 3.3
55 - 59 769 100.0
732 95.2
5 0.7
32 4.2
60 - 64 682 100.0
623 91.3
17 2.5
42 6.2
65+ 1,820 100.0
1,414 77.7
4 0.2
402 22.1
Female
Total 26,848 100.0
18,349 68.3
645 2.4
7,854 29.3
15 - 19 5,093 100.0
1,335 26.2
78 1.5
3,680 72.3
20 - 24 4,107 100.0
2,219 54.0
242 5.9
1,646 40.1
25 - 29 3,361 100.0
2,633 78.3
161 4.8
567 16.9
30 - 34 2,579 100.0
2,242 86.9
64 2.5
273 10.6
35 - 39 2,088 100.0
1,878 89.9
28 1.3
182 8.7
40 - 44 1,869 100.0
1,732 92.7
26 1.4
111 5.9
45 - 49 1,543 100.0
1,453 94.2
16 1.0
74 4.8
50 - 54 1,508 100.0
1,409 93.4
7 0.5
92 6.1
55 - 59 894 100.0
824 92.2
1 0.1
69 7.7
60 - 64 924 100.0
806 87.2
17 1.8
101 10.9
65+ 2,882 100.0 1,818 63.1 5 0.2 1,059 36.7 Source: Ghana Statistical Service, 2010 Population and Housing Census
4.3 Occupation of employed persons
Occupation refers to the type of work a person was engaged in during the seven days
preceding Census Night. The emphasis was on the work the person did during the reference
period but not what he/she was trained to do.

39
Table 4.3 provides information on employed persons 15 years and older by occupation and
sex. The data shows that, workers in skilled agriculture, forestry, and fishing constitute the
largest occupational group (71.6%), followed by services and sales workers (10.0%) and craft
and related trades workers (7.2% ). On the other hand, only a small proportion of employed
persons in the District are clerical support workers (0.8%) and managers (0.9%).
For both sexes, skilled agricultural, forestry, and fishery work is the dominant occupation
with that of the males (72.1%) slightly ahead of the females (71.2%). There are more males
in the professional occupations (6.2%) than females (2.9%).On the other hand, the proportion
of females engaged in services and sales as workers (14.8%) is higher than that of males
(4.3%). Similarly, more males (7.8%) than females undertake craft and related trades in the
District.
Table 4.3: Employed population 15 years and older by occupation and sex
Both sexes Male Female
Occupation Number Percent Number Percent Number Percent
Total 34,004 100.0
15,655 100.0
18,349 100.0
Managers 320 0.9
165 1.1
155 0.8
Professionals 1,491 4.4
965 6.2
526 2.9
Technicians and associate
professionals 359 1.1
259 1.7
100 0.5
Clerical support workers 257 0.8
148 0.9
109 0.6
Service and sales workers 3,398 10
675 4.3
2,723 14.8
Skilled agricultural forestry and
fishery workers 24,360 71.6
11,288 72.1
13,072 71.2
Craft and related trades workers 2,453 7.2
1,219 7.8
1,234 6.7
Plant and machine operators and
assemblers 570 1.7
563 3.6
7 0
Elementary occupations 790 2.3
368 2.4
422 2.3
Other occupations 6 0 5 0 1 0 Source: Ghana Statistical Service, 2010 Population and Housing Census
4.4 Industry of Employed Persons
The types of industry of the employed persons 15 years and older are shown in Table 4.3.
About seven of every ten employed persons (71.4%) are in agriculture, forestry and fishing
industry in the district. This is followed by those in Wholesale and retail; repair of motor
vehicles and motorcycles (8.2%) while Information and Communication, Water supply;
sewerage waste management and remediation activities employs the same proportion of the
population (0.1%).
The proportion of males in agriculture, forestry and fishing (72.5%) is higher than that of
females (70.5%), while the wholesale and retail; repair of motor vehicles and motorcycles
employ more females (10.6%) as against their male counterparts (5.4%). Also, manufacturing
employs more females (6.0%) than males (3.5%).

40
Table 4.4: Employed population 15 years and older by Industry and Sex
Both sexes Male Female
Industry Number Percent Number Percent Number Percent
Total 34,004 100.0
15,655 100.0
18,349 100.0
Agriculture forestry and fishing 24,275 71.4
11,346 72.5
12,929 70.5
Mining and quarrying 4 0
4 0
0 0
Manufacturing 1,653 4.9
550 3.5
1,103 6
Electricity gas stream and air
conditioning supply 16 0
14 0.1
2 0
Water supply; sewerage waste
management and remediation
activities
51 0.1
36 0.2
15 0.1
Construction 472 1.4
461 2.9
11 0.1
Wholesale and retail; repair of motor
vehicles and motorcycles 2,789 8.2
853 5.4
1,936 10.6
Transportation and storage 507 1.5
494 3.2
13 0.1
Accommodation and food service
activities 855 2.5
97 0.6
758 4.1
Information and communication 35 0.1
26 0.2
9 0
Financial and insurance activities 131 0.4
76 0.5
55 0.3
Real estate activities 0 0
0 0
0 0
Professional scientific and technical
activities 150 0.4
73 0.5
77 0.4
Administrative and support service
activities 81 0.2
39 0.2
42 0.2
Public administration and defense;
compulsory social security 355 1
270 1.7
85 0.5
Education 1,321 3.9
847 5.4
474 2.6
Human health and social work
activities 318 0.9
152 1
166 0.9
Arts entertainment and recreation 61 0.2
61 0.4
0 0
Other service activities 857 2.5
226 1.4
631 3.4
Activities of households as
employers; undifferentiated goods -
and services - producing activities of
households for own use
72 0.2
30 0.2
42 0.2
Activities of extraterritorial
organizations and bodies 1 0
0 0
1 0
Source: Ghana Statistical Service, 2010 Population and Housing Census
4.5 Employment Status of Employed Persons
Employment status refers to the status of a person in the establishment where he/she currently
works or previously worked. Table 4.4 shows employed population 15 years and older by
employment status and sex in the district. About 67 percent of the employed population in
the district is self-employed without employees, 16.8 percent represent contributing family
workers while 9.7 percent are employees. A high percentage of females (69.9%) than males
(63.0%) are self-employed without employees in the district. Male employees (13.8%) are
more than females (6.1%). More females (18.0%) work as contributing family workers than
males (15.5).

41
Table 4.5: Employed population 15 years and older by employment status and sex
Both sexes Male Female
Employment Status Number Percent Number Percent Number Percent
Total 34,004 100.0
15,655 100.0
18,349 100.0
Employee 3,282 9.7
2,158 13.8
1,124 6.1
Self-employed without
employee(s) 22,683 66.7
9,857 63
12,826 69.9
Self-employed with
employee(s) 1,086 3.2
604 3.9
482 2.6
Casual worker 388 1.1
270 1.7
118 0.6
Contributing family worker 5,717 16.8
2,420 15.5
3,297 18
Apprentice 611 1.8
233 1.5
378 2.1
Domestic employee (House-
help) 189 0.6
92 0.6
97 0.5
Other 48 0.1 21 0.1 27 0.1
Source: Ghana Statistical Service, 2010 Population and Housing Census
4.6 Employment Sector
Table 4.6 shows the distribution of persons 15 years and older by sector of employment and
sex. The data reveals that, majority of the employed persons are engaged in the private
informal sector (91.5%), followed by public (government) sector (5.6%) and the private
formal sector (2.5%).
Only 15 persons representing a minimal percentage are engaged in the semi-public/ parastatal
sector. More females (94.3%) are engaged in the private informal sector than males (88.3%).
However, more males (5.6%) are engaged in the public (government) sector than females
(3.7%).
Table 4.6: Employed population 15 years and older by employment sector and sex
Both sexes Male Female
Employment Sector Number Percent Number Percent Number Percent
Total 34,004 100.0
15,655 100.0
18,349 100.0
Public (Government) 1,916 5.6
1,230 7.9
686 3.7
Private Formal 860 2.5
529 3.4
331 1.8
Private Informal 31,124 91.5
13,830 88.3
17,294 94.3
Semi-Public/Parastatal 15 0
11 0.1
4 0
NGOs (Local and
International) 82 0.2
51 0.3
31 0.2
Other International
Organizations 7 0 4 0 3 0
Source: Ghana Statistical Service, 2010 Population and Housing Census

42
CHAPTER FIVE
INFORMATION COMMUNICATION TECHNOLOGY
5.1 Introduction
Information Communications Technology (ICT) is projected as a driving force behind the
socio-economic development of the developed countries and emerging economies. It is in
line with this that successive governments have been implementing policies and programmes
to expand access of the population to ICT infrastructure. The 2010 Population and Housing
Census sought information on the ownership of mobile phones, usage of desk top and laptop
computers and internet facilities by individuals and households. This chapter presents information
on access and usage of ICT in the Jaman North district.
5.2 Ownership of Mobile Phones
Data on population 12 years and older by mobile phone ownership, internet facility usage by
sex is presented in Table 5.1. There are 56,573 persons 12 years and older in the district.
Almost 42 percent (41.8%) own mobile phones. The data further shows that 48.4 percent of
males and 36.1 percent of females own mobile phones.
5.3 Use of Internet
Table 5.1 also shows, internet usage among persons 12 years and older in the Jaman North
District. Only 2.2 percent of the population 12 years and older use internet facility. The
usage of internet facility is low among the sexes, as only 3.6 percent males and 1.1 percent
females use the facility in the district.
Table 5.1: Population 12 years and older by mobile phone ownership,
internet facility usage, and sex
Sex
Population 12
years and older
Mobile phone
ownership
Internet facility
usage
Number Percent Number Percent Number Percent
Total 56,573 100.0
23,653 41.8
1,272 2.2
Male 26,439 100.0
12,784 48.4
944 3.6
Female 30,134 100.0 10,869 36.1 328 1.1
Source: Ghana Statistical Service, 2010 Population and Housing Census
5.4 Household Ownership of Desktop or Laptop Computer
Households owning desktop or laptop computers by sex of household head is presented in
Table 5.2. There are 16,198 households in Jaman North district out of which only 4.2 percent
own desktop/laptop computer. A small proportion of households headed by males (5.8%) and
females (2.1%) own desktop/laptop computers in the district.

43
Table 5.2: Households having desktop/laptop
computers by sex of head of household
Sex
Number of
households
Desktop/laptop
computers
Number Percent Number Percent
Total 16,198 100.0
677 4.2
Male 9,200 100.0
529 5.8
Female 6,998 100.0 148 2.1 Source: Ghana Statistical Service, 2010 Population and Housing Census

44
CHAPTER SIX
DISABILITY
6.1 Introduction
Efforts are being made to integrate people with disabilities into economic activities through
improved design of housing and other infrastructure such as transportation, walkways and
pedestrian bridges in the country. In the 2010 PHC, module on disability was added for the
first time to collect information on persons with visual/sight, hearing impairment, mental
retardation, emotional or behavioral disorders and other physical challenges.
The census defined persons with disability as those who were unable to or were restricted in
the performance of specific tasks/activities due to loss of function of some part of the body as
a result of impairment or malformation. A person is considered disabled if despite the use of
assistive device or supportive environment (such as eye glasses and hearing aids), the
limitation/restriction cannot be improved. This chapter discusses data on socio-economic and
demographic characteristics of persons with disability in the Jaman North district.
6.2 Population with Disability
In the 2010 census Jaman North district recorded a total of 2,209 persons with disability
representing 2.7 percent of the total population in the district. A total of 1,022 males and
1,187 females are with disabilities in the district. In the urban areas 970 persons are with
disability while in the rural (1,239) localities a slightly higher number of persons are with
disabilities.
Table 6.1: Population by type of locality, disability type and sex
Disability Type
Both sexes Male Female
Number Percent
Number Percent Number Percent
All localities
Total 83,059 100.0
39,889 100.0
43,170 100.0
Without disability 80,850 97.3
38,867 97.4
41,983 97.3
With disability 2,209 2.7
1,022 2.6
1,187 2.7
Sight 682 30.9
311 30.4
371 31.3
Hearing 320 14.5
126 12.3
194 16.3
Speech 333 15.1
183 17.9
150 12.6
Physical 644 29.2
287 28.1
357 30.1
Intellect 313 14.2
154 15.1
159 13.4
Emotion 423 19.1
185 18.1
238 20.1
Other 206 9.3
81 7.9
125 10.5

45
Table 6.1: Population by type of locality, disability type and sex (Cont’d)
Disability Type
Both sexes Male Female
Number Percent
Number Percent Number Percent
Urban Total 43,596 100.0
20,836 100.0
22,760 100.0
Without disability 42,626 97.8
20,392 97.9
22,234 97.7
With disability 970 2.2
444 2.1
526 2.3
Sight 248 25.6
111 25.0
137 26.0
Hearing 127 13.1
48 10.8
79 15.0
Speech 152 15.7
88 19.8
64 12.2
Physical 316 32.6
148 33.3
168 31.9
Intellect 166 17.1
87 19.6
79 15.0
Emotion 215 22.2
87 19.6
128 24.3
Other 52 5.4
21 4.7
31 5.9
Rural Total 39,463 100.0
19,053 100.0
20,410 100.0
Without disability 38,224 96.9
18,475 97.0
19,749 96.8
With disability 1,239 3.1
578 3.0
661 3.2
Sight 434 35.0
200 34.6
234 35.4
Hearing 193 15.6
78 13.5
115 17.4
Speech 181 14.6
95 16.4
86 13.0
Physical 328 26.5
139 24.0
189 28.6
Intellect 147 11.9
67 11.6
80 12.1
Emotion 208 16.8
98 17.0
110 16.6
Other 154 12.4 60 10.4 94 14.2
Source: Ghana Statistical Service, 2010 Population and Housing Census
6.3 Type of Disability
Table 6.1 presents Population with disability by type and sex. Sight disability (30.9%) is
dominant in the district, followed by physical disability (29.2%) and emotional disability
(19.1%). The table further shows that a slightly high proportion of females (31.3%) have
sight disability than males (30.4%). Females (20.1%) are more likely to be emotionally
disabled than males (18.1%). Physical disability is common in females (30.1%) than males
(28.1%). For either sexes, sight and physical disabilities are the most common forms of
disability in the district.
6.4 Distribution by Type of Locality
At the type of locality level, the proportion of persons with disability in the rural areas is 3.1
percent against 2.2 percent for the urban PWDs. In the urban areas male PWDs constitute 2.1
percent while the females form 2.3 percent of the population.
6.5 Disability and Activity Status
Persons 15 years and older with disability by economic activity status and sex is presented in
Table 6.2. Persons with hearing disability (66.8%) represent a high proportion of all disability
types who are employed. Equally, large proportions of persons with sight (60.4%), speech
(57.4%) and emotional (54.8%) disabilities are employed. Of all disability types who are

46
unemployed, speech (2.2%) has the highest proportion. On the average more than a third of
all disability types are economically unemployed.
Table 6.2: Persons 15 years and older with disability by economic activity
status and sex
Sex/Disability
type
All status Employed Unemployed Economically not
active
Number Percent Number Percent Number Percent Number Percent
Both Sexes
Total 49,951 100.0
34,004 68.1
1,113 2.2
14,834 29.7
No disability 48,140 100.0
32,967 68.5
1,099 2.3
14,074 29.2
With a disability 1,811 100.0
1,037 57.3
14 0.8
760 42
Sight 565 100.0
341 60.4
4 0.7
220 38.9
Hearing 265 100.0
177 66.8
2 0.8
86 32.5
Speech 223 100.0
128 57.4
5 2.2
90 40.4
Physical 562 100.0
254 45.2
5 0.9
303 53.9
Intellectual 272 100.0
129 47.4
4 1.5
139 51.1
Emotional 365 100.0
200 54.8
4 1.1
161 44.1
Other 161 100.0
108 67.1
1 0.6
52 32.3
Male
Total 23,103 100.0
15,655 67.8
468 2
6,980 30.2
No disability 22,300 100.0
15,178 68.1
466 2.1
6,656 29.8
With a disability 803 100.0
477 59.4
2 0.2
324 40.3
Sight 241 100.0
148 61.4
0 0
93 38.6
Hearing 95 100.0
75 78.9
0 0
20 21.1
Speech 116 100.0
66 56.9
2 1.7
48 41.4
Physical 237 100.0
108 45.6
1 0.4
128 54
Intellectual 131 100.0
65 49.6
1 0.8
65 49.6
Emotional 154 100.0
88 57.1
1 0.6
65 42.2
Other 65 100.0
43 66.2
0 0
22 33.8
Female
Total 26,848 100.0
18,349 68.3
645 2.4
7,854 29.3
No disability 25,840 100.0
17,789 68.8
633 2.4
7,418 28.7
With a disability 1,008 100.0
560 55.6
12 1.2
436 43.3
Sight 324 100.0
193 59.6
4 1.2
127 39.2
Hearing 170 100.0
102 60
2 1.2
66 38.8
Speech 107 100.0
62 57.9
3 2.8
42 39.3
Physical 325 100.0
146 44.9
4 1.2
175 53.8
Intellectual 141 100.0
64 45.4
3 2.1
74 52.5
Emotional 211 100.0
112 53.1
3 1.4
96 45.5
Other 96 100.0 65 67.7 1 1 30 31.3
Source: Ghana Statistical Service, 2010 Population and Housing Census
6.6 Disability, Education and Literacy
Table 6.3 shows population 3 years and older by sex, disability type and level of education.
The data shows that, there are 2,147 persons with one form of disability or the other in the
district. It can also be observed from the table that, more females (1,157) have disability than
males (990) in the district. More than half of the number of persons with disability (52.3%) in
the District has never attended school while 35.3 percent have basic education (Primary,
JSS/JHS or Middle School).

47
The Table further shows that a higher number of females (63.4%) than males (39.3%) have
never attended school and only 28.9 percent of the females have attained basic education
compared to their male counterparts (42.7%). The table also indicates that, there are more
males (8.8%) with disability who have attained the secondary/senior high school and higher
education than their female (4.9%) counterparts.
Table 6.3: Population 3 years and older by sex, disability type and level of education
Sex/Disability
Type
Number Percent
Total Never
Pre-
Prim Basic
Sec/SHS
and
higher Total Never
Pre-
Prim Basic
Sec/SHS
and
higher
Both Sexes
Total 76,883 18,012 7,348 40,565 10,958
100.0 23.4 9.6 52.8 14.3
No disability 74,736 16,889 7,270 39,808 10,769
100.0 22.6 9.7 53.3 14.4
With a disability 2,147 1,123 78 757 189
100.0 52.3 3.6 35.3 8.8
Sight 656 341 28 223 64
100.0 52.0 4.3 34.0 9.8
Hearing 317 182 11 104 20
100.0 57.4 3.5 32.8 6.3
Speech 321 160 18 122 21
100.0 49.8 5.6 38.0 6.5
Physical 632 348 15 221 48
100.0 55.1 2.4 35.0 7.6
Intellectual 307 170 7 94 36
100.0 55.4 2.3 30.6 11.7
Emotional 409 225 16 131 37
100.0 55.0 3.9 32.0 9.0
Other 197 94 10 76 17
100.0 47.7 5.1 38.6 8.6
Male
Total 36,711 5,859 3,707 20,449 6,696
100.0 16.0 10.1 55.7 18.2
No disability 35,721 5,470 3,661 20,026 6,564
100.0 15.3 10.2 56.1 18.4
With a disability 990 389 46 423 132
100.0 39.3 4.6 42.7 13.3
Sight 295 110 18 125 42
100.0 37.3 6.1 42.4 14.2
Hearing 124 48 8 56 12
100.0 38.7 6.5 45.2 9.7
Speech 177 76 13 73 15
100.0 42.9 7.3 41.2 8.5
Physical 280 104 7 132 37
100.0 37.1 2.5 47.1 13.2
Intellectual 151 70 5 52 24
100.0 46.4 3.3 34.4 15.9
Emotional 180 83 9 64 24
100.0 46.1 5.0 35.6 13.3
Other 79 29 5 35 10
100.0 36.7 6.3 44.3 12.7
Female
Total 40,172 12,153 3,641 20,116 4,262
100.0 30.3 9.1 50.1 10.6
No disability 39,015 11,419 3,609 19,782 4,205
100.0 29.3 9.3 50.7 10.8
With a disability 1,157 734 32 334 57
100.0 63.4 2.8 28.9 4.9
Sight 361 231 10 98 22
100.0 64.0 2.8 27.1 6.1
Hearing 193 134 3 48 8
100.0 69.4 1.6 24.9 4.1
Speech 144 84 5 49 6
100.0 58.3 3.5 34.0 4.2
Physical 352 244 8 89 11
100.0 69.3 2.3 25.3 3.1
Intellectual 156 100 2 42 12
100.0 64.1 1.3 26.9 7.7
Emotional 229 142 7 67 13
100.0 62.0 3.1 29.3 5.7
Other 118 65 5 41 7 100.0 55.1 4.2 34.7 5.9 Source: Ghana Statistical Service, 2010 Population and Housing Census

48
CHAPTER SEVEN
AGRICULTURAL ACTIVITIES
7.1 Introduction
In the 2010 Population and Housing Census (PHC), specific questions were asked on
households in farming activities, namely, crop farming, tree growing, livestock rearing and
fish farming. The data collected consisted of types of crops cultivated and tree crops grown,
livestock types, number and their keepers. A household was described as an agricultural
household if at least, one person in the household was engaged in any type of farming
activity, namely crop farming, tree growing, livestock rearing and fish farming. This chapter
analyzes data pertaining to households in agriculture and type of farming they engaged in.
7.2 Households in Agriculture
Figure 7.1 is a graphical representation of households in agriculture by type of locality in the
district. The figure shows that over 81.7 percent of households engage in agricultural
activities in the district. The figure also shows that households that engage in agricultural
activities are more in rural areas (91.4%) than urban areas (73.1%).
Figure 7.1: Households in agriculture by type of locality
Source: Ghana Statistical Service, 2010 Population and Housing Census
7.3 Types of Farming Activities
Table 7.1 shows agricultural activities of households by type of locality. The data shows that
out of the 13,230 agricultural households in the district, 99.0 percent are engaged in crop
farming and 30.1 percent are into livestock rearing. The table further shows that less than one
percent (0.1%) is engaged in fish farming while 1.5 percent are engaged in tree planting. In
the urban areas out of the 6,301 households engaged in agriculture, 98.5 percent are into crop
farming while 27.3 percent are engaged in livestock rearing. The two agricultural activities
18.3
26.9
8.6
81.7
73.1
91.4
0
10
20
30
40
50
60
70
80
90
100
Total Urban Rural
Households not engaged inAgriculture
Households engaged inAgriculture

49
that are engaged in by agricultural households in the urban areas are tree planting (0.7%) and
fish farming (0.1%). In the rural areas out of 6,894 households engaged in agriculture, 99.5
percent are engaged in crop farming while 32.4 percent are into livestock rearing.
Table 7.1: Agricultural activities of households by locality
Agricultural activities
Total Urban Rural
Number Percent Number Percent Number Percent
Total Households 16,198 100.0 8,615 100.0 7,583 100.0
Households not engaged in Agriculture 2,968 18.3
2,314 26.9
654 8.6
Households engaged in Agriculture 13,230 81.7
6,301 73.1
6,929 91.4
Crop Farming 13,103 99.0
6,209 98.5
6,894 99.5
Tree Planting 192 1.5
47 0.7
145 2.1
Livestock Rearing 3,976 30.1
1,722 27.3
2,254 32.5
Fish Farming 12 0.1 8 0.1 4 0.1
Source: Ghana Statistical Service, 2010 Population and Housing Census
7.4 Types of livestock and other animals reared.
Table 7.2 shows the distribution of livestock and keepers in Jaman North District. The table
shows that there are a total of 97,207 animals being reared by 5,857 keepers with an average
of 16.6 animals per keeper. Poultry or chicken accounted for more than half (58.1%) of all
livestock reared in the district with 24.8 birds per keeper. Goat and sheep rearing are also
prominent in the district constituting 14.1 percent and 15.7 percent of the total livestock and
other animals reared respectively.
The Table further shows that, cattle rearing forms 2.0 percent with 20 animals per keeper.
Snails keeping accounted for only 0.7 percent but recorded high average of 168 per keeper.
Fish farming also accounted for 5.7 percent with an average of 463 fish per keeper.
Table 7.2: Distribution of livestock, other animals and keepers
Livestock/keepers
Number of Animals Number of keepers Average
Animal
per
Keeper Number Percent
Number Percent
Total 97,204 100.0 5,857 100.0 16.6
Beehives 20 0.0 2 0.0 10
Cattle 1,919 2.0 93 1.6 20.6
Chicken 56,480 58.1 2,282 39.0 24.8
Dove 261 0.3 9 0.2 29
Duck 669 0.7 44 0.8 15.2
Goat 13,721 14.1 1,794 30.6 7.6
Grass-cutter 22 0.0 7 0.1 3.1
Guinea fowl 816 0.8 56 1.0 14.6
Ostrich 101 0.1 7 0.1 14.4
Pig 1,107 1.1 104 1.8 10.6
Rabbit 198 0.2 16 0.3 12.4
Sheep 15,223 15.7 1,385 23.6 11
Silk worm 111 0.1 6 0.1 18.5
Snail 675 0.7 4 0.1 168.8
Turkey 274 0.3 29 0.5 9.4
Other (specify) 47 0.0 7 0.1 6.7
Fish farming 5,560 5.7 12 0.2 463.3 Source: Ghana Statistical Service, 2010 Population and Housing Census

50
CHAPTER EIGHT
HOUSING CONDITIONS
8.1 Introduction
It has long been established that man’s most basic needs are food, clothing and shelter.
Housing is both a social good, providing core security for households, neighbor hoods,
societies and communities and an economic good stimulation growth and development. A
house or compound is defined as structurally separate and independent place of abode. The
essential features are separateness and independence. An enclosure may be considered as
separate if it is surrounded by walls, fences, etc., so that a person or group of persons can
isolate themselves from other persons in the community for the purpose of sleeping,
preparing and taking their meals or protecting themselves from hazards of climate such as
storms and the sun. The 2010 Population Census in Ghana is the second national census,
following the 2000 census that included a comprehensive housing census. The census
solicited information on housing stock, room occupancy, construction materials and other
domestic amenities. This chapter presents descriptive analysis of housing situation for the
district, using 2010 PHC data.
8.2 Housing Stock
The distribution of housing stock and households in the District is presented in Table 8.1. The
Table shows that, the district has a total household population of 82,074 which represent 3.6
percent of the regional household population of 2,265,458. The household population in the
district is more urban (52.5%) than rural (47.5%). The table indicates that the total stock of
houses in the District is 10,020 of which 55 percent are located in the rural compared with 45
percent in urban areas. The Table further shows that out of 16,198, households 7,583 are in
the rural areas as compared with 8,615 in the urban areas of the District. As shown in the
table, there is a higher population per house in the urban (9.5) than rural (7.1) areas. The
population per house for the district is 8.2 as compared to 6.8 for region.
Table 8.1: Stock of houses and households by type of locality
Categories
Total
country Region District Urban Rural
Total population 24,658,823 2,310,983 83,059 43,596 39,463
Total household population 24,076,327 2,265,458 82,074 43,079 38,995
Number of houses 3,392,745 331,967 10,020 4,513 5,507
Number of households 5,467,054 490,515 16,198 8,615 7,583
Population per house* 7.1 6.8 8.2 9.5 7.1
Average household size 4.4 4.6 5.1 5.0 5.1 Source: Ghana Statistical Service, 2010 Population and Housing Census

51
8.3 Type of Dwelling and Ownership Status Arrangements
8.3.1 Type of Occupied dwelling
As shown in Table 8.2, in 2010 PHC, 16,198 households were recorded in the Jaman North
District. The table shows that majority of households (69.4%), live in compound houses
followed by those in separate house (24.7%) and households in semi-detached units (3.2%).
More households headed by females (71.7 %) than males (67.7 %) live in compound houses.
On the other hand, male headed household who live in separate house are more (25.8%) than
the female headed households (23.3%).
The Table further shows that, more households live in compound house in urban areas (72 .7
%) compared with rural areas (65.7 %). Also, majority households live in separate house in
rural areas (28.7 %) compared with urban areas (21.1 %). Less than one percent (0.1%) of
households lives in improvised homes (kiosk/container) in the district.
Table 8.2: Type of occupied dwelling unit by sex of household head and type of locality
Ownership status
Total
country Region
District
Total
Number Percent Male Female Urban Rural
Total 5,467,054 490,515 16,198 100.0 100.0 100.0 100.0 100.0
Owned by household
member 2,883,236 260,608 7,397 45.7 49.3 40.9 34.8 58.0
Being purchased (e.g.
mortgage) 45,630 3,448 82 0.5 0.6 0.4 0.5 0.5
Relative not a household
member 851,630 90,176 6,345 39.2 33.3 46.9 42.6 35.3
Other private individual 1,439,021 116,402 2,030 12.5 14.2 10.3 19.5 4.6
Private employer 83,610 9,509 111 0.7 0.9 0.5 0.9 0.4
Other private agency 21,123 1,390 28 0.2 0.2 0.1 0.3 0.1
Public/Government
ownership 118,804 7,138 156 1.0 1.3 0.6 1.2 0.7
Other 24,000 1,844 49 0.3 0.3 0.3 0.2 0.4
Source: Ghana Statistical Service, 2010 Population and Housing Census
8.3.2 Ownership type
Ownership status of dwelling units by sex of household head and locality is shown in Table
8.3. The three most important ownership types in the district which together account for over
97 percent of units are owned by a household member (45.7%), owned by a relative who is
not a household member (39.2%) and other private individual (12.5%). In male headed
households, dwellings owned by a household member is the highest (49.3%), followed by
dwellings owned by relative not a household member (33.3%) and dwellings owned by other
private individual (14.2%). Also in female headed households relative not a member of the
household is the most common (46.9%).
The majority of rural dwelling units (58.0%) are owned by a household member compared
with 34.8 percent for urban dwelling units. The proportion of dwelling units owned by other
private individual in urban areas (19.5%) is more than four times the proportion in rural areas
(4.6%).

52
Table 8.3: Ownership status of dwelling by sex of household head and type of locality
Ownership status
Total
country Region
District
Total
Number Percent Male Female Urban Rural
Total 5,467,054 490,515 16,198 100.0 100.0 100.0 100.0 100.0
Owned by household
member 2,883,236 260,608 7,397 45.7 49.3 40.9 34.8 58.0
Being purchased (e.g.
mortgage) 45,630 3,448 82 0.5 0.6 0.4 0.5 0.5
Relative not a household
member 851,630 90,176 6,345 39.2 33.3 46.9 42.6 35.3
Other private individual 1,439,021 116,402 2,030 12.5 14.2 10.3 19.5 4.6
Private employer 83,610 9,509 111 0.7 0.9 0.5 0.9 0.4
Other private agency 21,123 1,390 28 0.2 0.2 0.1 0.3 0.1
Public/Government
ownership 118,804 7,138 156 1.0 1.3 0.6 1.2 0.7
Other 24,000 1,844 49 0.3 0.3 0.3 0.2 0.4
Source: Ghana Statistical Service, 2010 Population and Housing Census
8.4 Construction Material
8.4.1 Main Construction Material for Outer wall
Table 8.4 shows the main construction material for outer walls of buildings in the Jaman
North District. The two main construction materials for outer walls in the District are cement
blocks/concrete and mud brick/earth. The proportion of outer walls constructed with mud
brick/earth is the highest (46.7%) in the district with that of cement blocks/concrete
constituting 46.0 percent. In rural areas, 60.3 percent of outer walls are made of mud
brick/earth as compared to 34.4 percent in urban areas. On the other hand 57.8 percent of
outer walls in the urban areas are made of cement blocks/concrete as compared to 33 percent
in rural areas. Only 5.3 percent of outer walls of houses in the District are made of landcrete.
Other materials such as bamboo and palm leaf are hardly used in construction of outer walls
in rural areas (0.1%) of the district.
Table 8.4: Main construction material for outer wall of dwelling unit by
type of locality
Material for Outer wall
Total
country Region
District
Total
Number Percent Urban Rural
Total 5,817,607 519,342 17,308 100.0
100.0 100.0
Mud brick/Earth 1,991,540 239,284 8,084 46.7
34.3 60.3
Wood 200,594 7,932 116 0.7
0.6 0.8
Metal sheet/Slate/Asbestos 43,708 2,447 64 0.4
0.5 0.2
Stone 11,330 814 44 0.3
0.3 0.3
Burnt bricks 38,237 5,062 69 0.4
0.4 0.4
Cement blocks/Concrete 3,342,462 241,282 7,963 46.0
57.8 33.0
Landcrete 104,270 18,808 922 5.3
6.0 4.6
Bamboo 8,206 523 9 0.1
0.0 0.1
Palm leaf/Thatch (grass)/Raffia 38,054 1,694 13 0.1
0.0 0.1
Other 39,206 1,496 24 0.1 0.1 0.2 Source: Ghana Statistical Service, 2010 Population and Housing Census

53
8.4.2 Main Construction materials for the Floor of dwelling unit by
Type of Locality
Table 8.5 shows the main construction materials for the floor of dwelling units in the district.
Materials for floors of majority of houses in the District are made of cement/concrete and
earth/mud. The main material use for floor (85.9%) of dwelling units is cement/concrete
followed by earth/mud floor (13.1%).
Although cement floors are most common in both urban and rural areas, the proportion is
higher in urban (91.1%) than in rural (79.9%) areas. The table further indicates that, 19.4
percent of floors in rural areas are made of earth/mud compared with 7.5 percent in urban
areas.
Table 8.5: Main construction materials for the floor of dwelling unit by type of locality
Materials for the floor
Total
country Region
District
Total
Number Percent Urban Rural
Total 5,467,054 490,515 16,198 100.0
100.0 100.0
Earth/Mud 872,161 113,228 2,118 13.1
7.5 19.4
Cement/Concrete 4,255,611 363,827 13,909 85.9
91.1 79.9
Stone 32,817 3,325 45 0.3
0.2 0.3
Burnt brick 6,537 322 9 0.1
0.1 0.0
Wood 52,856 1,114 3 0.0
0.0 0.0
Vinyl tiles 57,032 1,889 21 0.1
0.2 0.0
Ceramic/Porcelain/Granite/Marble
tiles 88,500 3,784 62 0.4
0.5 0.3
Terrazzo/Terrazzo tiles 85,973 1,972 21 0.1
0.2 0.0
Other 15,567 1,054 10 0.1 0.1 0.1
Source: Ghana Statistical Service, 2010 Population and Housing Census
8.4.3 Main Construction Material for Roofing of dwelling unit by Type of Locality
Table 8.6 shows the main construction material for roofing in the district. The Table further
shows that 91.8 percent of dwelling units are roofed with metal sheets and 5.5 percent with
Thatch/Palm leaf or raffia.
In both rural and urban areas the main material for roof is metal sheet but that of the urban is
higher (94.3%) than the rural area (89.0%). Thatch/Palm leaf or Raffia as roofing material
stands at 8.2 percent in the rural area compare with the urban area (2.9%).

54
Table 8.6: Main construction material for roofing of dwelling unit by type
of locality
Main Roofing material
Total
country Region
District
Total
Number Percent Urban Rural
Total 5,817,607 519,342 17,308 100.0
100.0 100.0
Mud/Mud bricks/Earth 80,644 4,394 48 0.3
0.1 0.5
Wood 45,547 3,588 100 0.6
0.3 0.9
Metal sheet 4,152,259 423,255 15,884 91.8
94.3 89.0
Slate/Asbestos 759,039 1,686 128 0.7
1.3 0.1
Cement/Concrete 141,072 3,161 101 0.6
0.7 0.5
Roofing tile 31,456 704 2 0.0
0.0 0.0
Bamboo 71,049 4,679 28 0.2
0.0 0.3
Thatch/Palm leaf or
Raffia 500,606 74,583 935 5.4
2.9 8.2
Other 35,935 3,292 82 0.5 0.5 0.5
Source: Ghana Statistical Service, 2010 Population and Housing Census
8.5 Room Occupancy
Table 8.7 presents household size and number of sleeping rooms occupied in dwelling units.
Almost 54 percent of households in the district occupied one sleeping room, 22.2 percent live
in two sleeping rooms and 11.2 percent live in three sleeping rooms. Households occupying
nine sleeping rooms and more in the District accounted for 1.1 percent. The data shows that
92.3 percent of single person households live in one sleeping room. A high proportion of four
member households (59.9%) live in one room whiles 34.4 percent of the 7 member household
lives in two sleeping rooms. The data further shows that among the 9 member households,
30.5 percent live in two sleeping rooms while 24.2 percent of the 10 and above member
households occupy three sleeping rooms.
Table 8.7: Household size and number of sleeping rooms occupied in dwelling unit
Household
size
Number of sleeping rooms
Total Percent
One
room
Two
rooms
Three
rooms
Four
rooms
Five
rooms
Six
rooms
Seven
rooms
Eight
rooms
Nine
rooms
or more
Total 16,198 100.0 53.8 22.2 11.2 6 2.9 1.5 0.7 0.6 1.1
1 2,431 100.0 92.3 4.9 1.1 0.7 0.5 0.2 0.1 0.1 0.3
2 1,788 100.0 81.1 15.3 2 0.8 0.3 0.1 0.1 0.1 0.2
3 2,014 100.0 72 19 6 1.5 0.7 0.2 0.4 0.1 0.1
4 1,872 100.0 59.7 26.1 8.7 3.4 0.9 0.5 0.4 0.1 0.2
5 1,808 100.0 51.3 29.7 10.9 4.5 2 0.7 0.1 0.1 0.7
6 1,509 100.0 39.8 31.9 16 5.8 3.6 1.1 0.5 0.5 0.9
7 1,322 100.0 32.5 34.4 17.2 8.7 3.7 1.6 0.8 0.5 0.5
8 958 100.0 20.9 31.7 23.2 12.9 6.5 2.2 0.9 0.8 0.8
9 750 100.0 14.9 30.5 21.7 16.7 8.1 4.7 1.9 0.5 0.9
10+ 1,746 100.0 10.4 18.6 24.2 17.6 9.2 7.1 3.4 3.3 6.2
Source: Ghana Statistical Service, 2010 Population and Housing Census

55
8.6 Access to Utilities and Household Facilities
8.6.1 Main Source of Lighting of dwelling unit
The main source of lighting for dwelling unit by type of locality is shown in Table 8.8. The
Table shows that the major sources of lighting for households in the Jaman North District are
Flashlight/Touch (48.6%) and electricity (mains) (44.3%). The table further shows that, 63.9
percent of households in the urban areas use electricity as their main source of lighting as
compared to 22.1 percent of rural households who use electricity (main) as a source of
lighting. On the other hand, the use of flashlights is the main (69.5%) source of lighting for
the rural households in the district against 30.3 percent for the urban households. Less than 6
percent of households in the district use kerosene lamp as a source of lighting.
Table 8.8: Main source of lighting of dwelling unit by type of locality
Main source of light
Total
country Region
District
Total
Number Percent Urban Rural
Total 5,467,054 490,515 16,198 100.0
100.0 100.0
Electricity (mains) 3,511,065 263,890 7,181 44.3
63.9 22.1
Electricity (private generator) 36,142 2,372 42 0.3
0.2 0.3
Kerosene lamp 971,807 58,403 887 5.5
4.4 6.7
Gas lamp 9,378 793 39 0.2
0.2 0.3
Solar energy 9,194 693 14 0.1
0.1 0.1
Candle 41,214 1,662 53 0.3
0.5 0.1
Flashlight/Torch 858,651 159,901 7,879 48.6
30.3 69.5
Firewood 13,241 997 23 0.1
0.2 0.1
Crop residue 4,623 272 6 0.0
0.0 0.0
Other 11,739 1,532 74 0.5 0.1 0.8
Source: Ghana Statistical Service, 2010 Population and Housing Census
8.6.2 Main Source of Cooking Fuel, and Cooking Space used by Households
As shown in Table 8.9, the three main source of cooking fuel for households in the District
include wood (72.4%), charcoal (15.9%) and gas (3.8%). The use of other sources such as
kerosene, crop residue and electricity is negligible and constitute less than one percent as
source of cooking fuel for the households in the district. A significant proportion of
households (7.1%) in the district do not cook. In rural areas, because wood is locally
available, it is the main source of cooking fuel for 89.5 percent of the households compared
with 57.3 percent in urban areas. In contrast, charcoal which is often utilized by urban
dwellers is used by 26.5 percent of households in urban areas, and 3.9 percent in rural areas.
8.6.3 Cooking Space used by Households
Also, the different cooking space for households in the district is presented in Table 8.9. The
types of cooking space used mostly by households is separate rooms for the exclusive use of
households (29.6%), open space in compound (29.5%), separate room shared with other
household(s) (12.5%) and veranda (10.3). In urban areas the proportion of households that
have separate rooms for their exclusive use only is lower (22.4%) than rural areas (37.8%).
However, households that cook in the open space (31.2%) and veranda (15.2%) in urban
areas are higher than in rural areas (15.2%, 4.8%) respectively.

56
Table 8.9: Main source of cooking fuel, and cooking space used by households
Source of cooking fuel/
cooking space
Total
country Region
District
Total
Number Percent Urban Rural
Main source of cooking fuel for household
Total 5,467,054 490,515 16,198 100.0
100.0 100.0
None no cooking 306,118 32,285 1,154 7.1
8.8 5.2
Wood 2,197,083 294,170 11,720 72.4
57.3 89.5
Gas 996,518 36,641 621 3.8
6.5 0.8
Electricity 29,794 1,073 49 0.3
0.4 0.2
Kerosene 29,868 929 12 0.1
0.1 0.1
Charcoal 1,844,290 122,190 2,578 15.9
26.5 3.9
Crop residue 45,292 1,788 37 0.2
0.2 0.3
Saw dust 8,000 1,023 13 0.1
0.1 0.0
Animal waste 2,332 87 0 0.0
0.0 0.0
Other 7,759 329 14 0.1
0.1 0.0
Cooking space used by household
Total 5,467,054 490,515 16,198 100.0
100.0 100.0
No cooking space 386,883 39,078 1,441 8.9
10.1 7.6
Separate room for exclusive use of
household 1,817,018 136,004 4,799 29.6
22.4 37.8
Separate room shared with other
household(s) 410,765 47,827 2,031 12.5
13.3 11.6
Enclosure without roof 117,614 7,195 186 1.1
0.7 1.7
Structure with roof but without walls 349,832 41,889 1,153 7.1
6.1 8.3
Bedroom/Hall/Living room) 74,525 1,575 71 0.4
0.6 0.3
Verandah 1,173,946 84,605 1,673 10.3
15.2 4.8
Open space in compound 1,115,464 130,728 4,786 29.5
31.2 27.6
Other 21,007 1,614 58 0.4 0.4 0.3
Source: Ghana Statistical Service, 2010 Population and Housing Census
8.7 Main Source of Water for Drinking and for other Domestic Purposes
8.7.1 Main source of drinking water
The main source of water for drinking and other domestic purposes for households in the
Jaman North District are presented in Table 8.10. The table shows that 55.3 percent of
households in the district use bore-hole as source of drinking water, followed by public
tap/stand pipe (20.1%) and pipe-borne outside dwelling (14.4%). At the locality level, bore-
hole pump/tube well is the main source of water for drinking for households. However, the
proportion of households who use bore-hole is higher (77.8%) of rural areas than the urban
areas (35.5%).Source of water for Domestic purpose
8.7.2 Main source water for other domestic use
Table 8.10 further shows that, the situation is not different where it comes to source of water
for domestic use. Most households in the district use bore hole (54.2%) for domestic
purposes, followed by public pipe (20.3%) and pipe dwelling outside dwelling (14.1%). A
similar trend is observed at the locality level where most (75.3%) households in the rural use
borehole as well as urban households (35.6%).

57
Table 8.10: Main source of water of dwelling unit for drinking and other
domestic purposes
Sources of water
Total
country Region
District
Total
Number Percent Urban Rural
Main source of drinking water for household
Total 5,467,054 490,515 16,198 100.0
100.0 100.0
Pipe-borne inside dwelling 790,493 29,804 785 4.8
8.3 0.9
Pipe-borne outside dwelling 1,039,667 68,152 2,331 14.4
16.9 11.6
Public tap/Standpipe 712,375 83,741 3,253 20.1
35.1 3.0
Bore-hole/Pump/Tube well 1,267,688 163,629 8,959 55.3
35.5 77.8
Protected well 3,212,091 45,990 254 1.6
1.7 1.5
Rain water 39,438 1,044 11 0.1
0.1 0.0
Protected spring 19,345 1,498 30 0.2
0.2 0.2
Bottled water 20,261 777 27 0.2
0.3 0.1
Sachet water 490,283 13,356 135 0.8
1.5 0.1
Tanker supply/Vendor
provided 58,400 288 0 0.0
0.0 0.0
Unprotected well 112,567 9,372 116 0.7
0.0 1.5
Unprotected spring 12,222 1,360 5 0.0
0.0 0.0
River/Stream 502,804 64,993 292 1.8
0.5 3.3
Dugout/Pond/Lake/Dam/Canal 76,448 6,268 0 0.0
0.0 0.0
Other 3,972 243 0 0.0
0.0 0.0
Main source of water for other domestic use of household Total 5,467,054 490,515 16,198 100.0
100.0 100.0
Pipe-borne inside dwelling 905,566 32,149 781 4.8
8.4 0.7
Pipe-borne outside dwelling 1,089,030 67,219 2,290 14.1
16.7 11.3
Public tap/Standpipe 704,293 83,208 3,287 20.3
35.3 3.2
Bore-hole/Pump/Tube well 1,280,465 156,073 8,778 54.2
35.6 75.3
Protected well 465,775 57,094 364 2.2
2.8 1.6
Rain water 39,916 965 12 0.1
0.1 0.0
Protected spring 18,854 1,626 35 0.2
0.2 0.3
Tanker supply/Vendor
provided 100,048 651 19 0.1
0.2 0.1
Unprotected well 152,055 10,956 127 0.8
0.1 1.6
Unprotected spring 15,738 1,567 2 0.0
0.0 0.0
River/Stream 588,590 70,604 452 2.8
0.6 5.3
Dugout/Pond/Lake/Dam/Canal 96,422 7,421 45 0.3
0.0 0.6
Other 10,302 982 6 0.0 0.0 0.1
Source: Ghana Statistical Service, 2010 Population and Housing Census, GSS
8.8 Bathing and Toilet Facilities
8.8.1 Toilet Facilities
Table 8.11 captures data on household sanitation in terms of toilet and bathing facilities by
type of locality. The table shows that, Public toilet (WC/KVIP/Pit/Pan etc.) are the most
dominant toilet facility used by most households (56.6%) in the district, followed by pit
latrine (17.5%), KVIP (10.(%) while nine percent of households using open defecation. The
public toilet is the most common in both rural and urban areas. In rural localities, 62.6
percent of the households use public toilet whiles for urban households the proportion is 51.4
percent.

58
8.8.2 Bathing Facilities
Table 8.11 also shows that 21.3 percent of households in the District have their own
bathroom for exclusive use but the most common facility used by households is shared
separate bathroom in the same house (41.6 %) and 17.2 percent use shared open cubicles. At
the locality level, 22.9 percent of the rural households in the District use bathing facility for
exclusive use as compared to 19.9 percent for their urban counterparts. More urban
households (19.4%) than rural households (14.7%) use shared open cubicles for bathing.
Table 8.11: Type of toilet facility and bathing facility used by household by
type of locality
Toilet facility/Bathing facility
Total
country Region
District
Total
Number Percent Urban Rural
Toilet facility used by household
Total 5,467,054 490,515 16,198 100.0
100.0 100.0
No facilities (bush/beach/field) 1,056,382 87,122 1,486 9.2
10.3 7.9
W.C. 839,611 32,800 900 5.6
9.7 0.9
Pit latrine 1,040,883 112,552 2,828 17.5
13.4 22.1
KVIP 572,824 39,544 1,769 10.9
15.1 6.2
Bucket/Pan 40,678 903 15 0.1
0.1 0.1
Public toilet (WC/KVIP/Pit/Pan etc) 1,893,291 216,053 9,170 56.6
51.4 62.6
Other 23,385 1,541 30 0.2
0.2 0.2
Bathing facility used by household
Total 5,467,054 490,515 16,198 100.0
100.0 100.0
Own bathroom for exclusive use 1,535,392 119,022 3,454 21.3
19.9 22.9
Shared separate bathroom in the same
house 1,818,522 170,946 6,741 41.6
43.0 40.0
Private open cubicle 381,979 40,486 806 5.0
3.4 6.8
Shared open cubicle 1,000,257 79,955 2,783 17.2
19.4 14.7
Public bath house 140,501 3,354 304 1.9
3.3 0.3
Bathroom in another house 187,337 25,442 1,123 6.9
5.6 8.5
Open space around house 372,556 49,179 949 5.9
5.3 6.5
River/Pond/Lake/Dam 14,234 1,027 16 0.1
0.1 0.1
Other 16,276 1,104 22 0.1 0.0 0.2
Source: Ghana Statistical Service, 2010 Population and Housing Census
8.9 Methods of Waste Disposal
8.9.1 Solid waste disposal
Table 8.12 indicates that the method of solid and liquid waste disposal in the Jaman North
District. The common means of disposing solid waste in the district is by public dump (open
space) (74.7%), followed by public dump (container) (16.3%) while for 4.5 percent of
households the waste is collected by public or private individuals/companies. Less than one
percent (0.8%) of households in the district disposed their solid waste by burying them. In
urban areas, the proportion of households who dispose of their solid waste disposal by
public dump (container) is 29.6 percent compared with 1.1 percent in rural areas. Dumping of
refuse in open space is more common in rural (93.1%) than urban areas (58.5%).

59
8.9.2 Liquid Waste Disposal
On liquid waste disposal, 34.0 percent of the households in the District dispose of by
throwing onto compound while 61.5 percent dispose of their liquid waste by throwing onto
the street/outside.
In urban areas, the proportions of households that dispose of liquid waste by throwing onto
compound (68.5%) is higher than the rural (53.6%) areas. Similarly, about 2.2 percent of
households in urban areas dispose of liquid wastes by throwing into gutters compared with
1.8 percent in rural areas.
Table 8.12: Method of solid and liquid waste disposal by type of locality
Method of waste disposal
Total
country Region
District
Total
Number Percent Urban Rural
Solid waste
Total 5,467,054 490,515 16,198 100.0
100.0 100.0
Collected 785,889 14,058 724 4.5
7.1 1.5
Burned by household 584,820 21,408 201 1.2
1.8 0.6
Public dump (container) 1,299,654 117,369 2,640 16.3
29.6 1.1
Public dump (open space) 2,061,403 261,390 12,096 74.7
58.5 93.1
Dumped indiscriminately 498,868 58,399 362 2.2
1.8 2.7
Buried by household 182,615 15,015 124 0.8
0.8 0.7
Other 53,805 2,876 51 0.3
0.3 0.3
Liquid waste
Total 5,467,054 490,515 16,198 100.0
100.0 100.0
Through the sewerage system 183,169 5,851 152 0.9
0.6 1.4
Through drainage system into a
gutter 594,404 12,558 90 0.6
0.8 0.3
Through drainage into a pit
(soak away) 167,555 7,581 131 0.8
1.3 0.3
Thrown onto the street/outside 1,538,550 200,536 9,961 61.5
68.5 53.6
Thrown into gutter 1,020,096 31,703 323 2.0
2.2 1.8
Thrown onto compound 1,924,986 231,047 5,504 34.0
26.5 42.4
Other 38,294 1,239 37 0.2 0.1 0.3
Source: Ghana Statistical Service, 2010 Population and Housing Census

60
CHAPTER NINE
SUMMARY OF FINDINGS, CONCLUSIONS AND
POLICY RECOMMENDATIONS
9.1 Introduction
The Government of Ghana has operated the decentralized system of development since 1980
with the District Assembly, as the planning authority, expected to initiate and coordinate the
processes of planning, programming, budgeting and implementation of district plans,
programmes and projects. The district assemblies and the various organs are expected to
carry out medium and long term planning, including integration of population policies and
issues as they pertain to the needs of particular districts and communities.
The population census is the primary source of information about the population and its
characteristics. The 2010 Population and Housing Census (PHC) collected data on the
demographic, social and economic characteristics, and housing conditions of the entire
population of the Jaman North District. Geographically, the census covered all localities,
towns, settlements, and residential areas within the District. This report on Jaman North
District provides detailed analysis of the 2010 census data at the district level. The aim is to
provide useful data and analysis for planners and policy makers in crafting and implementing
evidence-based strategies for development in the District.
9.2 Demographic Characteristics
9.2.1 Population size, Structure and Density
According to the 2010 PHC, the population of the Jaman North District is 83,059 comprising
39,889 males and 43,170 females. The District sex ratio is 92.4 males to 100 females. The
proportion of the population in the District living in urban areas is 52.5 percent and 47.5
percent live in rural areas. The district has a youthful population of more than 75 percent. The
total age dependency ratio for the District is 83.6 which is higher than the regional average of
81.3.
9.3.2 Nationality
Information gathered from the 2010 PHC revealed that the residents of the District are mainly
Ghanaians (97.7%) as against a few non-Ghanaians (2.3%). Nationals from the ECOWAS
countries constitute 1.3 percent of the population and less than one percent (0.5%) each is
from other African countries and the rest of the world.
9.2.3 Fertility, Mortality and Migration
Fertility
An observation of the 2010 Census shows that Jaman North District has a total of 20,640
women in the reproductive age group (15-49 years) who have delivered 1,747 children within
12 months before the census night. The District also recorded a Total Fertility Rate of 2.99
and Crude Birth Rate of 21.0 which are both slightly lower than the regional averages of 3.58
and 26.3 respectively. General Fertility Rate of 84.6 for the District is lower than the regional
rate of 105.9.

61
Mortality
The crude death rate for the region is 7.6 per 1000 population. Deaths due to
accident/violence/homicide/suicide are 6.2 percent which is lower than the regional rate of
8.7 percent. However, death that occurred due to other causes is higher (93.8%) in the
district.
Migration
Data from the 2010 PHC show that 10,582 of the district population are migrants. Census
information also gathered that 6,228 persons of the migrants in the District were born in other
districts within the Brong Ahafo Regon. A significant number of migrants (825) in the
District were born outside the shores of Ghana. Among the migrants who were born outside
the Brong Ahafo region, many come from Western (1,398) Upper West (981) and Ashanti
(651) Regions. On the average, higher proportions (29.1%) of the migrants have been in the
district for a period between 1 to 4 years.
9.2.4 Household size, Structure and Composition
There are 16,198 households in the District. The district has an average household size of 5.1
persons. About 20 percent of the household population are heads, 44.7 percent Children and
13.8 per are grandchildren. The data also show that majority of households in the district
(51.6%) are extended family households.
9.2.5 Marital Status
The 2010 PHC data on marital status indicate that 48.8 percent of the population 12 years and
older have never married, 37.1 percent are currently married, and 3.7 percent are in
consensual union while 5.4 percent are widowed. The data show that the proportion of the
population married increases with age.
9.2.6 Religion
The predominant religion of the people in the Jaman North District according to the 2010
PHC is Christianity. The population who profess to be Christians constitutes 83.5 percent,
followed by Islam 13.0 percent and Traditionalist 1.2 percent. The data reveals that 2.2
percent of the populations are not affiliated to any religion.
9.2.7 Literacy and Education
The 2010 Census data captured information on literacy of the population 11 years and older
and education for the population aged three years and older for the Jaman North District. The
data show that, 16,585 of the population are not literate in any language and 42,039 of the
district’s population are literate in at least one language. There are more literate males (81%)
compared to females (63%).
In terms of education, the population 3 years and older who are currently attending school,
majority (17,276) are in the primary school constituting 46.5 percent. The data further show
that more females (48.3%) in the District are currently in basic school than males (45.0%).

62
9.2.8 Disability
The 2010 PHC shows that 2,209 persons constituting 2.7 percent of the population in the
Jaman North District are living with one form of disability or the other. The disability rate
for the male is 2.6 percent and female 2.7 percent. About 57.3 percent of persons with
disabilities are employed while 0.8 percent is unemployed. The proportion of disabled
persons who are economically not active is 42.0 percent.
9.2.9 Economic Activity
Information on the activity status of the population indicates that 70.3 percent of the
population 15 years and older are economically active. The proportion of persons who are
economically active is higher among females (70.7%) than among their male (69.8%)
counterparts.
In terms of employment status, the data shows that majority of the economically active
population are employed (96.8%) with 3.2 percent unemployed. Further analysis shows that
slightly higher percentage of females (3.4%) than males (2.9%) is unemployed.
Data available shows that workers in skilled agriculture, forestry, and fishing constitute the
largest occupational group (71.6%) %), followed by services and sales workers (10.0%) and
those in craft and related trades (7.2%).
Agriculture/forestry/fishing is the largest sector, employing 71.4 percent, followed by those
in Wholesale and retail; repair of motor vehicles and motorcycles (8.2%).
However, the proportion of males in agriculture, forestry and fishing (72.5%) is higher than
females (70.5%), while the wholesale and retail; repair of motor vehicles and motorcycles
employs more females (10.6%) than male (5.4%). Also, manufacturing employs more
females (6.0%) than males (3.5%).
9.2.10 Agricultural Activities
The data shows that 13,230 (81.7%) households are engaged in agricultural activities. A high
proportion (91.4%) of households engaged in agriculture is located in the rural areas and 73.1
percent is in urban localities. Most households in the district are into crop farming (99%).
Among the livestock rearing, 58.1 percent are into chicken rearing.
9.2.11 Information and Communication Technology
The 2010 PHC result shows that 41.8 percent of persons 12 years and older, own mobile
phones in the district. The data further indicates that, out of the 26,439 males 12 years and
older in the district 48.4 percent who own mobile phones and of the 30,134 females 12 years
and older 36.1 percent own mobile phones. Only 2.2 percent of persons 12 years and older
use internet in Jaman North district. A small percentage of males (3.6%) and females (1.1%)
12 years and older use internet facility in the district.
9.3 Housing Conditions
Housing Stock
The total stock of houses in the District is 10,020 of which 5,507 are located in the rural areas
compared with 4,513 in the urban areas. The data further shows that out of 16,198,

63
households 7,583 are in the rural areas as compared with 8,615 in the urban areas of the
District.
Dwelling Units
The 2010 PHC data show that 69.0 percent of the households live in compound houses while
24.7 percent of the households live in separate house. More households headed by females
(71.7 %) live in compound houses compared with male headed households (67.7 %). The
data further indicate that more households live in compound house (rooms) in urban areas
(72.7 %) compared with rural areas (65.7 %). Also, majority of households live in separate
house in rural areas (28.7 %) compared with urban areas (21.1 %). Less than one percent
(0.1%) of households lives in improvised homes in the district.
Construction Materials
The two main construction materials for outer walls in the District are cement
blocks/concrete (46.0%) and mud brick/earth (46.7%). In rural areas, however, 60.3 percent
of outer walls are made of mud brick/earth as compared to 34.4 percent in urban areas.
Ownership of Dwellings
The 2010 Census result indicates a total of 16,198 households in the District and shows that
dwelling units owned by household member constituted the majority representing 45.7%.
About 49.3 percent of dwelling owned by household members are headed by males of same
dwelling unit and 40.9 percent represents dwelling units in the district headed by female
household member. However, a greater proportion of a household member owning a
dwelling unit was more in the rural areas (58.0%) than in the urban (34.8%) centers.
Room Occupancy
It was also discovered that 53.8 percent of all the households in the District occupy one
sleeping room, followed by two and three sleeping rooms with 22.2 and 11.2 percent
respectively. Households occupying nine sleeping rooms and more in the District accounted
for only 1.1 percent.
Household Facilities and Amenities
Main source of household lighting
The 2010 PHC results indicated that the main sources of lighting for households in the Jaman
North District are Flashlight/Touch (48.6%) and electricity (44.3%). The data generated on
the district shows that, 63.9 percent of households in the urban areas use electricity as their
main source of lighting as compared with 22.1 percent rural dwellers. Gas lamp, solar energy,
crop residue and other constitute less than one percent of households that use these as their
main source of lighting.
Main source of cooking fuel
The majority of households use wood as their main source of cooking fuel (72.4 %), followed
by charcoal (15.9 %), and gas (3.8 %) The use of other sources such as kerosene, crop residue
and electricity are represented by minimal proportions. In rural areas, because wood is
locally available, it is the main source of cooking fuel for 89.5 percent of households
compared with 57.3 percent in urban areas.

64
Cooking space used by household
The most common type of cooking space for the households is separate rooms for the
exclusive use of households. About one in two households (29.6% %) have cooking space
that are for the exclusive use of households in the district while more than one-quarter
(29.5%) of households use open spaces in their compounds as cooking space. In urban areas,
the proportion of households that have separate rooms for their exclusive only is lower
(22.4%) than rural (37.8%) areas. Similarly, the households that cook in the open space and
veranda in the district are higher in urban areas (15.2%) than in rural areas (4.8%).
Source of water for drinking and other domestic use
The various water sources are classified by their quality level in relation to their health effects
on the consumer. According to the Ghana Medium Development Goal Report (2012) an
indicator referred to as ‘improved water sources’ measures the percentages of the population
who use any of the following types of water supply for drinking: piped water, public tap,
borehole or pump, protected well, protected spring or rain water. Improved water sources do
not include vendor-provided water, bottled water, tanker trucks or unprotected wells and
springs.
There are three main sources of water supply to households for drinking and other domestic
uses. These are public tap/standpipe, pipe-borne outside dwelling and bore-hole pump/tube
well. Also, Public tap/standpipe, pipe-borne outside dwelling are commonly used for both
drinking and domestic in urban and rural areas. However, bore-hole/pump/tube well is one of
the common sources of water that households use for drinking (55.3%) and domestic
purposes (54.2%) in rural areas than urban areas in the District.
Toilet facilities
In terms of toilet and bathing facilities, the 2010 PHC results show that pit latrine and public
toilet facilities are the most dominant toilet facility used by majority of households in the
District. Pit latrines are used by 17.5 percent of the households in the District and 56.6
percent use public toilet facilities. A further 9.2 percent of the households in the District have
no access to any type of toilet facility and therefore resort to open defecation which is more
prominent in households in urban areas (10.3%) than among the rural households (7.9%). The
2010 PHC results also show that 51.4 percent of the urban households depend on public
toilets as compared to 62.6 percent of their rural counterparts.
Bathing Facilities
The data also show that almost two-thirds of the households in the District have their own
bathroom for exclusive use, 5.0 and 41.6 percent of the households use private open cubicles
and shared separate bathroom in the same house respectively. More urban (19.4%) than rural
households (14.7%) use shared open cubicles for bathing.
Solid waste and liquid waste disposal
The most common method of solid wastes disposal in the Jaman North District is by public
dump/open Space (74.7%), 1.2 percent of the household burn their refuse while about 2.2
percent also dump their waste indiscriminately. On liquid waste disposal, 61.5 percent of
households in the District dispose of their liquid waste by through it throwing onto
street/outside while 34.0 percent dispose of their liquid waste by throwing unto the
compound.

65
9.4 Conclusion
The Jaman North district is largely urban. Most of its periphery settlements have access to
most of the basic amenities such as portable water, basic schools and infrastructure, Health
facilities and other social services but with poor communication networks whiles most of the
surrounding communities lack electricity connectivity to the national grid. However, it must
also be stated that the district is saddled with bad road network system which makes
accessibility of certain parts of the district such as the rural parts difficult if not impossible
especially during the rainy season.
Nonetheless, one would have expected that the low level of non-literate males would have
had a corresponding effect on job creation and high unemployment. Surprisingly, the district
has 96.8% of its people above 15 years and older employed. Again, 70.3 percent of the
people in the district are economically active. The dependency ratio in the district is 83.0
persons in the dependent population to 100 persons in the working age group.This is an
indication that the Jaman North has a dependent population which has both economic and
social implications for the district especially a situation in which the demographic dynamics
of the district is pointing to high birth rates, and in-migration.
Additionally, it can be inferred that the district is fast growing in terms of business and trade
(example, Cashew trade) eventually promoting the living standards of the people in the
district. This is due to its strategic location in sharing borders with neighboring La Cote
d’Ivoire which makes it a destination point of other mercantile businesses. This has translated
to the high number of its populace being engaged in informal business and transport services.
However, the creation of these businesses does not lead to the engagement of more hands
since they are mostly small in nature and manual in operation.
9.5 Recommendations for Policy Implications
The following are suggested and recommended for policy formulation and implementation;
the data collected has provided the basis for several policies which when implemented will
improve the standard of living of the people in the district. The fCUBE, School Feeding
Programme and the distribution of free school uniform to the poor must be intensified to
make basic education attractive to promote education and minimise school drop-out in the
district. Vocational and technical education must be promoted to secure the youth in
employment after school.
The health department of Ghana Health Service should intensify health policies on family
planning and contraceptive use to help check the rate of population growth especially among
the teenagers. Immunization policies and sensitization progammes should be extended
beyond the health centres to include platforms such as community durbars, radio discussions,
church visits etc.
Sanitation bye -laws and policies should be intensified as well as more rubbish containers
should be provided by the District Assembly to the various communities to promote refuse
collection. The statutory planning committee and other concerned bodies should insist on
household toilet facility in building plans to reduce the dependency on public toilet and open
defecation.
People in the district should be encouraged to use Liquefied Petroleum Gas (LPG) in cooking
instead of wood which has some health hazard and also leads to deforestation. The District
Assembly should endeavour to provide pipe borne water to more communities and also more

66
houses should be connected to the national grid (electricity) which will help promote learning
after school and setting up of manufacturing enterprises.
There is the need to encourage the use of the internet especially by the youth possibly through
equipping the educational institutions with computer laboratories and the construction of
community information centres all with internet access.
Accessibility to schools and workplaces should be improved for persons with disabilities in
the district especially for persons who are physically challenged.
The district faces deforestation due to the predominance of traditional farming systems and
the felling of trees for fire wood and charcoal. The Assembly and the Forestry Commission in
collaboration with appropriate Ministries need to enforce policies and bye-laws to promote
mechanized farming to control the rapid rate of deforestation.
Attention and resources must be committed to providing portable and improved water source
for rural folks. The District Assembly in collaboration with the relevant agencies must
provide safe sanitation infrastructure (skip bins, public toilets) and carry out community
education and sensitization on safe sanitation practices to prevent epidemics.
The District Assembly in collaboration with the Ministry of Roads and Transport should
construct roads especially in the rural areas of the district to ensure that people have access
to markets since majority of the people engaged in agricultural activities are from these areas.
This would open up the district capital for the farmers to transport their goods to the market
centres.
Priority should be given to entrepreneurship training to people and they should be adequately
resourced with capital to enable them establish and expand businesses that can employ more
hands. In fact, the district has the potential of completely eradicating poverty and
unemployment through business and trade if the necessary business principles are applied.
The quality of life of the people in the communities in the District depends largely on access
to good drinking water, electricity, and adequate sanitary facilities among others. The report
shows however that, access to these facilities tends to be poor and non-existent in most
homes. It is therefore recommended that District Assembly in collaboration with non-
governmental organizations operating in the water sector need to target underserved
communities to provide more bore-holes. This will ensure access to portable water for those
communities.
Households should be encouraged to construct their own toilet facilities within their
dwellings. Health and hygiene education should be intensified with the involvement of the
communities. This awareness can hopefully influence the attitude of the households towards
a more sustainable environmental hygiene.

67
REFERENCES
Arthur Haupt and Thomas T. Kane, PRB. Population Handbook, 2004
Ghana Statistical Service (2012), 2010 Population and Housing Census Summary Report of
Final Results, May 2012 (2012b), the 2010 GSS National Report on Disability
Ghana Statistical Service (2013), 2010 Population and Housing Census: National Analytical
Report, May 2013
GSS, 2010 PHC, Regional Analytical Report, Brong Ahafo Region, June 2013
Jaman North District MTDP 2010-2013, 2010

68
APPENDICES
Table A.1: Distribution of households engaged in tree growing or crop
farming by type of crop and population engaged
House-
holds
Population in occupied
units
Population engaged in
agricultural activities
Activity/ Type of crop Total Male Female Total Male Female
Total households in occupied units 16,198 82,074 39,391 42,683
24,799 11,844 12,955
Households engaged in agricultural
activities 13,230 73,406 35,287 38,119
24,799 11,844 12,955
Households engaged in crop farming or
tree growing 13,109 72,903 35,052 37,851
24,588 11,740 12,848
Households engaged in crop farming 13,103 72,875 35,041 37,834
24,578 11,734 12,844
Households engaged in tree growing 192 1,206 597 609
480 252 228
Agro forestry (tree planting) 192 1,206 597 609
480 252 228
Alligator pepper 35 206 100 106
81 40 41
Apples 4 21 11 10
6 3 3
Asian vegetables (e.g. tinda, cauliflower) 12 82 43 39
23 13 10
Avocado 6 31 14 17
17 11 6
Banana 11 76 37 39
22 11 11
Beans 123 786 403 383
297 150 147
Black pepper 6 36 16 20
9 5 4
Black berries 2 12 4 8
2 2 0
Cabbage 9 46 25 21
23 11 12
Carrot 61 347 163 184
124 61 63
Cashew 8,288 48,828 23,847 24,981
16,060 7,932 8,128
Cassava 6,983 40,846 19,599 21,247
13,716 6,416 7,300
Citronella 15 112 36 76
51 18 33
Citrus 45 325 178 147
100 60 40
Cloves 6 42 25 17
16 7 9
Cocoa 3,142 21,408 10,581 10,827
7,124 3,546 3,578
Coconut 57 345 157 188
127 50 77
Cocoyam 1,453 8,491 3,903 4,588
2,930 1,254 1,676
Cocoyam / Taro (kooko) 98 485 239 246
181 83 98
Coffee 4 26 13 13
7 4 3
Cola 7 44 20 24
13 6 7
Cotton 7 54 25 29
14 6 8
Cucumber 8 62 36 26
19 11 8
Egg plant 15 91 38 53
36 15 21
Garden eggs 297 1,948 916 1,032
724 310 414
Ginger 2 2 2 0
0 0 0
Groundnut 231 1,543 772 771
601 280 321
Guava 23 190 103 87
59 33 26

69
Table A.1: Distribution of households engaged in tree growing or crop
farming by type of crop and population engaged (Cont’d)
Activity/ Type of crop
House-
holds
Population in occupied
units
Population engaged in
agricultural activities
Total Male Female Total Male Female
Kenaf 3 9 3 6 3 1 2
Lemon grass 1 14 9 5
8 8 0
Lettuce 2 10 4 6
4 2 2
Maize 2,424 14,111 7,150 6,961
5,233 2,743 2,490
Mango 3 19 6 13
5 3 2
Melon (agusi) 3 8 4 4
4 4 0
Millet 37 220 121 99
74 40 34
Oil palm 186 1,289 670 619
469 252 217
Okro 850 5,535 2,582 2,953
1,875 810 1,065
Onion 31 205 97 108
85 45 40
Pawpaw 3 23 12 11
12 7 5
Peas 10 39 17 22
19 8 11
Pepper 2,321 13,636 6,374 7,262
4,757 1,996 2,761
Pineapple 59 379 191 188
106 64 42
Plantain 953 5,799 2,764 3,035
2,021 935 1,086
Potatoes 7 50 28 22
21 14 7
Rice 94 589 301 288
153 112 41
Sorghum 1 7 3 4
1 1 0
Soya beans 18 126 64 62
31 19 12
Sugarcane 7 33 24 9
12 8 4
Sun flower 2 12 2 10
2 0 2
Tiger nut 5 45 30 15
19 8 11
Tobacco 11 46 24 22
22 11 11
Tomatoes 385 2,394 1,100 1,294
870 368 502
Water melon 14 112 54 58
31 11 20
Yam 9,532 54,962 26,502 28,460
18,630 8,844 9,786
Other 681 4,294 2,188 2,106 1,381 727 654
Source: Ghana Statistical Service, 2010 Population and Housing Census

70
Table A2: Total population, Sex, number of households and houses
in the 20 largest communities
Community Name
Sex
S/No Total Male Female Households Houses
1 Sampa 15,119 7,248 7,871
3,783 1,511
2 Duadaso No.2 7,387 3,598 3,789
1,199 643
3 Duadaso No.1 5,623 2,668 2,955
788 535
4 Suma Ahenkro 5,291 2,549 2,742
831 383
5 Goka 5,148 2,377 2,771
1,090 841
6 Asiri 5,028 2,396 2,632
924 600
7 Kokoa 4,444 2,129 2,315
795 412
8 Jamera 3,959 1,972 1,987
562 423
9 Kabile 2,950 1,464 1,486
562 405
10 Jankufa 2,366 1,129 1,237
492 312
11 Buni 2,307 1,069 1,238
403 388
12 Asuokor-Akoata 2,159 975 1,184
434 357
13 Mayera 2,086 957 1,129
474 247
14 Adadiem 2,018 1,037 981
424 269
15 Seketia 1,849 841 1,008
347 242
16 Morle 1,705 811 894
295 252
17 Bonakire 1,392 722 670
313 195
18 Koti 1,009 490 519
188 135
19 Nsonsomea 994 460 534
191 120
20 Yaw Twenekrom 949 481 468 230 192
Source: Ghana Statistical Service, 2010 Population and Housing Census

71
Table A3: Population by age groups in the 20 largest communities
Community
Name
Age Group
S/No
All
ages 0-4 5-9 10-14 15-19 20-24 25-29 30-34 35-39 40-44 45-49 50-54 55-59 60-64 65-69 70-74 75+
1 Sampa 15,119 1,919 1,906 1,910 1,955 1,664 1,312 971 796 622 552 383 275 195 128 162 369
2 Duadaso No.2 7,387 931 1,080 1,081 937 767 605 380 269 271 215 223 107 139 69 122 191
3 Duadaso No.1 5,623 587 722 726 717 697 535 353 268 220 174 181 103 90 66 72 112
4 Suma Ahenkro 5,291 596 618 697 745 622 474 332 272 191 159 136 96 91 55 79 128
5 Goka 5,148 511 620 737 681 521 353 274 271 228 171 203 107 123 90 105 153
6 Asiri 5,028 596 717 732 687 545 383 245 185 153 148 168 102 104 40 111 112
7 Kokoa 4,444 484 559 650 637 498 311 266 179 197 141 129 72 73 63 90 95
8 Jamera 3,959 546 577 537 449 373 282 217 212 137 120 98 86 83 59 62 121
9 Kabile 2,950 432 448 409 354 259 198 153 142 142 72 87 58 57 31 42 66
10 Jankufa 2,366 308 337 327 294 202 125 122 107 97 88 72 45 45 39 60 98
11 Buni 2,307 210 322 359 316 195 143 96 105 80 75 83 62 66 43 61 91
12
Asuokor-
Akoata 2,159 268 330 331 233 183 116 107 84 89 78 63 57 52 37 51 80
13 Mayera 2,086 250 310 334 224 150 133 104 89 68 68 80 48 59 31 65 73
14 Adadiem 2,018 296 316 297 219 163 109 93 105 71 84 59 40 35 36 29 66
15 Seketia 1,849 211 277 309 243 159 110 104 61 63 63 69 41 30 25 39 45
16 Morle 1,705 210 226 217 203 160 141 87 66 68 55 60 49 38 33 34 58
17 Bonakire 1,392 199 203 181 155 86 86 66 66 51 51 73 50 27 25 36 37
18 Koti 1,009 128 139 120 145 120 83 53 34 27 39 28 26 24 12 10 21
19 Nsonsomea 994 124 132 146 126 73 46 52 53 43 42 35 19 24 11 9 59
20
Yaw
Twenekrom 949 172 113 85 75 84 76 71 52 51 32 31 28 26 10 15 28
Source: Ghana Statistical Service, 2010 Population and Housing Census

72
LIST OF CONTRIBUTORS
Project Secretariat
Dr. Philomena Nyarko, Government Statistician
Mr. Baah Wadieh, Deputy Government Statistician
Mr. David Yenukwa Kombat, Acting Census Coordinator
Mr. Sylvester Gyamfi, DISDAP Project Coordinator
Mrs. Abena A. Osei-Akoto, Data Processing
Mr. Rochester Appiah Kubi Boateng, Data Processing
Mrs. Jacqueline Anum, Data Processing
Mrs. Samilia Mintah, Data Processing
Mr. Yaw Misefa, Data Processing
Mr. Ernest Enyan, Data Processing
Mr. Omar Seidu, Regional Statisticain
Mr. Emmanuel George Ossei, Regional Statistician
Ms. Hanna Frempong Konadu, Formatting/Typesetting
Mrs. Justina Yeboah, Formatting/Typesetting
Writers
Patrich Asamoah
Jonathan Akparibo Appiah
Consultant
Dr. Marjorie Danso-Manu
Editor/ Reviewers
Dr. Joseph A. Yaro
Mr. Gershon Togoh
Mr. Emmanuel Boateng