jan original research
TRANSCRIPT
Impact of hospital nursing care on 30-day mortality for acute medical
patients
Ann E. Tourangeau1, Diane M. Doran2, Linda McGillis Hall3, Linda O’Brien Pallas4, Dorothy Pringle5,
Jack V. Tu6 & Lisa A. Cranley7
Accepted for publication 14 August 2006
1Ann E. Tourangeau PhD RN
Assistant Professor and Career Scientist
Faculty of Nursing, University of Toronto,
Toronto, Ontario, Canada
2Diane M. Doran PhD RN FCAHS
Professor
Faculty of Nursing, University of Toronto,
Toronto, Ontario, Canada
3Linda McGillis Hall PhD RN
Associate Professor and Associate Dean,
Research
Nursing & Health Services Research Unit,
University of Toronto, Toronto, Ontario,
Canada
4Linda O’Brien Pallas PhD RN FCAHS
Professor
Nursing & Health Services Research Unit,
University of Toronto, Toronto, Ontario,
Canada
5Dorothy Pringle PhD RN
Professor Emeritus
Faculty of Nursing, University of Toronto,
Toronto, Ontario, Canada
7Lisa A. Cranley MN RN
Doctoral Candidate
Faculty of Nursing, University of Toronto,
Toronto, Ontario, Canada
6Jack V. Tu MD PhD
Senior Scientist
Institute for Clinical Evaluative Sciences in
Ontario and
Professor
Faculty of Medicine, University of Toronto,
Toronto, Ontario, Canada
Correspondence to Ann E. Tourangeau:
e-mail: [email protected]
TOURANGEAU A.E. , DORAN D.M., MTOURANGEAU A.E. , DORAN D.M., MccGILLIS HALL L. , O’BRIEN PALLAS L. ,GILLIS HALL L. , O’BRIEN PALLAS L. ,
PRINGLE D., TU J.V. & CRANLEY L.A. (2007)PRINGLE D., TU J.V. & CRANLEY L.A. (2007) Impact of hospital nursing care on
30-day mortality for acute medical patients. Journal of Advanced Nursing 57(1),
32–44
doi: 10.1111/j.1365-2648.2006.04084.x
AbstractTitle. Impact of hospital nursing care on 30-day mortality for acute medical patients
Aim. This paper reports on structures and processes of hospital care influencing
30-day mortality for acute medical patients.
Background. Wide variation in risk-adjusted 30-day hospital mortality rates for acute
medical patients indicates that hospital structures and processes of care affect patient
death. Because nurses provide the majority of care to hospitalized patients, we propose
that structures and processes of nursing care have an impact on patient death or survival.
Method. A model hypothesizing the impact of nursing-related hospital care structures and
processes on 30-daymortalitywas tested. Patient data from the Ontario, Canada Discharge
Abstract Database 2002–2003, nurse data from the Ontario Nurse Survey 2003, and
hospital staffing data from the Ontario Hospital Reporting System 2002–2003 files were
used to develop indicators for variables hypothesized to impact 30-day mortality. Two
multiple regression models were implemented to test the model. First, all variables were
forced to enter the model simultaneously. Second, backward regression was implemented.
Findings. Using backward regression, 45% of variance in risk-adjusted 30-day mor-
tality rates was explained by eight predictors. Lower 30-day mortality rates were
associated with hospitals that had a higher percentage of Registered Nurse staff, a
higher percentage of baccalaureate-prepared nurses, a lower dose or amount of all
categories of nursing staff per weighted patient case, higher nurse-reported adequacy
of staffing and resources, higher use of care maps or protocols to guide patient care,
higher nurse-reported care quality, lower nurse-reported adequacy of manager ability
and support, and higher nurse burnout.
Conclusion. Just as hospitals and clinicians caring for patients focus carefully on
completing accurate diagnosis and appropriate and effective interventions, so too
should hospitals carefully plan and manage structures and processes of care such as
the proportion of Registered Nurses in the staff mix, percentage of baccalaureate-
prepared nurses, and routine use of care maps to minimize unnecessary patient death.
Keywords: care maps, care protocols, hospital structures, mortality rates, nurse
staffing, quality of care, questionnaire survey, secondary data analysis
ORIGINAL RESEARCHJAN
32 � 2006 The Authors. Journal compilation � 2006 Blackwell Publishing Ltd
Introduction
Wide variation in risk and case mix adjusted hospital
mortality rates for homogeneous patient populations indi-
cates that some hospitals are able to provide patient care in
such a way as to avoid unnecessary patient death (Tourang-
eau & Tu 2003). There are three known sources of variation
in outcomes such as mortality: patients’ own characteristics,
structures and processes of care, and random variation (Silber
et al. 1995). Of these, patients’ own characteristics have been
shown to have the greatest impact (Silber & Rosenbaum
1997). Once the impact of patients’ own characteristics have
been controlled using effective risk adjustment strategies, the
impact of hospital structures and processes of care on patient
death can be examined. In this paper, we report on those
structures and processes of hospital care found to impact 30-
day mortality rates for acute medical patients. Our findings
may be useful globally to develop strategies that manage
nursing care structures and processes to minimize unneces-
sary patient death for acute medical patients.
Background
An electronic search using MEDLINE and CINAHL data-
bases between 1986 and 2004 was conducted to retrieve
literature related to the impact of nursing structures and
processes of hospital care on patient mortality. Detailed
results of this search are documented elsewhere (Tourangeau
et al. 2006a). One additional study report published in 2005
was added to our integrated review. A synthesis of 16
published research reports exploring nursing-related corre-
lates of mortality after acute care hospitalization yielded five
categories of correlates: nurse staffing, nurse–physician rela-
tionships, nurse characteristics, clinical nursing support, and
the nursing practice environment (Tourangeau et al. 2006a).
The most consistently explored nursing-related determi-
nant of hospital mortality rates was nurse staffing, both staff
mix and nurse staffing dose (total amount of all categories of
nursing personnel per some patient output measure). Some
studies included indicators of both. However, moderately
strong relationships have been found between indicators of
nursing staff mix and nursing staff dose (Tourangeau et al.
2002). Since 1989, there has been strong evidence that a
nursing staff mix richer with Registered Nurses is related to
lower hospital mortality rates (Hartz et al. 1989, Farley &
Ozminkowski 1992, Manheim et al. 1992, Schultz 1997,
Aiken et al. 2002, Needleman et al. 2002, Tourangeau et al.
2002, Estabrooks et al. 2005). Shortell and Hughes (1988)
and Shortell et al. (1994) did not find evidence of this
relationship. There is less evidence supporting a relationship
between nurse staffing dose and hospital mortality rates.
Blegen et al. (1998) found a positive relationship between the
total amount of nurse staffing and hospital mortality,
indicating that as the total amount of nursing staff increased
so did mortality rates. Sasichay-Akkadechanunt et al. (2003)
found a negative relationship between the total amount of
nursing staff and mortality in 17 medical and surgical units in
Thailand.
One of the earliest studied nursing-related categories of
factors impacting hospital mortality rates was that of nurse–
physician relationships. An association has been reported
between nurse-reported adequacy of relationships with phy-
sicians and hospital mortality rates in three North American
studies (Knaus et al. 1986, Mitchell et al. 1989, Estabrooks
et al. 2005).
More recently, researchers have hypothesized that nurse
characteristics such as clinical experience and educational
preparation are related to hospital mortality rates. Two reports
have included indicators of nurse experience in their analytic
models. Tourangeau et al. (2002) found that more years
experience on current clinical units by Registered Nurses was
associated with lower mortality rates across Ontario, Canada
hospitals. However, Sasichay-Akkadechanunt et al. (2003)
did not find a relationship between overall years of nurse
experience and patient mortality. A second nurse characteristic
hypothesized as a correlate of mortality rates is that of
Registered Nurse educational preparation. Three studies have
included indicators of nurse baccalaureate preparation, with
conflicting results. Both Aiken et al. (2003) and Estabrooks
et al. (2005) reported finding an inverse relationship between
baccalaureate preparation of nursing staff and mortality rates.
The higher the proportion of baccalaureate-prepared
nurses, the lower were hospital mortality rates. Sasichay-
Akkadechanunt et al. (2003) did not find evidence to support
this relationship.
In two studies, it was hypothesized that the amount or
quality of clinical support for nurses providing direct care
was related to hospital mortality rates. Knaus et al. (1986)
reported that intensive care units in American hospitals with
the lowest mortality rates had comprehensive nursing
educational systems such as clinical nurse specialists, and
that those with the highest mortality rates did not have such
clinical support systems. Tourangeau et al. (2002) found no
evidence of a relationship between the amount of nurse-
reported clinical support and mortality rates in Ontario
hospitals.
In two studies, hypotheses were tested of relationships
between various aspects of nursing work environments and
hospital mortality. Examples of indicators of nursing work
environments included: nurse autonomy, nurse control over
JAN: ORIGINAL RESEARCH Impact of nursing on patient mortality
� 2006 The Authors. Journal compilation � 2006 Blackwell Publishing Ltd 33
the practice setting, and nurse manager ability and support.
Conflicting results were found. Aiken et al. (1994) found that
magnet hospitals characterized by having stronger profes-
sional nursing practice environments had lower mortality
rates. Tourangeau et al. (2002) did not find a relationship
between the condition of the nursing practice environment
and mortality rates in Ontario hospitals.
A number of studies also examined the impact of
physician characteristics, particularly physician expertise.
Three of five studies retrieved found an inverse relationship
between physician expertise, commonly measured as the
percentage of board-certified physicians, and hospital
mortality rates (Hartz et al. 1989, Farley & Ozminkowski
1992, Manheim et al. 1992). No evidence of a relationship
between physician expertise and hospital mortality rates
was found in two studies (Schultz 1997, Tourangeau et al.
2002).
Increasing attention has been focused in the research
literature over the past two decades on the impact of nursing
care on hospitalized patient mortality and survival. However,
the relatively small number of studies has yielded inconsistent
and incomplete knowledge of the impact of hospital struc-
tures and processes on patient mortality.
Conceptual model
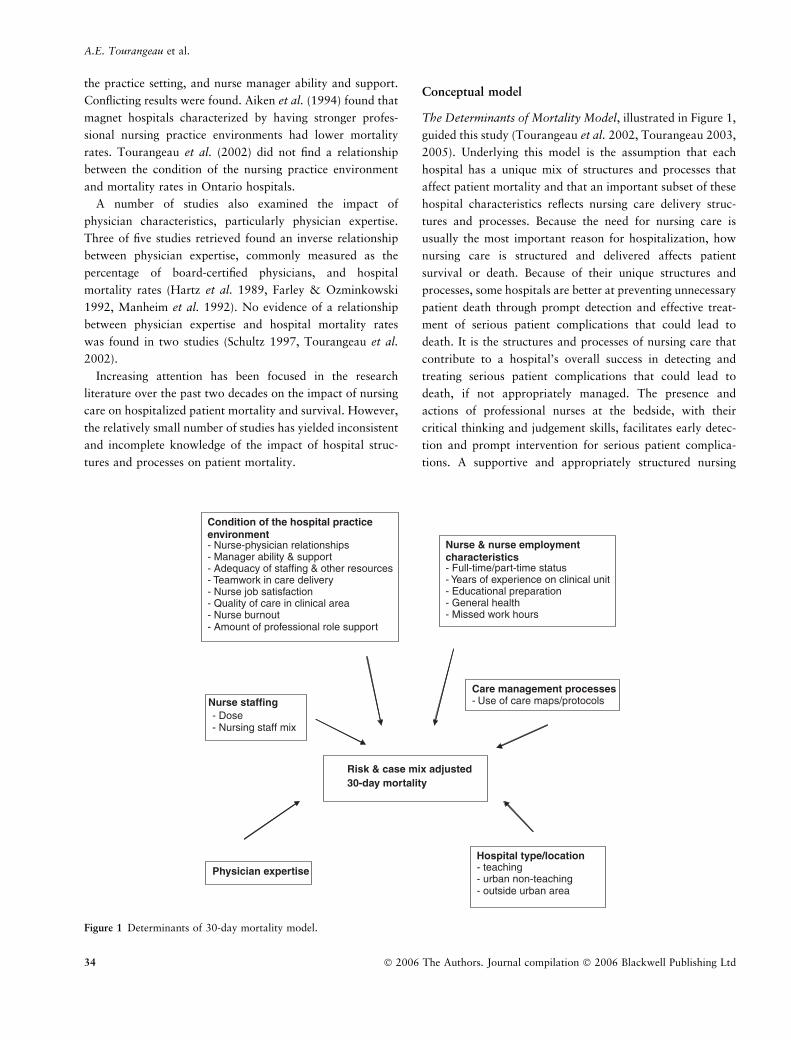
The Determinants of Mortality Model, illustrated in Figure 1,
guided this study (Tourangeau et al. 2002, Tourangeau 2003,
2005). Underlying this model is the assumption that each
hospital has a unique mix of structures and processes that
affect patient mortality and that an important subset of these
hospital characteristics reflects nursing care delivery struc-
tures and processes. Because the need for nursing care is
usually the most important reason for hospitalization, how
nursing care is structured and delivered affects patient
survival or death. Because of their unique structures and
processes, some hospitals are better at preventing unnecessary
patient death through prompt detection and effective treat-
ment of serious patient complications that could lead to
death. It is the structures and processes of nursing care that
contribute to a hospital’s overall success in detecting and
treating serious patient complications that could lead to
death, if not appropriately managed. The presence and
actions of professional nurses at the bedside, with their
critical thinking and judgement skills, facilitates early detec-
tion and prompt intervention for serious patient complica-
tions. A supportive and appropriately structured nursing
Nurse staffing- Dose- Nursing staff mix
Nurse & nurse employmentcharacteristics - Full-time/part-time status- Years of experience on clinical unit- Educational preparation- General health- Missed work hours
Condition of the hospital practiceenvironment - Nurse-physician relationships- Manager ability & support- Adequacy of staffing & other resources- Teamwork in care delivery- Nurse job satisfaction- Quality of care in clinical area- Nurse burnout- Amount of professional role support
Physician expertise
Care management processes- Use of care maps/protocols
Hospital type/location- teaching- urban non-teaching- outside urban area
Risk & case mix adjusted 30-day mortality
Figure 1 Determinants of 30-day mortality model.
A.E. Tourangeau et al.
34 � 2006 The Authors. Journal compilation � 2006 Blackwell Publishing Ltd
work environment leads to prevention of unnecessary patient
death. In this model, we hypothesized that the following
categories of hospital organizational characteristics have an
impact on hospital mortality rates: nurse staffing, condition
of the hospital nursing practice environment, nurse and nurse
employment characteristics, hospital type and location, and
physician expertise. Indicator variables for each model
concept were included in this study.
The study
Aim
The aim of the study was to answer the research question:
What are the nursing-related determinants of risk-adjusted
30-day mortality for acute medical patients in hospitals in
Ontario, Canada? Listed below are 16 research hypotheses
flowing from this research question. Lower 30-day mortality
rates will be related to the following hospital characteristics:
• Higher proportion of Registered Nurses in nursing staff
mix.
• Lower nurse staffing dose.
• Higher proportion of full-time nursing staff.
• Higher years of nurse experience on current clinical units.
• Higher proportion of baccalaureate-prepared nurses.
• Higher nurse-reported level of health.
• Fewer missed work hours.
• Higher nurse-reported relationships with physicians.
• Higher nurse-reported manager ability and support.
• Higher nurse-reported adequacy of staffing and resources.
• Higher nurse-reported use of teamwork when delivering
care.
• Higher nurse-reported job satisfaction.
• Higher nurse-reported quality of care.
• Lower nurse burnout.
• Higher nurse-reported availability of professional role
support.
• Higher use of care maps/protocols.
Design
A retrospective design guided this study. Data sources included
large clinical and administrative secondary databases and
nurse survey data collected specifically for this study. This
study occurred in two phases. In phase 1 (year 2003), we
surveyed nurses working in medical and combined medical–
surgical units in Ontario teaching and community hospitals. In
phase 2 (year 2004–2005), we linked nurse survey data with
secondary sources of patient and hospital data to test the
hypothesized model.
Participants
All Ontario teaching and community hospitals that existed
throughout 2002–2003 were included. Small hospitals and
specialty hospitals such as paediatric and psychiatric hospi-
tals were excluded. Small hospitals were excluded because
they discharge fewer than 100 patients yearly with the acute
medical diagnosis categories included in this study. Specialty
hospitals were excluded because they did not provide care
for adult acute medical patients. In Ontario, acute care
hospitals are categorized as teaching, community or small
(Baker et al. 1999). Teaching hospitals are designated as
such by the Ontario Council of Teaching Hospitals because
of their affiliation with an Ontario university that provides
medical education. Community hospitals discharge at least
3500 weighted patient cases yearly. Small hospitals dis-
charge fewer than 3500 weighted patient cases yearly.
‘Weighted cases’ is an expression that reflects standardized
patient volume based on their relative resource consump-
tion. The final sample consisted of nine teaching and 66
community hospitals.
Study patients were discharged between 1 April 2002 and
31 March 2003 from the sample hospitals with a most
responsible diagnosis in one of four diagnostic groups: acute
myocardial infarction, stroke, pneumonia, or septicaemia.
These patient groups were selected because these conditions
are acute in nature, have high volumes, and have high crude
death rates. Patients also had to be Ontario residents and
20 years of age or older. Those with a pre-existing diagnosis
of cancer or HIV were excluded. The final sample consisted
of 46,993 patients. For each of the four diagnostic groups,
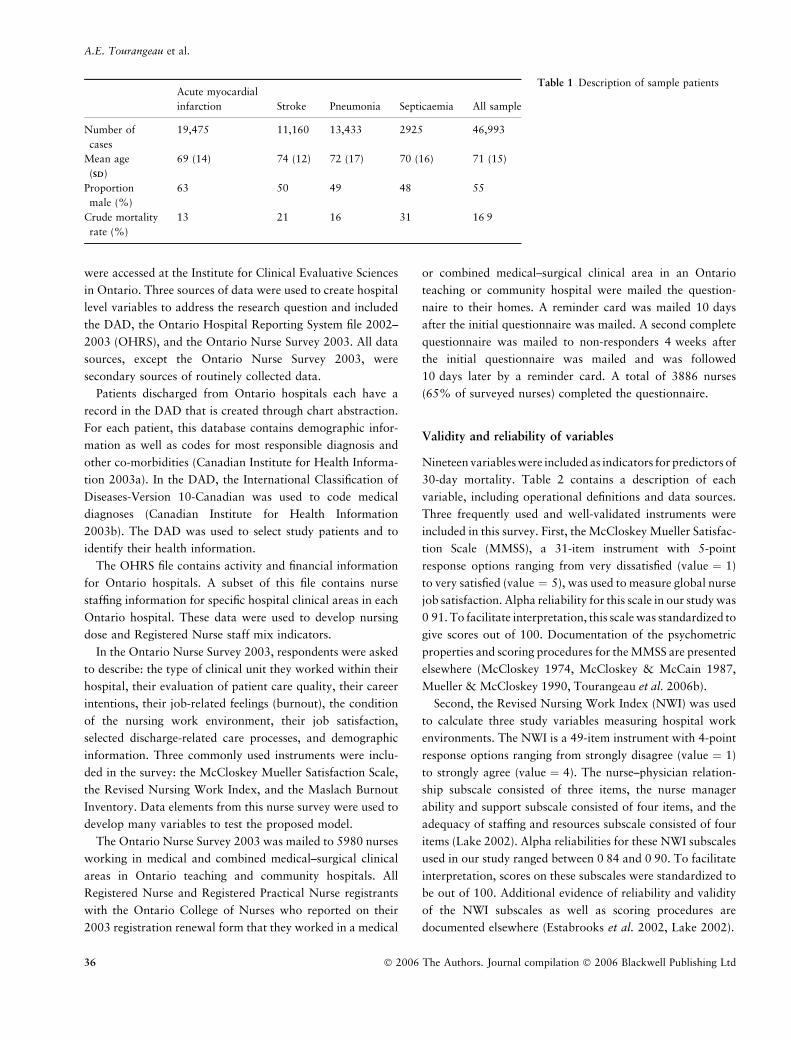
Table 1 lists the number of study patients, mean patient age,
sex, and crude mortality rate.
All nurses employed in Ontario teaching and community
acute care hospitals who worked in medical and combined
medical–surgical clinical areas were surveyed (n ¼ 5980)
between February and May 2003.
Data collection
Four data sources were used to calculate risk and case mix
adjusted hospital 30-day mortality rates: the Ontario Dis-
charge Abstract Database 2002–2003 (DAD) to select
patients and their health information, Statistics Canada
2001 Population files to assign each patient one of five
socioeconomic level indicators, the Ontario Hospital Insur-
ance Plan database to develop proxy indicators for each
patients’ general preadmission health status, and the Ontario
Registered Persons Database to identify dates of death for
patients within 30 days of hospital admission. Databases
JAN: ORIGINAL RESEARCH Impact of nursing on patient mortality
� 2006 The Authors. Journal compilation � 2006 Blackwell Publishing Ltd 35
were accessed at the Institute for Clinical Evaluative Sciences
in Ontario. Three sources of data were used to create hospital
level variables to address the research question and included
the DAD, the Ontario Hospital Reporting System file 2002–
2003 (OHRS), and the Ontario Nurse Survey 2003. All data
sources, except the Ontario Nurse Survey 2003, were
secondary sources of routinely collected data.
Patients discharged from Ontario hospitals each have a
record in the DAD that is created through chart abstraction.
For each patient, this database contains demographic infor-
mation as well as codes for most responsible diagnosis and
other co-morbidities (Canadian Institute for Health Informa-
tion 2003a). In the DAD, the International Classification of
Diseases-Version 10-Canadian was used to code medical
diagnoses (Canadian Institute for Health Information
2003b). The DAD was used to select study patients and to
identify their health information.
The OHRS file contains activity and financial information
for Ontario hospitals. A subset of this file contains nurse
staffing information for specific hospital clinical areas in each
Ontario hospital. These data were used to develop nursing
dose and Registered Nurse staff mix indicators.
In the Ontario Nurse Survey 2003, respondents were asked
to describe: the type of clinical unit they worked within their
hospital, their evaluation of patient care quality, their career
intentions, their job-related feelings (burnout), the condition
of the nursing work environment, their job satisfaction,
selected discharge-related care processes, and demographic
information. Three commonly used instruments were inclu-
ded in the survey: the McCloskey Mueller Satisfaction Scale,
the Revised Nursing Work Index, and the Maslach Burnout
Inventory. Data elements from this nurse survey were used to
develop many variables to test the proposed model.
The Ontario Nurse Survey 2003 was mailed to 5980 nurses
working in medical and combined medical–surgical clinical
areas in Ontario teaching and community hospitals. All
Registered Nurse and Registered Practical Nurse registrants
with the Ontario College of Nurses who reported on their
2003 registration renewal form that they worked in a medical
or combined medical–surgical clinical area in an Ontario
teaching or community hospital were mailed the question-
naire to their homes. A reminder card was mailed 10 days
after the initial questionnaire was mailed. A second complete
questionnaire was mailed to non-responders 4 weeks after
the initial questionnaire was mailed and was followed
10 days later by a reminder card. A total of 3886 nurses
(65% of surveyed nurses) completed the questionnaire.
Validity and reliability of variables
Nineteen variables were included as indicators for predictors of
30-day mortality. Table 2 contains a description of each
variable, including operational definitions and data sources.
Three frequently used and well-validated instruments were
included in this survey. First, the McCloskey Mueller Satisfac-
tion Scale (MMSS), a 31-item instrument with 5-point
response options ranging from very dissatisfied (value ¼ 1)
to very satisfied (value ¼ 5), was used to measure global nurse
job satisfaction. Alpha reliability for this scale in our study was
0Æ91. To facilitate interpretation, this scale was standardized to
give scores out of 100. Documentation of the psychometric
properties and scoring procedures for the MMSS are presented
elsewhere (McCloskey 1974, McCloskey & McCain 1987,
Mueller & McCloskey 1990, Tourangeau et al. 2006b).
Second, the Revised Nursing Work Index (NWI) was used
to calculate three study variables measuring hospital work
environments. The NWI is a 49-item instrument with 4-point
response options ranging from strongly disagree (value ¼ 1)
to strongly agree (value ¼ 4). The nurse–physician relation-
ship subscale consisted of three items, the nurse manager
ability and support subscale consisted of four items, and the
adequacy of staffing and resources subscale consisted of four
items (Lake 2002). Alpha reliabilities for these NWI subscales
used in our study ranged between 0Æ84 and 0Æ90. To facilitate
interpretation, scores on these subscales were standardized to
be out of 100. Additional evidence of reliability and validity
of the NWI subscales as well as scoring procedures are
documented elsewhere (Estabrooks et al. 2002, Lake 2002).
Table 1 Description of sample patientsAcute myocardial
infarction Stroke Pneumonia Septicaemia All sample
Number of
cases
19,475 11,160 13,433 2925 46,993
Mean age
(SDSD)
69 (14) 74 (12) 72 (17) 70 (16) 71 (15)
Proportion
male (%)
63 50 49 48 55
Crude mortality
rate (%)
13 21 16 31 16Æ9
A.E. Tourangeau et al.
36 � 2006 The Authors. Journal compilation � 2006 Blackwell Publishing Ltd
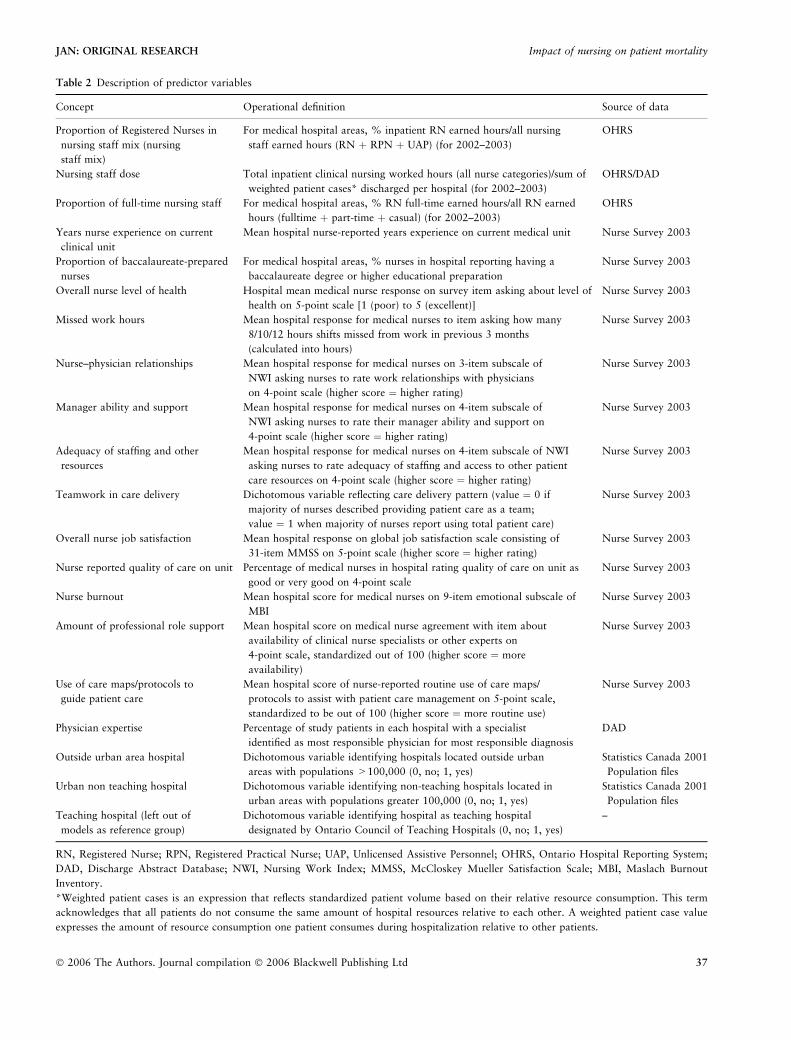
Table 2 Description of predictor variables
Concept Operational definition Source of data
Proportion of Registered Nurses in
nursing staff mix (nursing
staff mix)
For medical hospital areas, % inpatient RN earned hours/all nursing
staff earned hours (RN þ RPN þ UAP) (for 2002–2003)
OHRS
Nursing staff dose Total inpatient clinical nursing worked hours (all nurse categories)/sum of
weighted patient cases* discharged per hospital (for 2002–2003)
OHRS/DAD
Proportion of full-time nursing staff For medical hospital areas, % RN full-time earned hours/all RN earned
hours (fulltime þ part-time þ casual) (for 2002–2003)
OHRS
Years nurse experience on current
clinical unit
Mean hospital nurse-reported years experience on current medical unit Nurse Survey 2003
Proportion of baccalaureate-prepared
nurses
For medical hospital areas, % nurses in hospital reporting having a
baccalaureate degree or higher educational preparation
Nurse Survey 2003
Overall nurse level of health Hospital mean medical nurse response on survey item asking about level of
health on 5-point scale [1 (poor) to 5 (excellent)]
Nurse Survey 2003
Missed work hours Mean hospital response for medical nurses to item asking how many
8/10/12 hours shifts missed from work in previous 3 months
(calculated into hours)
Nurse Survey 2003
Nurse–physician relationships Mean hospital response for medical nurses on 3-item subscale of
NWI asking nurses to rate work relationships with physicians
on 4-point scale (higher score ¼ higher rating)
Nurse Survey 2003
Manager ability and support Mean hospital response for medical nurses on 4-item subscale of
NWI asking nurses to rate their manager ability and support on
4-point scale (higher score ¼ higher rating)
Nurse Survey 2003
Adequacy of staffing and other
resources
Mean hospital response for medical nurses on 4-item subscale of NWI
asking nurses to rate adequacy of staffing and access to other patient
care resources on 4-point scale (higher score ¼ higher rating)
Nurse Survey 2003
Teamwork in care delivery Dichotomous variable reflecting care delivery pattern (value ¼ 0 if
majority of nurses described providing patient care as a team;
value ¼ 1 when majority of nurses report using total patient care)
Nurse Survey 2003
Overall nurse job satisfaction Mean hospital response on global job satisfaction scale consisting of
31-item MMSS on 5-point scale (higher score ¼ higher rating)
Nurse Survey 2003
Nurse reported quality of care on unit Percentage of medical nurses in hospital rating quality of care on unit as
good or very good on 4-point scale
Nurse Survey 2003
Nurse burnout Mean hospital score for medical nurses on 9-item emotional subscale of
MBI
Nurse Survey 2003
Amount of professional role support Mean hospital score on medical nurse agreement with item about
availability of clinical nurse specialists or other experts on
4-point scale, standardized out of 100 (higher score ¼ more
availability)
Nurse Survey 2003
Use of care maps/protocols to
guide patient care
Mean hospital score of nurse-reported routine use of care maps/
protocols to assist with patient care management on 5-point scale,
standardized to be out of 100 (higher score ¼ more routine use)
Nurse Survey 2003
Physician expertise Percentage of study patients in each hospital with a specialist
identified as most responsible physician for most responsible diagnosis
DAD
Outside urban area hospital Dichotomous variable identifying hospitals located outside urban
areas with populations >100,000 (0, no; 1, yes)
Statistics Canada 2001
Population files
Urban non teaching hospital Dichotomous variable identifying non-teaching hospitals located in
urban areas with populations greater 100,000 (0, no; 1, yes)
Statistics Canada 2001
Population files
Teaching hospital (left out of
models as reference group)
Dichotomous variable identifying hospital as teaching hospital
designated by Ontario Council of Teaching Hospitals (0, no; 1, yes)
–
RN, Registered Nurse; RPN, Registered Practical Nurse; UAP, Unlicensed Assistive Personnel; OHRS, Ontario Hospital Reporting System;
DAD, Discharge Abstract Database; NWI, Nursing Work Index; MMSS, McCloskey Mueller Satisfaction Scale; MBI, Maslach Burnout
Inventory.
*Weighted patient cases is an expression that reflects standardized patient volume based on their relative resource consumption. This term
acknowledges that all patients do not consume the same amount of hospital resources relative to each other. A weighted patient case value
expresses the amount of resource consumption one patient consumes during hospitalization relative to other patients.
JAN: ORIGINAL RESEARCH Impact of nursing on patient mortality
� 2006 The Authors. Journal compilation � 2006 Blackwell Publishing Ltd 37
Nurse burnout was measured using the 9-item emotional
exhaustion subscale of the Maslach Burnout Inventory
(MBI). The MBI is a 22-item instrument with 7-point
response options ranging from never (value ¼ 0) to everyday
(value ¼ 6). Burnout is conceptualized as high scores on
emotional exhaustion. Scores of 16 or less indicate low
burnout, scores between 17 and 26 indicate moderate
burnout, and scores 27 or higher indicate high burnout.
The alpha reliability for this subscale used in our study was
0Æ91. Additional evidence of reliability and validity of the
MBI as well as scoring procedure information are documen-
ted elsewhere (Maslach et al. 1996).
The DAD, a secondary source of data, was used to develop
the dependent variable, risk and case mix adjusted 30-day
mortality. There is evidence of varying reliability of data
elements in the DAD and our findings are only as credible as
the data used to produce these results. A study by the
Canadian Institute for Health Information explored levels of
agreement between patient data collected in the DAD with
re-abstractions of these data elements from patient records.
They found 87% agreement in most responsible diagnosis
coding, 75Æ5% agreement with presence or absence of
co-morbid conditions, and 83% agreement with typing of
co-morbid conditions (Canadian Institute for Health Infor-
mation 2003a). Other studies of data quality in the DAD
have consistently found under-coding of co-morbidities
(Quan et al. 2002, Austin et al. 2005, Lee et al. 2005).
An indirect standardization method was used to develop
risk and case mix adjusted 30-day mortality rates for each
hospital using the formula: actual number of deaths divided
by expected number of deaths. The numerator, actual
number of deaths, was calculated by linking patient cases in
the DAD with patient dates of death in the Ontario
Registered Persons Database (RPDB). The RPDB contains
dates of birth and death for all Ontario residents. The
number of sample patients who died within 30 days of
admission was summed for each diagnostic group in each
hospital. To calculate the denominator, four logistic regres-
sion models, one for each of the four diagnostic groups, were
completed to determine the expected probability of 30-day
death for each patient. To calculate each patient’s probability
of death, 28 indicators of patient health-related characteris-
tics existing before hospitalization were entered into logistic
regression models. C-statistics for the four models ranged
between 0Æ72 and 0Æ78. C-statistics range from zero to one
and provide a measure of logistic regression model ability to
discriminate between those patients who experience the
outcome of interest (death) and those who do not. C-statistics
>0Æ70, such as those found in this study, indicated that our
models had good discrimination between patients who died
or were alive 30 days after admission (Hosmer & Lemeshow
2000). Weighted standard mortality rates were calculated for
each hospital to eliminate confounding effects that patient
mix had on outcome rates. This weighted calculation is
necessary because mortality rates vary by diagnostic group
and because patient mix within the four diagnostic categories
varied across hospitals. Details of this risk-adjustment meth-
odology are documented elsewhere (Tourangeau & Tu 2003,
Tourangeau 2006).
Ethical considerations
Approval for the study was obtained from the University of
Toronto Health Sciences Ethics Committee in November
2002 and was renewed yearly until November 2005. For
survey participants, each nurse received an information letter
about the study with the questionnaire. This letter explained
the study purpose, procedure, risks and benefits, and assured
anonymity and confidentiality. Return of a completed ques-
tionnaire was taken as consent to participate. Ethical
approval was also received to link nurse survey data with
secondary sources of patient and hospital data.
Data analysis
Analyses were completed using SAS�, version 9.1 (Cary, NC,
USA). The unit of analysis was the acute care hospital.
Descriptive statistics were generated to summarize hospital
level predictors and the outcome variable. To answer the
research question, two multiple regression analysis methods
were implemented: simultaneous and backward regression.
Regression diagnostics were performed to ensure that the
model met assumptions for ordinary least squares regression
(Fox 1991). In the first regression model, all variables were
entered into analysis simultaneously and a single equation
was developed that included regression coefficients for each
independent variable (Polit & Beck 2004). In the second
backward (statistical) regression model, all predictors were
entered into the model and each one was removed to
determine whether the R2 dropped significantly. Only those
predictors that contributed significantly to the regression
model were retained in the final backward regression
equation (Munro 2005).
Findings
An average of 52 nurses responded from each of the 75 study
hospitals, with the number of respondents from each hospital
ranging between 21 and 213. Table 3 contains descriptions of
these nurses who cared for study patients in the 75 hospitals,
A.E. Tourangeau et al.
38 � 2006 The Authors. Journal compilation � 2006 Blackwell Publishing Ltd
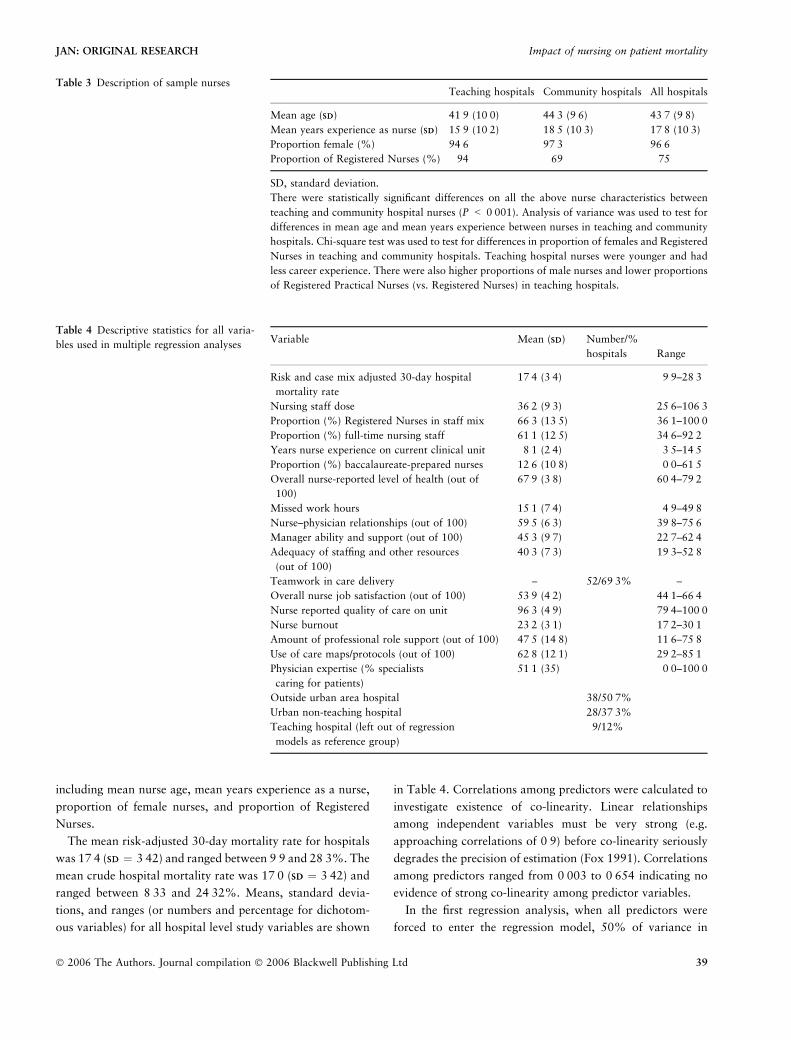
including mean nurse age, mean years experience as a nurse,
proportion of female nurses, and proportion of Registered
Nurses.
The mean risk-adjusted 30-day mortality rate for hospitals
was 17Æ4 (SDSD ¼ 3Æ42) and ranged between 9Æ9 and 28Æ3%. The
mean crude hospital mortality rate was 17Æ0 (SDSD ¼ 3Æ42) and
ranged between 8Æ33 and 24Æ32%. Means, standard devia-
tions, and ranges (or numbers and percentage for dichotom-
ous variables) for all hospital level study variables are shown
in Table 4. Correlations among predictors were calculated to
investigate existence of co-linearity. Linear relationships
among independent variables must be very strong (e.g.
approaching correlations of 0Æ9) before co-linearity seriously
degrades the precision of estimation (Fox 1991). Correlations
among predictors ranged from 0Æ003 to 0Æ654 indicating no
evidence of strong co-linearity among predictor variables.
In the first regression analysis, when all predictors were
forced to enter the regression model, 50% of variance in
Table 3 Description of sample nursesTeaching hospitals Community hospitals All hospitals
Mean age (SDSD) 41Æ9 (10Æ0) 44Æ3 (9Æ6) 43Æ7 (9Æ8)
Mean years experience as nurse (SDSD) 15Æ9 (10Æ2) 18Æ5 (10Æ3) 17Æ8 (10Æ3)
Proportion female (%) 94Æ6 97Æ3 96Æ6Proportion of Registered Nurses (%) 94 69 75
SD, standard deviation.
There were statistically significant differences on all the above nurse characteristics between
teaching and community hospital nurses (P < 0Æ001). Analysis of variance was used to test for
differences in mean age and mean years experience between nurses in teaching and community
hospitals. Chi-square test was used to test for differences in proportion of females and Registered
Nurses in teaching and community hospitals. Teaching hospital nurses were younger and had
less career experience. There were also higher proportions of male nurses and lower proportions
of Registered Practical Nurses (vs. Registered Nurses) in teaching hospitals.
Table 4 Descriptive statistics for all varia-
bles used in multiple regression analysesVariable Mean (SDSD) Number/%
hospitals Range
Risk and case mix adjusted 30-day hospital
mortality rate
17Æ4 (3Æ4) 9Æ9–28Æ3
Nursing staff dose 36Æ2 (9Æ3) 25Æ6–106Æ3Proportion (%) Registered Nurses in staff mix 66Æ3 (13Æ5) 36Æ1–100Æ0Proportion (%) full-time nursing staff 61Æ1 (12Æ5) 34Æ6–92Æ2Years nurse experience on current clinical unit 8Æ1 (2Æ4) 3Æ5–14Æ5Proportion (%) baccalaureate-prepared nurses 12Æ6 (10Æ8) 0Æ0–61Æ5Overall nurse-reported level of health (out of
100)
67Æ9 (3Æ8) 60Æ4–79Æ2
Missed work hours 15Æ1 (7Æ4) 4Æ9–49Æ8Nurse–physician relationships (out of 100) 59Æ5 (6Æ3) 39Æ8–75Æ6Manager ability and support (out of 100) 45Æ3 (9Æ7) 22Æ7–62Æ4Adequacy of staffing and other resources
(out of 100)
40Æ3 (7Æ3) 19Æ3–52Æ8
Teamwork in care delivery – 52/69Æ3% –
Overall nurse job satisfaction (out of 100) 53Æ9 (4Æ2) 44Æ1–66Æ4Nurse reported quality of care on unit 96Æ3 (4Æ9) 79Æ4–100Æ0Nurse burnout 23Æ2 (3Æ1) 17Æ2–30Æ1Amount of professional role support (out of 100) 47Æ5 (14Æ8) 11Æ6–75Æ8Use of care maps/protocols (out of 100) 62Æ8 (12Æ1) 29Æ2–85Æ1Physician expertise (% specialists
caring for patients)
51Æ1 (35) 0Æ0–100Æ0
Outside urban area hospital 38/50Æ7%
Urban non-teaching hospital 28/37Æ3%
Teaching hospital (left out of regression
models as reference group)
9/12%
JAN: ORIGINAL RESEARCH Impact of nursing on patient mortality
� 2006 The Authors. Journal compilation � 2006 Blackwell Publishing Ltd 39
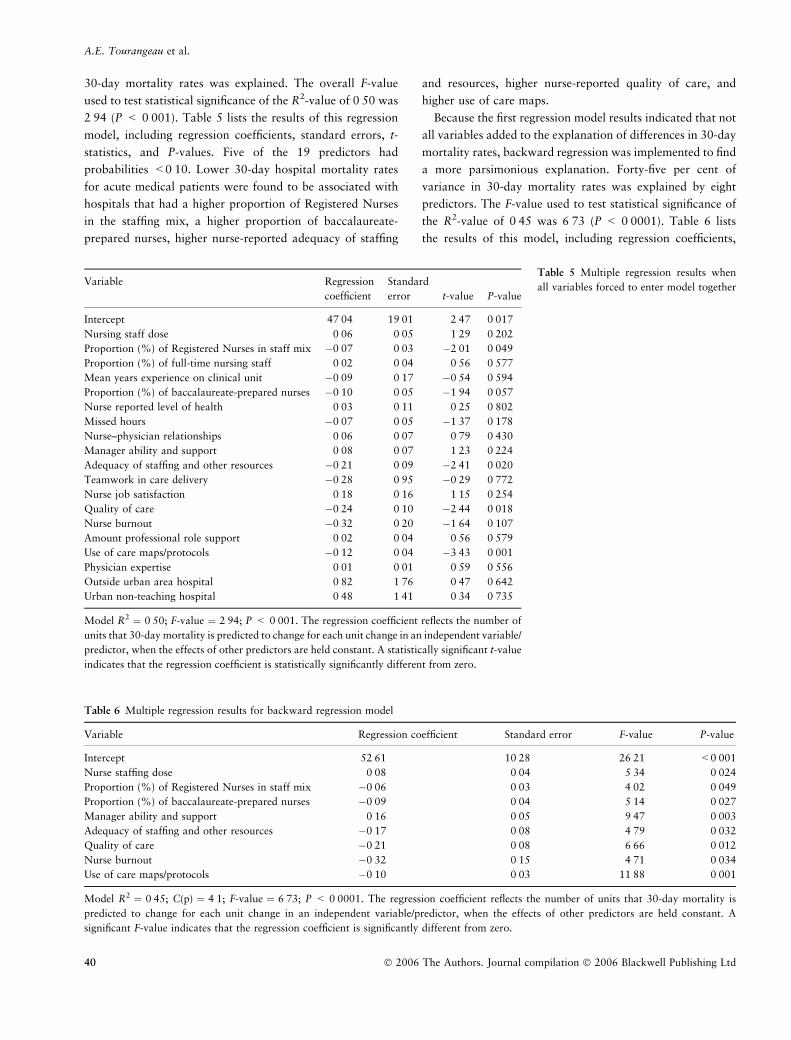
30-day mortality rates was explained. The overall F-value
used to test statistical significance of the R2-value of 0Æ50 was
2Æ94 (P < 0Æ001). Table 5 lists the results of this regression
model, including regression coefficients, standard errors, t-
statistics, and P-values. Five of the 19 predictors had
probabilities <0Æ10. Lower 30-day hospital mortality rates
for acute medical patients were found to be associated with
hospitals that had a higher proportion of Registered Nurses
in the staffing mix, a higher proportion of baccalaureate-
prepared nurses, higher nurse-reported adequacy of staffing
and resources, higher nurse-reported quality of care, and
higher use of care maps.
Because the first regression model results indicated that not
all variables added to the explanation of differences in 30-day
mortality rates, backward regression was implemented to find
a more parsimonious explanation. Forty-five per cent of
variance in 30-day mortality rates was explained by eight
predictors. The F-value used to test statistical significance of
the R2-value of 0Æ45 was 6Æ73 (P < 0Æ0001). Table 6 lists
the results of this model, including regression coefficients,
Table 5 Multiple regression results when
all variables forced to enter model togetherVariable Regression
coefficient
Standard
error t-value P-value
Intercept 47Æ04 19Æ01 2Æ47 0Æ017
Nursing staff dose 0Æ06 0Æ05 1Æ29 0Æ202
Proportion (%) of Registered Nurses in staff mix �0Æ07 0Æ03 �2Æ01 0Æ049
Proportion (%) of full-time nursing staff 0Æ02 0Æ04 0Æ56 0Æ577
Mean years experience on clinical unit �0Æ09 0Æ17 �0Æ54 0Æ594
Proportion (%) of baccalaureate-prepared nurses �0Æ10 0Æ05 �1Æ94 0Æ057
Nurse reported level of health 0Æ03 0Æ11 0Æ25 0Æ802
Missed hours �0Æ07 0Æ05 �1Æ37 0Æ178
Nurse–physician relationships 0Æ06 0Æ07 0Æ79 0Æ430
Manager ability and support 0Æ08 0Æ07 1Æ23 0Æ224
Adequacy of staffing and other resources �0Æ21 0Æ09 �2Æ41 0Æ020
Teamwork in care delivery �0Æ28 0Æ95 �0Æ29 0Æ772
Nurse job satisfaction 0Æ18 0Æ16 1Æ15 0Æ254
Quality of care �0Æ24 0Æ10 �2Æ44 0Æ018
Nurse burnout �0Æ32 0Æ20 �1Æ64 0Æ107
Amount professional role support 0Æ02 0Æ04 0Æ56 0Æ579
Use of care maps/protocols �0Æ12 0Æ04 �3Æ43 0Æ001
Physician expertise 0Æ01 0Æ01 0Æ59 0Æ556
Outside urban area hospital 0Æ82 1Æ76 0Æ47 0Æ642
Urban non-teaching hospital 0Æ48 1Æ41 0Æ34 0Æ735
Model R2 ¼ 0Æ50; F-value ¼ 2Æ94; P < 0Æ001. The regression coefficient reflects the number of
units that 30-day mortality is predicted to change for each unit change in an independent variable/
predictor, when the effects of other predictors are held constant. A statistically significant t-value
indicates that the regression coefficient is statistically significantly different from zero.
Table 6 Multiple regression results for backward regression model
Variable Regression coefficient Standard error F-value P-value
Intercept 52Æ61 10Æ28 26Æ21 <0Æ001
Nurse staffing dose 0Æ08 0Æ04 5Æ34 0Æ024
Proportion (%) of Registered Nurses in staff mix �0Æ06 0Æ03 4Æ02 0Æ049
Proportion (%) of baccalaureate-prepared nurses �0Æ09 0Æ04 5Æ14 0Æ027
Manager ability and support 0Æ16 0Æ05 9Æ47 0Æ003
Adequacy of staffing and other resources �0Æ17 0Æ08 4Æ79 0Æ032
Quality of care �0Æ21 0Æ08 6Æ66 0Æ012
Nurse burnout �0Æ32 0Æ15 4Æ71 0Æ034
Use of care maps/protocols �0Æ10 0Æ03 11Æ88 0Æ001
Model R2 ¼ 0Æ45; C(p) ¼ 4Æ1; F-value ¼ 6Æ73; P < 0Æ0001. The regression coefficient reflects the number of units that 30-day mortality is
predicted to change for each unit change in an independent variable/predictor, when the effects of other predictors are held constant. A
significant F-value indicates that the regression coefficient is significantly different from zero.
A.E. Tourangeau et al.
40 � 2006 The Authors. Journal compilation � 2006 Blackwell Publishing Ltd
standard errors, F-statistics, and P-values. On average, the
mean 30-day hospital mortality rate for acute medical
patients was 17Æ4% and lower 30-day hospital mortality
rates were associated with hospitals that had a higher
proportion of Registered Nurses in the staffing mix, a higher
proportion of baccalaureate-prepared nurses, a lower nurse
staffing dose, higher nurse-reported adequacy of staffing and
resources, higher use of care maps, higher nurse-reported
quality of care, lower nurse-reported adequacy of manager
ability and support, and higher nurse burnout.
Discussion
Study limitations
This study has a number of limitations, including weak
power for regression models such as those used in this study.
Our sample consisted of 75 hospitals and 19 predictors.
Although adjusted R2 provides a conservative estimate of R2
that takes into account the number of subjects (hospitals in
this case) and predictors, a high R2 such as that found in this
study may be an artefact of too few study hospitals (Munro
2005). Furthermore, our small sample size relative to number
of predictor variables may have masked the significance of
other model predictors that might actually be predictors of
hospital mortality.
A second study limitation relates to threats to both internal
and external study validity. Measures were undertaken to
strengthen internal validity by including a homogeneous
group of acute medical patients and incorporating risk
adjustment strategies to control for the impact of patients’
characteristics on the dependent variable. However, study
internal validity may have been weakened because of
unknown and unmeasured extraneous variables that influ-
ence 30-day mortality. For example, we did not include
indicators for hospital characteristics such as use of tempor-
ary agency nursing staff or for environmental factors such as
availability of community care services to support patient
recovery after hospital discharge. The impact of such factors
on 30-day mortality may be significant but this was not
explored in this study. Furthermore, external validity is
threatened by uncertainty about how representative this
sample of hospitals, patients in these hospitals, and nurses
caring for study patients were of those outside Ontario,
Canada.
Discussion of findings
Findings indicated that structures and processes of hospital
nursing care had an impact on 30-day mortality for acute
medical patients. Both nurse staffing variables (proportion
of Registered Nurses in the staff mix and nursing staff dose)
were found to be predictors of 30-day mortality. This was
an expected finding. As found in other studies (Tourangeau
et al. 2002), we found a moderate inverse relationship
between the total dose of nurse staffing with the proportion
of Registered Nurse staff in the mix of nurse staffing
(r ¼ �0Æ33, P ¼ 0Æ004). The explanation for this inverse
relationship relates to how hospitals allocate resources to
pay for nursing services. Because hospitals have fixed
resources, those that employ higher proportions of Regis-
tered Nurses in their nurse staffing complement can usually
afford fewer total numbers of nursing staff. Registered
Nurse staffing is more expensive than other categories of
nursing personnel such as practical nurses or unregulated
assistive nursing personnel. In our study, a 10% increase in
the proportion of Registered Nurses was associated with six
fewer deaths for every 1000 discharged patients (based on
regression coefficient produced in multiple regression model
shown in Table 6). Similar findings of the impact of higher
proportions of Registered Nurse staffing and total dose of
nurse staffing have been found previously with the same
patient population (Tourangeau et al. 2002), as well as with
other patient populations in American hospitals (Hartz et al.
1989, Farley & Ozminkowski 1992, Manheim et al. 1992,
Schultz 1997, Blegen et al. 1998, Aiken et al. 2002,
Needleman et al. 2002).
These findings also support the current movement towards
legislating baccalaureate education as minimum requirement
for Registered Nurse entry to practice. Hospitals with higher
proportions of baccalaureate-prepared nurses tended to have
lower 30-day mortality rates. Our findings indicated that a
10% increase in proportion of baccalaureate-prepared nurses
was associated with nine fewer deaths for every 1000
discharged patients (based on regression coefficient produced
in multiple regression model shown in Table 6). This finding
is similar to that of Aiken et al. (2003) with a sample of
surgical patients discharged from hospitals in the USA.
We found a similar relationship between one indicator of
the hospital nursing work environment, adequacy of staffing
and resources, and mortality as in previous findings by Aiken
et al. (1994) with a sample of US magnet hospitals. Similar to
the findings of Aiken et al., we found that a 10% increase in
nurse-reported adequacy of staffing and resources was
associated with 17 fewer deaths for every 1000 discharged
patients (based on regression coefficient produced in multiple
regression model shown in Table 6).
One finding not previously identified in the research
literature prior to this study is the impact that routine use
of care maps had on lowering 30-day mortality. We found
JAN: ORIGINAL RESEARCH Impact of nursing on patient mortality
� 2006 The Authors. Journal compilation � 2006 Blackwell Publishing Ltd 41
lower risk-adjusted 30-day mortality rates for hospitals in
which nurses reported higher routine use of care maps or
protocols. This finding reaffirmed the importance of estab-
lishing and maintaining best practice care maps or protocols
to guide patient care throughout hospitalization.
Two variables in our model were found to be statistically
significant predictors of 30-day mortality in the opposite
direction hypothesized. First, lower mortality was associated
with lower nurse-reported manager ability and support.
Overall, nurses across study hospitals rated their nurse
manager support as low. Nurses working in hospitals with
lower mortality rates felt less supported by their managers
than did nurses working in hospitals with higher mortality
rates. Perhaps managers in hospitals with lower mortality
rates had wider spans of control that detracted from their
ability to provide direct support to nursing staff. Managers in
hospitals with lower mortality rates may have focused their
energies on enabling other hospital structures and processes,
such as securing resources or promoting patient care initia-
tives that supported lower mortality rather than providing
direct support to nursing staff. Second, lower mortality was
associated with hospitals having nurses who reported experi-
encing higher burnout. On average, nurses across hospitals
reported burnout levels within the moderate range of
emotional exhaustion. Perhaps higher levels of burnout acted
as motivators that enabled nurses to detect and intervene
promptly with serious patient complications that could have
led to unnecessary patient death if left unattended or detected
too late. Further research is needed to understand these
counterintuitive findings better.
Conclusion
Our findings contribute to the mounting evidence that
structures and processes of hospital nursing care have an
impact on patient mortality and survival, and have implica-
tions for hospital management, clinical practice, and for
future research.
Just as hospitals emphasize and strengthen clinical practices
such as diagnostic procedures and clinical interventions to
minimize mortality and promote other desirable patient
outcomes, so should they also focus on strengthening organ-
izational structures and processes of care to minimize patient
death. Based on our findings, we recommend that, if hospitals
have goals of minimizing unnecessary patient death for their
acute medical patient population, they should maximize the
proportion of Registered Nurses in providing direct care, even
if this results in lowering total numbers of nursing personnel
across all categories. Furthermore, because of the impact that
higher proportions of baccalaureate-prepared nursing staff
had on lowering hospital mortality rates, we recommend that
hospitals aggressively seek to hire and retain baccalaureate-
prepared nurses to care for acute medical patients. Acute
medical hospitalized patients require the scope and depth of
knowledge, skill and judgement attained through baccalaure-
ate education to provide safe quality care to complex acute
medical patients.
Because hospitals in which nurses reported higher use of
care maps or other protocols to guide patient care also had
lower mortality rates, we recommend that hospitals make
significant investment in the development, use, and system-
atic updating of care maps or protocols to guide patient
progress throughout hospitalization. Hospitals that use care
maps or protocols could share their current tools across the
Internet as a source of information to assist other hospitals
and nursing staff around the world to develop their own
patient- and culturally sensitive care maps or protocols.
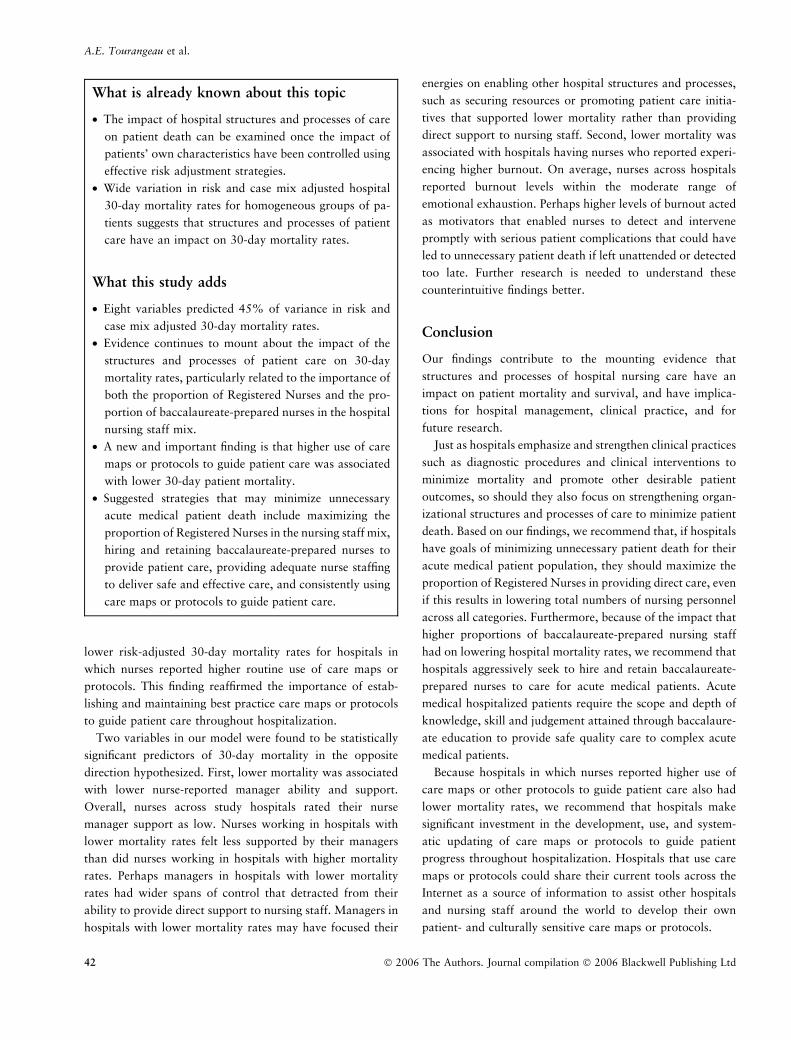
What is already known about this topic
• The impact of hospital structures and processes of care
on patient death can be examined once the impact of
patients’ own characteristics have been controlled using
effective risk adjustment strategies.
• Wide variation in risk and case mix adjusted hospital
30-day mortality rates for homogeneous groups of pa-
tients suggests that structures and processes of patient
care have an impact on 30-day mortality rates.
What this study adds
• Eight variables predicted 45% of variance in risk and
case mix adjusted 30-day mortality rates.
• Evidence continues to mount about the impact of the
structures and processes of patient care on 30-day
mortality rates, particularly related to the importance of
both the proportion of Registered Nurses and the pro-
portion of baccalaureate-prepared nurses in the hospital
nursing staff mix.
• A new and important finding is that higher use of care
maps or protocols to guide patient care was associated
with lower 30-day patient mortality.
• Suggested strategies that may minimize unnecessary
acute medical patient death include maximizing the
proportion of Registered Nurses in the nursing staff mix,
hiring and retaining baccalaureate-prepared nurses to
provide patient care, providing adequate nurse staffing
to deliver safe and effective care, and consistently using
care maps or protocols to guide patient care.
A.E. Tourangeau et al.
42 � 2006 The Authors. Journal compilation � 2006 Blackwell Publishing Ltd
Finally, it is important to acknowledge that although a
respectable 45% of variance in 30-day risk adjusted hospital
mortality rates was explained by eight hospital care struc-
tures and processes, 55% of the variance remained unex-
plained. Clearly, there is much to discover about the
determinants of mortality. Further research is required to
refine the Determinants of Mortality Model. Future research
should include measures of the environment, including access
to in-hospital and outside of hospital care as well as further
explore the impact of hospital management and leadership on
mortality outcomes.
Acknowledgements
The authors would like to gratefully acknowledge the
following for their support of this project:
Our funding agencies: the Canadian Institutes of Health
Research, the Canadian Health Services Research Founda-
tion, the Ontario Health Services Research Co-sponsorship
Fund from the Ontario Ministry of Health and Long-term
Care, and the Nursing Research Fund.
Ontario nurses who generously participated in completing
the Ontario Nurse Survey 2003.
Ann Tourangeau is supported by a Career Scientist award
from the Ontario Ministry of Health and Long-term Care.
Linda McGillis Hall is supported by a New Investigator award
from the Canadian Institutes of Health Research. Linda
O’Brien Pallas is supported by a Canadian Health Services
Research Foundation national chair. Jack Tu is supported by a
Canada Research Chair in Health Services Research and a
Career Investigator award from the Heart and Stroke Foun-
dation of Ontario. Lisa Cranley is supported by a Doctoral
Fellowship from the Canadian Institutes of Health Research.
Author contributions
AT, DD and LMH were responsible for the study conception
and design and AT, DD, LMH, LOP, DP, JT and LC were
responsible for the drafting of the manuscript. AT performed
the data collection and data analysis. AT and DD obtained
funding.
AT provided statistical expertise. AT, DD, LMH, LOP,
DP, JT and LC made critical revisions to the paper. AT
supervised the study.
References
Aiken L.H., Smith H.L. & Lake E.T. (1994) Lower Medicare mor-
tality among a set of hospitals known for good nursing care.
Medical Care 32(8), 771–787.
Aiken L.H., Clarke S.P., Sloane D.M., Sochalski J. & Silber J.H.
(2002) Hospital nurse staffing and patient mortality, nurse burn-
out, and job satisfaction. Journal of the American Medical Asso-
ciation 288(16), 1987–1993.
Aiken L.H., Clarke S.P., Cheung R.B., Sloane D.M. & Silber J.H.
(2003) Educational levels of hospital nurses and surgical patient
mortality. Journal of the American Medical Association 290,
1617–1623.
Austin P.C., Tu J.V., Alter D.A. & Naylor C.D. (2005) The impact of
under coding of cardiac severity and comorbid diseases on the
accuracy of hospital report cards. Medical Care 43(8), 801–809.
Baker R., Anderson G.M., Brown A.D., McKillop I., Murray M.A. &
Pink G. (1999) The Hospital Report 99: A Balanced Report Card
for Ontario Acute Care Hospitals. Ontario Hospital Association,
Toronto, Ontario, Canada.
Blegen M.A., Goode C.J. & Reed L. (1998) Nurse staffing and
patient outcomes. Nursing Research 47, 43–50.
Canadian Institute for Health Information (2003a) Discharge
Abstract Database (DA)/CMG/Plx Data Quality Re-abstraction
Study. Author, Ottawa, ON.
Canadian Institute for Health Information (2003b) Canadian Coding
Standards for ICD-10-CA and CCI. Author, Ottawa, ON.
Estabrooks C.A., Tourangeau A.E., Humphrey C.K., Hesketh K.L.,
Giovannetti P., Thomson D., Wong J., Acorn S., Clarke H. &
Shamian J. (2002) Measuring the hospital practice environment: A
Canadian context. Research in Nursing and Health 25, 256–268.
Estabrooks C.A., Midodzi W.K., Cummings G.G., Ricker K.L. &
Giovannetti P. (2005) The impact of hospital characteristics on
30-day mortality. Nursing Research 54(2), 74–84.
Farley D.E. & Ozminkowski R.J. (1992) Volume–outcome rela-
tionships and inhospital mortality: the effect of changes in volume
over time. Medical Care 30, 77–94.
Fox J. (1991) Regression Diagnostics: An Introduction. Sage, New-
bury Park, CA.
Hartz A.J., Krakauer H., Kuhn E.M., Young M., Jacobsen S.J., Gay
G., Muenz L., Katzoff M., Bailey R.C. & Rimm A.A. (1989)
Hospital characteristics and mortality rates. New England Journal
of Medicine 321, 1720–1725.
Hosmer D.W. & Lemeshow S. (2000) Applied Logistic Regression,
2nd edn. John Wiley and Sons, New York.
Knaus W.A.E., Draper A., Wagner D.P. & Zimmerman J.E. (1986)
An evaluation of outcome from intensive care in major medical
centers. Annals of Internal Medicine 104, 410–418.
Lake E.T. (2002) Development of the practice environment scale of
the nursing work index. Research in Nursing and Health 25, 176–
188.
Lee D.S., Donovan L., Austin P.C., Gong Y., Liu P.P., Rouleau J.L.
& Tu J.V. (2005) Comparison of coding of heart failure and
comorbidities in administrative and clinical data for use in
outcomes research. Medical Care 43(2), 182–188.
Manheim L.M., Feinglass J., Shortell S.M. & Hughes E.F. (1992)
Regional variation in Medicare hospital mortality. Inquiry 29, 55–
66.
Maslach C., Jackson S. & Leiter M. (1996) Maslach Burnout
Inventory Manual, 3rd edn. Consulting Psychologists Press, Palo
Alto, CA.
McCloskey J. (1974) Influence of rewards and incentives on staff
nurse turnover rate. Nursing Research 23, 239–247.
JAN: ORIGINAL RESEARCH Impact of nursing on patient mortality
� 2006 The Authors. Journal compilation � 2006 Blackwell Publishing Ltd 43
McCloskey J.C. & McCain B.E. (1987) Satisfaction, commitment
and professionalism of newly employed nurses. Image: Journal of
Nursing Scholarship 19(1), 20–24.
Mitchell P.H., Armstrong S., Simpson T.F. & Lentz M. (1989)
American association of critical-care nurses demonstration project:
profile of excellence in critical care nursing. Heart and Lung 18,
219–237.
Mueller C.W. & McCloskey J.C. (1990) Nurse job satisfaction: a
proposed measure. Nursing Research 39, 113–117.
Munro B.H. (2005) Statistical Methods for Health Care Research,
5th edn. Lippincott Williams and Wilkins, Philadelphia, PA.
Needleman J., Buerhaus P., Mattke S., Stewart M. & Zelevinsky K.
(2002) Nurse-staffing levels and the quality of care in hospitals.
New England Journal of Medicine 346, 1715–1722.
Polit D.F. & Beck C.T. (2004) Nursing Research: Principles and
Methods, 7th edn. Lippincott Williams and Wilkins, Philadelphia,
PA.
Quan H., Parsons G.A. & Ghali W.A. (2002) Validity of information
on comorbidity derived from ICD-9-CCM administrative data.
Medical Care 40(8), 675–685.
Sasichay-Akkadechanunt T., Scalzi C.C. & Jawad A.F. (2003) The
relationship between nurse staffing and patient outcomes. Journal
of Nursing Administration 33, 478–485.
Schultz M.A. (1997) The association of hospital structure and
financial characteristics to mortality and length of stay in patients
with acute myocardial infarction. Unpublished doctoral disserta-
tion, University of California, Los Angeles, CA.
Shortell S.M. & Hughes E.F. (1988) The effects of regulation, com-
petition, and ownership on mortality rates among hospital
inpatients. New England Journal of Medicine 318, 1100–1107.
Shortell S.M., Zimmerman J.E., Rousseau D.M., Gillies R.R., Wag-
ner D.P., Draper E.A., Knaus W.A. & Duffy J. (1994) The
performance of intensive care units: does good management make
a difference? Medical Care 32, 508–525.
Silber J.H. & Rosenbaum P.R. (1997) A spurious correlation
between hospital mortality and complication rates. Medical Care
30(10), OS77–OS92.
Silber J.H., Rosenbaum P.R. & Ross R.N. (1995) Comparing the
contributions of groups of predictors: which outcomes vary with
hospital rather than with patient characteristics? Journal of the
American Statistical Association 90(429), 7–18.
Tourangeau A.E. (2003) Modeling the determinants of mortality for
hospitalized patients. International Nursing Perspectives 3(1), 37–
48.
Tourangeau A.E. (2005) A theoretical model of the determinants of
mortality. Advances in Nursing Science 28(1), 58–69.
Tourangeau A.E. (2006) Taux de mortalite a 30 jours ajustes sur le
risque et sur le diagnostic pour les patients hospitalises en soins de
courte duree dans les hopitaux de l’Ontario, Canada. Risques &
Qualite 3(1), 25–31.
Tourangeau A.E. & Tu J.V. (2003) Developing risk-adjusted 30-day
hospital mortality rates. Research in Nursing and Health 26, 483–
496.
Tourangeau A.E., Giovannetti P., Tu J.V. & Wood M. (2002) Nur-
sing-related determinants of 30-day mortality for hospitalized
patients. Canadian Journal of Nursing Research 33(4), 71–88.
Tourangeau A.E., Cranley L.A. & Jeffs L. (2006a) Impact of nursing
on hospital patient mortality: a focused review and related policy
implications. Quality and Safety in Health Care 15, 4–8.
Tourangeau A.E., McGillis Hall L., Doran D.M. & Petch T. (2006b)
Measurement of nurse satisfaction using the McCloskey Mueller
Satisfaction Scale. Nursing Research 55(2), 128–136.
A.E. Tourangeau et al.
44 � 2006 The Authors. Journal compilation � 2006 Blackwell Publishing Ltd