january 10-11, cincinnati, ohjanuary 10-11, cincinnati, oh sponsored by the u.s. environmental...
TRANSCRIPT


Presented atPresented at
Great Rivers Reference Condition Great Rivers Reference Condition WorkshopWorkshop
January 10January 10--11, Cincinnati, OH11, Cincinnati, OHSponsored by Sponsored by
The U.S. Environmental Protection Agency and The Council of StatThe U.S. Environmental Protection Agency and The Council of State Governmentse Governments
Environmental Monitoring and Assessment of Great River Ecosystems (EMAP-GRE)Improving the science and practice of assessing Great
River EcosystemsUS EPA Office of Research & Development
National Health & Environmental Effects LaboratoryMid-Continent Ecology Division Duluth, MN
http://www.epa.gov/emap/greatriverThis information has not been reviewed by EPA nor does it reflect the views of the Agency.

Why EMAP Great River Ecosystems?
• Legislative mandatesClean Water Act & Government Performance and Results Act. Arguably, these are minor drivers of river management compared to navigation, flood control, hydropower, recreation, habitat restoration, and endangered species.
• EMAP adds valueContributes to diverse assessment needs through research and demonstrations of scaleable sampling designs that produce statistically-robust data. EMAP designs and ecological indicators yield baseline statements of condition and characterizations of reference conditions. The ability to measure condition is fundamental to adaptive management.
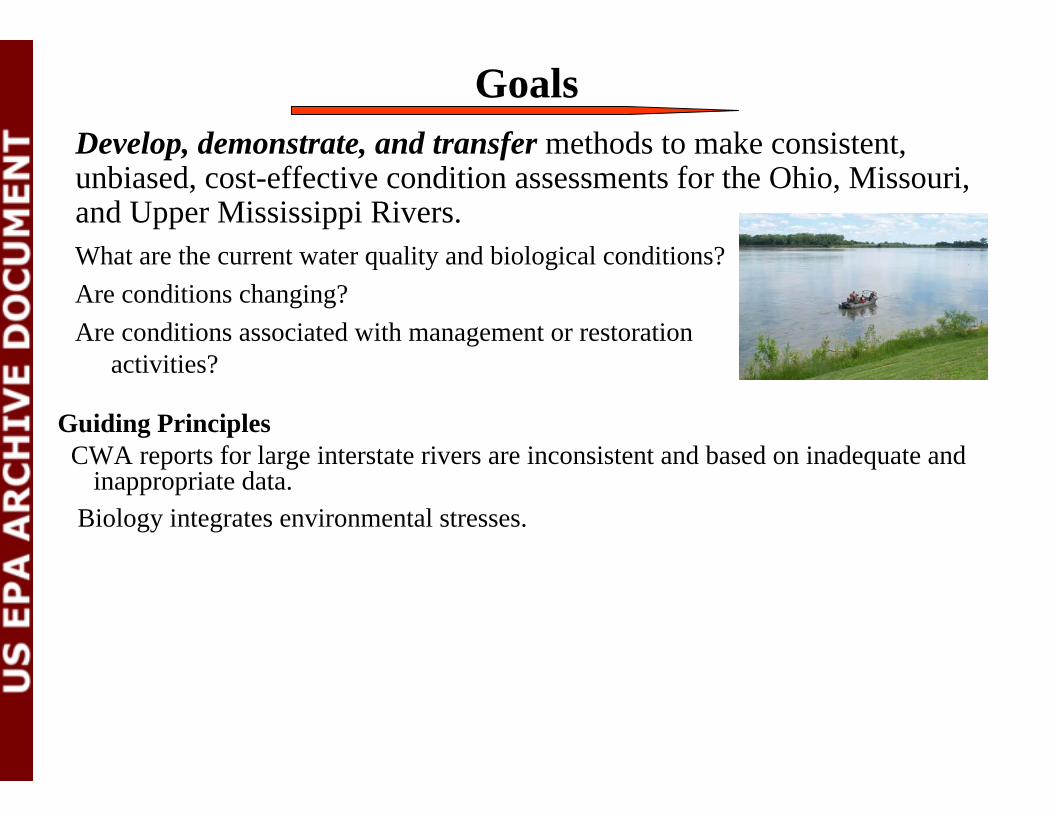
GoalsDevelop, demonstrate, and transfer methods to make consistent, unbiased, cost-effective condition assessments for the Ohio, Missouri, and Upper Mississippi Rivers.What are the current water quality and biological conditions? Are conditions changing?Are conditions associated with management or restoration
activities?
Guiding PrinciplesCWA reports for large interstate rivers are inconsistent and based on inadequate and
inappropriate data.Biology integrates environmental stresses.

But, don’t we know a lot about these rivers already?
No, ad hoc, targeted, and selected-pool approaches have yielded spatially, temporally, and methodologically scattered WQ monitoring data that are inadequate for assessing
river systems.Water quality inventory of all known
WQ stations (1953-1999) UMRCC WQ Technical Section; 2002
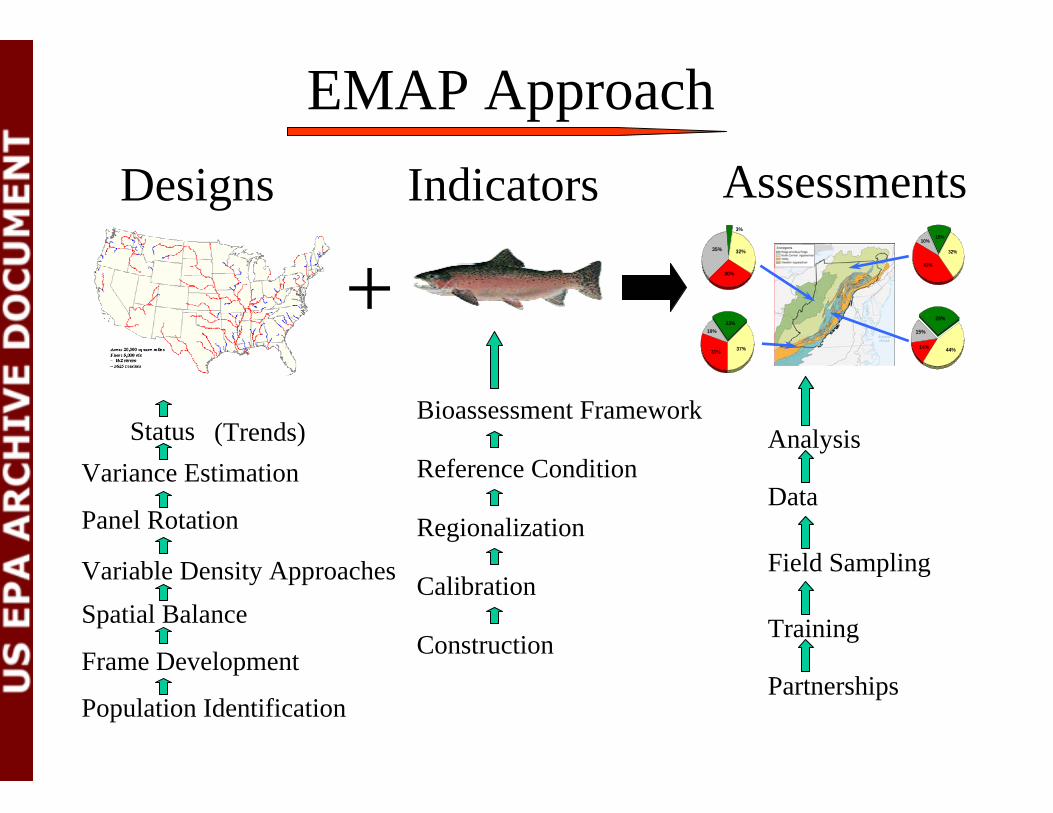
EMAP Approach
Population Identification
10%23%
37%31%
10%15%
32%
43%
15%
28%
44%14%
35%
3%
32%
30%
Assessments
Variable Density Approaches
Frame Development
Spatial Balance
Panel Rotation
Variance EstimationStatus (Trends)
Construction
Calibration
Regionalization
Reference Condition
Bioassessment Framework
IndicatorsDesigns
Partnerships
Analysis
Data
Field Sampling
Training
+

EMAP QuestionWhat % ("error) of [resource] in [unit] is in [condition]
as indicated by [indicator] ?
Questions are explicit. Results are spatially nested.Assessments over time yield trends.
EMAP (& other programs):
Water quality assessmentsWhat % (±) of the Ohio River main-stem in KY is impaired by nitrate? What % (±) of the Mississippi River main-stem in MN is impaired by turbidity?
Management & restorationWhat % (±) of the Mississippi River backwaters in IL is good duck habitat?What % (±) of the Missouri River rip-rapped shorelines in MO has fish assemblages dominated by native species?
BioassessmentsWhat % (±) of the Missouri R in NE has benthos taxa dominated by tolerant taxa?What % (±) of the Mississippi River main-channel in WI is clear enough to support the growth of SAV?

AnalysesUniversity of LouisvilleStroud Water Center
Southwest Missouri State University
USGS UMESCEPA NERLEPA MED
EPA MED, WED, & contract staff
University of Minnesota
Lower Missouri River
USGS Missouri, Iowa, Kansas,
Nebraska District Offices;
Missouri Dept of Conversation;
Nebraska Game & Fish Commission
EPA Region 7
Upper Missouri River
USGS North Dakota & Montana District
Offices; North Dakota Dept
HealthEPA Region 8
Ohio RiverEPA NERL
EPA Region 3EPA Region 4EPA Region 5
ORSANO
Upper Mississippi River
USGS UMESCWisconsin DNRMinnesota DNR Minnesota PCA
Iowa DNRIllinois Natural History
SurveyMissouri Dept Conservation
EPA Regions 5 & 7
EMAP-GRE Partners
Program Components
Sample Analysis Data Analysis
Design SupportTraining
Information Management
Field Operations
Manual

Probability sites
All possible sites in rivers
Site-scale filters
Reference database
Indicators
Assessments and improved CWA reports
Assessment Approach
Landscape Model
Candidate reference sitesTargeted sitesProbability
Targeted sitesBPJ
Ass
essm
ent
Reference
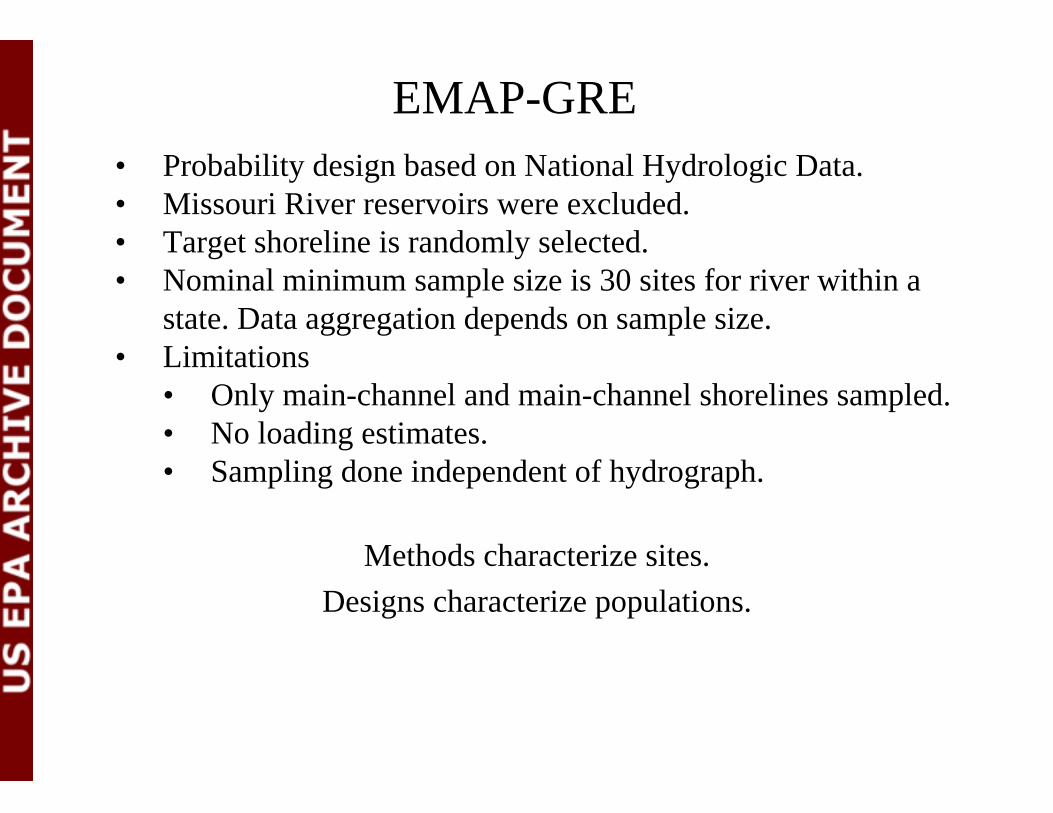
EMAP-GRE• Probability design based on National Hydrologic Data.• Missouri River reservoirs were excluded.• Target shoreline is randomly selected.• Nominal minimum sample size is 30 sites for river within a
state. Data aggregation depends on sample size.• Limitations
• Only main-channel and main-channel shorelines sampled. • No loading estimates.• Sampling done independent of hydrograph.
Methods characterize sites. Designs characterize populations.
1930
5
31
10
7
14
30
23
12
19 8
22
40
4
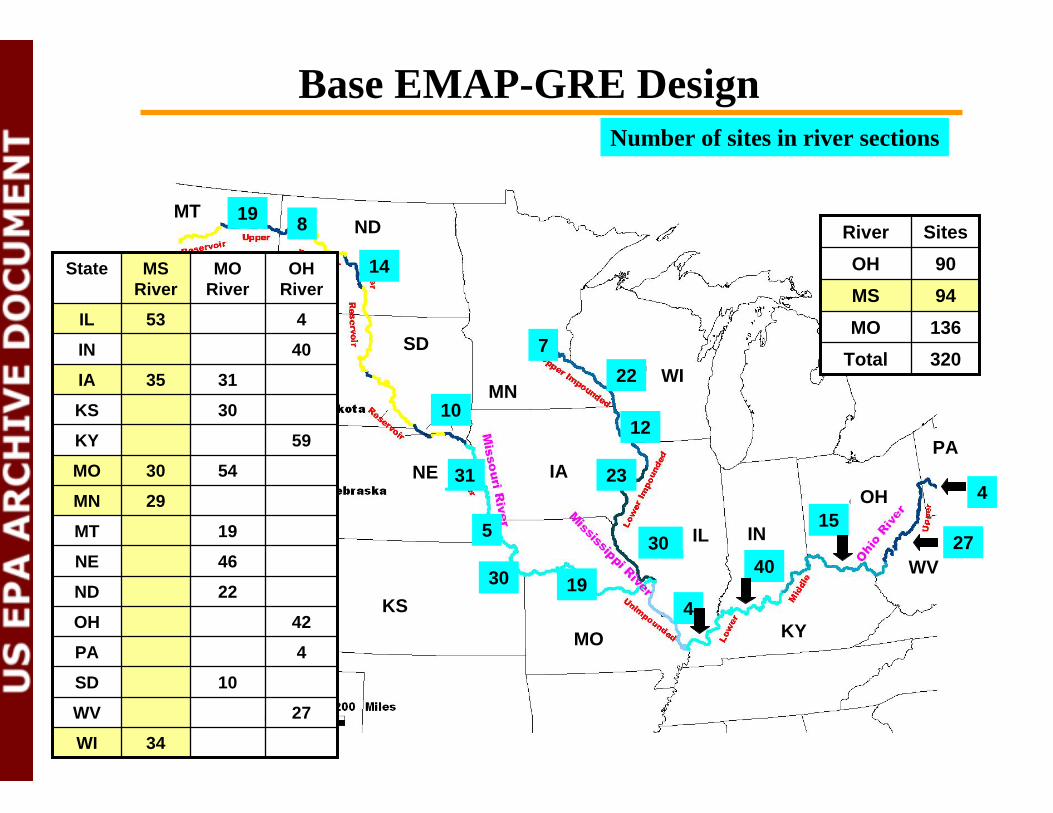
Base EMAP-GRE Design
15
Number of sites in river sections
MN WI
ND
IL
KS
NE
SD
MT
MO
OH
KY
IN
PA
WV
IA
Total MOMS OH
River
3201369490
Sites
27
4
34WI
27WV
10SD
4PA
42OH
22ND
46NE
19MT
29MN
5430MO
59KY
30KS
3135IA
40IN
453IL
OH River
MO River
MS River
State
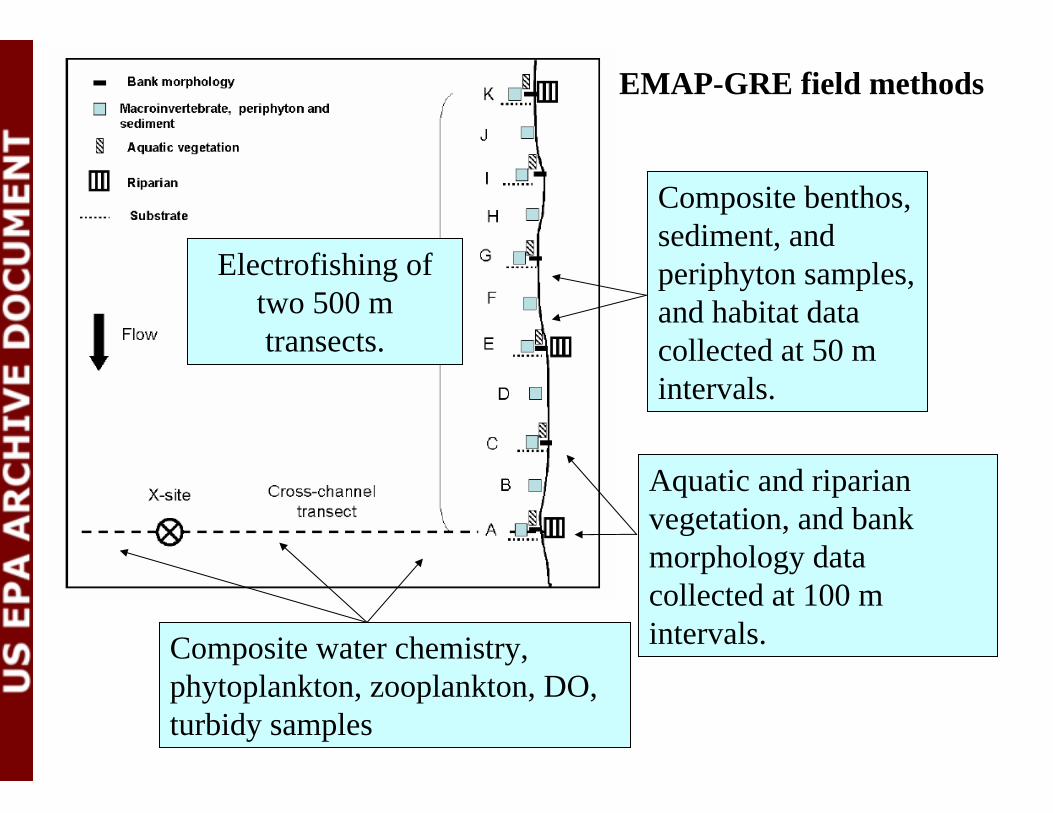
Aquatic and riparian vegetation, and bank morphology data collected at 100 m intervals.
Composite benthos, sediment, and periphyton samples, and habitat data collected at 50 m intervals.
Composite water chemistry, phytoplankton, zooplankton, DO, turbidy samples
Electrofishing of two 500 m transects.
EMAP-GRE field methods
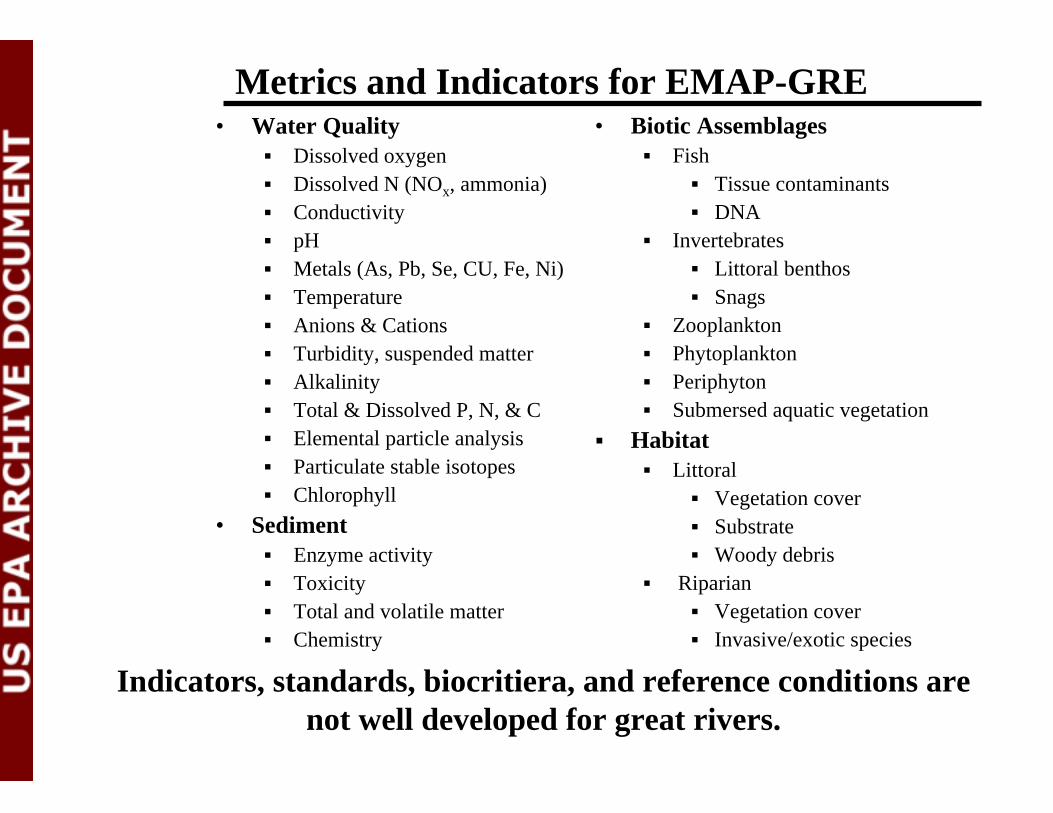
Metrics and Indicators for EMAP-GRE• Water Quality
Dissolved oxygenDissolved N (NOx, ammonia)ConductivitypHMetals (As, Pb, Se, CU, Fe, Ni)TemperatureAnions & CationsTurbidity, suspended matterAlkalinityTotal & Dissolved P, N, & CElemental particle analysisParticulate stable isotopesChlorophyll
• SedimentEnzyme activityToxicityTotal and volatile matter Chemistry
• Biotic AssemblagesFish
Tissue contaminantsDNA
InvertebratesLittoral benthosSnags
Zooplankton PhytoplanktonPeriphytonSubmersed aquatic vegetation
HabitatLittoral
Vegetation coverSubstrateWoody debris
Riparian Vegetation coverInvasive/exotic species
Indicators, standards, biocritiera, and reference conditions are not well developed for great rivers.

EMAP-GRE & Reference Condition
• Reference data are needed to move from statements of condition (“This is what we found”) to assessments of condition (“What we found was good.”).
• An empirical Least Disturbed Conditions works for EMAP because consistent methods are used over entire system and the entire range of conditions is sampled.
• Reference approaches are not universally accepted. Multiple and diverse reference expectations necessitates multiple and diverse approaches.
Probability sites
All possible sites in rivers
Site-scale filters
Reference database
Indicators
Assessments and improved CWA reports
Landscape Model
Candidate reference sitesTargeted sitesProbability
Targeted sitesBPJ
Con
ditio
nA
sses
smen
t
Reference
Population Identification
Assessments
Variable Density Approaches
Frame Development
Spatial Balance
Panel Rotation
Variance EstimationStatus (Trends)
Construction
Calibration
Regionalization
Reference Condition
Bioassessment Framework
IndicatorsDesigns
Partnerships
Analysis
Data
Field Sampling
Training
+
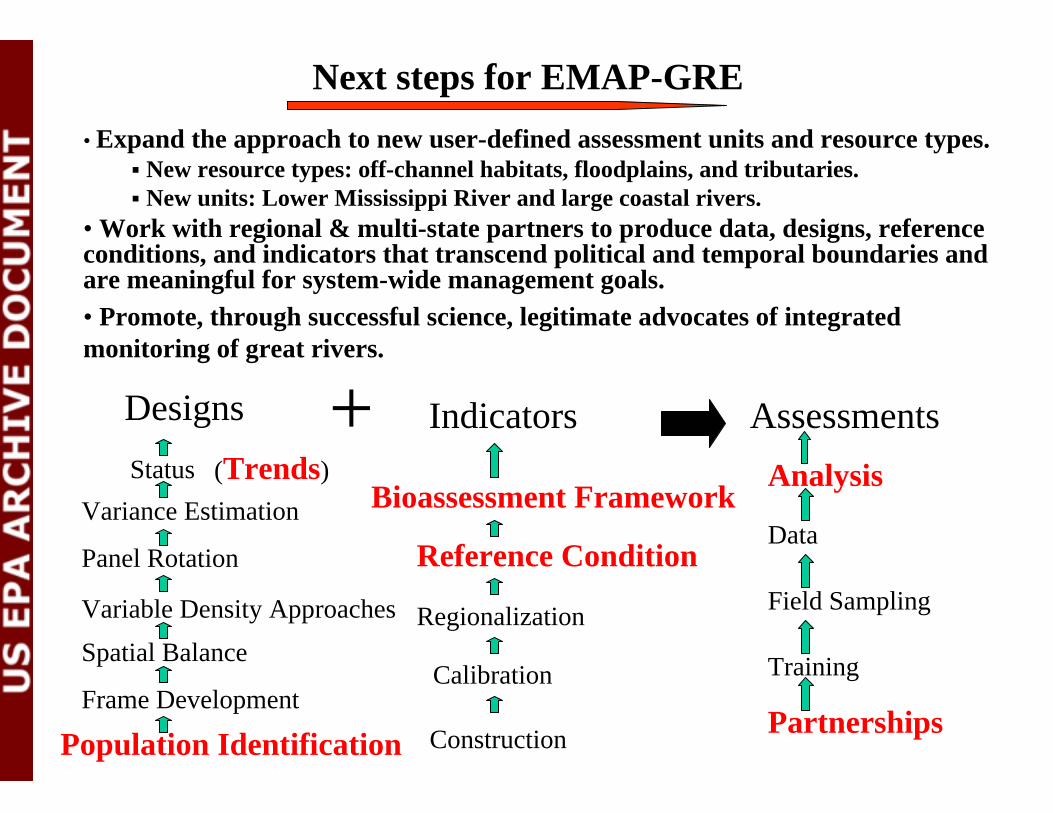
Next steps for EMAP-GRE• Expand the approach to new user-defined assessment units and resource types.
New resource types: off-channel habitats, floodplains, and tributaries.New units: Lower Mississippi River and large coastal rivers.
• Work with regional & multi-state partners to produce data, designs, reference conditions, and indicators that transcend political and temporal boundaries and are meaningful for system-wide management goals.• Promote, through successful science, legitimate advocates of integrated monitoring of great rivers.