january 2012 - cequence energy · •two simonette montney oil wells completed in q4 ... cqe 4-4 15...
TRANSCRIPT

January 2012

Corporate Profile
Trading Symbol TSX: CQE
Current production 10,600 boepd
52-week trading range $1.96-$4.70
Shares outstanding FD 177 million
Insider ownership 11% FD
Market capitalization (1) $460 million
September 30, 2011 net debt (2) $7.7 million
Bank line $110 million (1) Based on Cequence stock price of $2.85 (2) September 30, 2011 net debt is calculated as cash, net working capital less commodity contract asset and demand credit
facilities and excluding obligations on flow-through shares included with accounts payable and accrued liabilities in the consolidated balance sheet.
2
Recent highlights
3
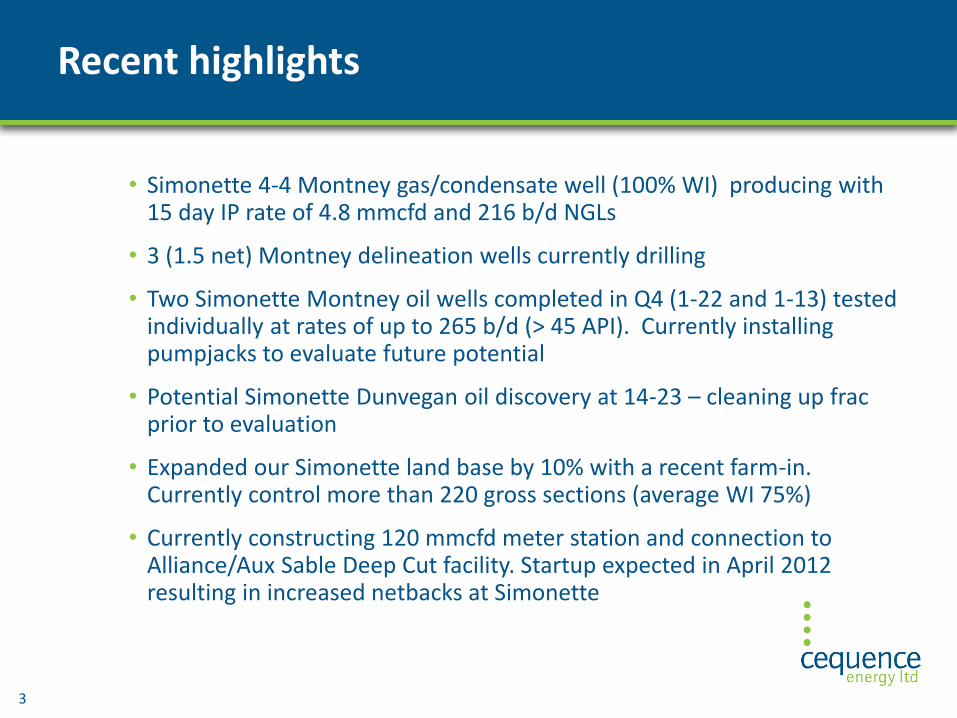
• Simonette 4-4 Montney gas/condensate well (100% WI) producing with 15 day IP rate of 4.8 mmcfd and 216 b/d NGLs
• 3 (1.5 net) Montney delineation wells currently drilling
• Two Simonette Montney oil wells completed in Q4 (1-22 and 1-13) tested individually at rates of up to 265 b/d (> 45 API). Currently installing pumpjacks to evaluate future potential
• Potential Simonette Dunvegan oil discovery at 14-23 – cleaning up frac prior to evaluation
• Expanded our Simonette land base by 10% with a recent farm-in. Currently control more than 220 gross sections (average WI 75%)
• Currently constructing 120 mmcfd meter station and connection to Alliance/Aux Sable Deep Cut facility. Startup expected in April 2012 resulting in increased netbacks at Simonette

2012 Plan
• Continue to evaluate our Deep Basin resource base and expand NGL rich opportunities in new zones
• Protect our balance sheet in current low gas price environment with prudent capital spending
• Control infrastructure in our core area to drive operating costs to lowest possible level
4

Deep Basin – Continued Focus on Simonette
5
Rely on technical strength and experience of our team
• Stacked resource style plays with NGLs in all formations drives our economics and strategy
Major focus of 2012 budget
• Montney - Continue to evaluate our gas/condensate discovery
• Focus on drilling land retention/delineation wells
• Capital focus on Montney gives us a free look at shallower zones and preserves critical land
• Evaluate potential Montney oil discovery in CQE wells on trend with competitor discovery in North Simonette
• Dunvegan - evaluate potential oil discovery at 14-23 well and drill a second well in gas/condensate trend to west
• Falher - test the gas/condensate potential on farm-in lands
• Infrastructure capital will increase operating efficiency
• Target OPEX <$4.00 per boe at Simonette
PEACE RIVER
EDMONTON
GRANDE PRAIRIE
BRITISH
COLUMBIA
ALBERTA
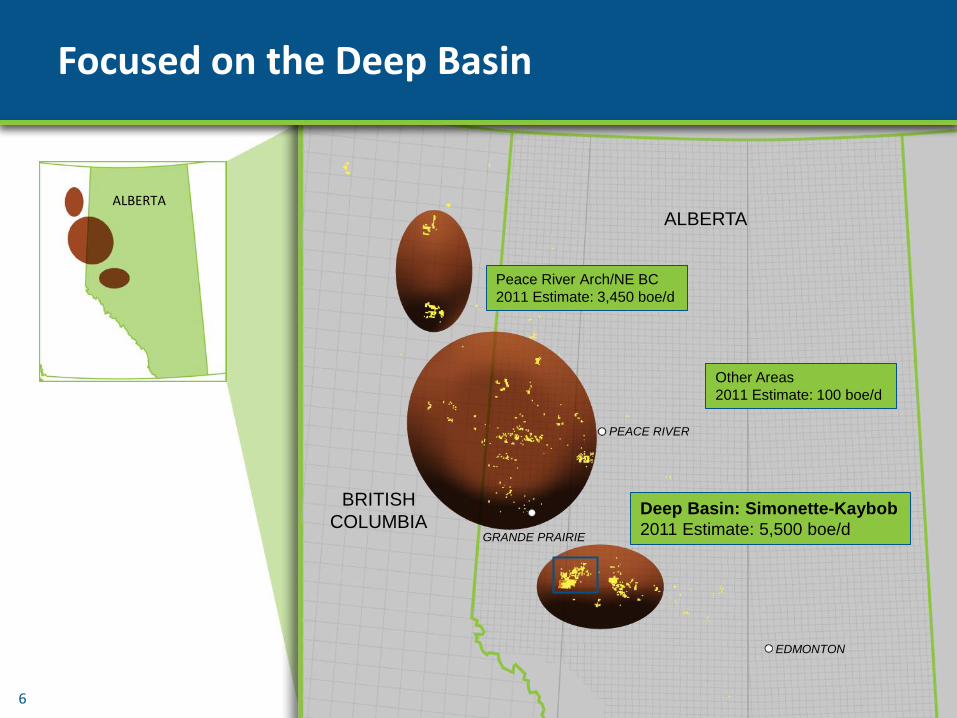
Focused on the Deep Basin
ALBERTA
Peace River Arch/NE BC
2011 Estimate: 3,450 boe/d
Deep Basin: Simonette-Kaybob
2011 Estimate: 5,500 boe/d
Other Areas
2011 Estimate: 100 boe/d
6

Trilogy Plant
CQE WI = 25%
Capacity 10 MMcf/d
Keyera Processing Facility
Capacity 153 MMcf/d
Available Capacity 90 MMcf/d
Cequence Alliance
Meter Station
Capacity 120 MMcf/d
To Aux Sable
Deep Cut Plant
Chicago, Illinois
Simonette: A Concentrated Land Base
7
6 miles
Control 220 gross operated sections (avg. 75% W.I.) including new farm-in
Extensive 3D seismic coverage critical to evaluation and horizontal well path planning
Aux Sable Rich Gas Premium Agreement expected start-up in April, 2012 and expected to provide:
• Increase in realized product price
• Reduction in processing fees
• Resulting increase to recent netbacks of approximately $3.00 per boe
• Take-away capacity ~ 120 mmcf/d
CQE land
Farm-in land
3D seismic
CQE well
CQE field compressor
CQE Gathering system
CQE Planned gathering system
Alliance pipeline

Cequence land
Farm-in land
Stacked Zones Expose Significant Resources
5-10 bcf
5-10 bcf
5-24 bcf
5-25 bcf
30-60 bcf
Dunvegan
Falher
Wilrich
Gething
Montney
Zone Total Resource Potential/Sec
2,200m
2,950m
3,100m
2,700m
2,500m
2,800m
8
6 miles

Simonette Montney Liquids-Rich Resource Play
9
CQE land
CQE Montney rights
Planned CQE 2012 location
CQE Montney gas well
Industry Montney Hz well
Gas/Condensate Prone
6 miles
CQE16-12 Potential
Oil Discovery-testing
CQE 1-22 Potential Oil Discovery
Initial Test Rate
265 bbls/d oil/condy plus 1.5 mmcf/d
Recent rates
200-300 bpd oil
CQE 4-4 15 day IP
4.8 mmcf/d plus
216 bbls/d NGLs 20.4 mmcf/d
568 bpd condy
10.2 mmcf/d
437 bpd condy
2.4 mmcf/d
50 bpd condy 14.3 mmcf/d
241 bpd
condy
5.2 mmcf/d
19 bpd condy
14.4 mmcf/d
114 bpd condy
Gas/Condensate trend continues to deliver excellent results
• Recent 4-4 has 15 day IP rate of 4.8 mmcf/d and 216 b/d NGLs
• Plan to de-risk 35 net sections by Q1 (out of total 50 net sections in gas/condensate trend)
• CQE estimates net potential 2 TCF OGIP and 90 mmbbls liquids
• Numerous high rate competitor wells surrounding Simonette
New Oil trend developing in North Simonette – competitor reported IP rates up to 300 bopd
• Currently evaluating two CQE oil/ condensate rich wells completed in Q4/11
• 20 net sections in potential oil trend 4.1 mmcf/d
48 bpd condy
Drilling
Drilling
Drilling

AECO $3.00/mmbtu $4.00/mmbtu
WTI $90/bbl $90/bbl
NGL Yield 45 bbls/mmcf 45 bbls/mmcf
Per boe Per boe
Plant Gate Price $30.66 $35.86
Royalty (5%) $1.53 $1.79
Operating Cost + Transportation $7.00 $7.00
Operating Netback $22.13 $27.06
Operating Netback post Aux Sable $24.88 $30.31
F&D (per boe) $6.11 $6.11
Recycle Ratio 4.1 times 4.9 times
Simonette – Montney Development Model Delivers Strong Netbacks at $3.00 gas
10
Excellent Economics
*Assumes no GORR
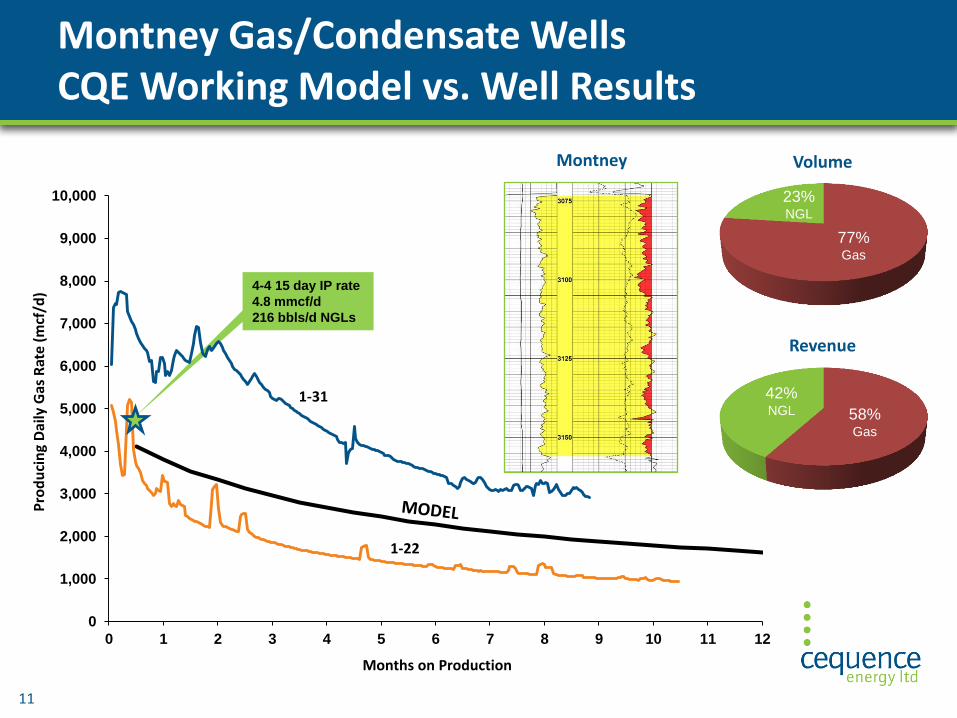
4-4 15 day IP rate
4.8 mmcf/d
216 bbls/d NGLs
0
1,000
2,000
3,000
4,000
5,000
6,000
7,000
8,000
9,000
10,000
0 1 2 3 4 5 6 7 8 9 10 11 12
Montney Gas/Condensate Wells CQE Working Model vs. Well Results
Pro
du
cin
g D
aily
Gas
Rat
e (m
cf/d
)
Months on Production
Montney
23% NGL
77% Gas
58% Gas
42% NGL
Volume
Revenue
1-31
1-22
11
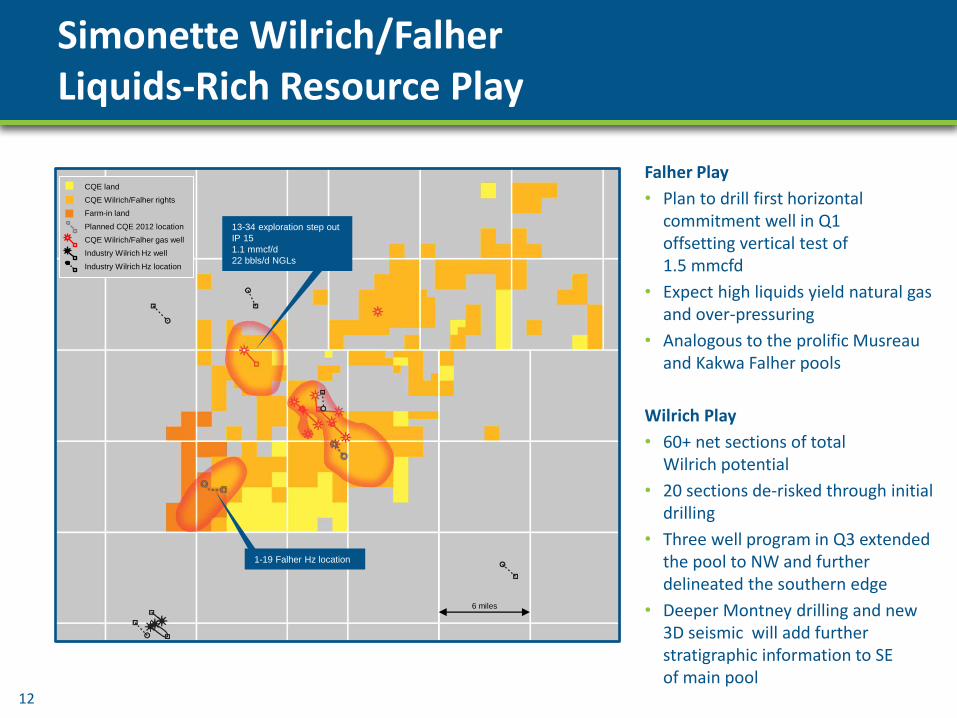
Simonette Wilrich/Falher Liquids-Rich Resource Play
12
CQE land
CQE Wilrich/Falher rights
Farm-in land
Planned CQE 2012 location
CQE Wilrich/Falher gas well
Industry Wilrich Hz well
Industry Wilrich Hz location
6 miles
1-19 Falher Hz location
13-34 exploration step out
IP 15
1.1 mmcf/d
22 bbls/d NGLs
Falher Play
• Plan to drill first horizontal commitment well in Q1 offsetting vertical test of 1.5 mmcfd
• Expect high liquids yield natural gas and over-pressuring
• Analogous to the prolific Musreau and Kakwa Falher pools
Wilrich Play
• 60+ net sections of total Wilrich potential
• 20 sections de-risked through initial drilling
• Three well program in Q3 extended the pool to NW and further delineated the southern edge
• Deeper Montney drilling and new 3D seismic will add further stratigraphic information to SE of main pool

0
1,000
2,000
3,000
4,000
5,000
6,000
7,000
8,000
9,000
10,000
0 1 2 3 4 5 6 7 8 9 10 11 12
Wilrich
Wilrich Gas/Condensate Wells CQE Horizontal Model vs. Well Results
Pro
du
cin
g D
aily
Gas
Rat
e (m
cf/d
)
Months on Production
12% NGL
88% Gas
76% Gas
24% NGL
Volume
Revenue
13

Dunvegan Oil and Gas/Condensate Play
14
CQE land
CQE Dunvegan rights
Farm-in land
CQE Dunvegan location
Vertical Dunvegan channel completion
Industry Dunvegan Hz well
Industry Dunvegan Hz location
6 miles
14-23 Potential Oil
Discovery-testing
New Simonette oil pool 42º API
Well IP 180 b/d and 600 mcf/d
Dunvegan horizontal location Q3 2012 –
offsets avg. vertical gas test 2.4 mmcf/d
and 240 b/d condensate
Resthaven gas/condensate
pool - 6 mo Hz IP rates
IP rates up to 6 mmcf/d
gas and liquids
• Potential new oil discovery at 14-23 (50% WI)
• Currently testing well on cleanup
• Recent farm-in on 20 section land block adjacent to Simonette
• Potential gas/condensate horizontal well to be drilled in Q3 offsetting Resthaven Dunvegan gas/condensate pool

Montney and Wilrich Simonette Model Economics
Wilrich
Montney
Production Potential Gas Liquids ORGIP
Dev. Capital Cost/ Well ROR NPV
Model Payout
Breakeven Gas Price
4.5 mmcf/d
20
bbls/mmcf
4.0
BCF
$5.0 MM
75% $4.4 MM
17 months
$2.25/ mmbtu
4.5
mmcf/d
45
bbls/mmcf
4.5
BCF
$5.5
MM 90%+ $8.0
MM
14 months
<$2.00/ mmbtu
CQE Working Development Model @ $4.00/mmbtu
15
*Economics calculated pre Aux Sable tie-in

Dunvegan
Falher
Wilrich
Gething
Montney
16
One drilling
pad could add
$100 MM of NPV to
Cequence
Single Well NPV ($mm)
Emerging
Emerging
4.4
2.6
8.0
Stacked Development Adds Significant Value
Potential Locations
60-120
200
150-200
?
?
6 miles

Cequence Energy Results and Guidance
2010 2011 Guidance
Production (boe/d) Average (full year) (1)
Exit rate
4,451 7,485
9,050
11,000
Capital expenditures $64.1 MM $150 MM
Net acquisitions/(dispositions) (2) $216.6 MM ($24.0) MM
Equity issued (3) $65 MM $116 MM
Operating costs per boe $10.90 $9.00
Royalties (% of revenue) 12 13
Crude oil – WTI (Cdn$/bbl) $79.38 $97.50
Natural gas – AECO (Cdn$/GJ) $3.79 $3.63
Funds flow (4) Per share ($/basic share)
$19.1 MM $0.27
$45-$50 MM $0.32
December 31 net debt $73.1 MM $50-$55 MM
Basic shares outstanding, December 31 128.8 MM 161.9 MM
(1) 87% natural gas
(2) Includes the disposition of three properties in 2011 with combined production as of December 31, 2010 of approximately 990 boe/d and the acquisition of properties in Q2, 2011 with production of approximately 1,000 boe/d.
(3) Guidance issued November 2011
(4) Funds flow sensitivity: +/- $1 AECO is $16 million.
17

Decades of Deep Basin experience
Stacked zone potential with >500
drilling locations
Financial capacity
Economic at <$3.00/GJ
Cequence Energy: Worth Discovering
CQE
18

Forward-Looking Information
Certain information included in this presentation constitutes forward-looking information under applicable securities legislation. This information relates to future events or future performance of the Company. Investors are cautioned that reliance on such information may not be appropriate for making investment decisions. Many factors could cause the Company’s actual results, performance or achievements to vary from those described herein. The forward-looking information contained in this presentation is expressly qualified by this and other cautionary statements set forth in the continuous disclosure record of the Company.
19

Appendix
20

Simonette-Resthaven: A Great Postal Code
Horizontal Well Activity
Resthaven
Celtic / Paramount
Montney
Kakwa /
Musreau
Paramount
Falher
Resthaven
Paramount
Dunvegan
Resthaven
Encana
Wilrich Leland
Encana
Falher
Kakwa / Chime
Encana / Tourmaline
Falher / Wilrich
North Simonette
Apache-AOSC
Montney
Simonette
CNRL
Dunvegan
Simonette
COP
Dunvegan
21
CQE land
Farm-in land
Dunvegan wells
Wilrich-Falher wells
Montney wells
6 miles
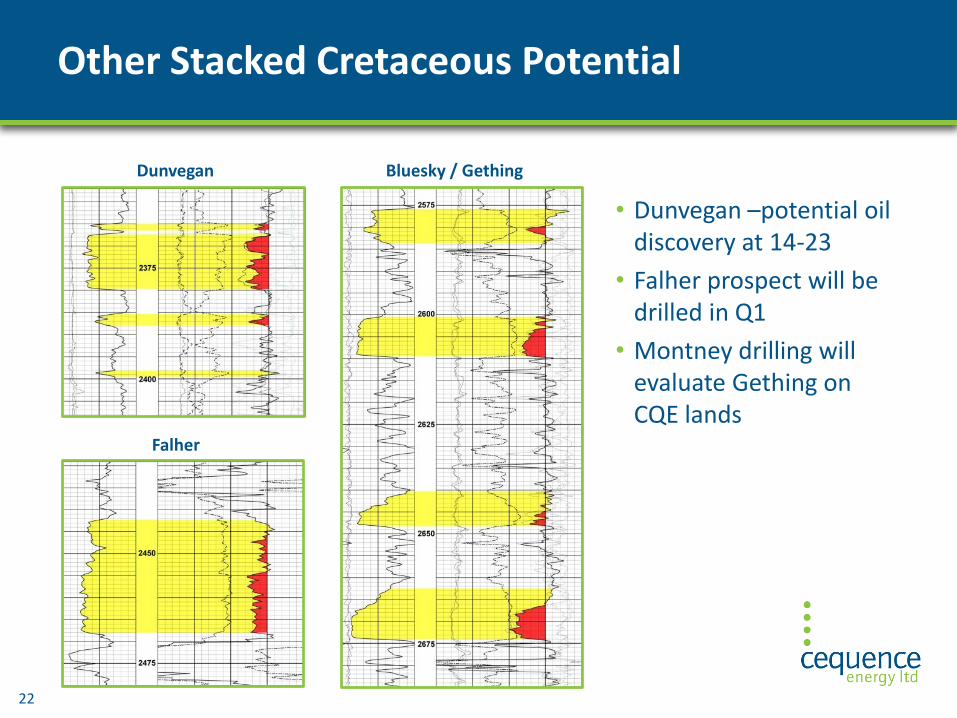
Other Stacked Cretaceous Potential
Dunvegan
Falher
Bluesky / Gething
22
• Dunvegan –potential oil discovery at 14-23
• Falher prospect will be drilled in Q1
• Montney drilling will evaluate Gething on CQE lands

Simonette Gething Development
23
CQE land
Farm-in land
CQE Gething rights
Gething gas wells
6 miles
• 100 sections with Gething potential
• Typical Gething well drains 250 acres with EUR of 2 Bcf
• 200 plus potential locations

Alberta Deep Basin The Basis of an Intermediate-Sized Inventory
Deep Basin Gething
Vertical Model
Wilrich HZ Working Model
Montney HZ Working Model
GAS PRICE cdn$/mmbtu $4.00
Reserves per well mboe 340 700 900
Model well costs – drill, case, complete and tie-in
$ millions $2.25 $5.00 $5.50
IP rate (1 month) Boe/d 320 700 800
Average first year rate Boe/d 220 450 500
Natural gas liquids Bbls/mmcf 15 20 45
IRR 78% 75% 90%+
NPV (10% BT) $ millions 2.6 4.4 8.0
F&D $/boe 6.62 7.14 6.11
POTENTIAL LOCATIONS 200 120-180 200+
24
*Economics calculated pre Aux Sable tie-in

0
2,000
4,000
6,000
8,000
10,000
12,000
14,000
$3.00 $3.50 $4.00 $4.50 $5.00 $5.50 $6.00
Simonette – Half-Cycle Development Economic Models
25
NP
V1
0 (
$M
)
Gas Price ($/mmbtu)
*Economics calculated pre Aux Sable tie-in

Financial Highlights
26
Q3 2011 Q2 2011 % Change
Average Daily Production 9,833 9,125 8
Funds flow from operations (1) $10,438 $12,042 (13)
Per share, basic and diluted $0.07 $0.08 (13)
Operating costs per boe $9.36 $8.96 4
G&A per boe $2.10 $2.37 (11)
Capital expenditures $31,222 $16,470 90
Net debt and working capital (deficiency) (2) $7,745 $65,147 (88)
Weighted average shares outstanding (basic and diluted)
152,549 144,314 6
(1) Funds flow from operations is calculated as cash flow from operating activities before adjustments for decommissioning liabilities and net changes in non-cash working capital.
(2) Net debt and working capital (deficiency) is calculated as cash, net working capital less commodity contract asset and demand credit facilities and excluding obligations on flow-through shares included with accounts payable and accrued liabilities in the consolidated balance sheet.

Contacts: Paul Wanklyn President & CEO [email protected] David Gillis
Vice President, Finance & CFO [email protected]
www.cequence-energy.com
3100, 525 - 8th Avenue SW Calgary AB T2P 1G1
Phone: 403-229-3050 Fax: 403-229-0603