january 2017 sustaining reform momentum - public...
TRANSCRIPT

Supported by funding from the Australian Government (Department of Foreign Affairs and Trade, DFAT), under the Support for Enhanced Macroeconomic and Fiscal Policy Analysis (SEMEFPA) program.
Sustaining reform momentumJanuary 2017
INDONESIA ECONOMIC QUARTERLY Sustaining reform momentum
January 2017


Preface
The Indonesia Economic Quarterly (IEQ) has two main aims. First, it reports on the key developments over the past three months in Indonesia’s economy, and places these in a longer-term and global context. Based on these developments, and on policy changes over the period, the IEQ regularly updates the outlook for Indonesia’s economy and social welfare. Second, the IEQ provides a more in-depth examination of selected economic and policy issues, and analysis of Indonesia’s medium-term development challenges. It is intended for a wide audience, including policy makers, business leaders, financial market participants, and the community of analysts and professionals engaged in Indonesia’s evolving economy.
The IEQ is a product of the World Bank’s Jakarta office and receives editorial and strategic guidance from an editorial board chaired by Rodrigo Chaves, Country Director for Indonesia. The report is compiled by the Macroeconomics and Fiscal Management Global Practice team, under the guidance of Ndiame Diop, Practice Manager, and Hans Anand Beck, Acting Lead Economist, with inputs from Sudhir Shetty, EAP Chief economist. Led by Dhruv Sharma, with responsibility for Part A, and Kelly Wyett, with responsibility for editing and production, the core project team comprises Magda Adriani, Arsianti, Dwi Endah Abriningrum, Derek H.C. Chen, Indira Maulani Hapsari, Ahya Ihsan, Yus Medina, Alief Aulia Rezza, and Jaffar Al Rikabi. Administrative support is provided by Titi Ananto. Dissemination is organized by Jerry Kurniawan, GB Surya Ningnagara, Kurniasih Suditomo, Nugroho Sunjoyo, and Suryo Utomo Tomi.
This edition of the IEQ also includes contributions from Bertine Kamphuis and Fararatri Widyadari (Part A, Box 1); Kelly Wyett, Ahya Ihsan, and Kathleen Whimp, with data support from Ratih Dwi Rahmadanti (Part B, Public Spending); Katheryn Bennett, Tazeen Fasih, Andy Ragatz and Audrey Sacks (Part C, Teaching Practices).
This report is a product of the staff of the International Bank for Reconstruction and Development/the World Bank, supported by funding from the Australian government under the Support for Enhanced Macroeconomic and Fiscal Policy Analysis (SEMEFPA) program. The findings, interpretations, and conclusions expressed in this report do not necessarily reflect the views of the Executive Directors of the World Bank or the Governments they represent, or the Australian government. The World Bank does not guarantee the accuracy of the data included in this work. The boundaries, colors, denominations, and other information shown on any map in this work do not imply any judgment on the part of the World Bank concerning the legal status of any territory or the endorsement or acceptance of such boundaries. The photographs are copyright of the World Bank. All rights reserved.
For more World Bank analysis of Indonesia’s economy:
For information about the World Bank and its activities in Indonesia, please visit www.worldbank.org/id. To receive the IEQ and related publications by email, please email [email protected]. For questions and comments, please email [email protected].

Table of contents
EXECUTIVE SUMMARY: SUSTAINING REFORM MOMENTUM ................................. I
A. ECONOMIC AND FISCAL UPDATE ............................................................................... 1
1. Global policy uncertainty and financial market volatility returned in Q4 .......................................... 1 2. GDP growth eased slightly as government spending contracted ...................................................... 2 3. Inflation remained benign on the back of subdued commodity prices ............................................. 5 4. Strong private financial inflows drove a further increase in the BOP surplus ................................... 6 5. Domestic financial conditions remain robust despite recent global headwinds ............................... 9 6. The 2017 Budget is more realistic, but reform momentum is needed to mitigate risks to the
revenue outlook ................................................................................................................................ 11 7. Risks to the macro-fiscal outlook stem mainly from external factors............................................... 13
B. SOME RECENT DEVELOPMENTS IN INDONESIA’S ECONOMY ........................ 15
Improving the quality of public spending in Indonesia ....................................................................... 15 a. Fiscal policy has contributed less than it could have done to growth and poverty reduction in Indonesia .... 16 b. Public spending reform is critical to meeting Indonesia’s development goals ............................................... 18 c. The 2017 budget shows progress towards improving the quality of public spending .................................... 24
C. INDONESIA 2018 AND BEYOND: A SELECTIVE LOOK ........................................... 26
Towards a better understanding of teaching practices and their impact on student learning outcomes in Indonesia: a video study ................................................................................................. 26
a. The video study: aim, scope, methodology, and conceptual framework ........................................................ 28 b. What happens in Indonesia’s mathematics classrooms? ................................................................................ 29 c. How do teaching practices affect student learning outcomes? ........................................................................ 31
APPENDIX: A SNAPSHOT OF INDONESIAN ECONOMIC INDICATORS ................ 34
LIST OF FIGURES
Figure 1: Financial volatility returned in Q4 ............................................................................. 1 Figure 2: Government spending contracted in Q3 .................................................................... 2 Figure 3: Business activity slowed down ................................................................................... 3 Figure 4: Inflation remained within BI’s target range .............................................................. 5 Figure 5: An increase in direct investment drove a BOP surplus ............................................. 7 Figure 6: Export values remained lower over the year .............................................................. 7 Figure 7: Net private capital flows were strong for the first time since 2014 ............................ 8 Figure 8: Foreign investors sold portfolio assets in October and November ........................... 8 Figure 9: External government debt is increasing .................................................................... 8 Figure 10: The Rupiah depreciated against the USD in line with other emerging market
currencies ................................................................................................................... 9 Figure 11: Credit growth continues to disappoint .................................................................... 10 Figure 12: Deposit growth fell sharply before rebounding ....................................................... 10 Figure 13: The Government’s approved 2017 Budget includes more realistic revenue targets 11 Figure 14: Non-Tax Amnesty revenue collection slowed ......................................................... 11 Figure 15: Disbursement of capital expenditure declined in the second half of 2016 .............. 12 Figure 16: 2016 Expenditure cuts have had unintended impacts, with material spending up
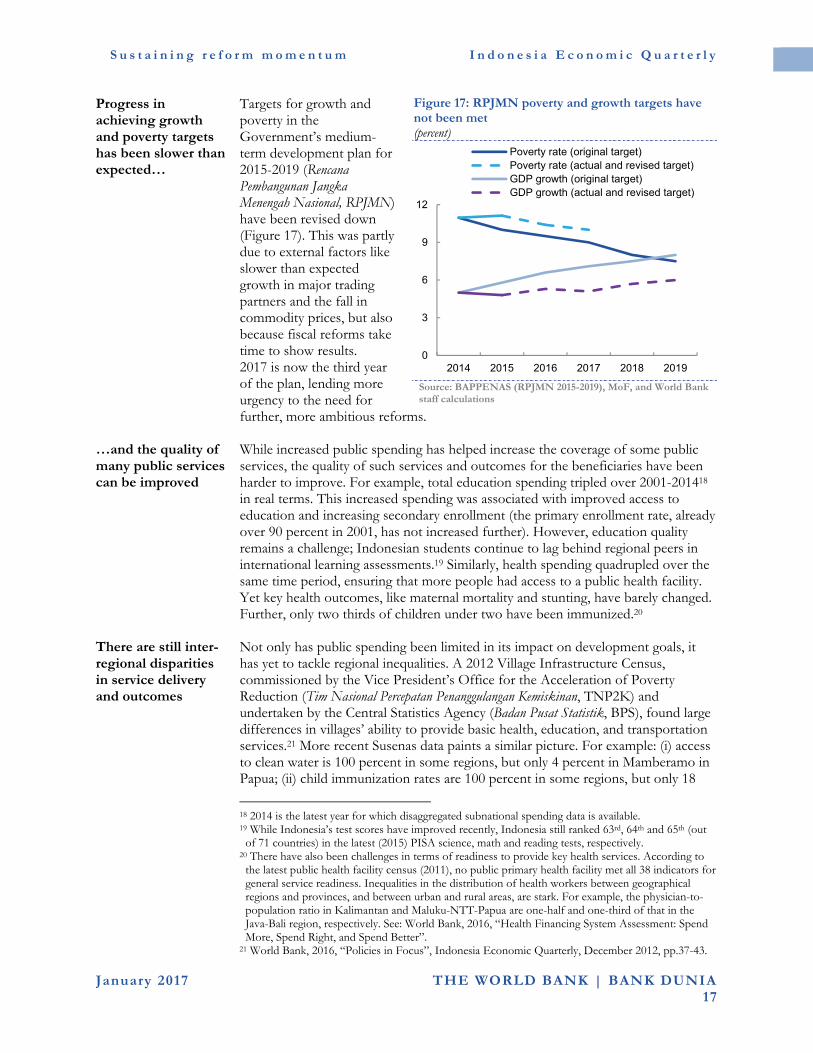
and CAPEX down ..................................................................................................... 12 Figure 17: RPJMN poverty and growth targets have not been met ......................................... 17 Figure 18: Subsidy spending has declined but remains significant ........................................ 20 Figure 19: Personnel spending is increasing as a share of central government public
expenditure and sub-national transfers ................................................................... 20 Figure 20: A large proportion of central Government agriculture spending subsidizes private
inputs ........................................................................................................................ 21 Figure 21: Indonesia’s PISA scores have risen somewhat but remain in the lowest decile of
assessed countries .................................................................................................... 23 Figure 22: The proportion of education spending on teacher salaries and allowances is
increasing ................................................................................................................. 23 Figure 23: Smaller districts receive much larger allocations per capita .................................. 23 Figure 24: Comparing the proportional breakdown of lesson time ........................................ 29 Figure 25: Comparing the duration of lesson activities in Indonesia with other countries .... 29 Figure 26: Examining different instructional practices used in Indonesian mathematics
lessons ...................................................................................................................... 30 Figure 27: Comparing class time for public and private interaction ....................................... 30 Figure 28: Breaking down public (whole-class) interaction time in Indonesian mathematics
lessons ....................................................................................................................... 31 Figure 29: Comparing mathematics class time: problem solving versus non-problem solving
segments ................................................................................................................... 31 Figure 30: This conceptual model shows how teaching practices can align with knowledge
and beliefs ................................................................................................................ 32
LIST OF APPENDIX FIGURES
Appendix Figure 1: Real GDP growth..................................................................................... 34 Appendix Figure 2: Contributions to GDP expenditures ....................................................... 34 Appendix Figure 3: Contributions to GDP production ........................................................... 34 Appendix Figure 4: Motorcycle and motor vehicle sales ........................................................ 34 Appendix Figure 5: Consumer indicators ............................................................................... 34 Appendix Figure 6: Industrial production indicators ............................................................. 34 Appendix Figure 7: Balance of payments ............................................................................... 35 Appendix Figure 8: Current account components .................................................................. 35
Appendix Figure 9: Exports of goods ..................................................................................... 35 Appendix Figure 10: Imports of goods .................................................................................... 35 Appendix Figure 11: Reserves and capital flows ..................................................................... 35 Appendix Figure 12: Inflation ................................................................................................. 35 Appendix Figure 13: Monthly breakdown of CPI ................................................................... 36 Appendix Figure 14: Inflation comparison across countries................................................... 36 Appendix Figure 15: Domestic and international rice prices .................................................. 36 Appendix Figure 16: Poverty and unemployment rate ............................................................ 36 Appendix Figure 17: Regional equity indices ......................................................................... 36 Appendix Figure 18: Selected currencies against USD ........................................................... 36 Appendix Figure 19: 5-year local currency government bond yields ...................................... 37 Appendix Figure 20: Sovereign USD bond EMBIG spread ................................................... 37 Appendix Figure 21: Commercial and rural credit and deposit growth .................................. 37 Appendix Figure 22: Banking sector indicators ...................................................................... 37 Appendix Figure 23: Government debt ................................................................................... 37 Appendix Figure 24: External debt ......................................................................................... 37
LIST OF TABLES
Table 1: In the base case, GDP growth is projected at 5.3 percent in 2017 ............................... ii Table 2: Reforms recognized by the Doing Business 2017 report............................................. 4 Table 3: 2016 and 2017 GDP growth forecasts remain unchanged ........................................... 6 Table 4: The current account deficit is expected to widen slightly in 2016 and 2017 ............... 9 Table 5: The World Bank projects lower revenue and expenditure than in the 2017 Budget .. 14
LIST OF APPENDIX TABLES
Appendix Table 1: Budget outcomes and projections ............................................................ 38 Appendix Table 2: Balance of payments ................................................................................. 38 Appendix Table 3: Indonesia’s historical macroeconomic indicators at a glance .................. 39 Appendix Table 4: Indonesia’s development indicators at a glance....................................... 40
LIST OF BOXES
Box 1: Investment climate reforms have improved Indonesia’s Ease of Doing Business ........ 4 Box 2: Personnel politics: elections and teacher hiring in Indonesia ..................................... 27

S u s t a i n i n g r e f o r m m o m e n t u m I n d o n e s i a E c o n o m i c Q u a r t e r l y
i January 2017 THE WORLD BANK | BANK DUNIA
Executive summary: Sustaining reform momentum
The return of global policy uncertainty and financial market volatility represent risks to Indonesia’s growth outlook
Heightened global policy uncertainty, particularly concerning trade agreements and the pace of interest rate normalization in the US, contributed to financial market volatility in Q4 2016. Volatility in both equity and bond market spiked in the lead up to the US presidential election in November. Risks to Indonesia’s growth in 2017 include: continued policy uncertainty and financial volatility, sluggish global trade and subdued growth in advanced economies, and the ongoing deceleration of the Chinese economy.
However, Indonesia’s recent economic performance and policy reforms can help weather these risks
Indonesia has weathered recent global financial volatility well. The Rupiah depreciated 3 percent in the immediate aftermath of the US election—a robust performance relative to other emerging markets. Inflation has remained close to the bottom of BI’s target range of 3-5 percent on the back of slower growth in rice and fuel prices, allowing a spell of accommodative monetary policy. Low inflation also contributed to robust growth in private consumption spending in Q3. Fiscal policy credibility has been enhanced through expenditure cuts to the 2016 Budget and more achievable revenue targets in the revised 2016 and approved 2017 Budgets. The 2017 Budget also features improvements in the composition of spending, including sustained higher allocations for infrastructure, health and social assistance, and improved targeting for energy subsidies and social programs. Finally, strong FDI inflows in Q3 and ongoing reforms to the investment climate, reflected in an improvement in Indonesia’s ranking in the World Bank’s Doing Business Survey, support the outlook for private investment.
GDP growth eased in Q3 as government consumption fell
Real GDP growth eased slightly to 5.0 percent year-on-year (yoy) in Q3 (from 5.2 percent in Q2) driven by a significant compression in government spending and a negative contribution from net exports. The fall in government expenditure was in

S u s t a i n i n g r e f o r m m o m e n t u m I n d o n e s i a E c o n o m i c Q u a r t e r l y
i i January 2017 THE WORLD BANK | BANK DUNIA
line with the spending cuts announced in the July revised 2016 Budget and the subsequent revision. Total fixed investment growth eased to 4.1 percent yoy in Q3.
The current account deficit narrowed and direct investment was strong in Q3
The current account deficit narrowed to 1.8 percent of GDP in Q3, from 2.2 percent in Q2, driven by an improvement in the trade balance. In quarter-on-quarter (qoq) and yoy terms, imports fell by more than exports. The decline in exports values, despite increasing commodity prices in 2016, reflects a large fall in export volumes. The financial account surplus expanded in Q3 from Q2, due to strong net private sector inflows, particularly from direct investment. This increase, combined with the improvement in the current account deficit, resulted in a moderate balance of payments surplus in Q3. External government debt is increasing, but the level remains modest at 17.4 percent of GDP, and the majority (95 percent) of this debt is long-term (maturing in more than one year).
Domestic financial conditions remain robust despite recent global headwinds
Domestic financial market strength and a relatively stable Rupiah gave way to a bout of volatility in the weeks following the US presidential election in November. Rupiah gains pared back in Q4 and bond yields rose steeply. Indonesian equities regained some of the losses incurred immediately after the US election but were still down 3.6 percent over Q4. BI’s monetary policy easing cycle halted in Q4.
Fiscal policy credibility was enhanced through expenditure cuts in 2016 and more realistic revenue targets in the approved 2017 Budget
While Tax Amnesty revenue contributed to a lower budget deficit in 2016, non-tax amnesty revenue collection weakened. VAT, income taxes from oil and gas, and non-tax natural resource revenues were all lower in nominal terms compared to 2015. Overall, the fiscal deficit was 2.46 percent of GDP in 2016 according to preliminary realization data, lower than the Ministry of Finance’s revised outlook and the World Bank’s projections of 2.7 and 2.8 percent of GDP, respectively. Spending cuts announced in July and Tax Amnesty revenues contributed to this lower deficit. However, spending cuts appear to have had perverse impacts on the composition of spending: capital expenditure declined while material spending increased in the second half of 2016. The 2017 Budget features more achievable revenue targets, compared to the previous two years. Nevertheless, further tax administration and policy reforms are required to meet these targets.
Baseline projections for real GDP growth remain at 5.1 percent for 2016 and 5.3 percent in 2017
Looking ahead, despite the slight moderation of economic growth in Q3, the World Bank’s baseline projections for real GDP growth remain at 5.1 percent for 2016 and 5.3 percent in 2017 (Table 1). Stronger growth in 2017 will be supported by more robust private investment following monetary easing in 2016 and ongoing investment climate reforms. Private consumption is also expected to pick up marginally in 2017 as inflation remains low and consumer confidence continues to improve on the back of a relatively stable Rupiah. In addition to global policy uncertainty and financial market volatility, ongoing weak revenue collection poses a
Table 1: In the base case, GDP growth is projected at 5.3 percent in 2017
2015 2016e 2017f
Real GDP (Annual percent change)
4.8 5.1 5.3
Consumer price index*
(Annual percent change)
6.4 3.5 4.4
Current account balance
(Percent of GDP)
-2.1 -2.1 -2.3
Budget balance**
(Percent of GDP)
-2.6 -2.5 -2.6
Note: *2016 Actual outcome; ** 2016 figures are based on end-2016 preliminary outturns; e stands for estimate and f stands for forecast. Source: BI; BPS; MoF; World Bank staff calculations
S u s t a i n i n g r e f o r m m o m e n t u m I n d o n e s i a E c o n o m i c Q u a r t e r l y
i i i January 2017 THE WORLD BANK | BANK DUNIA
downside risk to the growth outlook, while a continuation of the recovery in commodity prices presents an upside risk.
Improving the quality of public spending is critical for Indonesia to achieve its development goals in the short to medium term
Weak revenue collection, combined with limits to the fiscal deficit, hinder significant increases in the level of public expenditure, at least in the medium term. As such, improving the quality of public spending, at both the central and sub-national level, is the main budget mechanism through which the Government can seek to improve service delivery and achieve its development goals in the short to medium term, while persisting with revenue reforms. Despite improvement, progress in achieving higher growth and lower poverty has been slower than desired, and the quality of many public services is still lagging, despite increasing expenditure. Improving the quality of spending refers to two separate actions. First, it entails reallocating spending towards priority sectors, i.e. those where public spending is low and where additional spending can have the greatest impact on poverty and growth. For Indonesia, these sectors include infrastructure, health, and social assistance. Second, it entails maximizing the impact of spending on desired outcomes for targeted beneficiaries. This entails reallocating spending within sectors, particularly in education and agriculture, to programs that have the highest impacts on sectoral goals, as well as effective sectoral policies that support the impact of increased spending. The 2017 Budget takes some steps towards improving the quality of public spending, but further reform is required.
Student-centered teaching practices result in better student learning outcomes
Education spending is one area where the effectiveness of spending can be improved. Indonesia is striving to improve the quality of education and to assist students to develop higher-order thinking skills. The utilization of a student-centered learning approach is considered to be at the core of this change. This involves less teacher-centered lecturing and more interactive learning, drawing upon investigative and practical teaching practices with a connection to real world contexts. Student-centered learning approaches were incorporated into Indonesia’s education policy more than thirty years ago. However, a recent video study of teacher behavior found that the adoption of student-centered learning practices by teachers has been slow. The study linked its examination of teacher practices to test results and found that teachers who use student-centered practices achieve better student learning outcomes than those who use teacher-centered practices. The study also found that teaching practices are influenced by teacher beliefs and knowledge, and this relationship impacts teacher effectiveness. That is, it is not enough for teachers to just start using student-centered practices, they must also develop the beliefs and knowledge to enable them to implement these practices.

S u s t a i n i n g r e f o r m m o m e n t u m I n d o n e s i a E c o n o m i c Q u a r t e r l y
1 January 2017 THE WORLD BANK | BANK DUNIA
A. Economic and fiscal update
1. Global policy uncertainty and financial market volatility returned in Q4
Heightened policy uncertainty and increased financial market volatility returned in Q4
Heightened global policy uncertainty, especially in major advanced economies, and increased international financial market volatility returned in early Q4. This volatility, coupled with sluggish global trade and subdued growth in advanced economies, has generated significant headwinds for Indonesia. Resilience through robust fundamentals has helped Indonesia weather these external headwinds.
Global bond market volatility rose significantly
After a relatively stable Q3, global financial market volatility returned in Q4, particularly in bond markets (Figure 1). The VIX index, which measures volatility in equity markets, spiked sharply to 22.5, representing an increase of 32 percent over a week in the lead up to the US elections in the first week of November, before sharply declining and then stabilizing below its pre-election 2016 average level of 14. The MOVE index that measures bond market volatility also spiked in November and then stabilized at an elevated level similar to that seen just prior to the ‘Brexit referendum’ in the UK. This financial market volatility and global policy uncertainty affected the Rupiah which depreciated by 3.4
Figure 1: Financial volatility returned in Q4 (index)
Source: Bloomberg, World Bank staff calculations
0
20
40
60
80
100
120
140
0
5
10
15
20
25
30
35
40
Sep-2015 May-2016 Jan-2017
MOVE (RHS)
VIX (LHS)
S u s t a i n i n g r e f o r m m o m e n t u m I n d o n e s i a E c o n o m i c Q u a r t e r l y
2 January 2017 THE WORLD BANK | BANK DUNIA
percent in Q4 against the USD, albeit in line with depreciations in other emerging market currencies, which fell by 3.8 percent on average.
Key commodity prices showed tentative signs of a recovery
Prices for Indonesia’s key export commodities improved in Q4 especially for coal, palm oil, base metals, and natural gas. Palm oil prices are expected to be supported by an uptick in demand from China and India and supply pressures due to adverse La Nina weather effects. On the oil and gas front, the latest production figures for Q3 showed a marginal decline in global oil production (down 0.7 percent qoq) and prices (down 0.4 percent qoq). Following the Organization of Petroleum Exporting Countries (OPEC) decision to curb its combined production by 1.2 million barrels per day (bpd) in 2017, the Indonesian government has temporarily withdrawn its membership from the oil cartel. OPEC’s decision required Indonesia to cut its production up to 37,000 bpd, or 4.5 percent of the 815,000 target in the 2017 Budget, which was already 5000 bpd lower than the target in the revised 2016 Budget. These global developments represent risks to Indonesia’s growth outlook. However, as the following sections outline, Indonesia’s recent economic performance leaves it well placed to mitigate any significant adverse impacts.
2. GDP growth eased slightly as government spending contracted
GDP growth eased as government consumption contracted
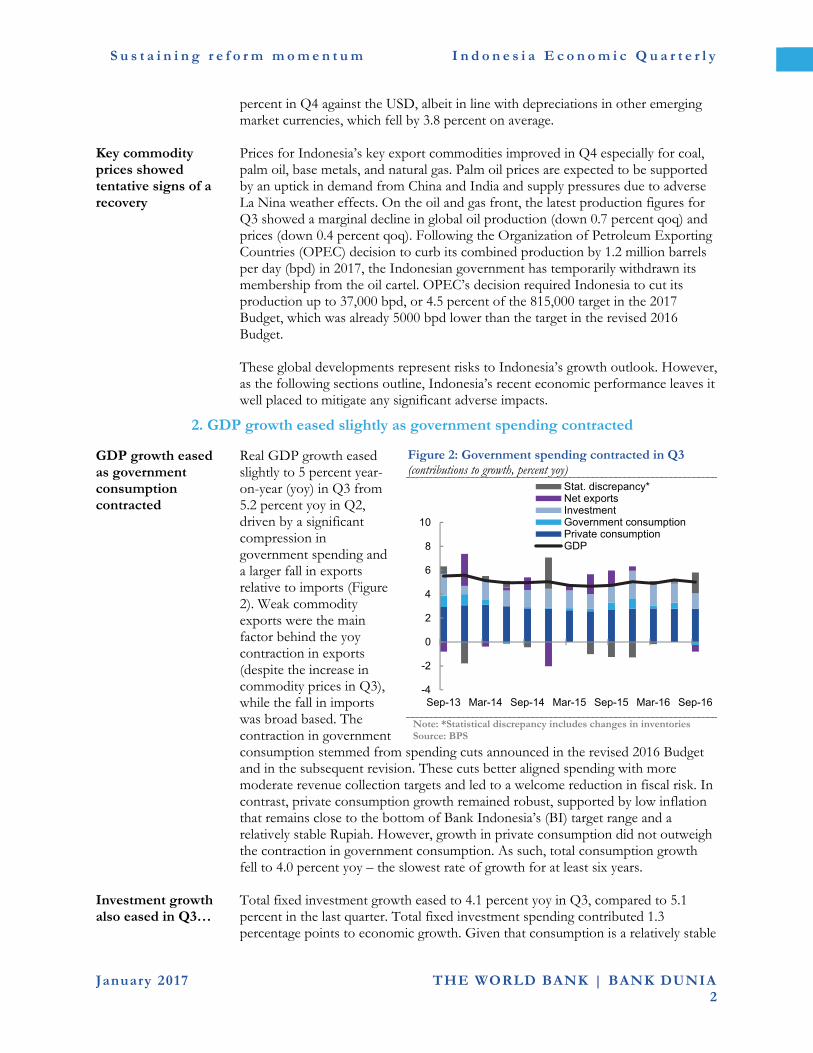
Real GDP growth eased slightly to 5 percent year-on-year (yoy) in Q3 from 5.2 percent yoy in Q2, driven by a significant compression in government spending and a larger fall in exports relative to imports (Figure 2). Weak commodity exports were the main factor behind the yoy contraction in exports (despite the increase in commodity prices in Q3), while the fall in imports was broad based. The contraction in government consumption stemmed from spending cuts announced in the revised 2016 Budget and in the subsequent revision. These cuts better aligned spending with more moderate revenue collection targets and led to a welcome reduction in fiscal risk. In contrast, private consumption growth remained robust, supported by low inflation that remains close to the bottom of Bank Indonesia’s (BI) target range and a relatively stable Rupiah. However, growth in private consumption did not outweigh the contraction in government consumption. As such, total consumption growth fell to 4.0 percent yoy – the slowest rate of growth for at least six years.
Figure 2: Government spending contracted in Q3 (contributions to growth, percent yoy)
Note: *Statistical discrepancy includes changes in inventories Source: BPS
Investment growth also eased in Q3…
Total fixed investment growth eased to 4.1 percent yoy in Q3, compared to 5.1 percent in the last quarter. Total fixed investment spending contributed 1.3 percentage points to economic growth. Given that consumption is a relatively stable
-4
-2
0
2
4
6
8
10
Sep-13 Mar-14 Sep-14 Mar-15 Sep-15 Mar-16 Sep-16
Stat. discrepancy*Net exportsInvestmentGovernment consumptionPrivate consumptionGDP
S u s t a i n i n g r e f o r m m o m e n t u m I n d o n e s i a E c o n o m i c Q u a r t e r l y
3 January 2017 THE WORLD BANK | BANK DUNIA
source of growth, reformative measures (such as improving the business environment, as measured by the “Doing Business Survey;” see Box 1) aimed at bolstering growth prospects will need to center on boosting investment. Indonesia’s relatively low share of public investment implies that any pickup in investment growth will most likely have to be predominantly driven by private investment.
…while net exports detracted from growth
Reflecting stagnant global trade1, sluggish growth in key export markets, and weak commodity exports, exports contracted more than imports in Q3 (6 percent yoy versus 3.9 percent yoy). This resulted in a negative contribution of 0.6 percentage points from net exports’ to Q3 yoy economic growth.
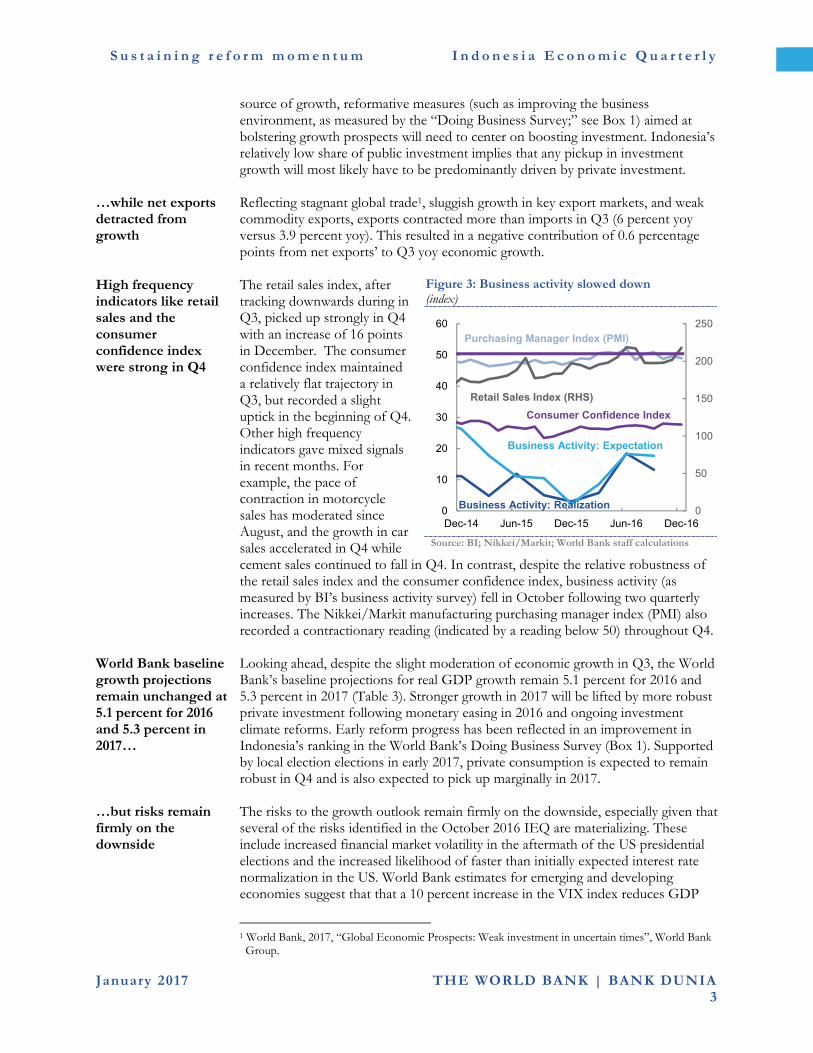
High frequency indicators like retail sales and the consumer confidence index were strong in Q4
The retail sales index, after tracking downwards during in Q3, picked up strongly in Q4 with an increase of 16 points in December. The consumer confidence index maintained a relatively flat trajectory in Q3, but recorded a slight uptick in the beginning of Q4. Other high frequency indicators gave mixed signals in recent months. For example, the pace of contraction in motorcycle sales has moderated since August, and the growth in car sales accelerated in Q4 while cement sales continued to fall in Q4. In contrast, despite the relative robustness of the retail sales index and the consumer confidence index, business activity (as measured by BI’s business activity survey) fell in October following two quarterly increases. The Nikkei/Markit manufacturing purchasing manager index (PMI) also recorded a contractionary reading (indicated by a reading below 50) throughout Q4.
Figure 3: Business activity slowed down (index)
Source: BI; Nikkei/Markit; World Bank staff calculations
World Bank baseline growth projections remain unchanged at 5.1 percent for 2016 and 5.3 percent in 2017…
Looking ahead, despite the slight moderation of economic growth in Q3, the World Bank’s baseline projections for real GDP growth remain 5.1 percent for 2016 and 5.3 percent in 2017 (Table 3). Stronger growth in 2017 will be lifted by more robust private investment following monetary easing in 2016 and ongoing investment climate reforms. Early reform progress has been reflected in an improvement in Indonesia’s ranking in the World Bank’s Doing Business Survey (Box 1). Supported by local election elections in early 2017, private consumption is expected to remain robust in Q4 and is also expected to pick up marginally in 2017.
…but risks remain firmly on the downside
The risks to the growth outlook remain firmly on the downside, especially given that several of the risks identified in the October 2016 IEQ are materializing. These include increased financial market volatility in the aftermath of the US presidential elections and the increased likelihood of faster than initially expected interest rate normalization in the US. World Bank estimates for emerging and developing economies suggest that that a 10 percent increase in the VIX index reduces GDP
1 World Bank, 2017, “Global Economic Prospects: Weak investment in uncertain times”, World Bank Group.
0
50
100
150
200
250
0
10
20
30
40
50
60
Dec-14 Jun-15 Dec-15 Jun-16 Dec-16
Business Activity: Realization
Business Activity: Expectation
Purchasing Manager Index (PMI)
Consumer Confidence Index
Retail Sales Index (RHS)
S u s t a i n i n g r e f o r m m o m e n t u m I n d o n e s i a E c o n o m i c Q u a r t e r l y
4 January 2017 THE WORLD BANK | BANK DUNIA
growth by approximately 0.2 percentage points and investment growth by 0.5 percentage points after one year.2 Heightened global policy uncertainty, especially regarding trade agreements, creates additional downside risks for Indonesia’s growth outlook in 2017. On the domestic front, weak fiscal revenue collection remains a significant downside risk.
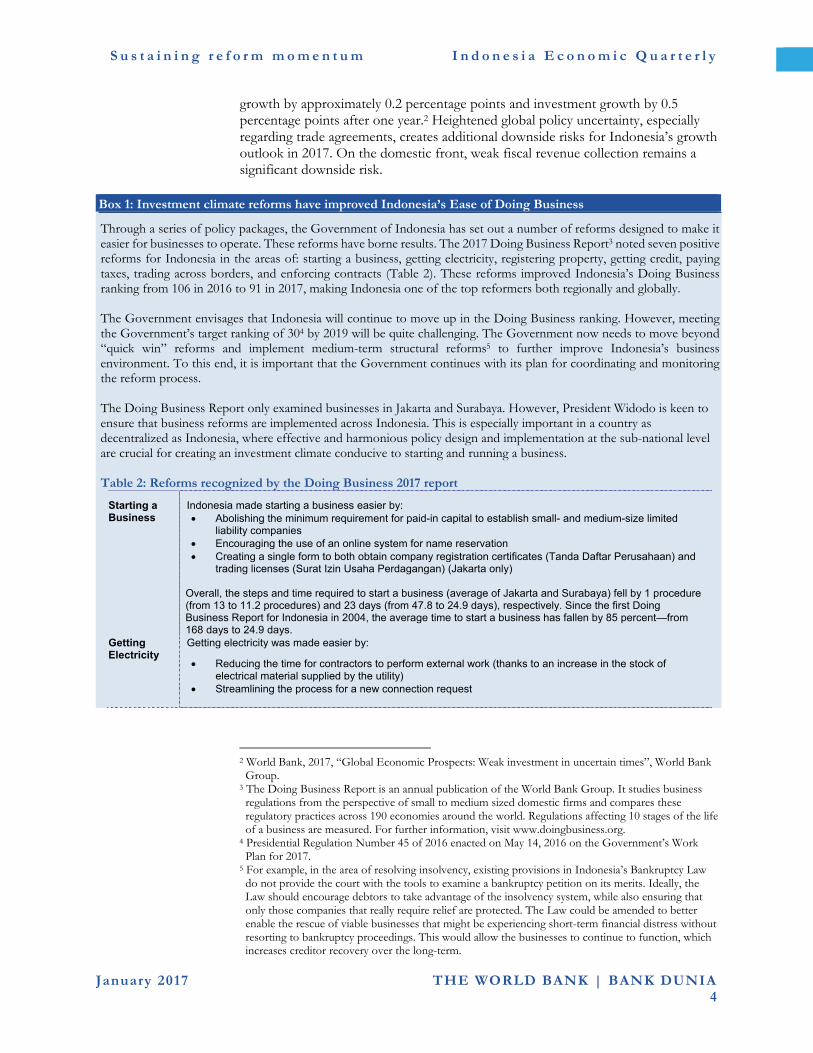
Box 1: Investment climate reforms have improved Indonesia’s Ease of Doing Business
Through a series of policy packages, the Government of Indonesia has set out a number of reforms designed to make it easier for businesses to operate. These reforms have borne results. The 2017 Doing Business Report3 noted seven positive reforms for Indonesia in the areas of: starting a business, getting electricity, registering property, getting credit, paying taxes, trading across borders, and enforcing contracts (Table 2). These reforms improved Indonesia’s Doing Business ranking from 106 in 2016 to 91 in 2017, making Indonesia one of the top reformers both regionally and globally. The Government envisages that Indonesia will continue to move up in the Doing Business ranking. However, meeting the Government’s target ranking of 304 by 2019 will be quite challenging. The Government now needs to move beyond “quick win” reforms and implement medium-term structural reforms5 to further improve Indonesia’s business environment. To this end, it is important that the Government continues with its plan for coordinating and monitoring the reform process. The Doing Business Report only examined businesses in Jakarta and Surabaya. However, President Widodo is keen to ensure that business reforms are implemented across Indonesia. This is especially important in a country as decentralized as Indonesia, where effective and harmonious policy design and implementation at the sub-national level are crucial for creating an investment climate conducive to starting and running a business. Table 2: Reforms recognized by the Doing Business 2017 report
Starting a Business
Indonesia made starting a business easier by: Abolishing the minimum requirement for paid-in capital to establish small- and medium-size limited
liability companies Encouraging the use of an online system for name reservation Creating a single form to both obtain company registration certificates (Tanda Daftar Perusahaan) and
trading licenses (Surat Izin Usaha Perdagangan) (Jakarta only) Overall, the steps and time required to start a business (average of Jakarta and Surabaya) fell by 1 procedure (from 13 to 11.2 procedures) and 23 days (from 47.8 to 24.9 days), respectively. Since the first Doing Business Report for Indonesia in 2004, the average time to start a business has fallen by 85 percent—from 168 days to 24.9 days.
Getting Electricity
Getting electricity was made easier by:
Reducing the time for contractors to perform external work (thanks to an increase in the stock of electrical material supplied by the utility)
Streamlining the process for a new connection request
2 World Bank, 2017, “Global Economic Prospects: Weak investment in uncertain times”, World Bank Group.
3 The Doing Business Report is an annual publication of the World Bank Group. It studies business regulations from the perspective of small to medium sized domestic firms and compares these regulatory practices across 190 economies around the world. Regulations affecting 10 stages of the life of a business are measured. For further information, visit www.doingbusiness.org.
4 Presidential Regulation Number 45 of 2016 enacted on May 14, 2016 on the Government’s Work Plan for 2017.
5 For example, in the area of resolving insolvency, existing provisions in Indonesia’s Bankruptcy Law do not provide the court with the tools to examine a bankruptcy petition on its merits. Ideally, the Law should encourage debtors to take advantage of the insolvency system, while also ensuring that only those companies that really require relief are protected. The Law could be amended to better enable the rescue of viable businesses that might be experiencing short-term financial distress without resorting to bankruptcy proceedings. This would allow the businesses to continue to function, which increases creditor recovery over the long-term.
S u s t a i n i n g r e f o r m m o m e n t u m I n d o n e s i a E c o n o m i c Q u a r t e r l y
5 January 2017 THE WORLD BANK | BANK DUNIA
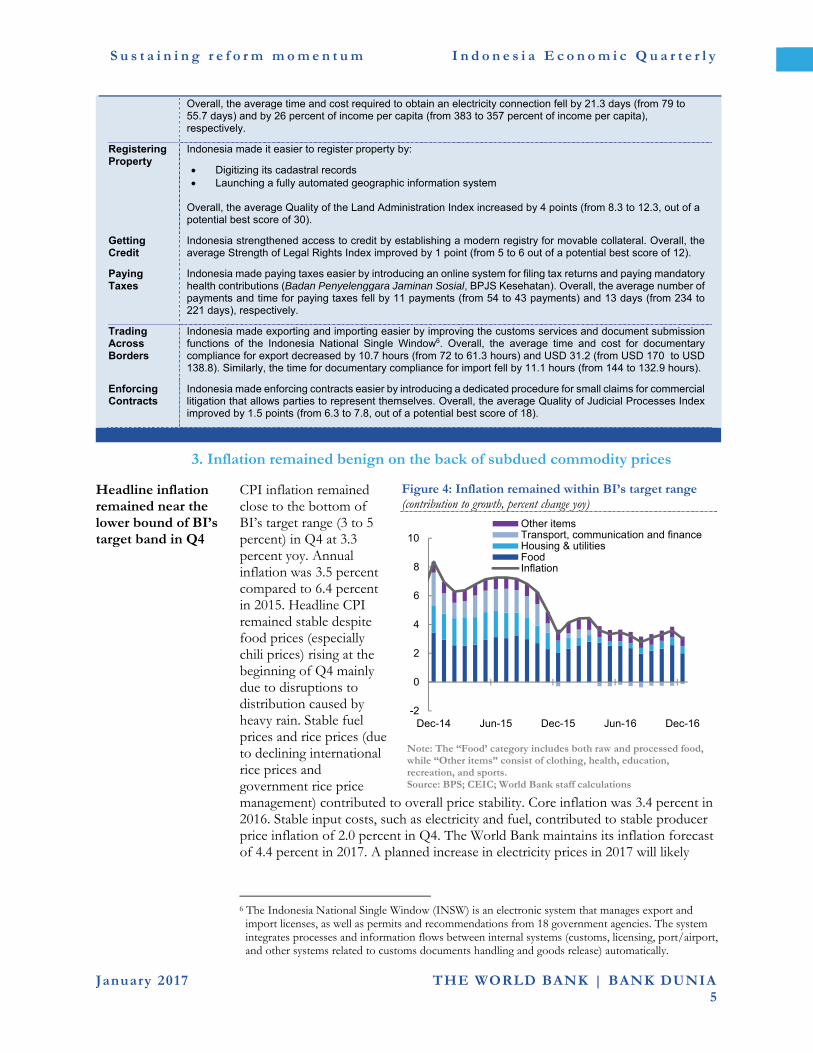
Overall, the average time and cost required to obtain an electricity connection fell by 21.3 days (from 79 to 55.7 days) and by 26 percent of income per capita (from 383 to 357 percent of income per capita), respectively.
Registering Property
Indonesia made it easier to register property by:
Digitizing its cadastral records Launching a fully automated geographic information system
Overall, the average Quality of the Land Administration Index increased by 4 points (from 8.3 to 12.3, out of a potential best score of 30).
Getting Credit
Indonesia strengthened access to credit by establishing a modern registry for movable collateral. Overall, the average Strength of Legal Rights Index improved by 1 point (from 5 to 6 out of a potential best score of 12).
Paying Taxes
Indonesia made paying taxes easier by introducing an online system for filing tax returns and paying mandatory health contributions (Badan Penyelenggara Jaminan Sosial, BPJS Kesehatan). Overall, the average number of payments and time for paying taxes fell by 11 payments (from 54 to 43 payments) and 13 days (from 234 to 221 days), respectively.
Trading Across Borders
Indonesia made exporting and importing easier by improving the customs services and document submission functions of the Indonesia National Single Window6. Overall, the average time and cost for documentary compliance for export decreased by 10.7 hours (from 72 to 61.3 hours) and USD 31.2 (from USD 170 to USD 138.8). Similarly, the time for documentary compliance for import fell by 11.1 hours (from 144 to 132.9 hours).
Enforcing Contracts
Indonesia made enforcing contracts easier by introducing a dedicated procedure for small claims for commercial litigation that allows parties to represent themselves. Overall, the average Quality of Judicial Processes Index improved by 1.5 points (from 6.3 to 7.8, out of a potential best score of 18).
3. Inflation remained benign on the back of subdued commodity prices
Headline inflation remained near the lower bound of BI’s target band in Q4
CPI inflation remained close to the bottom of BI’s target range (3 to 5 percent) in Q4 at 3.3 percent yoy. Annual inflation was 3.5 percent compared to 6.4 percent in 2015. Headline CPI remained stable despite food prices (especially chili prices) rising at the beginning of Q4 mainly due to disruptions to distribution caused by heavy rain. Stable fuel prices and rice prices (due to declining international rice prices and government rice price management) contributed to overall price stability. Core inflation was 3.4 percent in 2016. Stable input costs, such as electricity and fuel, contributed to stable producer price inflation of 2.0 percent in Q4. The World Bank maintains its inflation forecast of 4.4 percent in 2017. A planned increase in electricity prices in 2017 will likely
Figure 4: Inflation remained within BI’s target range (contribution to growth, percent change yoy)
Note: The “Food’ category includes both raw and processed food, while “Other items” consist of clothing, health, education, recreation, and sports. Source: BPS; CEIC; World Bank staff calculations
6 The Indonesia National Single Window (INSW) is an electronic system that manages export and
import licenses, as well as permits and recommendations from 18 government agencies. The system integrates processes and information flows between internal systems (customs, licensing, port/airport, and other systems related to customs documents handling and goods release) automatically.
-2
0
2
4
6
8
10
Dec-14 Jun-15 Dec-15 Jun-16 Dec-16
Other itemsTransport, communication and financeHousing & utilitiesFoodInflation

S u s t a i n i n g r e f o r m m o m e n t u m I n d o n e s i a E c o n o m i c Q u a r t e r l y
6 January 2017 THE WORLD BANK | BANK DUNIA
increase headline inflation both directly (albeit marginally) and indirectly through an increase in production costs.
Table 3: 2016 and 2017 GDP growth forecasts remain unchanged (percent change, unless otherwise indicated)
Annual YoY in Fourth Quarter Revision to Annual
2015 2016e 2017f 2015 2016 2016 2017
1. Main economic indicators
Total Consumption expenditure 4.9 4.4 4.9 5.4 3.7 -0.5 -0.3
Private consumption expenditure 4.8 5.1 5.3 5.0 5.3 0.1 0.0
government consumption 5.4 0.0 2.2 7.3 -3.5 -4.2 -2.9
Gross fixed capital formation 5.1 4.7 6.2 6.9 4.0 0.0 1.0
Exports of goods and services -2.0 -2.8 1.5 -6.4 0.8 -1.6 -1.9
Imports of goods and services -5.8 -3.6 1.6 -8.1 -2.7 -1.3 -1.1
Gross Domestic Product 4.8 5.1 5.3 5.0 5.1 0.0 0.0
2. External indicators
Balance of payments (USD bn) -1.1 1.4 5.8 - - 0.0 0.0
Current account balance (USD bn) -17.7 -20.1 -24.9 - - 0.0 0.0
As share of GDP (percent) -2.1 -2.1 -2.3 - - 0.0 0.0
Trade balance (USD bn) 5.0 6.2 5.2 - - 0.0 0.2
Capital & financial acc. bal. (USD bn) 17.1 22.4 32.1 - - 0.0 0.0
3. Fiscal indicators1
Central gov. revenue (% of GDP) 13.1 12.5 12.3 - - -0.4 -0.2
Central gov. expenditure (% of GDP) 15.7 14.9 14.9 - - -0.5 -0.3
Fiscal balance (% of GDP) -2.6 -2.5 -2.6 - - 0.1 0.2
Primary balance (% of GDP) -1.2 -1.0 -0.9 - - 0.0 0.3
4. Other economic indicators
Consumer price index2 6.4 3.5 4.4 4.8 4.0 -0.1 0.0
GDP Deflator 4.2 2.5 4.3 4.0 3.0 -0.2 -0.1
Nominal GDP 9.2 7.7 9.8 9.2 8.3 -0.2 -0.2
5. Economic Assumptions
Exchange rate (IDR/USD)2 13389 13309 13300 - - 9.0 0.0
Indonesian crude price (USD/bl)2 49 40 51 - - 1.0 0.0
1 2016 figures are based on end-2016 preliminary outturns 2 Actual 2016 outcome Notes: e stands for estimate, f stands for forecast. Exports and imports refer to volumes from the national accounts. Statistical discrepancy and change in inventories are not presented in this table. All figures are based on revised and rebased GDP. Exchange rate and crude oil price assumptions are based on recent averages. Revisions are relative to projections in the October 2016 IEQ. Source: BPS; BI; CEIC; World Bank staff projections
4. Strong private financial inflows drove a further increase in the BOP surplus
Strong direct investment drove a further increase in the BOP surplus in Q3 2016
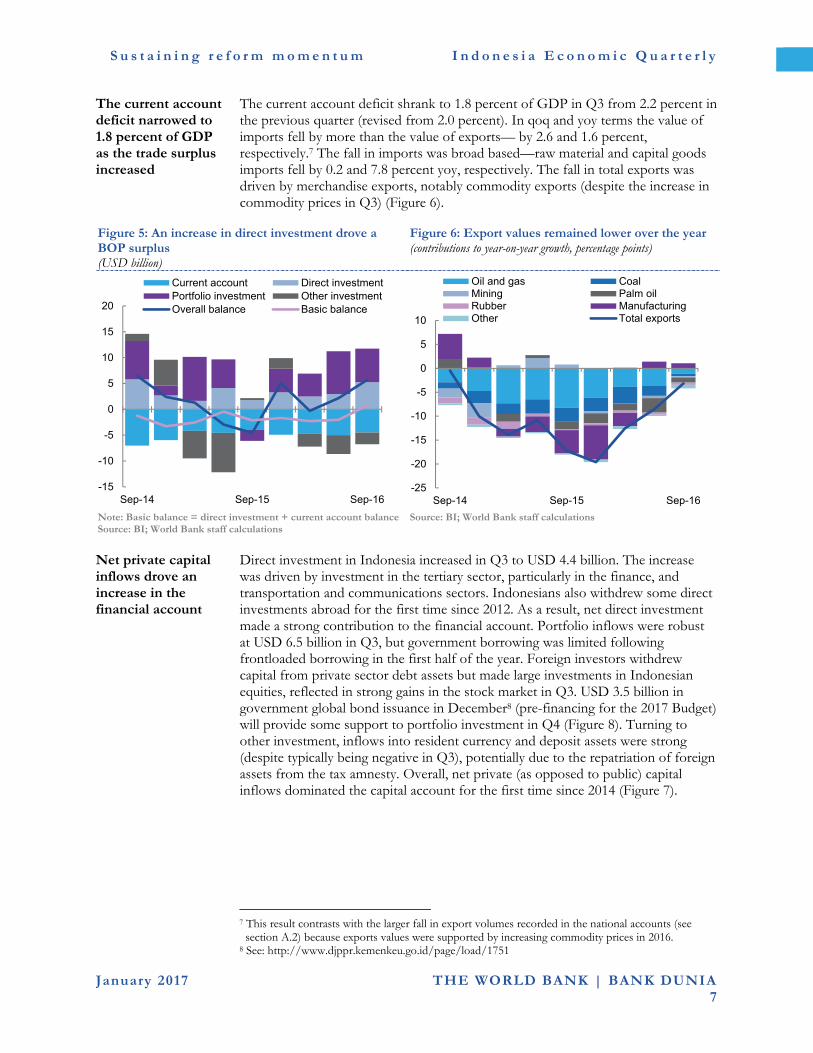
An increase in direct investment resulted in a balance of payments (BOP) surplus in Q3 (Figure 5). The current account deficit narrowed, driven by an improvement in the trade balance as imports fell by more than exports. The financial account expanded due to strong net private sector inflows, particularly from direct investment. External government debt is increasing, but the level remains modest at 17.4 percent of GDP.
S u s t a i n i n g r e f o r m m o m e n t u m I n d o n e s i a E c o n o m i c Q u a r t e r l y
7 January 2017 THE WORLD BANK | BANK DUNIA
The current account deficit narrowed to 1.8 percent of GDP as the trade surplus increased
The current account deficit shrank to 1.8 percent of GDP in Q3 from 2.2 percent in the previous quarter (revised from 2.0 percent). In qoq and yoy terms the value of imports fell by more than the value of exports— by 2.6 and 1.6 percent, respectively.7 The fall in imports was broad based—raw material and capital goods imports fell by 0.2 and 7.8 percent yoy, respectively. The fall in total exports was driven by merchandise exports, notably commodity exports (despite the increase in commodity prices in Q3) (Figure 6).
Figure 5: An increase in direct investment drove a BOP surplus (USD billion)
Figure 6: Export values remained lower over the year (contributions to year-on-year growth, percentage points)
Note: Basic balance = direct investment + current account balance Source: BI; World Bank staff calculations
Source: BI; World Bank staff calculations
Net private capital inflows drove an increase in the financial account
Direct investment in Indonesia increased in Q3 to USD 4.4 billion. The increase was driven by investment in the tertiary sector, particularly in the finance, and transportation and communications sectors. Indonesians also withdrew some direct investments abroad for the first time since 2012. As a result, net direct investment made a strong contribution to the financial account. Portfolio inflows were robust at USD 6.5 billion in Q3, but government borrowing was limited following frontloaded borrowing in the first half of the year. Foreign investors withdrew capital from private sector debt assets but made large investments in Indonesian equities, reflected in strong gains in the stock market in Q3. USD 3.5 billion in government global bond issuance in December8 (pre-financing for the 2017 Budget) will provide some support to portfolio investment in Q4 (Figure 8). Turning to other investment, inflows into resident currency and deposit assets were strong (despite typically being negative in Q3), potentially due to the repatriation of foreign assets from the tax amnesty. Overall, net private (as opposed to public) capital inflows dominated the capital account for the first time since 2014 (Figure 7).
7 This result contrasts with the larger fall in export volumes recorded in the national accounts (see
section A.2) because exports values were supported by increasing commodity prices in 2016. 8 See: http://www.djppr.kemenkeu.go.id/page/load/1751
-15
-10
-5
0
5
10
15
20
Sep-14 Sep-15 Sep-16
Current account Direct investmentPortfolio investment Other investmentOverall balance Basic balance
-25
-20
-15
-10
-5
0
5
10
Sep-14 Sep-15 Sep-16
Oil and gas CoalMining Palm oilRubber ManufacturingOther Total exports

S u s t a i n i n g r e f o r m m o m e n t u m I n d o n e s i a E c o n o m i c Q u a r t e r l y
8 January 2017 THE WORLD BANK | BANK DUNIA
Figure 7: Net private capital flows were strong for the first time since 2014 (USD billion)
Figure 8: Foreign investors sold portfolio assets in October and November (USD billion (LHS), basis points (RHS))
Source: BI; World Bank staff calculations Note: Public debt includes government and central bank debt.
SUN: Surat Utang Negara (Conventional government Securities), SBI: Sertifikat Bank Indonesia Source: BI; World Bank staff calculations
External government debt is increasing but remains modest
Public external debt has grown over the past 12 months (Figure 9). However, the total stock of external public debt is still modest at 17.4 percent of GDP in Q3. The recent increase has been driven by demand for long-term debt only. Short-term debt has been relatively stable in level terms since 2010 and falling as a proportion of total public debt since 2013, reaching 4.9 percent in October 2016. Private external debt has been mostly stable in recent years. However, a much higher proportion (43 percent) is short-term than is the case for government external debt. Total short-term debt as a proportion of foreign exchange reserves has been relatively stable at 50 percent. There are some risks to the outlook for external debt due to instability in global financial markets and the potential for interest rates to rise and the exchange rate to depreciate further9. Both would put some pressure on debt repayments, particularly in Q1 2017 (as interest payments on external debt are typically highest in Q1).
Figure 9: External government debt is increasing (year-on-year growth (LHS), USD billion (RHS))
Source: BI; World Bank staff calculations
9 67 per cent of Indonesia’s external debt is denominated in USD, 8.5 percent in Japanese Yen, 18
percent in Rupiah, and the remainder in other foreign currencies.
-5
0
5
10
15
20
Sep-13 Sep-14 Sep-15 Sep-16
Financial derivatives
Net public capital flows
Net private capital flows
Financial account
0
200
400
600
-5
0
5
10
Dec-14 Dec-15 Dec-16
Gov. global bonds SUNSBI EquitiesMain net portfolio inflows EMBIG spread (RHS)
50
100
150
200
250
300
-30
-20
-10
0
10
20
30
Sep-13 Sep-14 Sep-15 Sep-16
Public debt growth (LHS)
Private debt growth (LHS)
Private debt (RHS)
Public debt (RHS)
S u s t a i n i n g r e f o r m m o m e n t u m I n d o n e s i a E c o n o m i c Q u a r t e r l y
9 January 2017 THE WORLD BANK | BANK DUNIA
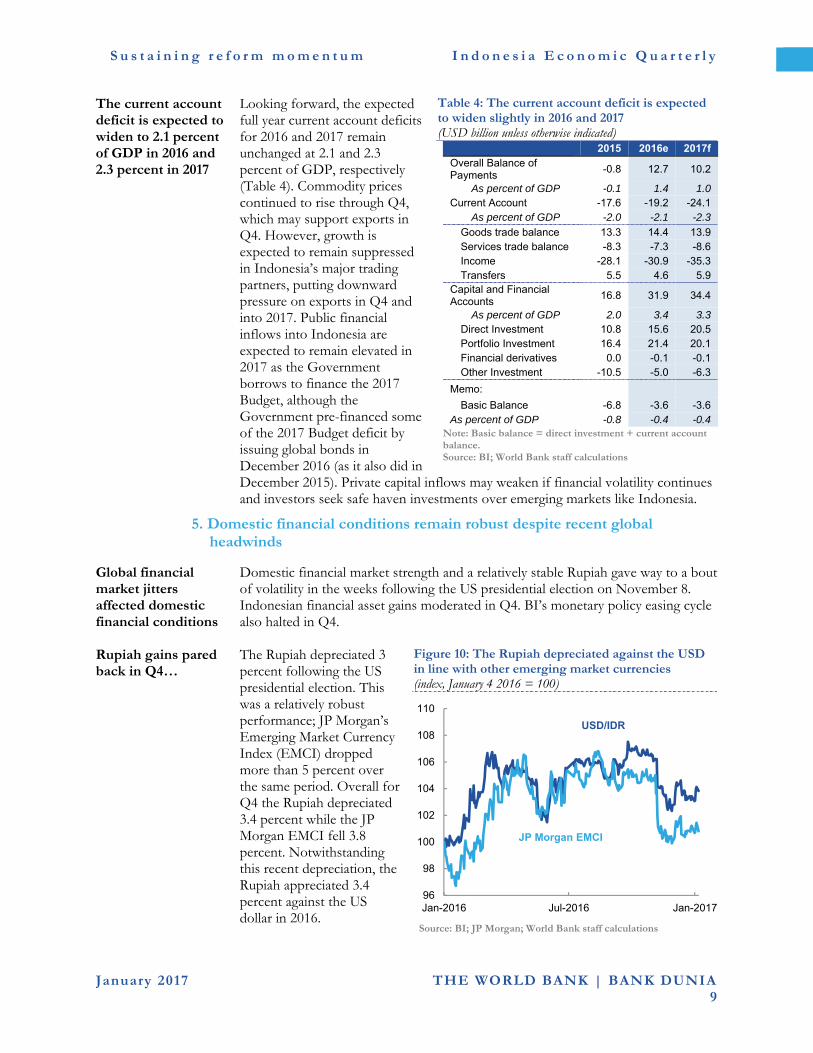
The current account deficit is expected to widen to 2.1 percent of GDP in 2016 and 2.3 percent in 2017
Looking forward, the expected full year current account deficits for 2016 and 2017 remain unchanged at 2.1 and 2.3 percent of GDP, respectively (Table 4). Commodity prices continued to rise through Q4, which may support exports in Q4. However, growth is expected to remain suppressed in Indonesia’s major trading partners, putting downward pressure on exports in Q4 and into 2017. Public financial inflows into Indonesia are expected to remain elevated in 2017 as the Government borrows to finance the 2017 Budget, although the Government pre-financed some of the 2017 Budget deficit by issuing global bonds in December 2016 (as it also did in December 2015). Private capital inflows may weaken if financial volatility continues and investors seek safe haven investments over emerging markets like Indonesia.
Table 4: The current account deficit is expected to widen slightly in 2016 and 2017 (USD billion unless otherwise indicated)
2015 2016e 2017f Overall Balance of Payments
-0.8 12.7 10.2
As percent of GDP -0.1 1.4 1.0 Current Account -17.6 -19.2 -24.1
As percent of GDP -2.0 -2.1 -2.3
Goods trade balance 13.3 14.4 13.9 Services trade balance -8.3 -7.3 -8.6 Income -28.1 -30.9 -35.3 Transfers 5.5 4.6 5.9
Capital and Financial Accounts
16.8 31.9 34.4
As percent of GDP 2.0 3.4 3.3 Direct Investment 10.8 15.6 20.5 Portfolio Investment 16.4 21.4 20.1 Financial derivatives 0.0 -0.1 -0.1 Other Investment -10.5 -5.0 -6.3
Memo: Basic Balance -6.8 -3.6 -3.6
As percent of GDP -0.8 -0.4 -0.4
Note: Basic balance = direct investment + current account balance. Source: BI; World Bank staff calculations
5. Domestic financial conditions remain robust despite recent global headwinds
Global financial market jitters affected domestic financial conditions
Domestic financial market strength and a relatively stable Rupiah gave way to a bout of volatility in the weeks following the US presidential election on November 8. Indonesian financial asset gains moderated in Q4. BI’s monetary policy easing cycle also halted in Q4.
Rupiah gains pared back in Q4…
The Rupiah depreciated 3 percent following the US presidential election. This was a relatively robust performance; JP Morgan’s Emerging Market Currency Index (EMCI) dropped more than 5 percent over the same period. Overall for Q4 the Rupiah depreciated 3.4 percent while the JP Morgan EMCI fell 3.8 percent. Notwithstanding this recent depreciation, the Rupiah appreciated 3.4 percent against the US dollar in 2016.
Figure 10: The Rupiah depreciated against the USD in line with other emerging market currencies (index, January 4 2016 = 100)
Source: BI; JP Morgan; World Bank staff calculations
96
98
100
102
104
106
108
110
Jan-2016 Jul-2016 Jan-2017
USD/IDR
JP Morgan EMCI
S u s t a i n i n g r e f o r m m o m e n t u m I n d o n e s i a E c o n o m i c Q u a r t e r l y
10 January 2017 THE WORLD BANK | BANK DUNIA
…and bond yields rose steeply
Longer-term yields on government bonds, fell until Q3 before stabilizing and then, following the US presidential election, rose sharply by 48 basis points to end 2016 approximately 100 basis points lower than the level at the end of 2015. Following the US election, unlike other financial assets, the losses in Indonesian bond markets were greater than those in regional peers as investors sought safe haven investments. Foreigners sold local currency denominated bonds in the aftermath of the elections.
Indonesian equities also lost ground in Q4 despite strength in the mining and agriculture sub-indices
The Jakarta Composite Index (JCI) regained some of the losses incurred immediately after the US election and fell slightly by 1.3 percent over Q4. However, most sectors recorded gain over this period, except the property, consumer goods, and manufacturing sectors, which recorded losses of 8.4 percent, 5.5 percent, and 2.6 percent, respectively. The JCI increased by 1 percent over 2016. With commodity prices likely having troughed in Q2 or early Q3, mining sector equities increased by 74.3 percent over 2016. The mining sector has now fully recovered the losses seen throughout 2015, and on November 7 mining equities reached levels last seen in January 2015.
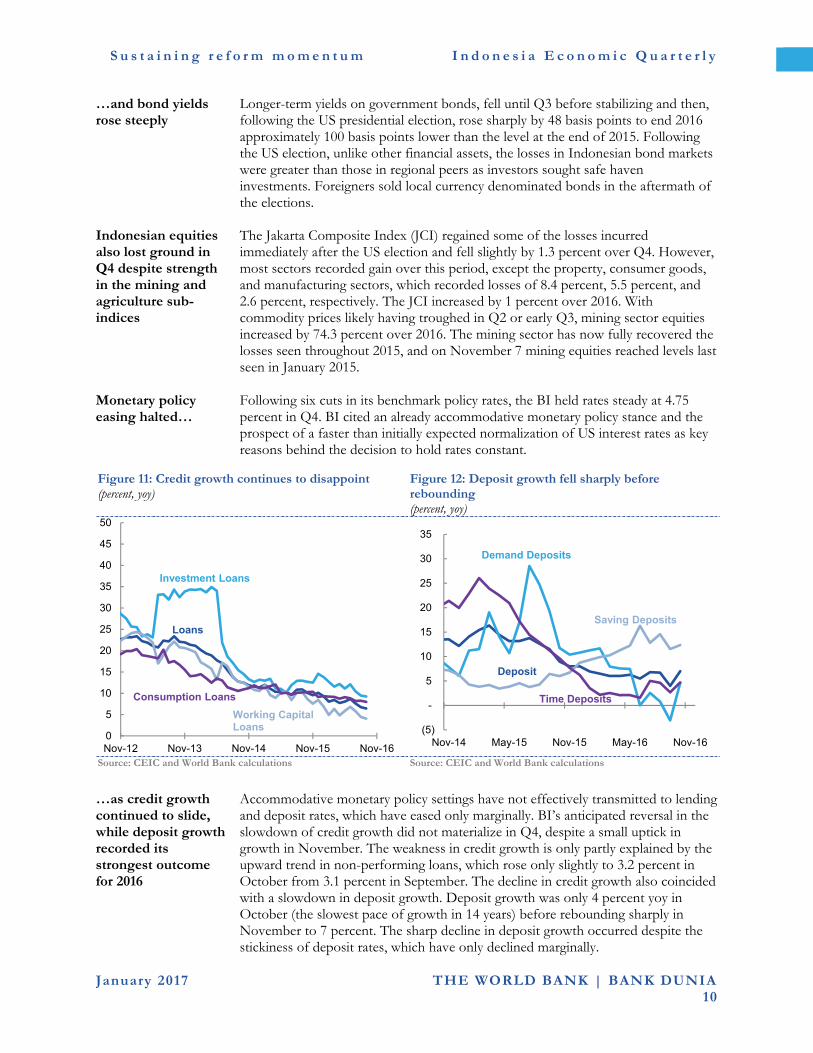
Monetary policy easing halted…
Following six cuts in its benchmark policy rates, the BI held rates steady at 4.75 percent in Q4. BI cited an already accommodative monetary policy stance and the prospect of a faster than initially expected normalization of US interest rates as key reasons behind the decision to hold rates constant.
Figure 11: Credit growth continues to disappoint (percent, yoy)
Figure 12: Deposit growth fell sharply before rebounding (percent, yoy)
Source: CEIC and World Bank calculations Source: CEIC and World Bank calculations
…as credit growth continued to slide, while deposit growth recorded its strongest outcome for 2016
Accommodative monetary policy settings have not effectively transmitted to lending and deposit rates, which have eased only marginally. BI’s anticipated reversal in the slowdown of credit growth did not materialize in Q4, despite a small uptick in growth in November. The weakness in credit growth is only partly explained by the upward trend in non-performing loans, which rose only slightly to 3.2 percent in October from 3.1 percent in September. The decline in credit growth also coincided with a slowdown in deposit growth. Deposit growth was only 4 percent yoy in October (the slowest pace of growth in 14 years) before rebounding sharply in November to 7 percent. The sharp decline in deposit growth occurred despite the stickiness of deposit rates, which have only declined marginally.
0
5
10
15
20
25
30
35
40
45
50
Nov-12 Nov-13 Nov-14 Nov-15 Nov-16
Loans
Investment Loans
Working Capital Loans
Consumption Loans
(5)
-
5
10
15
20
25
30
35
Nov-14 May-15 Nov-15 May-16 Nov-16
Deposit
Demand Deposits
Saving Deposits
Time Deposits

S u s t a i n i n g r e f o r m m o m e n t u m I n d o n e s i a E c o n o m i c Q u a r t e r l y
11 January 2017 THE WORLD BANK | BANK DUNIA
6. The 2017 Budget is more realistic, but reform momentum is needed to mitigate risks to the revenue outlook
The credibility of fiscal policy has improved, while risks to the 2017 outlook remain
Preliminary realization data from the Ministry of Finance (MoF) show a fiscal deficit of 2.46 percent of GDP for 2016, lower than the MoF revised outlook and World Bank projections of 2.7 and 2.8 percent of GDP, respectively. Revenue contributions from the Tax Amnesty (second phase ended December 31) and expenditure cuts announced in July 2016 contributed to the lower deficit. The 2017 Budget, which was approved on October 28, features more achievable revenue targets (compared with the previous two years) (Figure 13) and improvements in the composition of spending, including sustained higher allocations for infrastructure, health and social assistance, and improved targeting for energy subsidies and social programs (see Part B for further discussion of the 2017 Budget). However, risks to the 2017 outlook remain. Revenue collection from the Tax Amnesty program helped ease pressures in 2016, but non-Tax Amnesty revenues in 2016 weakened. Revenue collection from VAT, excises, and natural resources non-tax revenues were lower than in 2015. The medium-term base expansion impacts of the one-off tax amnesty will depend on the capture and use of new data on participants in the program.
Figure 13: The Government’s approved 2017 Budget includes more realistic revenue targets (IDR trillion)
Figure 14: Non-Tax Amnesty revenue collection slowed (contributions to annual revenue growth, percentage points)
Note: WB stands for World Bank; O&G stands for oil and gas; N-O&G stands for non-oil and gas; LGST stands for luxury goods sales tax; “Other” includes: property taxes, other tax revenues, non-oil and gas non-tax revenues, other non-tax revenues (profits of public enterprises, revenues from Public Service Agency (BLU), and other non-tax revenues (PNBP). Source: Ministry of Finance; World Bank staff calculations
Excluding revenues from the Tax Amnesty, revenue realization was muted in 2016
Excluding revenues from the Tax Amnesty program, total revenue realization in 2016 decreased by 3.7 percent relative to 2015 (Figure 14); this fall was broad-based. Tax revenues declined by 4.8 percent and non-tax revenues increased by 3.4 percent respectively over the same period. Recent revenue reforms, for instance in administration (for example, e-VAT invoice and e-filing of income tax returns), may only occur with a lag. This reinforces the importance of accelerating reform implementation and advancing on new reforms (such as VAT, income tax and
1,508
1,822 1,7861,583 1,552
1,7501,599
1,699
0
500
1,000
1,500
2,000
2015 2016 2016 2016 2016 2017 2016 2017
Actual Budget R-Budget
Outlook Actual(Pre-
liminary)
Budget WB WB
O&G related revenues Income taxes N-O&GVAT/LGST ExcisesInternational trade taxes Non-tax revenues N-O&GOther Total revenues
-10
-5
0
5
10
15
Jan-Dec2014
Jan-Dec2015
Jan-Dec2016
Jan-Dec2016 excl
TaxAmnesty*
O&G related revenues Income taxes N-O&GVAT/LGST ExcisesInternational trade taxes OtherTotal revenues
S u s t a i n i n g r e f o r m m o m e n t u m I n d o n e s i a E c o n o m i c Q u a r t e r l y
12 January 2017 THE WORLD BANK | BANK DUNIA
general tax administration laws). The establishment of the Tim Reformasi Perpajakan (Tax Reform Team) could help facilitate further progress.10
Tax Amnesty revenues slowed and the repatriation of assets was low
While the first of three phases of the Tax Amnesty, which ended on September 30, collected IDR 93.4 trillion in revenue, equivalent to more than half the overall IDR 165 trillion target, collections slowed in the second phase which ended on December 31. Phase two collected IDR 9.6 trillion, bringing total collection to IDR 103 trillion or 62.4 percent of the overall IDR 165 trillion target. Repatriated of offshore foreign assets remained low at IDR 141 trillion—14.1 percent of the target.
Budget execution moderated in the second half of 2016
Budget execution, while strong over H1, slowed in the second half of 2016 following the announcement of expenditure cuts. Total budget execution for the year was IDR 1,860 trillion, 3 percent higher than in 2015. This represented 89 percent of the revised Budget and 98 percent of the target following further budget cuts in September 2016.
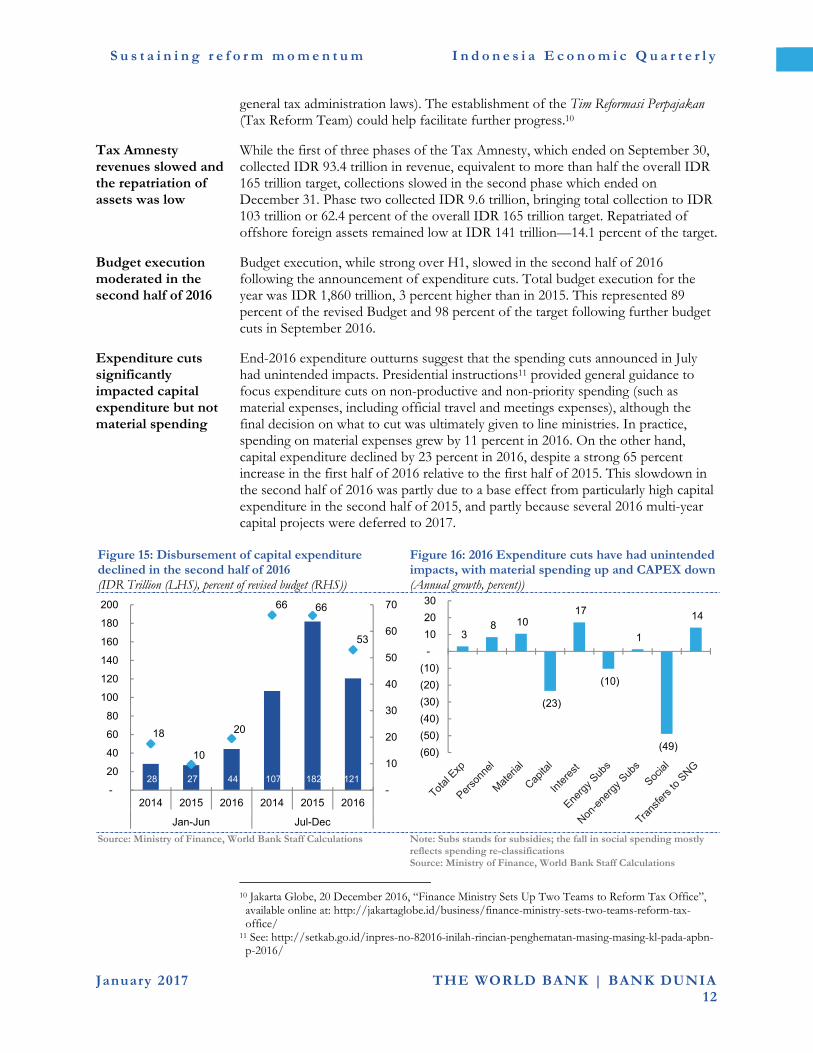
Expenditure cuts significantly impacted capital expenditure but not material spending
End-2016 expenditure outturns suggest that the spending cuts announced in July had unintended impacts. Presidential instructions11 provided general guidance to focus expenditure cuts on non-productive and non-priority spending (such as material expenses, including official travel and meetings expenses), although the final decision on what to cut was ultimately given to line ministries. In practice, spending on material expenses grew by 11 percent in 2016. On the other hand, capital expenditure declined by 23 percent in 2016, despite a strong 65 percent increase in the first half of 2016 relative to the first half of 2015. This slowdown in the second half of 2016 was partly due to a base effect from particularly high capital expenditure in the second half of 2015, and partly because several 2016 multi-year capital projects were deferred to 2017.
Figure 15: Disbursement of capital expenditure declined in the second half of 2016 (IDR Trillion (LHS), percent of revised budget (RHS))
Figure 16: 2016 Expenditure cuts have had unintended impacts, with material spending up and CAPEX down (Annual growth, percent))
Source: Ministry of Finance, World Bank Staff Calculations Note: Subs stands for subsidies; the fall in social spending mostly reflects spending re-classifications Source: Ministry of Finance, World Bank Staff Calculations
10 Jakarta Globe, 20 December 2016, “Finance Ministry Sets Up Two Teams to Reform Tax Office”, available online at: http://jakartaglobe.id/business/finance-ministry-sets-two-teams-reform-tax-office/
11 See: http://setkab.go.id/inpres-no-82016-inilah-rincian-penghematan-masing-masing-kl-pada-apbn-p-2016/
28 27 44 107 182 121
18
10
20
66 66
53
-
10
20
30
40
50
60
70
-
20
40
60
80
100
120
140
160
180
200
2014 2015 2016 2014 2015 2016
Jan-Jun Jul-Dec
3 8 10
(23)
17
(10)
1
(49)
14
(60)
(50)
(40)
(30)
(20)
(10)
-
10
20
30
S u s t a i n i n g r e f o r m m o m e n t u m I n d o n e s i a E c o n o m i c Q u a r t e r l y
13 January 2017 THE WORLD BANK | BANK DUNIA
Looking to 2017, risks to the revenue outlook remain despite a more realistic revenue target in the Budget
The Government’s 2017 Budget is more realistic (compared to the 2016 Budget) and the fiscal deficit is forecast to be 2.4 percent of GDP (Table 5). The revenue target is IDR 1,750 trillion, 2.0 percent lower than the revised 2016 Budget target, but 12.8 percent higher than preliminary realized revenue outturns for 2016. The projected nominal increase in revenues is mainly driven by projected increases in VAT, non-oil and gas income tax, and oil and gas revenues. The 2017 Budget assumes that tax proceeds from the third phase of the tax amnesty program will be minimal (IDR 5 trillion). The Government has increased the excise tax on cigarettes by 10.5 percent in 2017 and expects that this will increase excise tax revenue.12
The World Bank projects a fiscal deficit of 2.6 percent of GDP in 2017
In line with the macroeconomic outlook for 2017 and ongoing tax policy and administration reforms, the World Bank projects total revenues to reach IDR 1,680 trillion in 2017, 8.2 percent higher than preliminary realized revenue outturns for 2016. This is slightly lower than the Government estimate, and depends on maintaining revenue reform momentum. In 2017, the World Bank projects a fiscal deficit of 2.6 percent of GDP. This is a higher than the Government’s 2016 preliminary realization of 2.5 percent of GDP and the 2017 Budget target of 2.4 percent of GDP, reflecting the lower revenue assumption and the need for higher infrastructure spending to support growth.
Indonesia’s gross financing needs were met for 2016, and are stable for 2017
Gross securities issuance needs for 2016 were increased in the third quarter in line with upward revisions to the fiscal deficit from 2.4 to 2.7 percent of GDP. This target was met in December. As of December 6, the Government issued IDR 641 trillion in bonds, representing 107 percent of its revised 2016 Budget target of IDR 599 trillion, and 5.2 percent of GDP. In 2017, gross financing needs are projected at around 4.8 percent of GDP. The Government pre-financed some of this need by issuing global bonds in December 2016.
7. Risks to the macro-fiscal outlook stem mainly from external factors
Global policy uncertainty presents increased downside risks
Risks to Indonesia’s outlook stem from heightened global policy uncertainty, financial market disruptions and sluggish growth in major economies – particularly the ongoing deceleration of the Chinese economy (World Bank estimates13 suggest that a one percentage point decline in China’s GDP growth rate could reduce GDP growth in Indonesia by 0.4 percentage points after two years). An accelerated pace of interest rate normalization in the US also poses a risk to capital flows and the stability of the Rupiah. However, signs of a recovery in key commodity prices presents an upside risk if not outweighed by expected anemic global growth that could reduce demand for exports.
Domestic downside risks related to fiscal policy remain
BI’s monetary policy easing cycle may have come to an end following 150 basis points worth of cuts in 2016. Given US interest rate normalization and downward pressure on the Rupiah, it is likely that monetary policy space is more constrained than at the time of the October IEQ. However monetary policy continues to remain supportive of the overall growth momentum. While the 2016 budget revisions enhanced fiscal policy credibility, risks remain from weak revenue collection. The focus in 2017 will remain on the quality of spending and downside risks to revenue collection. There may also be some payback in the form of an improved investment climate from the Government’s commitment to promoting private investment (due
12 The 10.45 percent refers to the weighted average excise tariff per stick of cigarette and is the Government’s figure. The unweighted average increase is 9.0 percent, calculated by the World Bank.
13 World Bank, 2017, “Global Economic Prospects, January 2017”, World Bank Group.

S u s t a i n i n g r e f o r m m o m e n t u m I n d o n e s i a E c o n o m i c Q u a r t e r l y
14 January 2017 THE WORLD BANK | BANK DUNIA
to Indonesia’s improved ranking in the World Bank’s most recent Doing Business Survey).
Table 5: The World Bank projects lower revenue and expenditure than in the 2017 Budget (IDR trillion, unless otherwise indicated)
2015 2016 2016 2016 2017 2017
Actual audited
Budget Revised Budget
Actual (Prelim)
Budget World Bank
A. Revenues 1,508 1,822 1,786 1,552 1,750 1,680 (% of GDP) 13.1 14.6 14.3 12.5 12.8 12.3 1. Tax revenues 1,240 1,547 1,539 1284 1,499 1,439 (% of GDP) 10.7 12.4 12.3 10.3 10.9 10.5 Income taxes 602 757 856 667 788 752 Oil & Gas 50 41 36 36 36 36 Non-Oil & Gas 553 716 819 631 752 716 VAT/LGST 424 572 474 411 494 459 Property taxes 29 19 18 19 17 21 Excises 145 146 148 143 157 158 International trade taxes 35 40 36 35 34 40 Import duties 31 37 33 32 34 37 Export duties 4 3 3 3 0 3 Other taxes 6 12 7 8 9 9 2. Non-tax revenues 256 274 245 262 250 238 (% of GDP) 2.2 2.2 2.0 2.1 1.8 1.7 Natural resources revenues 101 125 91 66 87 71 Oil & Gas 78 79 69 45 64 48 Non-Oil & Gas 23 46 22 21 23 27 Other non-tax revenues 155 149 155 197 163 163 3. Grants 12 2 2 6 1 3 B. Expenditures 1,806 2,096 2,083 1,860 2,080 2,030 (% of GDP) 15.6 16.8 16.7 14.9 15.2 14.9 1. Central government 1,183 1,326 1,307 1149 1,316 1,276 (% of GDP) 10.3 10.6 10.5 9.2 9.6 9.4 Personnel 281 348 343 305 345 328 Material 233 325 281 258 270 256 Capital 215 202 227 165 221 210 Interest payments 156 185 191 183 221 221 Subsidies 186 183 178 175 160 159 Energy 119 102 94 107 77 81 Fuel 61 64 44 44 32 32 Electricity 58 38 51 63 45 48 Non-energy 67 81 83 68 83 79 Grants 4 4 9 7 2 8 Social 97 55 55 50 56 54 Other 10 25 23 7 41 39 2. Transfers to regions 623 770 776 711 760 754 (% of GDP) 5.4 6.2 6.2 5.7 5.5 5.5 Overall Balance -298 -274 -297 -308 -330 -350 (% of GDP) -2.6 -2.2 -2.4 -2.5 -2.4 -2.6
Assumptions
Real GDP growth rate (%) 4.8 5.3 5.2 5.0 5.1 5.3 CPI (%) 6.4 4.7 4.0 3.3 4.0 4.6 Exchange rate (IDR/USD) 13,458 13,900 13,500 13,309 13,300 13,300 Crude-oil price (USD/barrel) 51 50 40 39 45 51
Source: MoF, World Bank projections

S u s t a i n i n g r e f o r m m o m e n t u m I n d o n e s i a E c o n o m i c Q u a r t e r l y
January 2017 THE WORLD BANK | BANK DUNIA 15
B. Some recent developments in Indonesia’s economy
Improving the quality of public spending in Indonesia14
Public spending can contribute to a country’s development goals by generating physical and human capital, and fostering productivity
Public spending (and broader government policy) can contribute to a country’s development goals—like higher growth and lower poverty—through three main channels. First, governments use public resources to invest in infrastructure and expand the stock of physical capital. Second, governments spend on health, education, and social assistance to improve the productivity of human capital. Third, governments provide a conducive environment for the private sector to grow, innovate and improve their productivity, for example, by investing in research and development (R&D) or providing incentives for firms to invest in productivity enhancements.
Achieving Indonesia’s ambitious development goals will require significant improvements in the quality of public expenditure
However, in Indonesia, the impact of government spending on development has been less than what it could have been. Partly as a result of this, progress in achieving growth and poverty targets has been slower than expected, and the quality of many public services has not improved. At the same time, low levels of revenue collection mean that significantly increasing the level of public expenditure is not possible as the fiscal deficit is legally capped at 3 percent of GDP. Thus, improving the quality of public spending is the main budget mechanism through which the Government can seek to achieve its development goals in the short to medium-term. Improving the “quality of spending” refers to two separate actions. First, it entails improving allocative efficiency—reallocating spending towards priority sectors. For Indonesia, underfunded priority sectors (those where additional public
14 This article draws on a wide body of recent World Bank research examining public expenditure in Indonesia. This includes: Public Expenditure Reviews for Social Assistance (2016), Roads (2012), Housing (2015), Water and Sanitation (2015), Agriculture (2010, and an update in 2014), Education (2013), and Sub-national Spending (2012); as well as World Bank, 2016, “Health Financing System Assessment: Spend More, Spend Right, and Spend Better”; and World Bank, 2016, “The Distributional impact of Fiscal Policy in Indonesia”, forthcoming.

S u s t a i n i n g r e f o r m m o m e n t u m I n d o n e s i a E c o n o m i c Q u a r t e r l y
January 2017 THE WORLD BANK | BANK DUNIA 16
spending can have the greatest impact on poverty and growth) include infrastructure, health, and social assistance. Second, it entails improving the efficiency and effectiveness of spending—maximizing the impact of spending on desired outcomes for targeted beneficiaries. For Indonesia, this entails reallocating spending within sectors to programs that have the highest impacts sectoral goals (such as farmer welfare or learning outcomes), and effective sectoral policies that support the impact of increased and reallocated spending. The 2017 Budget takes additional steps towards improving the quality of public spending, following improvements in the 2015 and 2016 Budgets, but further reform is required.
a. Fiscal policy has contributed less than it could have done to growth and poverty reduction in Indonesia
In the past, fiscal policy (including government spending) has not had a large impact on poverty and inequality
Indonesian taxes and government spending reduced poverty by 1.4 percentage points and inequality (as measured by the Gini coefficient) by 2.6 points in 2012.15 These are relatively small reductions by international standards,16 partly due to: (1) low personal income tax collection, with poor compliance amongst high income earners; (2) low social assistance spending; (3) low health spending, with relatively little spending on primary care, which mostly benefits poorer households; (4) a relatively low impact of education spending on inequality compared to other countries;17 and (5) high spending on energy subsidies, which predominantly benefit richer households. Items 1-4 are unlikely to have changed significantly since 2012. However, recent fuel subsidy reform, most significantly in 2015, is likely to have improved the impact of fiscal policy on poverty and inequality. In 2013 and 2014, fuel price increases were accompanied by a temporary cash transfer to the poorest 25 percent of households. These transfers were significantly higher than the increases in the cost of living associated with higher fuel prices. Given the temporary nature of the transfers, their effects would also have been temporary. However, the 2015 elimination of gasoline subsidies and the near-elimination of diesel subsidies is likely to have a longer-term positive effect, as the permanent savings to the Government were partially directed to higher health and social assistance spending.
15 The analysis is based on the Commitment to Equity framework (commitmentoequity.org), and applies standard fiscal incidence analysis to the majority of GoI taxes and spending. 16 For example, fiscal policy reduces the Gini coefficient by more than 6 points in South Africa, Costa Rica, Uruguay, Mexico and Bolivia.
17 World Bank, 2016, “The Distributional Impact of Fiscal Policy in Indonesia”; and Ministry of Finance and World Bank, 2015, “Taxes and Public Spending in Indonesia: Why pays and who benefits”
S u s t a i n i n g r e f o r m m o m e n t u m I n d o n e s i a E c o n o m i c Q u a r t e r l y
January 2017 THE WORLD BANK | BANK DUNIA 17
Progress in achieving growth and poverty targets has been slower than expected…
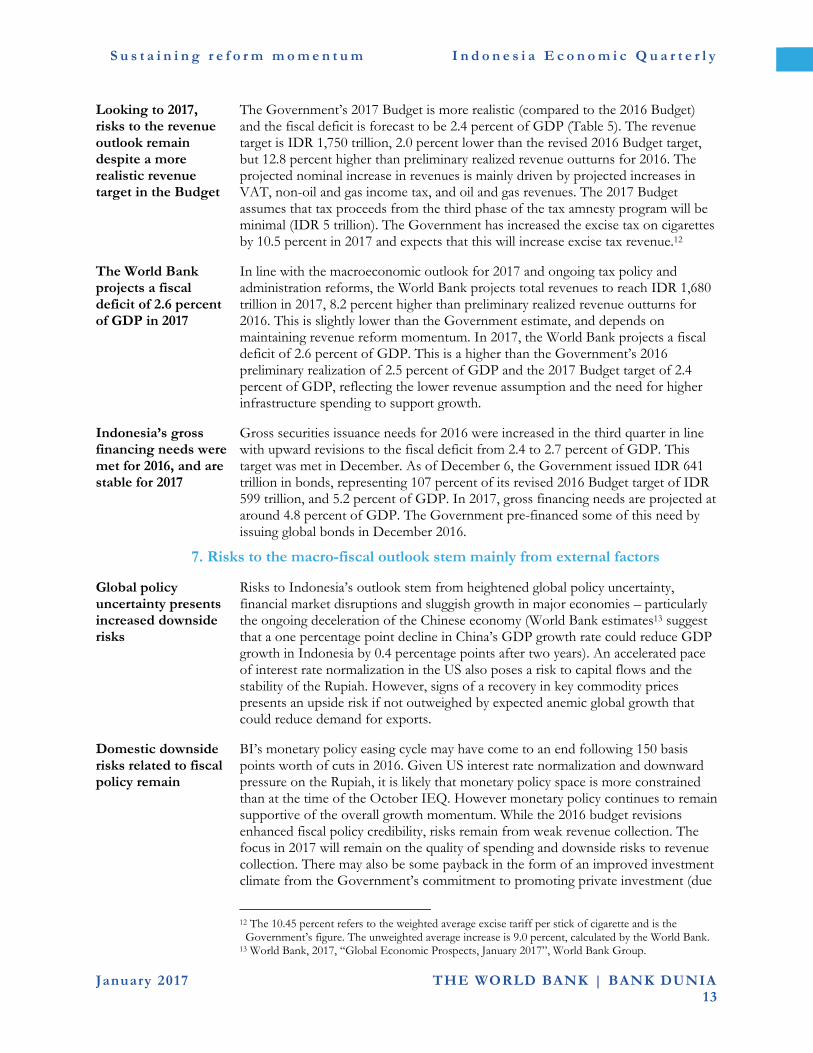
Targets for growth and poverty in the Government’s medium-term development plan for 2015-2019 (Rencana Pembangunan Jangka Menengah Nasional, RPJMN) have been revised down (Figure 17). This was partly due to external factors like slower than expected growth in major trading partners and the fall in commodity prices, but also because fiscal reforms take time to show results. 2017 is now the third year of the plan, lending more urgency to the need for further, more ambitious reforms.
Figure 17: RPJMN poverty and growth targets have not been met (percent)
Source: BAPPENAS (RPJMN 2015-2019), MoF, and World Bank staff calculations
…and the quality of many public services can be improved
While increased public spending has helped increase the coverage of some public services, the quality of such services and outcomes for the beneficiaries have been harder to improve. For example, total education spending tripled over 2001-201418 in real terms. This increased spending was associated with improved access to education and increasing secondary enrollment (the primary enrollment rate, already over 90 percent in 2001, has not increased further). However, education quality remains a challenge; Indonesian students continue to lag behind regional peers in international learning assessments.19 Similarly, health spending quadrupled over the same time period, ensuring that more people had access to a public health facility. Yet key health outcomes, like maternal mortality and stunting, have barely changed. Further, only two thirds of children under two have been immunized.20
There are still inter-regional disparities in service delivery and outcomes
Not only has public spending been limited in its impact on development goals, it has yet to tackle regional inequalities. A 2012 Village Infrastructure Census, commissioned by the Vice President’s Office for the Acceleration of Poverty Reduction (Tim Nasional Percepatan Penanggulangan Kemiskinan, TNP2K) and undertaken by the Central Statistics Agency (Badan Pusat Statistik, BPS), found large differences in villages’ ability to provide basic health, education, and transportation services.21 More recent Susenas data paints a similar picture. For example: (i) access to clean water is 100 percent in some regions, but only 4 percent in Mamberamo in Papua; (ii) child immunization rates are 100 percent in some regions, but only 18
18 2014 is the latest year for which disaggregated subnational spending data is available. 19 While Indonesia’s test scores have improved recently, Indonesia still ranked 63rd, 64th and 65th (out
of 71 countries) in the latest (2015) PISA science, math and reading tests, respectively. 20 There have also been challenges in terms of readiness to provide key health services. According to the latest public health facility census (2011), no public primary health facility met all 38 indicators for general service readiness. Inequalities in the distribution of health workers between geographical regions and provinces, and between urban and rural areas, are stark. For example, the physician-to-population ratio in Kalimantan and Maluku-NTT-Papua are one-half and one-third of that in the Java-Bali region, respectively. See: World Bank, 2016, “Health Financing System Assessment: Spend More, Spend Right, and Spend Better”.
21 World Bank, 2016, “Policies in Focus”, Indonesia Economic Quarterly, December 2012, pp.37-43.
0
3
6
9
12
2014 2015 2016 2017 2018 2019
Poverty rate (original target)Poverty rate (actual and revised target)GDP growth (original target)GDP growth (actual and revised target)
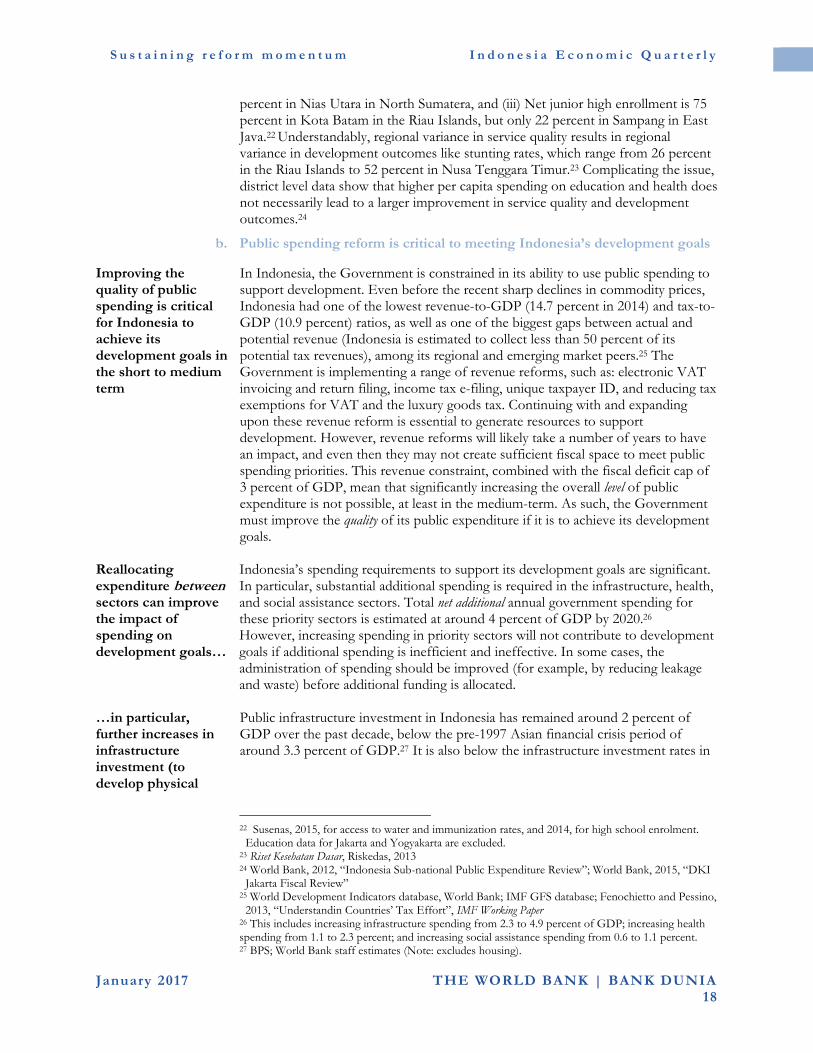
S u s t a i n i n g r e f o r m m o m e n t u m I n d o n e s i a E c o n o m i c Q u a r t e r l y
January 2017 THE WORLD BANK | BANK DUNIA 18
percent in Nias Utara in North Sumatera, and (iii) Net junior high enrollment is 75 percent in Kota Batam in the Riau Islands, but only 22 percent in Sampang in East Java.22 Understandably, regional variance in service quality results in regional variance in development outcomes like stunting rates, which range from 26 percent in the Riau Islands to 52 percent in Nusa Tenggara Timur.23 Complicating the issue, district level data show that higher per capita spending on education and health does not necessarily lead to a larger improvement in service quality and development outcomes.24
b. Public spending reform is critical to meeting Indonesia’s development goals
Improving the quality of public spending is critical for Indonesia to achieve its development goals in the short to medium term
In Indonesia, the Government is constrained in its ability to use public spending to support development. Even before the recent sharp declines in commodity prices, Indonesia had one of the lowest revenue-to-GDP (14.7 percent in 2014) and tax-to-GDP (10.9 percent) ratios, as well as one of the biggest gaps between actual and potential revenue (Indonesia is estimated to collect less than 50 percent of its potential tax revenues), among its regional and emerging market peers.25 The Government is implementing a range of revenue reforms, such as: electronic VAT invoicing and return filing, income tax e-filing, unique taxpayer ID, and reducing tax exemptions for VAT and the luxury goods tax. Continuing with and expanding upon these revenue reform is essential to generate resources to support development. However, revenue reforms will likely take a number of years to have an impact, and even then they may not create sufficient fiscal space to meet public spending priorities. This revenue constraint, combined with the fiscal deficit cap of 3 percent of GDP, mean that significantly increasing the overall level of public expenditure is not possible, at least in the medium-term. As such, the Government must improve the quality of its public expenditure if it is to achieve its development goals.
Reallocating expenditure between sectors can improve the impact of spending on development goals…
Indonesia’s spending requirements to support its development goals are significant. In particular, substantial additional spending is required in the infrastructure, health, and social assistance sectors. Total net additional annual government spending for these priority sectors is estimated at around 4 percent of GDP by 2020.26 However, increasing spending in priority sectors will not contribute to development goals if additional spending is inefficient and ineffective. In some cases, the administration of spending should be improved (for example, by reducing leakage and waste) before additional funding is allocated.
…in particular, further increases in infrastructure investment (to develop physical
Public infrastructure investment in Indonesia has remained around 2 percent of GDP over the past decade, below the pre-1997 Asian financial crisis period of around 3.3 percent of GDP.27 It is also below the infrastructure investment rates in
22 Susenas, 2015, for access to water and immunization rates, and 2014, for high school enrolment. Education data for Jakarta and Yogyakarta are excluded.
23 Riset Kesehatan Dasar, Riskedas, 2013 24 World Bank, 2012, “Indonesia Sub-national Public Expenditure Review”; World Bank, 2015, “DKI Jakarta Fiscal Review”
25 World Development Indicators database, World Bank; IMF GFS database; Fenochietto and Pessino, 2013, “Understandin Countries’ Tax Effort”, IMF Working Paper
26 This includes increasing infrastructure spending from 2.3 to 4.9 percent of GDP; increasing health spending from 1.1 to 2.3 percent; and increasing social assistance spending from 0.6 to 1.1 percent. 27 BPS; World Bank staff estimates (Note: excludes housing).

S u s t a i n i n g r e f o r m m o m e n t u m I n d o n e s i a E c o n o m i c Q u a r t e r l y
January 2017 THE WORLD BANK | BANK DUNIA 19
capital) can help accelerate growth
fast-growing neighboring countries like China, India, and Vietnam.28 As a result, Indonesia’s infrastructure capital stock is estimated to have declined from 62 percent of GDP in 1999 to 38 percent in 2012, and the infrastructure deficit is significant in every infrastructure sub-sector. For example, road length grew by only 35 percent in the last decade, while vehicle growth was 300 percent. This is despite substantial evidence linking infrastructure investment to long-term growth.29 Priority spending areas within the infrastructure sector include: electricity generation, urban and marine transport, water and sanitation, and affordable housing.
Increases in health and social assistance spending (to develop human capital) are required to accelerate poverty reduction
Public spending on social assistance and health in Indonesia (0.6 and 1.4 per cent of GDP in the revised 2016 Budget, respectively) is especially low compared to other middle income countries.30 Yet effective spending in these sectors is among the best ways to benefit the poor and reduce inequality.31 Within health, additional spending should be directed to ensuring 100 percent of the poor are covered by the health insurance premium subsidy (Penerima Bantuan Iuran, PBI), and primary health care and priority preventative interventions in maternal health, nutrition, and vaccinations. Within social assistance, additional spending should be directed to the programs that are most effective at reducing poverty and inequality. Among the major social assistance programs, a targeted conditional cash transfer (Program Keluarga Harapan, PKH) is the most effective at reducing inequality,32 while Rastra (a price subsidy for rice) is the least effective. Yet Rastra’s budget (more than 0.2 percent of GDP) is much larger than that of PKH.33 The effectiveness of Rastra is constrained by the dilution of benefits at the village level and the lack of clarity on who is responsible for delivery costs between distributors and villages.34 In contrast, 77 percent of PKH’s beneficiaries are among the poorest 40 percent of households in Indonesia. Improving coordination and the integration of social assistance programs can also help improve the effectiveness of government spending.
28 Total annual infrastructure investment (including public and private investment) in these countries is over 7 percent of GPD. Source: ADB, JBIC, World Bank, 2005, “Connecting East Asia: A new framework for infrastructure”
29 IMF, 2014, “Is it Time for an Infrastructure Push? The Macroeconomic Effects of Public Investment”, World Economic Outlook, Chapter 3
30 For example, in 2014, average government spending on health was 2.4 percent of GDP in East Asia and the Pacific and 1.9 percent in lower middle income countries (World Development Indicators, 2016).
31 World Bank, 2016, “The Distributional impact of Fiscal Policy in Indonesia”, forthcoming. 32 Effectiveness index = change in market income Gini to final income Gini/budget as a percent of GDP. The index is based on Susenas, 2012 data.
33 World Bank, 2016, “The Distributional impact of Fiscal Policy in Indonesia”, forthcoming. 34 World Bank, 2016, “Social Assistance Public Expenditure Review”, forthcoming
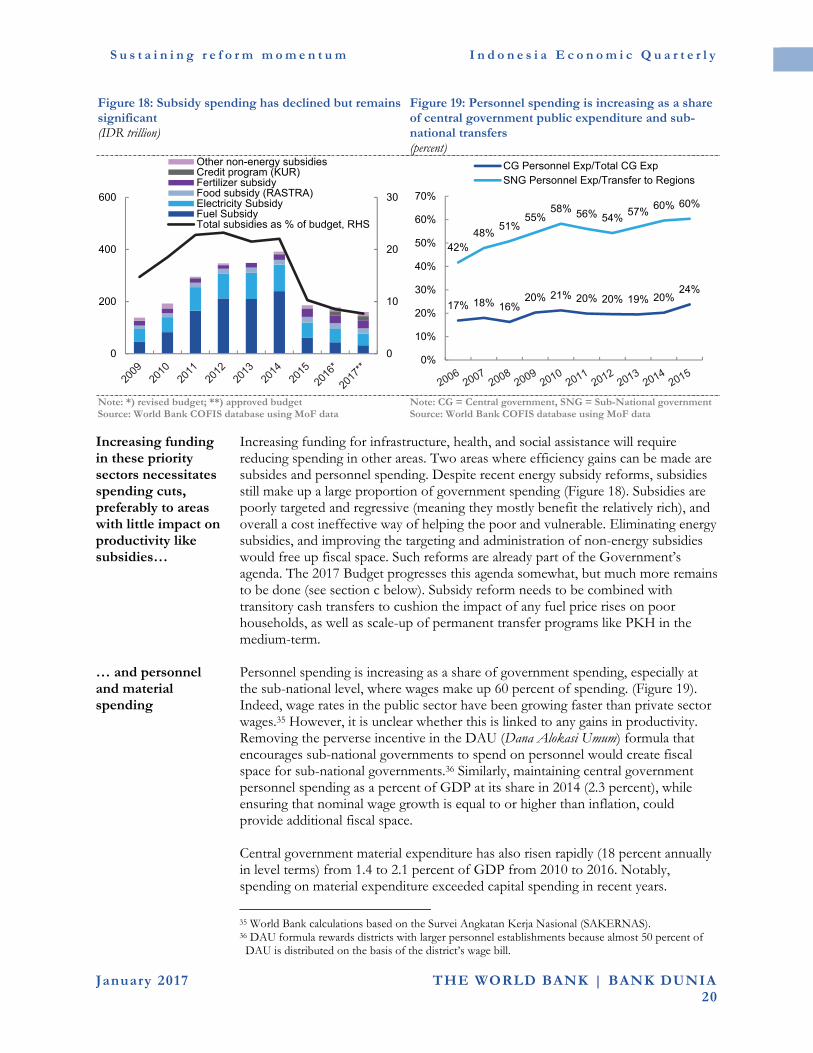
S u s t a i n i n g r e f o r m m o m e n t u m I n d o n e s i a E c o n o m i c Q u a r t e r l y
January 2017 THE WORLD BANK | BANK DUNIA 20
Figure 18: Subsidy spending has declined but remains significant (IDR trillion)
Figure 19: Personnel spending is increasing as a share of central government public expenditure and sub-national transfers (percent)
Note: *) revised budget; **) approved budget Source: World Bank COFIS database using MoF data
Note: CG = Central government, SNG = Sub-National government Source: World Bank COFIS database using MoF data
Increasing funding in these priority sectors necessitates spending cuts, preferably to areas with little impact on productivity like subsidies…
Increasing funding for infrastructure, health, and social assistance will require reducing spending in other areas. Two areas where efficiency gains can be made are subsides and personnel spending. Despite recent energy subsidy reforms, subsidies still make up a large proportion of government spending (Figure 18). Subsidies are poorly targeted and regressive (meaning they mostly benefit the relatively rich), and overall a cost ineffective way of helping the poor and vulnerable. Eliminating energy subsidies, and improving the targeting and administration of non-energy subsidies would free up fiscal space. Such reforms are already part of the Government’s agenda. The 2017 Budget progresses this agenda somewhat, but much more remains to be done (see section c below). Subsidy reform needs to be combined with transitory cash transfers to cushion the impact of any fuel price rises on poor households, as well as scale-up of permanent transfer programs like PKH in the medium-term.
… and personnel and material spending
Personnel spending is increasing as a share of government spending, especially at the sub-national level, where wages make up 60 percent of spending. (Figure 19). Indeed, wage rates in the public sector have been growing faster than private sector wages.35 However, it is unclear whether this is linked to any gains in productivity. Removing the perverse incentive in the DAU (Dana Alokasi Umum) formula that encourages sub-national governments to spend on personnel would create fiscal space for sub-national governments.36 Similarly, maintaining central government personnel spending as a percent of GDP at its share in 2014 (2.3 percent), while ensuring that nominal wage growth is equal to or higher than inflation, could provide additional fiscal space. Central government material expenditure has also risen rapidly (18 percent annually in level terms) from 1.4 to 2.1 percent of GDP from 2010 to 2016. Notably, spending on material expenditure exceeded capital spending in recent years.
35 World Bank calculations based on the Survei Angkatan Kerja Nasional (SAKERNAS). 36 DAU formula rewards districts with larger personnel establishments because almost 50 percent of DAU is distributed on the basis of the district’s wage bill.
0
10
20
30
0
200
400
600
Other non-energy subsidiesCredit program (KUR)Fertilizer subsidyFood subsidy (RASTRA)Electricity SubsidyFuel SubsidyTotal subsidies as % of budget, RHS
17% 18% 16%20% 21% 20% 20% 19% 20%
24%
42%48%
51%55%
58% 56% 54%57%
60% 60%
0%
10%
20%
30%
40%
50%
60%
70%
CG Personnel Exp/Total CG ExpSNG Personnel Exp/Transfer to Regions

S u s t a i n i n g r e f o r m m o m e n t u m I n d o n e s i a E c o n o m i c Q u a r t e r l y
January 2017 THE WORLD BANK | BANK DUNIA 21
Improving the efficiency of material spending by reducing non-operational goods and travel spending (24 percent and 13 percent of material expenditure in 2015, respectively) would create additional fiscal space. At the same time, spending on maintenance (15 percent of total material spending in 2015), which is key for maintaining public infrastructure assets, needs to be increased.
Reallocating expenditure within sectors can also improve the productivity and effectiveness of such spending, particularly in agriculture…
Agriculture and education are two areas where spending levels are adequate, but the effectiveness of spending is poor. Reallocating spending within these sector can have a large impact on development outcomes, particularly for the poor. In agriculture, large increases in government spending have not been associated with similar increases in agricultural production or even rice production, such that the ratio of spending to output in agriculture is increasing (Figure 20). This is partly because a large proportion of the increase in central government spending has gone to subsidize inputs (fertilizer subsidies, other agricultural subsidies, and MoA social aid37).38 This proportion reached 47 percent in 2015, while only 3 percent was spent on R&D and extension services. A large body of research shows that government subsidies of private inputs have limited impacts on agricultural production and farmer incomes. Although usage of some inputs (for example fertilizer) may increase production, the impact of subsidizing such inputs is often negative because it is done at the expense of providing public goods (such as extension services, R&D, and irrigation) which have a larger positive impact on production. For example, one international study found that a reallocation of 10 percent of agricultural spending from subsidies to public goods was associated with an increase in per capita agricultural income of 2.3 percent.39 Another study found average returns for investments in agricultural R&D of 43 percent and almost 60 percent for extension services across 700 projects in both developed and developing countries.40
Figure 20: A large proportion of central Government agriculture spending subsidizes private inputs (IDR trillion (LHS); percent (RHS))
Note: AG = agriculture; MoA = Ministry of Agriculture; Spending figures refer to realized spending up until 2015 and the revised Budget for 2016. MoA reclassified the majority of its social aid spending to goods and services in 2016. Source: World Bank COFIS database using MoF data
37 Around 40 percent of MoA budget goes to Social Aid - direct transfers to farmers and farmer groups which subsidize private inputs. For example, the Agriculture Integrated Field Laboratory program (SL-PPT), initiated in 2013, and has been expanded to reach almost all regions to support the 10-million-ton rice surplus goal – farmers receive full support for seeds, fertilizer, and equipment, etc.
38 World Bank, 2010, “Indonesia Agriculture Public Expenditure Review”. 39 Across 15 Latin American countries; Lopez and Galinato, 2007 40 Alston et al, 2000
0%
1%
2%
3%
4%
5%
6%
7%
8%
0
10
20
30
40
50
60
70
80
90
100
Extension services IrrigationOther agriculture subsidies Fertilizer subsidiesR&D MoA non-social aidMoA social aid
Central AG spending/AG GDP (RHS)
S u s t a i n i n g r e f o r m m o m e n t u m I n d o n e s i a E c o n o m i c Q u a r t e r l y
January 2017 THE WORLD BANK | BANK DUNIA 22
…and education Government spending on education has risen rapidly in recent years, rising from 11 to 19 per cent of total government spending over 2001-2014.41 Over this period learning outcomes—as measured by Program for International Student Assessment (PISA) scores— have fluctuated but risen somewhat overall (Figure 21). The increase in education spending went mainly to hiring teachers, teacher certification, and converting contract teachers to civil servants. As a result, teacher salaries and allowances increased to more than 60 percent of total education spending by 2015 (Figure 22). Although this is not a particularly high share by international standards, the increased spending on teachers has not been spent effectively. To begin, the increase in teachers lowered student to teacher ratios (STRs) such that Indonesia’s now has one of the lowest average STRs in the world.42 However, domestic and international studies have found little to no effect of STRs on learning outcomes, unless classes are considerably large.43 Further, the 2005 Teacher Law allowed certified teachers to receive a certification allowance equal to their base salary. Yet a rigorous study of the program found that it had no impact on learning outcomes.44 Clearly, reforms are required to improve the efficiency and effectiveness of spending on teachers. Such reforms include: improving teacher deployment and allocation, performance evaluation, and training facilitation. These reforms could improve the efficiency of public spending by better allocating funds to priority education services with high returns, particularly early childhood development.
41 For central government spending only, the constitutional mandate that 20 percent of the budget goes to education has been met.
42 In part, the low STRs in Indonesia can be explained by the large number of small schools due to the low population density of many of its islands. However, school size is not the only explanation, as low STRs is not only a small school phenomenon. 43 See for example: World Bank – RAND, 2010, "School Based Management Survey”, World Bank - RAND, Jakarta, Indonesia; Chen, D., 2011, "School-Based Management, School-Decision Making and Education Outcomes in Indonesian Primary Schools", Policy Research Working Paper 5809, World Bank, Washington, DC. Hyunkuk, C., P. Glewwe, and M.Whitler, 2010, "Do Reductions in Class Size Raise Students Test Scores? Evidence from Population Variation in Minnesota's Elementary Schools”, Department of Applied Economics, University of Minnesota. Hoxby, C. M., 2000, "The Effects of Class Size on Student Achievement: New Evidence from Population Variation", The Quarterly Journal of Economics, 115(4): 1239-1285, Jepsen, C. and S. Rivkin, 2009, "Class Size Reduction and Student Achievement: The Potential Tradeoff between Teacher Quality and Class Size”, Journal of Human Resources, Vol.44(1): 223-250. 44 World Bank, 2015, “Indonesia: Teacher certification and beyond. An empirical evaluation of the teacher certification program and education quality improvements in Indonesia”.

S u s t a i n i n g r e f o r m m o m e n t u m I n d o n e s i a E c o n o m i c Q u a r t e r l y
January 2017 THE WORLD BANK | BANK DUNIA 23
Figure 21: Indonesia’s PISA scores have risen somewhat but remain in the lowest decile of assessed countries (score)
Figure 22: The proportion of education spending on teacher salaries and allowances is increasing (percent of education spending)
Source: PISA Note: government spending on tertiary education is labelled “University”. All other categories are components of secondary and primary education. Source: MoF, LKPP, World Bank calculations
Improving inter-governmental transfer formulas can help reduce regional inequalities in development outcomes
The formulae for the main sub-national transfers (Dana Alokasi Umum-DAU, Dana Alokasi Khusus-DAK, and Dana Bagi Hasil-DBH) emphasize equalization between places, not between people. The DAU formula calculates expenditure needs based on an assumption that each district has the same absolute need regardless of population. Subsequent adjustments for population and cost differences do not overcome the inbuilt bias in favor of regions with small populations. The DBH revenue sharing formula allocates a greater share of revenue to natural-resource producing regions over non-producing regions, but does not account for population in either type of region. For the DAK formula, the measurement of fiscal capacity is absolute, not per capita; regions that raise the largest absolute amounts of revenue are considered richer (and less in need of DAK). These policies were crafted specifically to address long-standing concerns about allocating too high a proportion of fiscal resources to populous Java. Yet the consequence is that the distribution of fiscal resources is skewed in favor of small rural districts, at the expense of Indonesia’s growing urban areas, which are responsible for much of the country’s GDP growth. Emerging secondary cities
Figure 23: Smaller districts receive much larger allocations per capita (log of total revenue per capita (y axis); Log of population (x axis))
Source: MoF and Susenas
350
400
450
500
550
200
0
200
6
200
9
201
2
201
5
200
0
200
6
200
9
201
2
201
5
200
0
200
6
200
9
201
2
201
5Math Reading Science
Indonesia Non OECD OECD
0%
20%
40%
60%
80%
100%
2009 2011 2013 2015
Other programs and unspecified expendituresUniversityBantuan Operasional Sekolah (BOS)Teacher certification and professional allowanceTeacher and staff salaries
13
14
15
16
17
18
10 12 14 16
S u s t a i n i n g r e f o r m m o m e n t u m I n d o n e s i a E c o n o m i c Q u a r t e r l y
January 2017 THE WORLD BANK | BANK DUNIA 24
need financing for urban infrastructure to maximize their productive capacity and deliver services to their growing populations (Figure 23). Most other countries normalize measures of expenditure needs, and fiscal capacity, as per capita amounts. In the DAU formula, this would then be adjusted by measures of differences in need (driven by, for example, more poor people, more children under 5 and more elderly people or a high unemployment rate) and differences in the cost of inputs (driven mainly by diseconomies of scale in small jurisdictions, remoteness, and highly dispersed populations). Changing to a new formula is a medium-term objective; it should be phased in gradually. There may also be a need to provide top up allocations to allow losing regions to make the gradual adjustments required to accommodate the new formula.
Improving horizontal and vertical inter-governmental coordination can improve the effectives of public spending…
Public spending in many sectors involves multiple line ministries and multiple levels of government (central, provincial, and district). This makes coordination difficult, which often leads to inefficient spending. For example, responsibility for the irrigation network is shared across two ministries (the Ministry of Agriculture and the Ministry of Public Works and Housing) and all three levels of government according to the size of the irrigation area. Each government level is responsible for the operation and maintenance (O&M) of the networks under their authority, while rehabilitation and investment in new irrigation infrastructure are primarily funded through the central government budget and transfers to the region (DAK). This division of responsibilities, and increases in DAK transfers and the rehabilitation budget, has incentivized local governments to underinvest in O&M and await a rehabilitation “bail-out” by the central government.45 Performance-based transfers are one mechanism to alleviate any perverse incentives created by divided responsibilities between level of government. For the irrigation example, central government financial support could be predicated on local governments preparing irrigation asset management plans, allocating sufficient resources to O&M, and achieving performance targets.
… as can streamlining the planning and budgeting process
Weak linkages between planning and budgeting processes across government agencies distort the prioritization of public spending. Streamlining these processes should begin with establishing harmonized performance criteria and a synchronized data structure for line ministries in all planning and budgeting process documents. Subsequently, data collection and monitoring processes should be integrated using a common system so that line ministries would only need to input their planning, budgeting, and financial transaction data in one application. This application could then feed into the Government’s integrated financial management information system (Sistem Perbendaharaan dan Anggaran Negara, SPAN).
c. The 2017 budget shows progress towards improving the quality of public spending
The 2017 Budget includes small reductions in overall subsidy spending through better targeting, despite
The 2017 Budget contains improvements in the quality of public expenditure in line with the recommendations described above. The allocation for energy subsidies fell to 0.6 percent of GDP from 0.8 percent in the revised 2016 Budget (continuing the energy subsidy reform of previous years). This was mostly due to a 50 percent reduction in the per liter subsidy for diesel.46 The 2017 Budget also reduces the
45 World Bank, 2010, “Indonesia Agriculture Public Expenditure Review”. 46 This reduction was introduced in the 2016 revised Budget and maintained in the 2017 Budget.
S u s t a i n i n g r e f o r m m o m e n t u m I n d o n e s i a E c o n o m i c Q u a r t e r l y
January 2017 THE WORLD BANK | BANK DUNIA 25
some specific increases…
electricity subsidy for non-poor households (for 900 voltage customers),47 and restricts access to subsidized LPG (household gas) to targeted households and small firms (however, the level of the LPG subsidy actually increased ).48 These reductions, while a good start, do not generate sufficient fiscal space for priority development spending. Further decreases in energy subsides are required, as well as targeting improvements and reductions in non-energy subsidies. The fertilizer subsidy, Rastra, and the credit interest program subsidy49 are the three largest non-energy subsidy programs. The budget for Rastra was reduced by 12 percent in the 2017 Budget, however budgets for other non-energy subsides increased. Overall, non-energy subsidy spending was constant, and is now comparable to energy subsides at 0.6 percent of GDP.
…and better targeting of social programs
The 2017 Budget also contains some improvements to social assistance programs. Given Rastra’s problems discussed above, the Government will begin a trial of an improved distribution framework in 2017. Under the trial, rice purchases will occur through E-Warung—a single source from which holders of the family welfare card (Kartu Keluarga Sejahtera, KKS) can purchase rice and other subsidized goods. E-Warung allows for multiple transfers and subsidies to be integrated under one card and disbursed in one location. This is expected to reduce the leakage of such subsides and transfers to non-targeted households. The trial includes 1.2 million of the 14.3 million program beneficiary households.
Reduced subsidy spending enabled increased infrastructure expenditure
The 2017 allocation for infrastructure50 increased to 2.8 percent of GDP (18.6 percent of total spending) from 2.6 percent in the revised 2016 Budget. Further, a new policy requires districts to allocate a minimum 25 percent of their unconditional grant (Dana Alokasi Umum, DAU) and revenue sharing (Dana Bagi Hasil, DBH) allocations to infrastructure. However, the application of this policy needs to consider districts’ fiscal capacity, and should be followed by support to improve their implementation capacity. The allocations for health and social assistance remained fairly constant at 1.4 and 0.6 per cent of GDP, respectively. The coverage of one social assistance program (Penerima Bantuan Iuran, PBI) is projected to increase slightly from 92.4 million people in 2016 to 94.4 million people in 2017. However, the coverage of the most effective program (Program Keluarga Harapan, PKH) was maintained at 6 million households. Altogether, the 2017 Budget includes 0.2 percent of GDP in additional government spending for priority areas (contributing towards the target of 4 percent by 2020, as discussed above).
47 A household is considered poor if listed in the TNP2K Unified Database, which is used for targeting social transfers.
48 However, the level of the LPG subsidy actually increased. Overall the total allocation still fell to 0.16 of GDP (29 percent of total energy subsidies). 49 This includes a small business loan subsidy (Kredit Usaha Rakyat, KUR) and a subsidized mortgage program for low-income first-home buyers (Fasilitas Likuiditas Pembiayaan Perumahan, FLPP).
50 This follows the Ministry of Finance definition which includes selected central line ministry spending, estimates of transfers to sub-national governments for infrastructure, and financing investment (e.g., capital injection to SOEs).

S u s t a i n i n g r e f o r m m o m e n t u m I n d o n e s i a E c o n o m i c Q u a r t e r l y
January 2017 THE WORLD BANK | BANK DUNIA 26
C. Indonesia 2018 and beyond: A selective look
Towards a better understanding of teaching practices and their impact on student learning outcomes in Indonesia: a video study51
Indonesia is striving to improve education quality through promoting student-centered learning as part of teacher reform
Indonesia is striving to improve the quality of education to effectively respond to demand for workers with complex thinking skills over workers with basic skill sets. This necessitates reform in education, centered on a change in how students learn. To assist students to develop higher-order thinking skills, teachers must evolve from being transmitters of knowledge to facilitators of knowledge. The utilization of a student-centered learning approach is considered to be at the core of this change. Such an approach requires teachers to use more non-traditional instruction methods based on interactive learning, drawing upon investigative and practical teaching practices with a connection to real world contexts. Student-centered learning approaches were incorporated into Indonesia’s education policy more than thirty years ago; however, actual adoption of these approaches by teachers has been slow. The push towards student-centered learning was strengthened recently by a significant reform program to improve the quality of teachers through the promulgation of the Teacher Law (2005). A major requirement under this law is for all teachers to have a four-year degree and to undergo a process of certification, as a minimum standard.52 Although the law was well-intentioned, a recent randomized controlled trial evaluation of the certification program found no evidence of a positive effect on teacher effort or student learning outcomes,53 while another 51 The TIMSS video study was realized through a partnership between Indonesia’s Ministry of Education and Culture, the Royal government of the Netherlands, and the World Bank. This article draws from the TIMSS video study main report: World Bank, 2015, “Indonesia: A Video Study of Teaching Practices in TIMSS Eighth Grade Mathematics Classrooms, Main Report”.
52 The law stipulates a ten year transition period to enable existing teachers to become certified. 53 World Bank, 2016, “Pressures Easing” Indonesia Economic Quarterly, October 2016, pp.44-52. De Ree, Joppe, Muralidharan, Karthik, Pradhan, Menno, and Rogers, F. Hasley, 2016, “Double for Nothing? Experimental Evidence on the Impact of an Unconditional Teacher Salary Increase on Student Performance in Indonesia”, Working Paper, Jakarta: World Bank.
S u s t a i n i n g r e f o r m m o m e n t u m I n d o n e s i a E c o n o m i c Q u a r t e r l y
January 2017 THE WORLD BANK | BANK DUNIA 27
observational study found that the teacher certification process is affected by politics, in particular, local election cycles (Box 2).54
Student-centered teaching practices promote self-directed learning and reasoning skills over rote-learning
Different teaching practices promote the development of different cognitive skills in students. More “traditional”, teacher-centered approaches tend to promote factual knowledge and routine problem solving skills, whereas student-centered practices promote reasoning skills. When a classroom operates with student-centered instruction, students and teachers share the focus. Instead of listening to the teacher exclusively, students and teachers interact equally. The perceived benefits of student-centered learning include: (i) students learn important communication skills through more intricate interaction with the teacher and other students; (ii) students may be able to develop a deeper understanding of concepts through discussions and sharing of ideas; (iii) students learn to direct their own learning, ask questions and complete tasks independently; and (iv) construction of knowledge for oneself can lead to greater genuine learning and mastery.
Box 2: Personnel politics: elections and teacher hiring in Indonesia
Beginning with decentralization reforms in 2001, the Indonesian government invested enormous fiscal and bureaucratic resources to improve its education sector. In 2002 the constitution was amended to commit the Government to spending at least 20 percent of its fiscal resources on education. As this amendment was implemented, the management and allocation of a large influx of fiscal resources led to a dramatic increase in the number of teachers, creating one of the lowest student-teacher ratios in the developing world.i A 2005 reform law also modernized the teaching profession by increasing professional standards, salaries, and school oversight. Despite these efforts, Indonesia has had limited success in improving student learning outcomes. While Indonesia’s test scores have improved recently, Indonesia still ranked in the lowest quintile of 71 developed and developing countries in the latest Program for International Student Assessment (PISA) science, math, and reading tests. Further, cheating in national exams is rampant and teacher absenteeism is common.ii Why is the increase in public spending on education not translating into substantive improvements in the quality of education? To help to answer this question, an analysis was conducted to examine how local electoral accountability, that is, the introduction of pilkada in 2005, has affected the hiring of PNS (civil servant) and contract teachers, the certification of PNS teachers, and student learning outcomes.iii Beginning in 2005, pilkada was phased-in across Indonesia’s sub-national governments following an idiosyncratic schedule. This allows for a comparison of outcomes in districts with local elections to districts that had yet to experience elections. Leveraging this natural experiment, the study analyzed detailed teacher censuses and student test scores in math, science, Indonesian, and English for over 80,000 students in 20 districts. First, the analysis assessed whether pilkada impacts the hiring of contract and civil service teachers. Findings show that the introduction of pilkada increased the total number of contract teachers by 1,200 per district on average. More specifically, evidence points to a marked increase in the number of contract teachers on the payroll in the year in which a district is undergoing pilkada. Further, on average, there were 800 more contract teachers per district on the payroll in election years than in nonelection years. Some of this short-term hiring of contract teachers ends after the election. By comparison, there was no similar effect for civil service teachers, likely due to the constraints on hiring civil servants. That is, districts can hire teachers as permanent civil servants, but this requires teachers to fulfill certain minimum standards and pass a civil service exam. Further, district hiring of civil servants is constrained by central government quotas for civil service jobs. In contrast, hiring contract teachers is more flexible, and local district heads can also re-assign contrast teachers to different schools, independently of educational needs.iv Second, the study examined whether pilkada affects the certification of civil service teachers. Civil service teachers who have earned a four-year degree and submitted a teaching portfolio (or have taken part in a special training course) can become certified, which entitles them to a special professional allowance, dramatically increasing their salary. District governments are in charge of the certification process including evaluating the teaching portfolios and administering
54 Jan Pierskalla and Audrey Sacks, 2016, “Personnel Politics: Elections and Teacher Hiring in Indonesia”, Working Paper, Jakarta: World Bank.

S u s t a i n i n g r e f o r m m o m e n t u m I n d o n e s i a E c o n o m i c Q u a r t e r l y
January 2017 THE WORLD BANK | BANK DUNIA 28
the training course. Findings suggest that in the run-up to an election, the certification rates of civil servant teachers rise. In election years, the probability that a teacher will receive certification increases by 3 percentage points. Third, the study assessed whether pilkada impacts student learning outcomes. Out of the 36 districts for which there were student learning data, pilkada had a negative effect on student learning in ten districts, a positive effect in five districts, and no effect in the remaining districts. This suggests that elections can, at least for some districts, disrupt the standard operation of schools and negatively affect student learning. Taking these finding together, the study helps explain why the Government's increased spending on education is not translating into improvements in student learning outcomes.
i Cerdan-Infantes, Pedro, Makarova, Yulia, Al-Samarrai, Samer, and Chen, Dandan, 2013, “Spending more or spending better: Improving Education Financing in Indonesia”, Policy Brief # 76404, Washington DC: World Bank; ii Usman, Syaikhu, Akhmadi, and Suryadarma, Daniel, 2004, “When Teachers are Absent: Where do They Go and What is the Impact on Students?”, Jakarta: SMERU Research Institute; iii Jan Pierskalla and Audrey Sacks, 2016, “Personnel Politics: Elections and Teacher Hiring in Indonesia”, Working Paper, Jakarta: World Bank. iv Chang, Mae Chu, Shaeffer, Sheldon, Al-Samarrai, Samer, Ragatz, Andrew B., de Ree, Joppe, & Stevenson, Ritchie, 2013, “Teacher reform in Indonesia: the role of politics and evidence in policy making”. World Bank.
a. The video study: aim, scope, methodology, and conceptual framework
A video study was conducted to help better understand current teaching practices and how students learn in Indonesia
Over 2007-2011, the World Bank, in collaboration with the Ministry of Education and Culture, conducted a video study to examine teacher behavior and instructional practices in 8th grade mathematics classrooms. The objective of the study was to better understand current teaching practices and the optimal ways students learn in Indonesia’s unique and complex social, economic, and cultural contexts. The video study was designed to link to Indonesia’s participation in the 2007 and 2011 Trends in International Mathematics and Science Study (TIMSS)—an international assessment of the mathematics and science knowledge of students in multiple countries. It was envisaged that the use of video would demonstrate what teaching practices are actually used in the classroom, provide a clearer picture of why these practices are used, and suggest how they relate to student learning outcomes. The ultimate aim of the study was to inform the design of practical measures to improve teaching quality to optimize student learning outcomes.
A total of 200 8th grade mathematics teachers participated in the video study, which used mixed research methods
The video study involved a total of 200 8th grade mathematics teachers, 100 teachers for each year of the study. Teachers were randomly selected to ensure that they were representative of the teacher population. One lesson per classroom was videotaped for the purpose of coding and analysis. The first phase of the video study (conducted in 2007) mainly involved quantitative research methods such as tracking the time spent on different activities. The second phase, conducted in 2011, also involved qualitative methods to examine the motivations and factors that influence teaching behavior. These qualitative data were collected through interviews and observations and used to prepare eight teacher case studies.
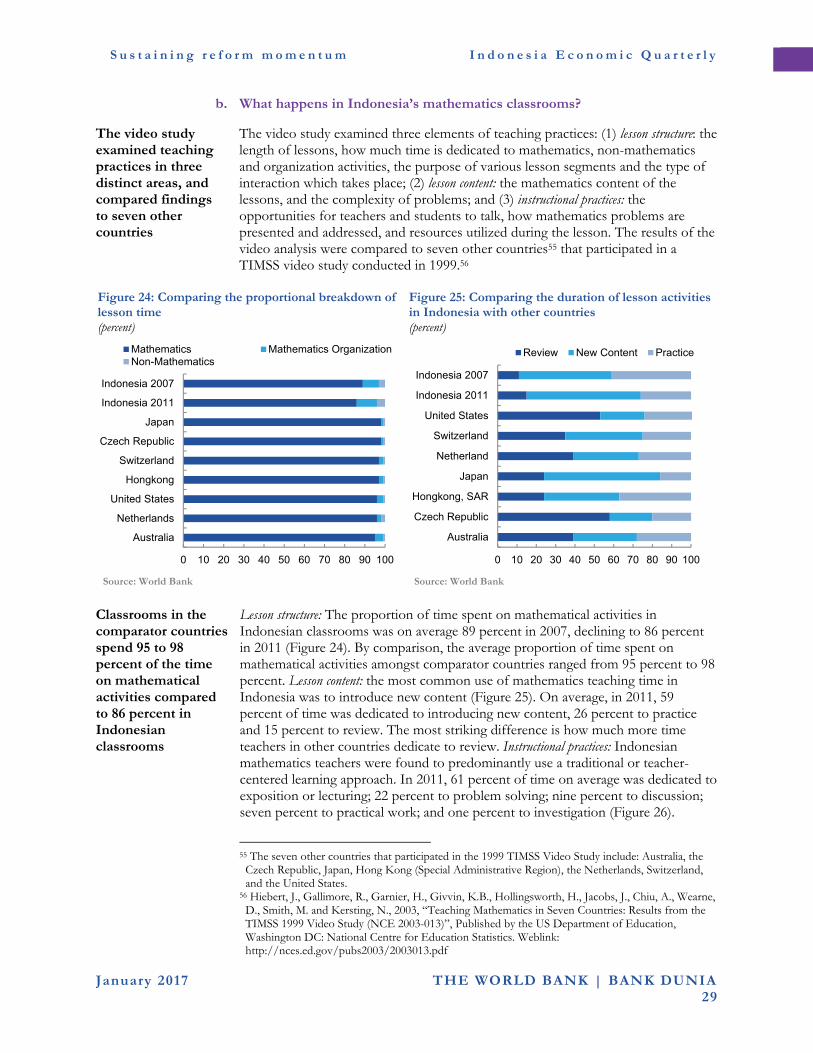
S u s t a i n i n g r e f o r m m o m e n t u m I n d o n e s i a E c o n o m i c Q u a r t e r l y
January 2017 THE WORLD BANK | BANK DUNIA 29
b. What happens in Indonesia’s mathematics classrooms?
The video study examined teaching practices in three distinct areas, and compared findings to seven other countries
The video study examined three elements of teaching practices: (1) lesson structure: the length of lessons, how much time is dedicated to mathematics, non-mathematics and organization activities, the purpose of various lesson segments and the type of interaction which takes place; (2) lesson content: the mathematics content of the lessons, and the complexity of problems; and (3) instructional practices: the opportunities for teachers and students to talk, how mathematics problems are presented and addressed, and resources utilized during the lesson. The results of the video analysis were compared to seven other countries55 that participated in a TIMSS video study conducted in 1999.56
Figure 24: Comparing the proportional breakdown of lesson time (percent)
Figure 25: Comparing the duration of lesson activities in Indonesia with other countries (percent)
Source: World Bank Source: World Bank
Classrooms in the comparator countries spend 95 to 98 percent of the time on mathematical activities compared to 86 percent in Indonesian classrooms
Lesson structure: The proportion of time spent on mathematical activities in Indonesian classrooms was on average 89 percent in 2007, declining to 86 percent in 2011 (Figure 24). By comparison, the average proportion of time spent on mathematical activities amongst comparator countries ranged from 95 percent to 98 percent. Lesson content: the most common use of mathematics teaching time in Indonesia was to introduce new content (Figure 25). On average, in 2011, 59 percent of time was dedicated to introducing new content, 26 percent to practice and 15 percent to review. The most striking difference is how much more time teachers in other countries dedicate to review. Instructional practices: Indonesian mathematics teachers were found to predominantly use a traditional or teacher-centered learning approach. In 2011, 61 percent of time on average was dedicated to exposition or lecturing; 22 percent to problem solving; nine percent to discussion; seven percent to practical work; and one percent to investigation (Figure 26).
55 The seven other countries that participated in the 1999 TIMSS Video Study include: Australia, the
Czech Republic, Japan, Hong Kong (Special Administrative Region), the Netherlands, Switzerland, and the United States.
56 Hiebert, J., Gallimore, R., Garnier, H., Givvin, K.B., Hollingsworth, H., Jacobs, J., Chiu, A., Wearne, D., Smith, M. and Kersting, N., 2003, “Teaching Mathematics in Seven Countries: Results from the TIMSS 1999 Video Study (NCE 2003-013)”, Published by the US Department of Education, Washington DC: National Centre for Education Statistics. Weblink: http://nces.ed.gov/pubs2003/2003013.pdf
0 10 20 30 40 50 60 70 80 90 100
Australia
Netherlands
United States
Hongkong
Switzerland
Czech Republic
Japan
Indonesia 2011
Indonesia 2007
Mathematics Mathematics OrganizationNon-Mathematics
0 10 20 30 40 50 60 70 80 90 100
Australia
Czech Republic
Hongkong, SAR
Japan
Netherland
Switzerland
United States
Indonesia 2011
Indonesia 2007
Review New Content Practice
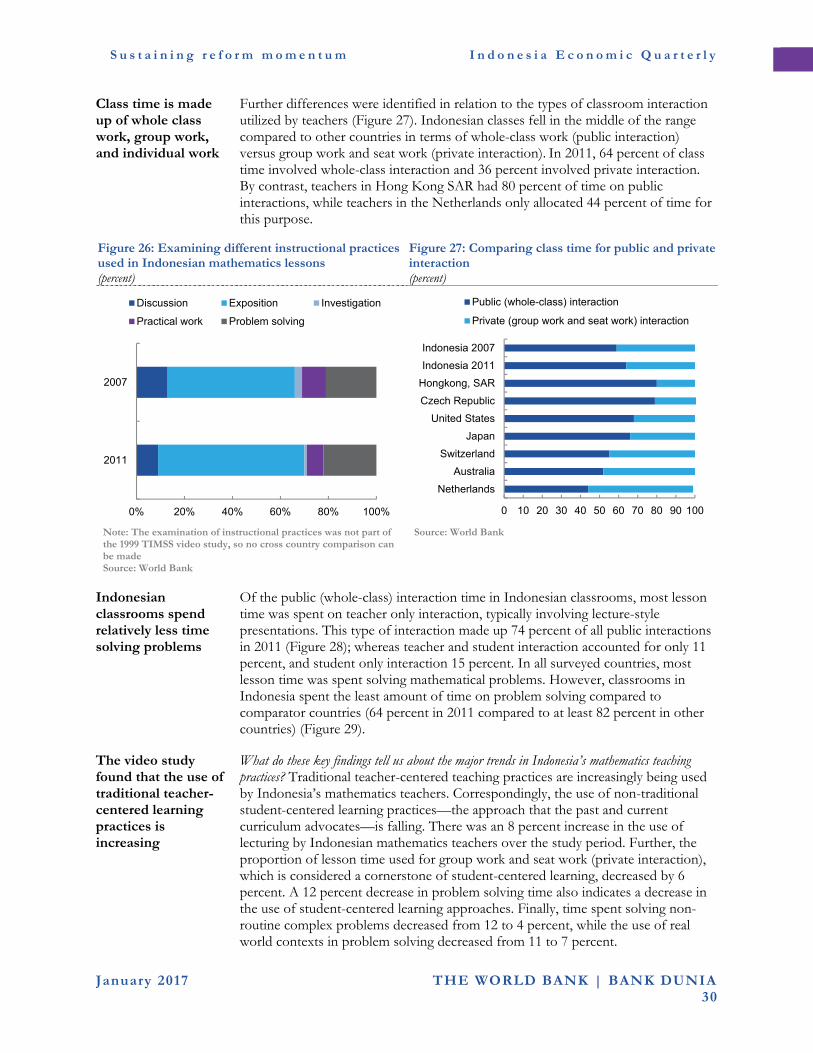
S u s t a i n i n g r e f o r m m o m e n t u m I n d o n e s i a E c o n o m i c Q u a r t e r l y
January 2017 THE WORLD BANK | BANK DUNIA 30
Class time is made up of whole class work, group work, and individual work
Further differences were identified in relation to the types of classroom interaction utilized by teachers (Figure 27). Indonesian classes fell in the middle of the range compared to other countries in terms of whole-class work (public interaction) versus group work and seat work (private interaction). In 2011, 64 percent of class time involved whole-class interaction and 36 percent involved private interaction. By contrast, teachers in Hong Kong SAR had 80 percent of time on public interactions, while teachers in the Netherlands only allocated 44 percent of time for this purpose.
Figure 26: Examining different instructional practices used in Indonesian mathematics lessons (percent)
Figure 27: Comparing class time for public and private interaction (percent)
Note: The examination of instructional practices was not part of the 1999 TIMSS video study, so no cross country comparison can be made Source: World Bank
Source: World Bank
Indonesian classrooms spend relatively less time solving problems
Of the public (whole-class) interaction time in Indonesian classrooms, most lesson time was spent on teacher only interaction, typically involving lecture-style presentations. This type of interaction made up 74 percent of all public interactions in 2011 (Figure 28); whereas teacher and student interaction accounted for only 11 percent, and student only interaction 15 percent. In all surveyed countries, most lesson time was spent solving mathematical problems. However, classrooms in Indonesia spent the least amount of time on problem solving compared to comparator countries (64 percent in 2011 compared to at least 82 percent in other countries) (Figure 29).
The video study found that the use of traditional teacher-centered learning practices is increasing
What do these key findings tell us about the major trends in Indonesia’s mathematics teaching practices? Traditional teacher-centered teaching practices are increasingly being used by Indonesia’s mathematics teachers. Correspondingly, the use of non-traditional student-centered learning practices—the approach that the past and current curriculum advocates—is falling. There was an 8 percent increase in the use of lecturing by Indonesian mathematics teachers over the study period. Further, the proportion of lesson time used for group work and seat work (private interaction), which is considered a cornerstone of student-centered learning, decreased by 6 percent. A 12 percent decrease in problem solving time also indicates a decrease in the use of student-centered learning approaches. Finally, time spent solving non-routine complex problems decreased from 12 to 4 percent, while the use of real world contexts in problem solving decreased from 11 to 7 percent.
0% 20% 40% 60% 80% 100%
2011
2007
Discussion Exposition Investigation
Practical work Problem solving
0 10 20 30 40 50 60 70 80 90 100
Netherlands
Australia
Switzerland
Japan
United States
Czech Republic
Hongkong, SAR
Indonesia 2011
Indonesia 2007
Public (whole-class) interaction
Private (group work and seat work) interaction
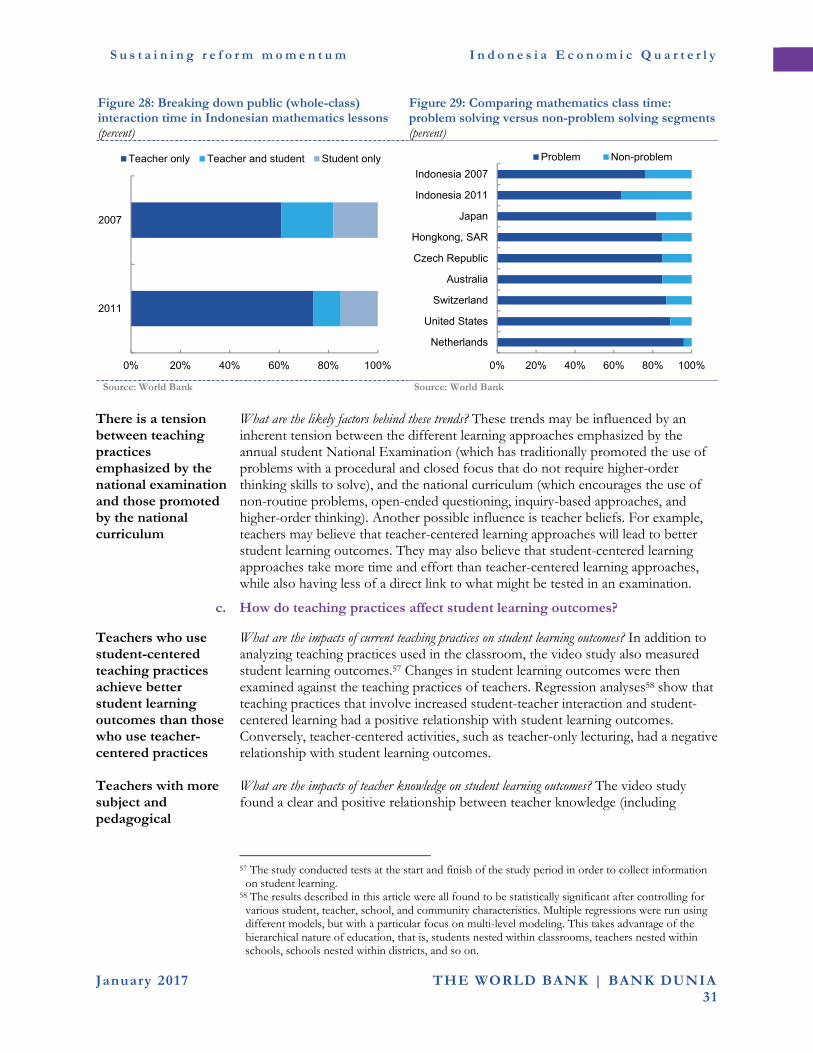
S u s t a i n i n g r e f o r m m o m e n t u m I n d o n e s i a E c o n o m i c Q u a r t e r l y
January 2017 THE WORLD BANK | BANK DUNIA 31
Figure 28: Breaking down public (whole-class) interaction time in Indonesian mathematics lessons (percent)
Figure 29: Comparing mathematics class time: problem solving versus non-problem solving segments (percent)
Source: World Bank Source: World Bank
There is a tension between teaching practices emphasized by the national examination and those promoted by the national curriculum
What are the likely factors behind these trends? These trends may be influenced by an inherent tension between the different learning approaches emphasized by the annual student National Examination (which has traditionally promoted the use of problems with a procedural and closed focus that do not require higher-order thinking skills to solve), and the national curriculum (which encourages the use of non-routine problems, open-ended questioning, inquiry-based approaches, and higher-order thinking). Another possible influence is teacher beliefs. For example, teachers may believe that teacher-centered learning approaches will lead to better student learning outcomes. They may also believe that student-centered learning approaches take more time and effort than teacher-centered learning approaches, while also having less of a direct link to what might be tested in an examination.
c. How do teaching practices affect student learning outcomes?
Teachers who use student-centered teaching practices achieve better student learning outcomes than those who use teacher-centered practices
What are the impacts of current teaching practices on student learning outcomes? In addition to analyzing teaching practices used in the classroom, the video study also measured student learning outcomes.57 Changes in student learning outcomes were then examined against the teaching practices of teachers. Regression analyses58 show that teaching practices that involve increased student-teacher interaction and student-centered learning had a positive relationship with student learning outcomes. Conversely, teacher-centered activities, such as teacher-only lecturing, had a negative relationship with student learning outcomes.
Teachers with more subject and pedagogical
What are the impacts of teacher knowledge on student learning outcomes? The video study found a clear and positive relationship between teacher knowledge (including
57 The study conducted tests at the start and finish of the study period in order to collect information on student learning.
58 The results described in this article were all found to be statistically significant after controlling for various student, teacher, school, and community characteristics. Multiple regressions were run using different models, but with a particular focus on multi-level modeling. This takes advantage of the hierarchical nature of education, that is, students nested within classrooms, teachers nested within schools, schools nested within districts, and so on.
0% 20% 40% 60% 80% 100%
2011
2007
Teacher only Teacher and student Student only
0% 20% 40% 60% 80% 100%
Netherlands
United States
Switzerland
Australia
Czech Republic
Hongkong, SAR
Japan
Indonesia 2011
Indonesia 2007
Problem Non-problem
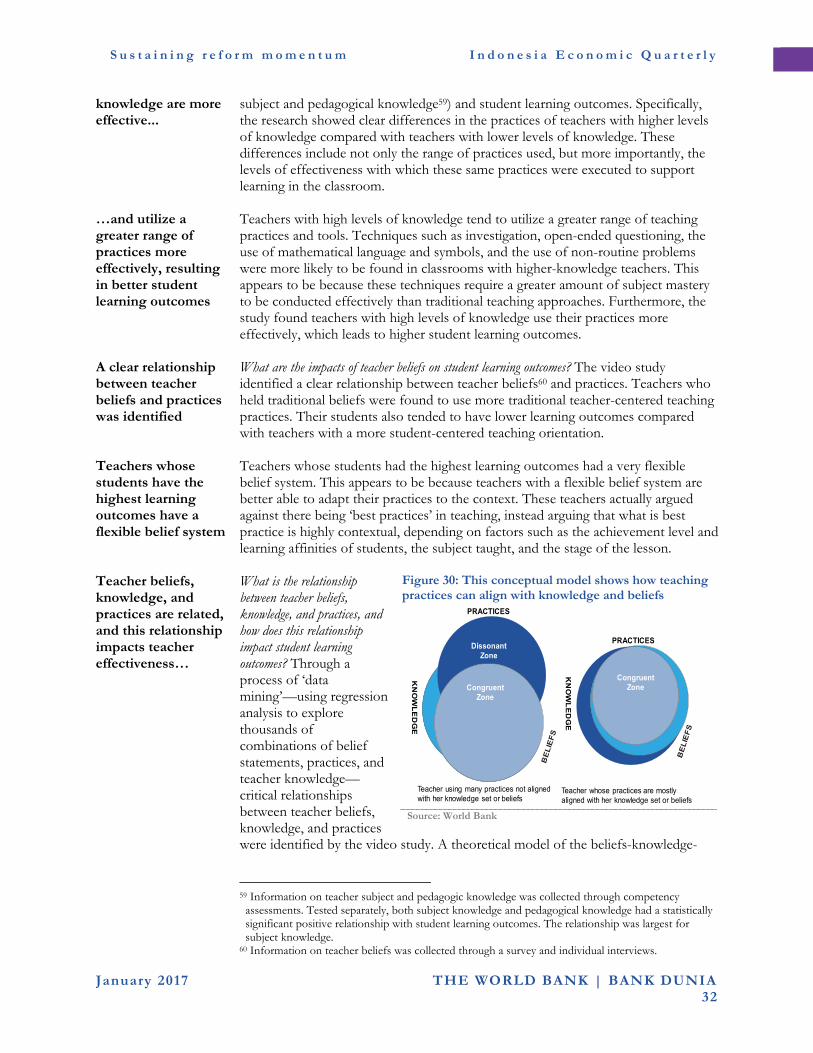
S u s t a i n i n g r e f o r m m o m e n t u m I n d o n e s i a E c o n o m i c Q u a r t e r l y
January 2017 THE WORLD BANK | BANK DUNIA 32
knowledge are more effective...
subject and pedagogical knowledge59) and student learning outcomes. Specifically, the research showed clear differences in the practices of teachers with higher levels of knowledge compared with teachers with lower levels of knowledge. These differences include not only the range of practices used, but more importantly, the levels of effectiveness with which these same practices were executed to support learning in the classroom.
…and utilize a greater range of practices more effectively, resulting in better student learning outcomes
Teachers with high levels of knowledge tend to utilize a greater range of teaching practices and tools. Techniques such as investigation, open-ended questioning, the use of mathematical language and symbols, and the use of non-routine problems were more likely to be found in classrooms with higher-knowledge teachers. This appears to be because these techniques require a greater amount of subject mastery to be conducted effectively than traditional teaching approaches. Furthermore, the study found teachers with high levels of knowledge use their practices more effectively, which leads to higher student learning outcomes.
A clear relationship between teacher beliefs and practices was identified
What are the impacts of teacher beliefs on student learning outcomes? The video study identified a clear relationship between teacher beliefs60 and practices. Teachers who held traditional beliefs were found to use more traditional teacher-centered teaching practices. Their students also tended to have lower learning outcomes compared with teachers with a more student-centered teaching orientation.
Teachers whose students have the highest learning outcomes have a flexible belief system
Teachers whose students had the highest learning outcomes had a very flexible belief system. This appears to be because teachers with a flexible belief system are better able to adapt their practices to the context. These teachers actually argued against there being ‘best practices’ in teaching, instead arguing that what is best practice is highly contextual, depending on factors such as the achievement level and learning affinities of students, the subject taught, and the stage of the lesson.
Teacher beliefs, knowledge, and practices are related, and this relationship impacts teacher effectiveness…
What is the relationship between teacher beliefs, knowledge, and practices, and how does this relationship impact student learning outcomes? Through a process of ‘data mining’—using regression analysis to explore thousands of combinations of belief statements, practices, and teacher knowledge—critical relationships between teacher beliefs, knowledge, and practices were identified by the video study. A theoretical model of the beliefs-knowledge-
Figure 30: This conceptual model shows how teaching practices can align with knowledge and beliefs
Source: World Bank
59 Information on teacher subject and pedagogic knowledge was collected through competency
assessments. Tested separately, both subject knowledge and pedagogical knowledge had a statistically significant positive relationship with student learning outcomes. The relationship was largest for subject knowledge.
60 Information on teacher beliefs was collected through a survey and individual interviews.
PRACTICES
PRACTICES
KN
OW
LE
DG
E
KN
OW
LE
DG
E
Teacher using many practices not aligned with her knowledge set or beliefs
Teacher whose practices are mostly aligned with her knowledge set or beliefs
Congruent ZoneCongruent
Zone
Dissonant Zone
S u s t a i n i n g r e f o r m m o m e n t u m I n d o n e s i a E c o n o m i c Q u a r t e r l y
January 2017 THE WORLD BANK | BANK DUNIA 33
practices relationship was then developed to try to better understand the dynamics of this relationship in regard to teacher effectiveness (Figure 30). The data mining analysis showed that: (i) teachers are most effective when the practices they use align with their beliefs and knowledge (they know from a subject and pedagogical standpoint how to use the practice), represented by the ‘Congruent Zone’ in the model; (ii) teachers are least effective in using practices that do not align with their knowledge or beliefs, represented by the ‘Dissonant Zone’; and (iii) the effectiveness of a teaching practice is relative and contextual.
…understanding this relationship can help improve teacher effectiveness
What are the implications of this relationship for improving the effectiveness of mathematics teachers in Indonesia? Understanding the relationship between teacher practices, beliefs and knowledge provides an opportunity to improve teacher effectiveness through professional development programs. For teachers to effectively implement student-centered learning practices, they need continual support to progressively build the knowledge and beliefs necessary to utilize the new practices. That is, it is not enough for teachers to just start using student-centered practices; they must also develop the beliefs and knowledge to enable them to implement these practices effectively.
Key findings from the video study were used to develop a teacher training course, which had a positive impact on teaching practices
Key findings from the video study have been utilized to develop and pilot an in-service course for teachers, conducted through mathematics teachers’ working groups at primary and secondary schools. The impact evaluation of the pilot showed that teacher beliefs about the teaching and learning process changed, and that subject and pedagogical knowledge was strengthened. Importantly, there were indications of teachers changing their practices in the classroom after the course. Indonesia’s Ministry of Education and Culture (MoEC) has made the course available online, while trying to retain its interactive and discussion-orientated philosophy. The video study’s findings could also be used to refine the tests MoEC uses as part of their Teacher Professional Management System (TPMS), such as the minimum standards in professional pedagogical competency test. Improving teaching standards and teacher practices is particularly pressing given the recent increase in hiring of contract teachers, many of whom lack the necessary four-year degree for permanent civil service positions.61
61 Ministry of Education and Culture Teacher Census, 2006, 2008, and 2010.

S u s t a i n i n g r e f o r m m o m e n t u m I n d o n e s i a E c o n o m i c Q u a r t e r l y
January 2017 THE WORLD BANK | BANK DUNIA 34
APPENDIX: A SNAPSHOT OF INDONESIAN ECONOMIC INDICATORS
Appendix Figure 1: Real GDP growth (percent)
Appendix Figure 2: Contributions to GDP expenditures (contribution to real GDP growth yoy, percent)
Source: BPS; World Bank staff calculations Note: * includes changes in stocks.
Source: BPS; World Bank staff calculations
Appendix Figure 3: Contributions to GDP production (contribution to real GDP growth yoy, percent)
Appendix Figure 4: Motorcycle and motor vehicle sales (seasonally-adjusted yoy growth, percent)
Source: BPS; World Bank staff calculations Source: CEIC; World Bank staff calculations
Appendix Figure 5: Consumer indicators (index 2010=100)
Appendix Figure 6: Industrial production indicators (diffusion index; growth yoy, percent)
Source: BI; World Bank staff calculations Source: BPS; Nikkei/Markit; World Bank staff calculations
0
2
4
6
8
0
1
2
3
4
Sep-10 Sep-12 Sep-14 Sep-16
Qoq seasonally adjusted (sa)
Yoy (RHS)
Average qoq sa
-4
-2
0
2
4
6
8
Sep-13 Sep-14 Sep-15 Sep-16
Private cons. Gov cons.Investment Net exportsStat.discrepancy* GDP
0
2
4
6
8
Sep-13 Sep-14 Sep-15 Sep-16
Agriculture Mining and constr.Manufacturing Comm & transportTrade, hotel & rest Other servicesGDP
-40
-20
0
20
40
Nov-13 Nov-14 Nov-15 Nov-16
Motorcycle sales
Motor vehicle sales
90
120
150
180
210
Dec-13 Dec-14 Dec-15 Dec-16
BI Retail sales index
BI Consumer SurveyIndex
-10
-5
0
5
10
15
45
47
49
51
53
55
Dec-13 Dec-14 Dec-15 Dec-16
Manufacturing PMI
Industrial production (RHS)

S u s t a i n i n g r e f o r m m o m e n t u m I n d o n e s i a E c o n o m i c Q u a r t e r l y
January 2017 THE WORLD BANK | BANK DUNIA 35
Appendix Figure 7: Balance of payments (USD billion)
Appendix Figure 8: Current account components (USD billion)
Source: BI; World Bank staff calculations Source: BI; World Bank staff calculations
Appendix Figure 9: Exports of goods (USD billion)
Appendix Figure 10: Imports of goods (USD billion)
Source: BPS; World Bank staff calculations Source: BPS; World Bank staff calculations
Appendix Figure 11: Reserves and capital flows (USD billion)
Appendix Figure 12: Inflation (growth yoy, percent)
Source: BI; MoF; World Bank staff calculations Source: BPS; BI; World Bank staff calculations
-16
-8
0
8
16
Sep-13 Sep-14 Sep-15 Sep-16
Current account Capital and financialErrors and omissions Overall BoP inflows
-16
-8
0
8
16
Sep-13 Sep-14 Sep-15 Sep-16
Goods trade
Services trade Primary income
Secondary income
Current account
0
4
8
12
16
Nov-14 May-15 Nov-15 May-16 Nov-16
Oil and gas
Agriculture
Manufacturing
Mining
Total Exports (fob)
0
4
8
12
16
Nov-14 May-15 Nov-15 May-16 Nov-16
Oil and gasConsumer goodsCapital goods
Raw materials
Total Import (cif)
-5
-2
1
4
7
10
0
25
50
75
100
125
Dec-13 Dec-14 Dec-15 Dec-16
Equities SUN SBI Global bondsNon-resident portfolio inflows, (RHS):
International Reserves
0.0
4.0
8.0
12.0
Dec-13 Dec-14 Dec-15 Dec-16
Core inflation
Headline inflation

S u s t a i n i n g r e f o r m m o m e n t u m I n d o n e s i a E c o n o m i c Q u a r t e r l y
January 2017 THE WORLD BANK | BANK DUNIA 36
Appendix Figure 13: Monthly breakdown of CPI (percentage point contributions to monthly growth)
Appendix Figure 14: Inflation comparison across countries (change yoy)
Source: BPS; World Bank staff calculations *Note: December 2016; others November.
Source: BPS; CEIC; World Bank staff calculations
Appendix Figure 15: Domestic and international rice prices (percent LHS, wholesale price, in IDR per kg RHS)
Appendix Figure 16: Poverty and unemployment rate (percent)
Source: Cipinang wholesale rice market; FAO; World Bank staff calculations
Source: BPS; World Bank staff calculations
Appendix Figure 17: Regional equity indices (daily index in local currency, December 2, 2014=100)
Appendix Figure 18: Selected currencies against USD (monthly index December 2014=100)
Source: CEIC; World Bank staff calculations Source: CEIC; World Bank staff calculations
-1
0
1
2
3
Dec-13 Dec-14 Dec-15 Dec-16
Core Administered
Volatile Headline
-1 0 1 2 3 4 5
Singapore
Japan
Thailand *
Korea
USA
Malaysia
China
Philippines
Indonesia *
India
0
2,500
5,000
7,500
10,000
12,500
20
40
60
80
100
120
Dec-13 Dec-14 Dec-15 Dec-16
Domestic rice, IR64-II(RHS)
Vietnamese rice 5% broken (RHS)
Percentage spread 0
4
8
12
16
20
24
2004 2006 2008 2010 2012 2014 2016
Poverty rate
Unemployment rate
60
90
120
150
180
Dec-14 Jun-15 Dec-15 Jun-16 Dec-16
Shanghai-China
SET-Thailand
JSI-Indonesia
SGX-Singapore
BSE-India
50
60
70
80
90
100
110
Dec-14 Jun-15 Dec-15 Jun-16 Dec-16
Brazil
South Africa
Turkey
IndonesiaIndia
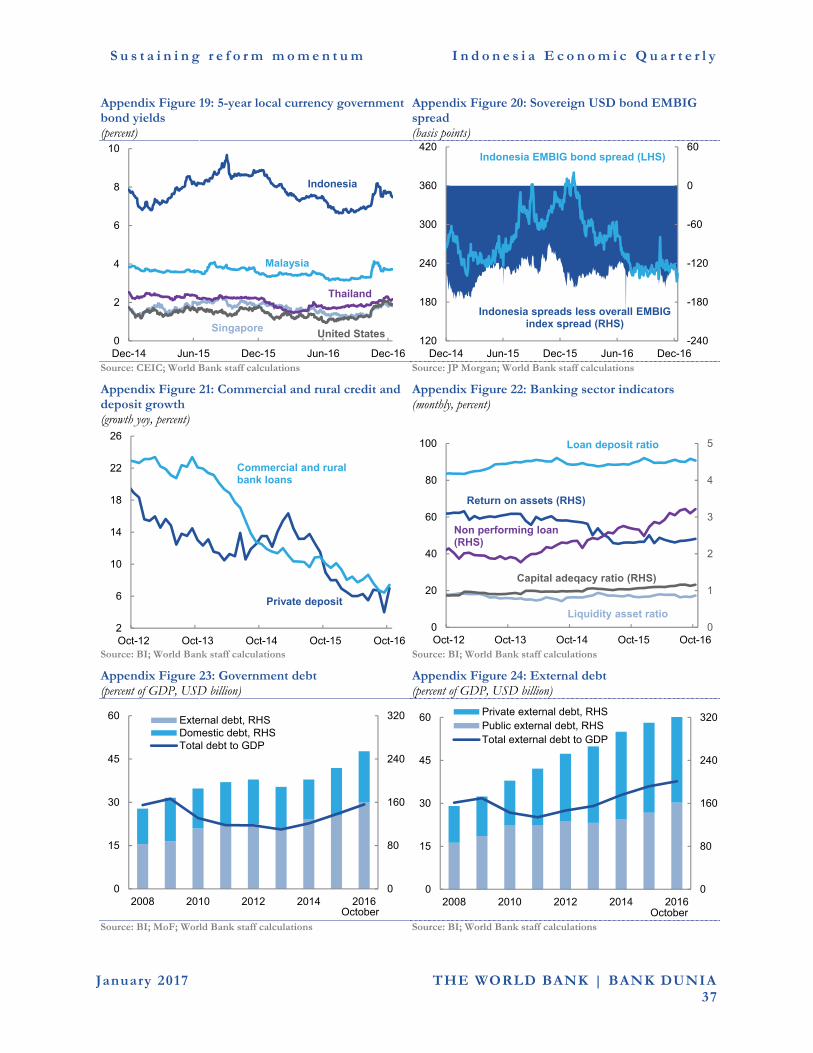
S u s t a i n i n g r e f o r m m o m e n t u m I n d o n e s i a E c o n o m i c Q u a r t e r l y
January 2017 THE WORLD BANK | BANK DUNIA 37
Appendix Figure 19: 5-year local currency government bond yields (percent)
Appendix Figure 20: Sovereign USD bond EMBIG spread (basis points)
Source: CEIC; World Bank staff calculations Source: JP Morgan; World Bank staff calculations
Appendix Figure 21: Commercial and rural credit and deposit growth (growth yoy, percent)
Appendix Figure 22: Banking sector indicators (monthly, percent)
Source: BI; World Bank staff calculations Source: BI; World Bank staff calculations
Appendix Figure 23: Government debt (percent of GDP, USD billion)
Appendix Figure 24: External debt (percent of GDP, USD billion)
Source: BI; MoF; World Bank staff calculations Source: BI; World Bank staff calculations
0
2
4
6
8
10
Dec-14 Jun-15 Dec-15 Jun-16 Dec-16
Indonesia
United States
Thailand
Malaysia
Singapore-240
-180
-120
-60
0
60
120
180
240
300
360
420
Dec-14 Jun-15 Dec-15 Jun-16 Dec-16
Indonesia EMBIG bond spread (LHS)
Indonesia spreads less overall EMBIG index spread (RHS)
2
6
10
14
18
22
26
Oct-12 Oct-13 Oct-14 Oct-15 Oct-16
Private deposit
Commercial and ruralbank loans
0
1
2
3
4
5
0
20
40
60
80
100
Oct-12 Oct-13 Oct-14 Oct-15 Oct-16
Return on assets (RHS)
Loan deposit ratio
Liquidity asset ratio
Non performing loan (RHS)
Capital adeqacy ratio (RHS)
0
80
160
240
320
0
15
30
45
60
2008 2010 2012 2014 2016
External debt, RHSDomestic debt, RHSTotal debt to GDP
October
0
80
160
240
320
0
15
30
45
60
2008 2010 2012 2014 2016
Private external debt, RHSPublic external debt, RHSTotal external debt to GDP
October

S u s t a i n i n g r e f o r m m o m e n t u m I n d o n e s i a E c o n o m i c Q u a r t e r l y
January 2017 THE WORLD BANK | BANK DUNIA 38
Appendix Table 1: Budget outcomes and projections (IDR trillion)
2012 2013 2014 2015 2016 2017
Actual Actual Actual Actual
Preliminary Actual
Budget
A. State revenue and grants 1,338 1,439 1,550 1,508 1,552 1,750
1. Tax revenue 981 1,077 1,147 1,240 1,284 1,499
2. Non-tax revenue 352 355 399 256 262 250
B. Expenditure 1,491 1,651 1,777 1,807 1,860 2,081
1. Central government 1,011 1,137 1,204 1,183 1,149 1,316
2. Transfers to the regions 481 513 574 623 711 765
C. Primary balance -53 -99 -93 -142 -125 -109
D. SURPLUS / DEFICIT -153 -212 -227 -298 -308 -330
(percent of GDP) -1.8 -2.2 -2.1 -2.6 -2.5 -2.4
Note: Budget balance as percentage of GDP uses the revised and rebased GDP. Source: MoF; World Bank staff calculations
Appendix Table 2: Balance of payments (USD billion)
2013 2014 2015
2015 2016
Q2 Q3 Q4 Q1 Q2 Q3
Balance of payments -7.3 15.2 -1.1 -2.9 -4.6 5.1 -0.3 2.2 5.7
Percent of GDP -0.8 1.7 -0.1 -1.3 -2.1 2.4 -0.1 0.9 2.3
Current account -29.1 -27.5 -17.6 -4.6 -3.9 -4.9 -4.8 -5.0 -4.5
Percent of GDP -3.2 -3.1 -2.0 -2.1 -1.8 -2.3 -2.2 -2.2 -1.8
Trade balance -6.2 -3.0 5.0 1.5 2.0 0.2 1.6 1.6 2.4
Net income & current transfers -22.9 -24.5 -22.6 -6.1 -5.9 -5.2 -6.3 -6.6 -6.9
Capital & Financial Account 22.0 44.9 16.8 2.1 0.2 9.6 4.4 7.6 9.4
Percent of GDP 2.4 5.0 1.9 0.9 0.1 4.5 2.0 3.3 3.8
Direct investment 12.2 14.7 10.8 4.1 1.8 3.3 2.5 3.0 5.2
Portfolio investment 10.9 26.1 16.4 5.5 -2.2 4.6 4.4 8.3 6.5
Other investment -0.8 4.3 -10.5 -7.6 0.4 2.1 -2.5 -3.7 -2.3
Errors & omissions -0.2 -2.2 -0.3 -0.4 -0.8 0.4 0.0 -0.4 0.8
Foreign reserves* 99.4 111.9 105.9 108.0 101.7 105.9 107.5 109.8 115.7
Note: * Reserves at end-period. Source: BI; BPS; World Bank staff calculations
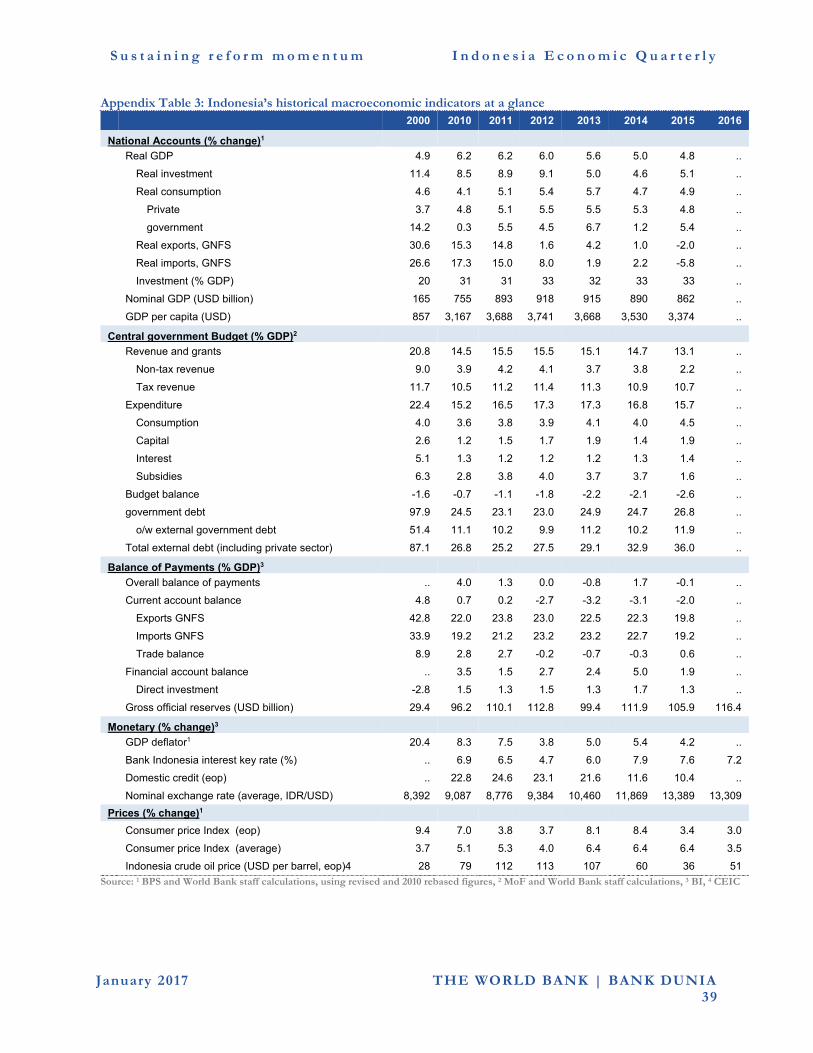
S u s t a i n i n g r e f o r m m o m e n t u m I n d o n e s i a E c o n o m i c Q u a r t e r l y
January 2017 THE WORLD BANK | BANK DUNIA 39
Appendix Table 3: Indonesia’s historical macroeconomic indicators at a glance 2000 2010 2011 2012 2013 2014 2015 2016
National Accounts (% change)1
Real GDP 4.9 6.2 6.2 6.0 5.6 5.0 4.8 ..
Real investment 11.4 8.5 8.9 9.1 5.0 4.6 5.1 ..
Real consumption 4.6 4.1 5.1 5.4 5.7 4.7 4.9 ..
Private 3.7 4.8 5.1 5.5 5.5 5.3 4.8 ..
government 14.2 0.3 5.5 4.5 6.7 1.2 5.4 ..
Real exports, GNFS 30.6 15.3 14.8 1.6 4.2 1.0 -2.0 ..
Real imports, GNFS 26.6 17.3 15.0 8.0 1.9 2.2 -5.8 ..
Investment (% GDP) 20 31 31 33 32 33 33 ..
Nominal GDP (USD billion) 165 755 893 918 915 890 862 ..
GDP per capita (USD) 857 3,167 3,688 3,741 3,668 3,530 3,374 ..
Central government Budget (% GDP)2
Revenue and grants 20.8 14.5 15.5 15.5 15.1 14.7 13.1 ..
Non-tax revenue 9.0 3.9 4.2 4.1 3.7 3.8 2.2 ..
Tax revenue 11.7 10.5 11.2 11.4 11.3 10.9 10.7 ..
Expenditure 22.4 15.2 16.5 17.3 17.3 16.8 15.7 ..
Consumption 4.0 3.6 3.8 3.9 4.1 4.0 4.5 ..
Capital 2.6 1.2 1.5 1.7 1.9 1.4 1.9 ..
Interest 5.1 1.3 1.2 1.2 1.2 1.3 1.4 ..
Subsidies 6.3 2.8 3.8 4.0 3.7 3.7 1.6 ..
Budget balance -1.6 -0.7 -1.1 -1.8 -2.2 -2.1 -2.6 ..
government debt 97.9 24.5 23.1 23.0 24.9 24.7 26.8 ..
o/w external government debt 51.4 11.1 10.2 9.9 11.2 10.2 11.9 ..
Total external debt (including private sector) 87.1 26.8 25.2 27.5 29.1 32.9 36.0 ..
Balance of Payments (% GDP)3
Overall balance of payments .. 4.0 1.3 0.0 -0.8 1.7 -0.1 ..
Current account balance 4.8 0.7 0.2 -2.7 -3.2 -3.1 -2.0 ..
Exports GNFS 42.8 22.0 23.8 23.0 22.5 22.3 19.8 ..
Imports GNFS 33.9 19.2 21.2 23.2 23.2 22.7 19.2 ..
Trade balance 8.9 2.8 2.7 -0.2 -0.7 -0.3 0.6 ..
Financial account balance .. 3.5 1.5 2.7 2.4 5.0 1.9 ..
Direct investment -2.8 1.5 1.3 1.5 1.3 1.7 1.3 ..
Gross official reserves (USD billion) 29.4 96.2 110.1 112.8 99.4 111.9 105.9 116.4
Monetary (% change)3
GDP deflator1 20.4 8.3 7.5 3.8 5.0 5.4 4.2 ..
Bank Indonesia interest key rate (%) .. 6.9 6.5 4.7 6.0 7.9 7.6 7.2
Domestic credit (eop) .. 22.8 24.6 23.1 21.6 11.6 10.4 ..
Nominal exchange rate (average, IDR/USD) 8,392 9,087 8,776 9,384 10,460 11,869 13,389 13,309
Prices (% change)1
Consumer price Index (eop) 9.4 7.0 3.8 3.7 8.1 8.4 3.4 3.0
Consumer price Index (average) 3.7 5.1 5.3 4.0 6.4 6.4 6.4 3.5
Indonesia crude oil price (USD per barrel, eop)4 28 79 112 113 107 60 36 51
Source: 1 BPS and World Bank staff calculations, using revised and 2010 rebased figures, 2 MoF and World Bank staff calculations, 3 BI, 4 CEIC
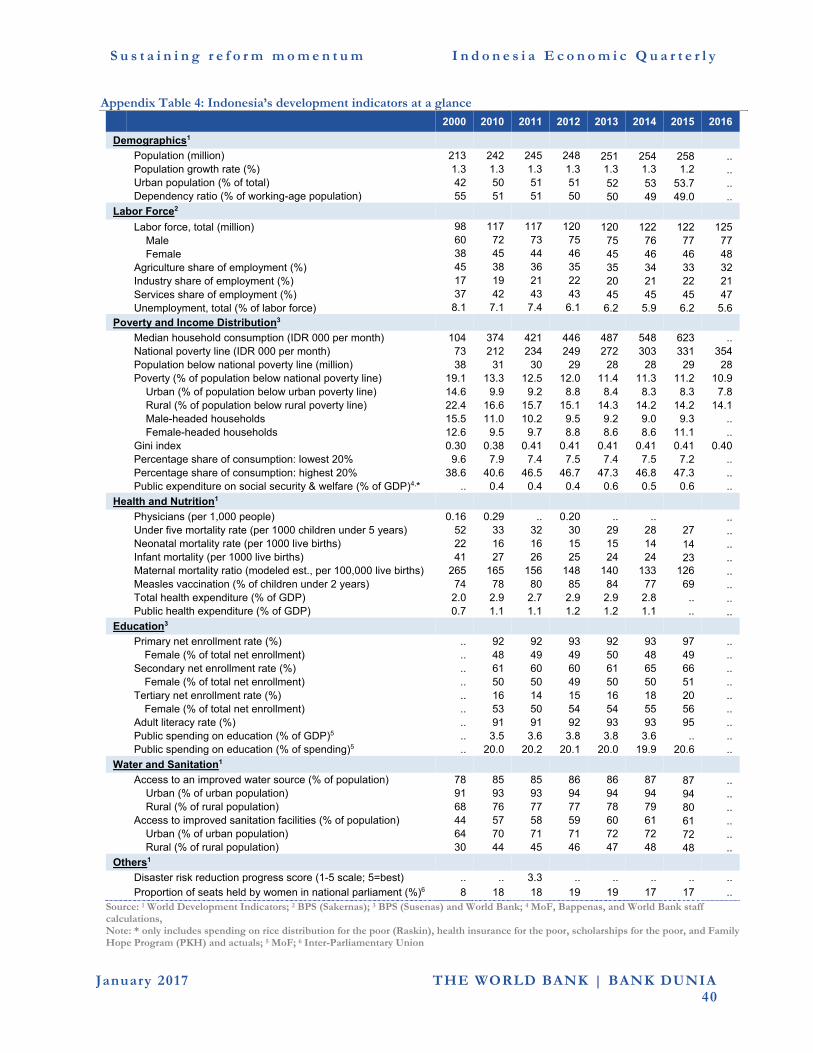
S u s t a i n i n g r e f o r m m o m e n t u m I n d o n e s i a E c o n o m i c Q u a r t e r l y
January 2017 THE WORLD BANK | BANK DUNIA 40
Appendix Table 4: Indonesia’s development indicators at a glance
2000 2010 2011 2012 2013 2014 2015 2016
Demographics1
Population (million) 213 242 245 248 251 254 258 .. Population growth rate (%) 1.3 1.3 1.3 1.3 1.3 1.3 1.2 .. Urban population (% of total) 42 50 51 51 52 53 53.7 .. Dependency ratio (% of working-age population) 55 51 51 50 50 49 49.0 ..
Labor Force2
Labor force, total (million) 98 117 117 120 120 122 122 125 Male 60 72 73 75 75 76 77 77 Female 38 45 44 46 45 46 46 48 Agriculture share of employment (%) 45 38 36 35 35 34 33 32 Industry share of employment (%) 17 19 21 22 20 21 22 21 Services share of employment (%) 37 42 43 43 45 45 45 47 Unemployment, total (% of labor force) 8.1 7.1 7.4 6.1 6.2 5.9 6.2 5.6
Poverty and Income Distribution3
Median household consumption (IDR 000 per month) 104 374 421 446 487 548 623 .. National poverty line (IDR 000 per month) 73 212 234 249 272 303 331 354 Population below national poverty line (million) 38 31 30 29 28 28 29 28 Poverty (% of population below national poverty line) 19.1 13.3 12.5 12.0 11.4 11.3 11.2 10.9 Urban (% of population below urban poverty line) 14.6 9.9 9.2 8.8 8.4 8.3 8.3 7.8 Rural (% of population below rural poverty line) 22.4 16.6 15.7 15.1 14.3 14.2 14.2 14.1 Male-headed households 15.5 11.0 10.2 9.5 9.2 9.0 9.3 .. Female-headed households 12.6 9.5 9.7 8.8 8.6 8.6 11.1 .. Gini index 0.30 0.38 0.41 0.41 0.41 0.41 0.41 0.40 Percentage share of consumption: lowest 20% 9.6 7.9 7.4 7.5 7.4 7.5 7.2 .. Percentage share of consumption: highest 20% 38.6 40.6 46.5 46.7 47.3 46.8 47.3 .. Public expenditure on social security & welfare (% of GDP)4,* .. 0.4 0.4 0.4 0.6 0.5 0.6 ..
Health and Nutrition1
Physicians (per 1,000 people) 0.16 0.29 .. 0.20 .. .. .. Under five mortality rate (per 1000 children under 5 years) 52 33 32 30 29 28 27 .. Neonatal mortality rate (per 1000 live births) 22 16 16 15 15 14 14 .. Infant mortality (per 1000 live births) 41 27 26 25 24 24 23 .. Maternal mortality ratio (modeled est., per 100,000 live births) 265 165 156 148 140 133 126 .. Measles vaccination (% of children under 2 years) 74 78 80 85 84 77 69 .. Total health expenditure (% of GDP) 2.0 2.9 2.7 2.9 2.9 2.8 .. .. Public health expenditure (% of GDP) 0.7 1.1 1.1 1.2 1.2 1.1 .. ..
Education3
Primary net enrollment rate (%) .. 92 92 93 92 93 97 .. Female (% of total net enrollment) .. 48 49 49 50 48 49 .. Secondary net enrollment rate (%) .. 61 60 60 61 65 66 .. Female (% of total net enrollment) .. 50 50 49 50 50 51 .. Tertiary net enrollment rate (%) .. 16 14 15 16 18 20 .. Female (% of total net enrollment) .. 53 50 54 54 55 56 .. Adult literacy rate (%) .. 91 91 92 93 93 95 .. Public spending on education (% of GDP)5 .. 3.5 3.6 3.8 3.8 3.6 .. .. Public spending on education (% of spending)5 .. 20.0 20.2 20.1 20.0 19.9 20.6 ..
Water and Sanitation1
Access to an improved water source (% of population) 78 85 85 86 86 87 87 .. Urban (% of urban population) 91 93 93 94 94 94 94 .. Rural (% of rural population) 68 76 77 77 78 79 80 .. Access to improved sanitation facilities (% of population) 44 57 58 59 60 61 61 .. Urban (% of urban population) 64 70 71 71 72 72 72 .. Rural (% of rural population) 30 44 45 46 47 48 48 ..
Others1
Disaster risk reduction progress score (1-5 scale; 5=best) .. .. 3.3 .. .. .. .. ..
Proportion of seats held by women in national parliament (%)6 8 18 18 19 19 17 17 .. Source: 1 World Development Indicators; 2 BPS (Sakernas); 3 BPS (Susenas) and World Bank; 4 MoF, Bappenas, and World Bank staff calculations, Note: * only includes spending on rice distribution for the poor (Raskin), health insurance for the poor, scholarships for the poor, and Family Hope Program (PKH) and actuals; 5 MoF; 6 Inter-Parliamentary Union

Resilience through reformsJune 2016
Supported by funding from the Australian Government (Department of Foreign Affairs and Trade, DFAT), under the Support for Enhanced Macroeconomic and Fiscal Policy Analysis (SEMEFPA) program.