january-march 2013 · 2019-09-16 · gunnebo provides solutions that increase efficiency and...
TRANSCRIPT

JANUARY-MARCH 2013

2
In Brief
Full year
MSEK 2013 2012 2012
Order intake 1,499 1,595 5,250
Net sales 1,155 1,169 5,236
Operating profit before depreciation (EBITDA) 24 31 274
Operating margin before depreciation (EBITDA), % 2.1 2.6 5.2
Operating profit before non-recurring items1)
11 14 266
Operating margin before non-recurring items, %1)
0.9 1.2 5.1
Operating profit (EBIT) 1 10 179
Operating margin (EBIT), % 0.1 0.8 3.4
Profit/loss for the period -12 -3 24
Earnings per share, SEK2)
-0.16 -0.04 0.26
Jan-March
2) Earnings per share before and after dilution
1) Items of a non-recurring nature amounted to MSEK -10 (-4) for the period January - March
CEO Comments
The first quarter is traditionally Gunnebo’s weakest. Development of net sales outside Europe continued to be
strong during the quarter. In Asia net sales increased by 17% and the markets in North and South America
developed also well. The US operation acquired in 2012 is delivering both net sales and margins as expected
and the operation in Brazil is showing good profitable growth. Sales outside Europe amounted to 39% of Group
sales at the end of the quarter.
In Europe we are seeing continued slow development on most markets. Development in Northern Europe is
more stable whereas Southern Europe continues to be weak. In general, the markets in Europe are
characterised by uncertainty which has an effect on investment decisions and postpones projects already
decided upon. We will continue to reduce fixed costs in Europe, as well as continue to invest in growth on
markets outside of Europe. During the quarter, expenses of a non-recurring nature amounted to MSEK 10.
First quarter 2013
Order intake amounted to MSEK 1,499 (1,595), organically* it decreased by 7%. Acquired units contributed MSEK 95.
Net sales amounted to MSEK 1,155 (1,169), organically* they decreased by 3%. Acquired units contributed MSEK 84.
Operating profit amounted to MSEK 1 (10) and the operating margin to 0.1% (0.8%). Acquired units had a positive effect on operating profit of MSEK 10.
Operating profit excluding expenses of a non-recurring nature of MSEK -10 (-4) amounted to MSEK 11 (14) and the operating margin to 0.9% (1.2%).
Profit/loss after tax for the quarter totalled MSEK -12 (-3).
Earnings per share were SEK -0.16 (-0.04).
*Organic growth is defined as “Growth in net sales, or order intake, adjusted for acquisitions, divestments and exchange rate
effects.”

3
Business Area Summary
Order intakeFull year
MSEK 2013 2012 2012
Business Area Bank Security & Cash Handling 580 632 2,374
Business Area Secure Storage 190 196 801
Business Area Global Services 477 511 1,138
Business Area Entrance Control 161 158 674
Business Area Developing Businesses 91 98 263
Total 1,499 1,595 5,250
Net sales
Full year
MSEK 2013 2012 2012
Business Area Bank Security & Cash Handling 516 494 2,386
Business Area Secure Storage 179 178 781
Business Area Global Services 268 287 1,143
Business Area Entrance Control 131 147 663
Business Area Developing Businesses 61 63 263
Total 1,155 1,169 5,236
Operating profit/loss, excl non-recurring itemsFull year
MSEK 2013 2012 2012
Business Area Bank Security & Cash Handling 1 13 158
Business Area Secure Storage 7 2 30
Business Area Global Services 22 22 110
Business Area Entrance Control 0 0 47
Business Area Developing Businesses -10 -13 -42
Central items -9 -10 -37
Operating profit, excluding non-recurring items 11 14 266
Operating margin, excl non-recurring itemsFull year
% 2013 2012 2012
Business Area Bank Security & Cash Handling 0.2 2.6 6.6
Business Area Secure Storage 3.9 1.1 3.8
Business Area Global Services 8.2 7.7 9.6
Business Area Entrance Control 0.0 0.0 7.1
Business Area Developing Businesses -16.4 -20.6 -16.0
Operating margin, excluding non-recurring items 0.9 1.2 5.1
Jan-March
Jan-March
Jan-March
Jan-March

4
Non-recurring items
Full year
MSEK 2013 2012 2012
Business Area Bank Security & Cash Handling -7 - -13
Business Area Secure Storage -1 - -11
Business Area Global Services -1 - -9
Business Area Entrance Control -1 - -33
Business Area Developing Businesses 0 - -1
Central items - -4 -20
Total -10 -4 -87
Operating profit/loss, incl non-recurring items
Full year
MSEK 2013 2012 2012
Business Area Bank Security & Cash Handling -6 13 145
Business Area Secure Storage 6 2 19
Business Area Global Services 21 22 101
Business Area Entrance Control -1 0 14
Business Area Developing Businesses -10 -13 -43
Central items -9 -14 -57
Operating profit, including non-recurring items 1 10 179
Jan-March
Jan-March

5
The market for bank security and cash handling Globally, the amount of cash in circulation is continuing to increase. In parts of the
world central banks have gradually begun to change their roles and strategies
regarding cash handling.This entails an altered situation for retail banks, which in
turn generally prefer cash handling to take place in shops.
This shift is placing greater demands on cost-effective solutions, where concepts
for self-service and outsourcing of cash handling are becoming increasingly
common, which in turn drives developments on the CIT market.
The global market for bank security and cash handling is continuing to develop
positively. Gunnebo has strong positions on some of the world’s fastest growing
markets such as India, Indonesia and Brazil.
Development first quarter 2013 Market development in Europe has been weak during the first quarter.
Development on markets in the Middle-East has been more stable.
The markets in Asia have started the year with continued good growth.
Development of the sales company in Malaysia, established in 2012, has been
very good, China recorded a good start to the year and the growth in India is
continuing.
Also development in the Americas region has been good during the first quarter of
the year. The company in Brazil is continuing to grow its business and the
acquired business in the US has developed well.
Since a high proportion of the business area’s business is project based, the order
intake varies from quarter to quarter.
Profit analysis Strong profit development in the Asia-Pacific and Americas regions has not
compensated for weak development in Europe.
QUARTER IN BRIEF
The French post office, La Poste, increases security in its cash handling and installs deposit safes with electronic locks
A British customer has asked Gunnebo to supply and install a new vault for the storage of precious metals
Gunnebo makes significant gains in the Indian bank market, predominantly in non-metro areas though co-operation with Channel Partners
GUNNEBO’S OFFERING
Bank Security & Cash Handling
primarily targets central banks, banks,
retail and cash-in-transit (CIT)
companies.
Gunnebo provides solutions that
increase efficiency and security within
physical security, cash handling and
electronic security.
Business Area Bank Security & Cash HandlingFull year
MSEK 2013 2012 2012
Order intake 580 632 2,374
Net sales 516 494 2,386
Operating profit/loss excl. non-recurring items 1 13 158
Operating margin excl. non-recurring items, % 0.2 2.6 6.6
Non-recurring items -7 - -13
Operating profit/loss -6 13 145
Jan-March
% of Group sales: 45%
Order intake for the first quarter amounted to MSEK 580 (632), organically it
decreased by 17%. Net sales for the period increased to MSEK 516 (494),
organically they decreased by 6%. Operating profit for the quarter excluding items of
a non-recurring nature amounted to MSEK 1 (13) and the operating margin to 0.2%
(2.6%).

6
The market for secure storage Business within Secure Storage is driven largely by increased awareness about
the importance of protecting valuables against fire and theft. Through the two
global brands Chubbsafes and Fichet-Bauche, Gunnebo has a strong global
market position in the segment that places high demands on quality and requires
product certification. Furthermore, Gunnebo has a number of very strong local
brands such as Rosengrens in Northern Europe, Steelage in India and Hamilton
Safe in the US.
In recent years Gunnebo has developed the business within secure storage
through finding new routes to market. The strategy has increased the proportion of
the business area’s sales done through a global network of dealers and
distributors.
Development first quarter 2013 The markets in the Asia-Pacific region have developed well, especially Indonesia.
Order intake for safes for global manufacturers of ATMs, as well as business on
the African continent, also showed strong development during the quarter.
The markets in Europe recorded weaker development.
Profit analysis The improved operating profit can be explained by a decrease in fixed costs.
QUARTER IN BRIEF
Good order intake and delivery of ATM enclosures from several global ATM manufacturers
Strong development of distributor-based sales in Asia, especially in Indonesia
Order received from a private safe deposit company in Malaysia for the automated safe deposit locker solution, SafeStore Auto
Freeport, a Swiss-based storage provider, increases security and installs high-graded vault doors in Luxembourg
GUNNEBO’S OFFERING
Safes and cabinets, fire-resistant and
burglar-resistant safes, mechanical and
electronic locks, modular vaults and
ATM enclosures.
.
Business Area Secure StorageFull year
MSEK 2013 2012 2012
Order intake 190 196 801
Net sales 179 178 781
Operating profit/loss excl. non-recurring items 7 2 30
Operating margin excl. non-recurring items, % 3.9 1.1 3.8
Non-recurring items -1 - -11
Operating profit/loss 6 2 19
Jan-March % of Group sales:16%
Order intake for the first quarter amounted to MSEK 190 (196), organically it rose by
2%. Net sales for the period were unchanged at MSEK 179 (178), organically they
increased by 6%. Operating profit for the quarter excluding items of a non-recurring
nature amounted to MSEK 7 (2) and the operating margin to 3.9% (1.1%).

7
The market for services With a comprehensive portfolio of services within Lifecycle Care and Business
Care, Global Services not only provides unmatched global technical expertise, but
also an extensive spare parts network as well as services related to design,
consultation, monitoring, training and management of the customer’s business
processes.
Development first quarter 2013 Order intake on the markets in Northern and Southern Europe recorded stable
development during the quarter, while France and Central Europe showed weaker
development. Due to a weak economy we see increased competition and a trend
where customers reduce the scope of their maintenance contracts in particular.
The service markets in the Americas had a good start to the year, and in Brazil
order intake for services doubled.
The proportion of sales of services linked to contracts, as well as demand for
retrofitting, is continuing to increase, which is positive for Gunnebo.
Profit analysis Operating profit and margin showed stable development, despite a weak market in
parts of Europe.
QUARTER IN BRIEF
Australian Bank, Westpac, turns to Gunnebo to complete upgrades to rising security screens installed at cashier points across selected locations
Banco de Sabadell in Spain engages Gunnebo for alarm monitoring
Cosmetics company Avon in the UK signs an agreement for entrance control services
Belgian KBC bank re-appoints Gunnebo for the installation and service of physical and mecha-tronic security in its branch network
GUNNEBO’S OFFERING
Within Global Services, Gunnebo
provides a complete offering that helps
customers obtain the best possible
return from their investment in products
and solutions throughout their lifecycle.
Lifecycle Care represents a portfolio of
product-related security services linked
to design, implementation, maintenance
and development.
Business Care represents security-
related services linked to the customer’s business processes such as outsourcing, consultancy services and software adaptation.
Business Area Global ServicesFull year
MSEK 2013 2012 2012
Order intake 477 511 1,138
Net sales 268 287 1,143
Operating profit/loss excl. non-recurring items 22 22 110
Operating margin excl. non-recurring items, % 8.2 7.7 9.6
Non-recurring items -1 - -9
Operating profit/loss 21 22 101
Jan-March
% of Group sales: 23%
Order intake for the first quarter amounted to MSEK 477 (511), organically it
decreased by 2%. Net sales for the same period amounted to MSEK 268 (287),
organically they fell by 2%. Operating profit for the quarter, excluding items of a
non-recurring nature, amounted to MSEK 22 (22) and the operating margin to
8.2% (7.7%).

8
The market for entrance control One of the most important driving forces for the entrance control market is stricter
demands on having constant control over who is where in a building. The
increasing population in cities is also increasing the need to be able to efficiently
regulate and control passenger flows in mass transit and visitor flows at sports
arenas, exhibition centres and other venues that host public events.
Many customers also want to be able to link together separate systems for
entrance and ticket control.
Development first quarter 2013 The business area’s order intake showed stable development during the first
quarter. The markets in Europe had somewhat weaker development compared to
the same period last year. This development has been compensated for by the
sales companies in China and the US, where a number of larger orders have been
recorded. The Canadian operation also showed a good order intake.
Since a high proportion of the business area’s business is project based, the order
intake varies from quarter to quarter.
Profit analysis Operating profit and operating margin were in line with last year.
QUARTER IN BRIEF
Chinese Nanjing Metro appoints Gunnebo to supply solutions for entrance control.
In India the expansion of metro systems in some of the country’s largest cities has regained momentum. Gunnebo is to deliver solutions for entrance control to Chennai metro.
Bus company Mexibus Mexico BRT installs entrance control in its country-wide network of bus stations.
Lisbon airport increases security and installs Gunnebo Speed-Stiles to control the flow of passengers.
GUNNEBO’S OFFERING
A complete offering of effective solutions for access and entrance control, system solutions for mass transit and solutions for airports such as anti-return gates, boarding gates and immigration gates. In India and Indonesia, Gunnebo also offers a complete range of fire safety systems.
Business Area Entrance ControlFull year
MSEK 2013 2012 2012
Order intake 161 158 674
Net sales 131 147 663
Operating profit/loss excl. non-recurring items 0 0 47
Operating margin excl. non-recurring items, % 0.0 0.0 7.1
Non-recurring items -1 - -33
Operating profit/loss -1 0 14
Jan-March
% of Group sales: 11%
Order intake for the first quarter increased to MSEK 161 (158), organically it
increased by 8%. Net sales for the same period totalled MSEK 131 (147), organically
they decreased by 4%. Operating profit for the first quarter excluding items of a non-
recurring nature amounted to MSEK 0 (0) and the operating margin to 0.0% (0.0%).

9
SafePay
In general, the retail sector in Europe is
characterised by caution in investment. Despite this,
net sales for the first quarter were in line with last
year. With lower costs and a good quality on new
systems we see an improvement in the results for
the first quarter.
Gateway We see a slower market for electronic article
surveillance in retail. With temporary increased
costs during the quarter, we see a slightly lower
level of profitability for the business.
Developing BusinessesFull year
MSEK 2013 2012 2012
Order intake 91 98 263
Net sales 61 63 263
Operating profit/loss excl. non-recurring items -10 -13 -42
Operating margin excl. non-recurring items, % -16.4 -20.6 -16.0
Non-recurring items 0 - -1
Operating profit/loss -10 -13 -43
Jan-March
SAFEPAY
Full year
MSEK 2013 2012 2012
Order intake 70 77 169
Net sales 40 41 167
Operating profit/loss excl.
non-recurring items -7 -12 -35
Operating margin excl.
non-recurring items, % -17.5 -29.3 -21.0
Non-recurring items 0 - -1
Operating profit/loss -7 -12 -36
Jan-March
GATEWAY
Full year
MSEK 2013 2012 2012
Order intake 21 21 94
Net sales 21 22 96
Operating profit/loss excl.
non-recurring items -3 -1 -7
Operating margin excl.
non-recurring items, % -14.3 -4.5 -7.3
Non-recurring items - - -
Operating profit/loss -3 -1 -7
Jan-March
Andel av Koncernens
omsättning: 5% % of Group sales: 5%
Order intake for the first quarter amounted to MSEK 91 (98), organically it
decreased by 4%. Net sales for the same period totalled MSEK 61 (63), organically
they decreased by 3%. Operating profit/loss for the quarter excluding items of a
non-recurring nature amounted to MSEK -10 (-13) and the operating margin to
-16.4% (-20.6%).

10
JANUARY-MARCH 2013
Order intake and net sales The Group’s order intake during the first quarter of 2013 amounted to MSEK 1,499 (1,595). Acquired units
contributed MSEK 95. Organically order intake decreased by 7%.
The order intake in Europe was lower than last year, and organically order intake fell by 12%. In Southern
Europe the decrease was a moderate 2% and the market was still weak as a result of the financial crisis
and recession. Weaker development was noted in France where order intake fell by 19%. This decrease
can partly be attributed to a major order from the French post office received in the first quarter of 2012,
and partly to weakening demand. Improvements were noted in the UK and Germany, while the majority of
other markets in Europe showed an unchanged or negative order intake. The weak development in
Europe was offset by the acquired unit in the US, and by continued good order volumes in Asia, Brazil and
the Middle East.
Net sales amounted to MSEK 1,155 (1,169), of which acquired units accounted for MSEK 84. Organically
net sales decreased by 3%.
The positive development continued in the Asia-Pacific region and sales increased by 17%. The highest
growth was noted in India where the improvement amounted to 38%. The positive development from the
previous quarter strengthened in Brazil and sales increased by 35%. In Europe demand was weak on most
markets and organically sales fell by 10%.
Financial results Operating profit for the first quarter, which is Gunnebo’s weakest quarter seasonally, amounted to
MSEK 1 (10) and the operating margin to 0.1% (0.8%). Acquired units contributed MSEK 10 to
operating profit. Currency effects had a negative impact on profit of MSEK 4.
Restructuring costs, along with certain other expenses of a non-recurring nature, burdened the result by
MSEK 10 (4). The majority of these costs can be attributed to staff cuts and other structural measures in
the Group’s European sales companies, particularly in the Bank Security & Cash Handling business area.
Adjusted for such expenses of a non-recurring nature, operating profit amounted to MSEK 11 (14) and the
operating margin to 0.9% (1.2%).
The weak demand in Europe is estimated to have reduced sales during the period by MSEK 32. Growth in
the Asia-Pacific and Americas regions had a mitigating effect but could not fully offset the downturn in
Europe. Altogether profit decreased by MSEK 23 due to lower sales and production volumes. Other
factors, such as price development and capacity adaptations had a positive effect on profit of MSEK 15.
Net financial items fell to MSEK -9 (-4) due to higher borrowing. Group profit after financial items amounted
to MSEK -8 (6). Net profit for the period totalled MSEK -12 (-3), and earnings per share attributable to the
parent company’s shareholders were SEK -0.16 (-0.04) per share.
Capital expenditure and depreciation Investments made in intangible assets and in property, plant and equipment during the period totalled
MSEK 23 (20). Depreciation amounted to MSEK 21 (21).
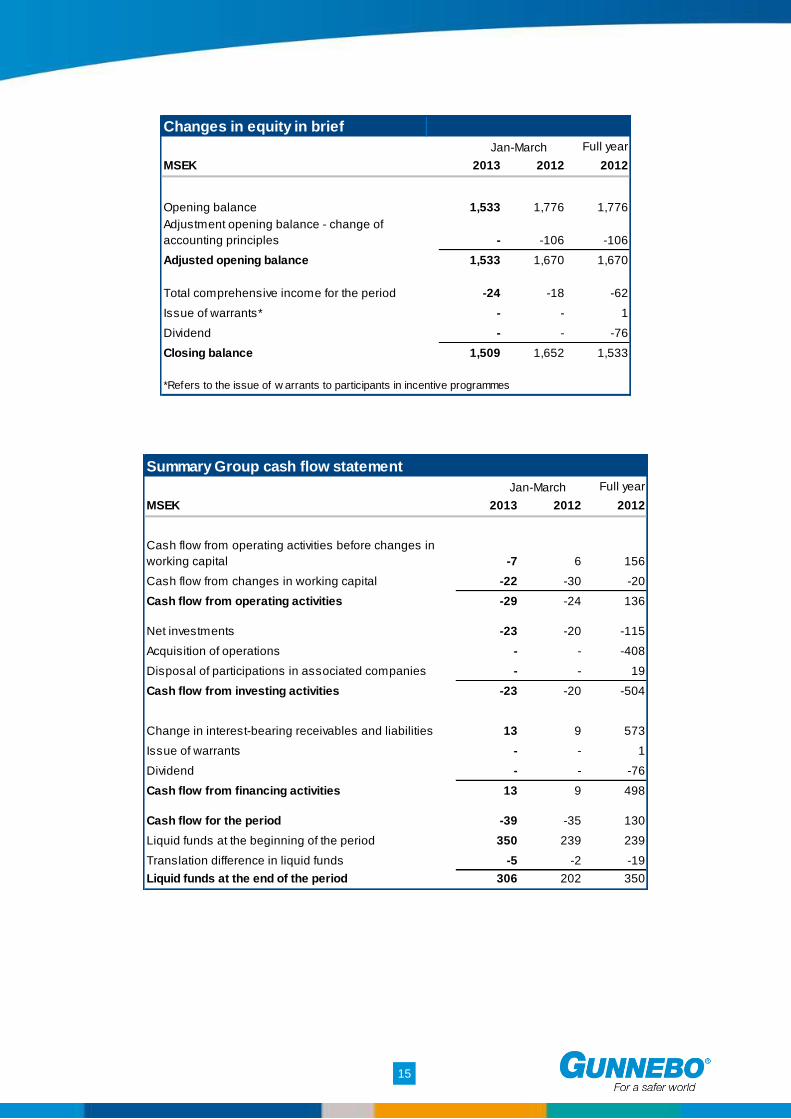
Cash flow Cash flow from operating activities amounted to MSEK -29 (-24). Payments related to restructuring
measures burdened cash flow for the year by MSEK 17 (10) and an increase in working capital tied up had
a negative impact of MSEK 22 (30).
Cash flow from operating activities and investing activities amounted to MSEK -52 (-44). The operating
cash flow after deductions for capital expenditure but before net financial items affecting cash flow and
paid tax amounted to MSEK -29 (-32).

11
Liquidity and financial position The Group’s liquid funds at the end of the period amounted to MSEK 306 (350 at the beginning of the
year). Equity amounted to MSEK 1,509 (1,533 at the beginning of the year) and the equity ratio to 36%
(36% at the beginning of the year).
The decrease in equity can primarily be attributed to net profit for the period which burdened equity with
MSEK 12 and other comprehensive income comprising actuarial gains and losses, translation differences,
hedging of net investments abroad, cash flow hedges and income tax related to these components, which
reduced equity by MSEK 12.
Net debt amounted to MSEK 1,055 (1,026 at the beginning of the year). The debt/equity ratio totalled 0.7
(0.7 at the beginning of the year). Net debt excluding pension commitments amounted to MSEK 706 (684
at the beginning of the year).
The Group’s guaranteed credit framework on March 31, 2013 amounted to MSEK 1,421 and ensures
financing is available on unchanged terms until the end of June 2015. The Group’s total credit framework,
including non-guaranteed facilities, totalled MSEK 1,722.
Parent company The Group’s parent company, Gunnebo AB, is a holding company which has the main task of owning and
managing shares in other Group companies, as well as providing Group-wide services. Net sales for the
period January-March amounted to MSEK 21 (12), of which MSEK 0 (1) related to sales to external
customers. Net profit/loss for the period amounted to MSEK -6 (-6).
Employees The number of employees at the end of the period was 5,678 (5,673 at the beginning of the year). The
number of employees outside of Sweden at the end of the period was 5,495 (5,476 at the beginning of the
year).
Share data Earnings per share after dilution were SEK -0.16 (-0.04). The number of shareholders totalled 10,500
(10,200).
Transactions with related parties There have been no transactions with related parties during the period that affect Gunnebo’s position and
result to any significant extent.
Events after the closing day No significant events occurred after the closing day.
Accounting principles Gunnebo complies with the International Financial Reporting Standards adopted by the EU, and the official
interpretations of these standards (IFRIC). The Interim Report for the Group has been prepared in
accordance with the Annual Accounts Act and IAS 34 Interim Financial Reporting, and the Interim Report
for the parent company has been prepared in accordance with the Annual Accounts Act and the
recommendation of the Swedish Financial Reporting Board, RFR 2 Accounting for Legal Entities. The
same accounting principles and methods of calculation have been used as in the latest annual report, with
the exception of the new and amended accounting principles below.
New and amended accounting principles
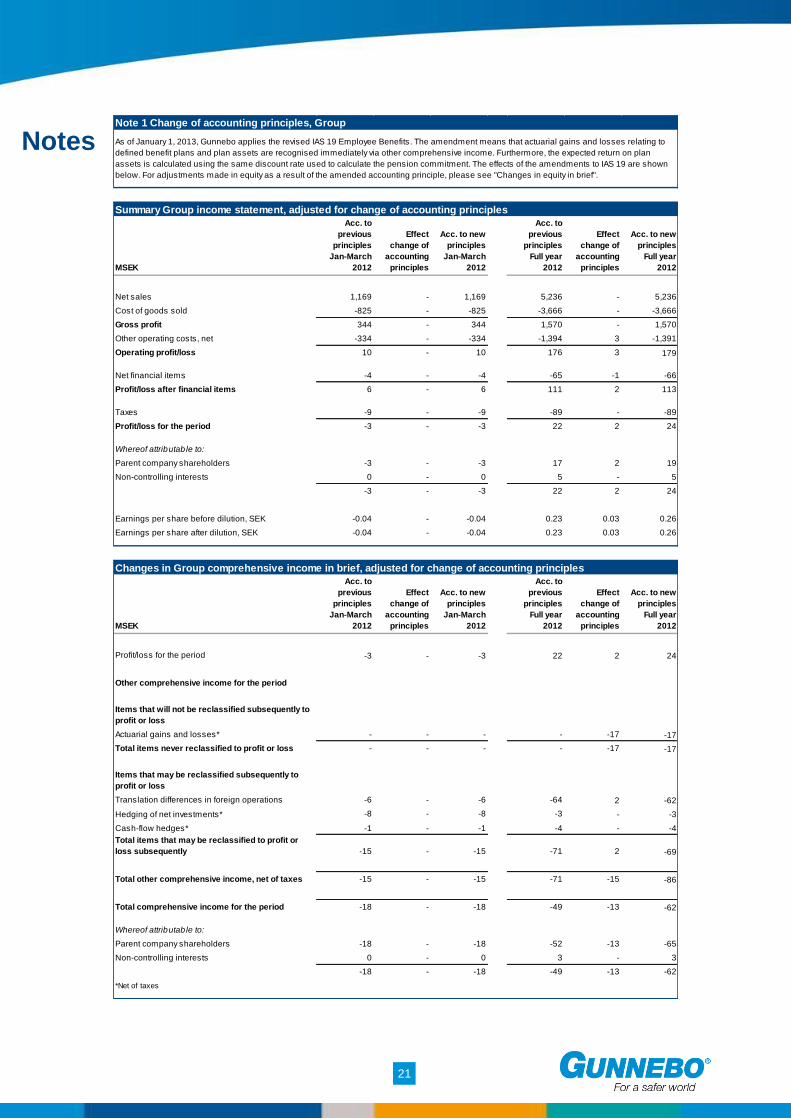
The amended IAS 19 Employee Benefits are applied from January 1, 2013. The amendment means that
actuarial gains and losses are recognised immediately via other comprehensive income, and that the
‘corridor approach’ previously applied by Gunnebo is removed. Furthermore, the expected return on plan
assets is calculated using the same discount rate used to calculate the pension commitment. The
amendments to IAS 19 have resulted in an increase in the pension liability recognised in the balance sheet
on December 31, 2012 of approximately MSEK 150 and a decrease in equity of approximately MSEK 119.

12
Furthermore, the amendments to IAS 19 means that profit after tax and other comprehensive income for
the comparison year 2012 increases by MSEK 2 and decreases by MSEK 15 respectively.
IFRS 13 Fair Value Measurement is applied from January 1, 2013. The standard has not had any effect on
the Group's profit or financial position but entails an increased disclosure requirement regarding financial
instruments. The same applies for an amendment to IFRS 7 Financial Instruments: Disclosures, which
entails an increased disclosure requirement for net accounting of financial assets and liabilities in the
balance sheet. The increased disclosure requirement for financial instruments is presented in this report in
Note 3 and Note 4.
The parent company has changed accounting principle regarding Group contributions as a result of an
amendment to the Swedish Financial Reporting Board’s RFR 2 which shall apply to financial years
beginning January 1, 2013. As a result of the new rules, a Group contribution received by the parent
company from a subsidiary is to be recognised as financial income. Group contributions paid by the parent
company to subsidiaries are recognised as an increase in the carrying amount of the participations in the
receiving subsidiaries. The Swedish Financial Reporting Board has also introduced an alternative rule
which means Group contributions both received and paid may be recognised as an appropriation.
Gunnebo has decided to apply the latter exception which means that Group contributions received and
paid, which were previously recognised as financial income or financial expense respectively, are
recognised as appropriations. The change in principle has not entailed a change in the parent company’s
net profit because Group contributions were also recognised in the income statement as financial income
or expense under the former principle.
Refer to Note 1 and Note 2 for information on how recognised comparison periods have been recalculated
in this report in accordance with the amended accounting principles.
Significant risks and uncertainties The Group’s and parent company’s significant risks and uncertainties include operational risks in the form
of raw material risks, product risks, insurance risks and legal risks. In addition there are for example
financial risks such as financing risks, liquidity risks, interest rate risks and currency risks, as well as credit
and counterparty risks. The Group’s risk management is described in more detail on pages 88-91 of
Gunnebo’s 2012 Annual Report, and in Note 3. Gunnebo considers this risk description to still be correct.
Financial goals
The Group shall earn a long-term return on capital employed of at least 15% and an operating margin
of at least 7%.
The equity ratio shall not fall below 30%.
The Group shall achieve organic growth of at least 5%.
This report has not been reviewed by the company’s auditors.
Gothenburg, April 25, 2013
Per Borgvall
President and CEO

13
The Group
Full year
MSEK 2013 2012 2012
Net sales 1,155 1,169 5,236
Cost of goods sold -827 -825 -3,666
Gross profit 328 344 1,570
Other operating costs, net -327 -334 -1,391
Operating profit/loss 1 10 179
Net financial items -9 -4 -66
Profit/loss after financial items -8 6 113
Taxes -4 -9 -89
Profit/loss for the period -12 -3 24
Whereof attributab le to:
Parent company shareholders -12 -3 19
Non-controlling interests 0 0 5
-12 -3 24
Earnings per share before dilution, SEK -0.16 -0.04 0.26
Earnings per share after dilution, SEK -0.16 -0.04 0.26
Summary Group income statement
Jan-March

14
Full year
MSEK 2013 2012 2012
Profit/loss for the period -12 -3 24
Other comprehensive income for the period
Items that will not be reclassified subsequently to
profit or loss
Actuarial gains and losses* - - -17
Total items that will not be reclassified to profit or
loss subsequently - - -17
Items that may be reclassified subsequently to profit
or loss
Translation differences in foreign operations -8 -6 -62
Hedging of net investments* -5 -8 -3
Cash-flow hedges* 1 -1 -4
Total items that may be reclassified to profit or loss
subsequently -12 -15 -69
Total other comprehensive income, net of taxes -12 -15 -86
Total comprehensive income for the period -24 -18 -62
Whereof attributable to:
Parent company shareholders -24 -18 -65
Non-controlling interests 0 0 3
-24 -18 -62
*Net of taxes
Jan-March
Changes in comprehensive income in brief
31 Dec 1 Jan
MSEK 2013 2012 2012 2012
Goodwill 1,294 1,091 1,320 1,104
Other intangible assets 178 107 182 111
Property, plant and equipment 321 314 327 316
Financial assets 57 125 60 139
Deferred tax assets 265 282 263 278
Inventories 607 619 580 564
Current receivables 1,111 1,140 1,201 1,239
Liquid funds 306 202 350 239
Total assets 4,139 3,880 4,283 3,990
Equity 1,509 1,652 1,533 1,670
Long-term liabilities 1,156 852 1,428 931
Current liabilities 1,474 1,376 1,322 1,389
Total equity and liabilities 4,139 3,880 4,283 3,990
Summary Group balance sheet
31 March
15
Changes in equity in brief
Full year
MSEK 2013 2012 2012
Opening balance 1,533 1,776 1,776
Adjustment opening balance - change of
accounting principles - -106 -106
Adjusted opening balance 1,533 1,670 1,670
Total comprehensive income for the period -24 -18 -62
Issue of warrants* - - 1
Dividend - - -76
Closing balance 1,509 1,652 1,533
Jan-March
*Refers to the issue of w arrants to participants in incentive programmes
Full year
MSEK 2013 2012 2012
Cash flow from operating activities before changes in
working capital -7 6 156
Cash flow from changes in working capital -22 -30 -20
Cash flow from operating activities -29 -24 136
Net investments -23 -20 -115
Acquisition of operations - - -408
Disposal of participations in associated companies - - 19
Cash flow from investing activities -23 -20 -504
Change in interest-bearing receivables and liabilities 13 9 573
Issue of warrants - - 1
Dividend - - -76
Cash flow from financing activities 13 9 498
Cash flow for the period -39 -35 130
Liquid funds at the beginning of the period 350 239 239
Translation difference in liquid funds -5 -2 -19
Liquid funds at the end of the period 306 202 350
Jan-March
Summary Group cash flow statement

16
Full year
MSEK 2013 2012 2012
Cash flow from operating activities -29 -24 136
Reversal of paid tax and net financial items affecting
cash flow 23 12 91
Net investments -23 -20 -115
Operating cash flow -29 -32 112
Summary Group operating cash flow statement
Jan-March
Full year
MSEK 2013 2012 2012
Operating profit/loss Bank Security & Cash Handling -6 13 145
Operating profit/loss Secure Storage 6 2 19
Operating profit/loss Global Services 21 22 101
Operating profit/loss Entrance Control -1 0 14
Operating profit/loss Developing Businesses -10 -13 -43
Central items -9 -14 -57
Operating profit/loss 1 10 179
Net financial items -9 -4 -66
Profit/loss after financial items -8 6 113
Jan-March
Reconciliation to profit/loss after financial items
Sales by market
Full Year
2013 2012 2012
France 21% 23% 22%
India 8% 7% 6%
USA 8% 1% 4%
UK 5% 6% 6%
Hungary 5% 4% 5%
Germany 4% 5% 5%
Spain 4% 5% 5%
Canada 4% 4% 5%
Sweden 4% 3% 3%
Denmark 4% 3% 3%
Others 33% 39% 36%
Total 100% 100% 100%
Jan-March

17
Parent Company
Full year
MSEK 2013 2012 2012
Net sales 21 12 137
Administrative expenses -24 -32 -135
Operating profit/loss -3 -20 2
Net financial items -3 -142 -151
Profit/loss after financial items -6 -162 -149
Appropriations - - 67
Taxes - 156 127
Profit/loss for the period -6 -6 45
Full year
MSEK 2013 2012 2012
Profit/loss for the period -6 -6 45
Other comprehensive income, net after tax - - -
Total comprehensive income for the period -6 -6 45
Summary parent company income statement
Changes in comprehensive income in brief
Jan-March
Jan-March

18
31 Dec
MSEK 2013 2012 2012
Other intangible assets 8 11 8
Property, plant and equipment 3 4 3
Financial assets 1,693 1,686 1,693
Current receivables 24 841 67
Liquid funds 0 0 1
Total assets 1,728 2,542 1,772
Equity 1,550 1,580 1,556
Current liabilities 178 962 216
Total equity and liabilities 1,728 2,542 1,772
Full year
MSEK 2013 2012 2012
Opening balance 1,556 1,586 1,586
Total comprehensive income for the period -6 -6 45
Issue of warrants* - - 1
Dividend - - -76
Closing balance 1,550 1,580 1,556
Summary parent company balance sheet
Changes in equity in brief
*Refers to the issue of w arrants to participants in incentive programmes
31 March
Jan-March

19
Key ratios for the Group
Key ratios
Full year
2013 2012 2012
Gross margin, % 28.4 29.4 30.0
Operating margin before depreciation (EBITDA) excl.
non-recurring items, % 3.0 3.0 6.9
Operating margin before depreciation (EBITDA), % 2.1 2.6 5.2
Operating margin (EBIT) excl. non-recurring items, % 0.9 1.2 5.1
Operating margin (EBIT), % 0.1 0.8 3.4
Profit margin (EBT), % -0.7 0.5 2.2
Return on capital employed, %1) 2)
6.5 13.1 7.0
Return on equity, %1) 2)
1.0 15.0 1.5
Capital turnover rate, times2)
1.8 2.2 1.9
Equity ratio, % 36 43 36
Interest coverage ratio, times2)
0.1 2.3 5.4
Debt/equity ratio, times 0.7 0.4 0.7
1) During the last tw elve-month period
Jan-March
2) The figures relate to continuing and discontinued operations
Full year
2013 2012 2012
Earnings per share before dilution, SEK -0.16 -0.04 0.26
Earnings per share after dilution, SEK -0.16 -0.04 0.26
Equity per share, SEK 19.70 21.62 20.02
Cash flow per share, SEK -0.38 -0.32 1.80
No. of shares at end of period, thousands 75,856 75,856 75,856
Average no. of shares, thousands 75,856 75,856 75,856
Jan-March
Data per share

20
2013
Income statement 1 2 3 4 1 2 3 4 1
Net sales 1,132 1,266 1,247 1,492 1,169 1,270 1,280 1,517 1,155
Costs of goods sold -815 -856 -875 -1,026 -825 -889 -900 -1,052 -827
Gross profit 317 410 372 466 344 381 380 465 328
Other operating costs, net -294 -336 -311 -300 -334 -339 -363 -355 -327
Operating profit/loss 23 74 61 166 10 42 17 110 1
Net financial items -6 -8 -5 -7 -4 -4 -6 -52 -9
Profit/loss after financial
items 17 66 56 159 6 38 11 58 -8
Taxes -5 -27 -17 -3 -9 -14 -10 -56 -4
Profit/loss for the period from
continuing operations 12 39 39 156 -3 24 1 2 -12
Profit/loss for the period from
discontinued operations -19 1 5 -3 - - - - -
Profit/loss for the period -7 40 44 153 -3 24 1 2 -12
Key ratios
Gross margin, % 28.0 32.4 29.8 31.2 29.4 30.0 29.7 30.7 28.4
Operating margin, % 2.0 5.8 4.9 11.1 0.8 3.3 1.3 7.3 0.1
Operating profit (EBIT) excl. non-
recurring items, MSEK 23 82 74 138 14 50 63 139 11
Operating profit (EBIT) excl. non-
recurring items, % 2.0 6.5 5.9 9.2 1.2 3.9 4.9 9.2 0.9
Earnings per share, SEK 1)
-0.09 0.53 0.58 1.98 -0.04 0.32 -0.02 -0.04 -0.16
20112)
2012
1) Before and after dilution
Quarterly data, MSEK
2) The figures for 2011 have not been restated due to the implementation of the revised standard IAS19 Employee
Benefits
21
MSEK
Acc. to
previous
principles
Jan-March
2012
Effect
change of
accounting
principles
Acc. to new
principles
Jan-March
2012
Acc. to
previous
principles
Full year
2012
Effect
change of
accounting
principles
Acc. to new
principles
Full year
2012
Net sales 1,169 - 1,169 5,236 - 5,236
Cost of goods sold -825 - -825 -3,666 - -3,666
Gross profit 344 - 344 1,570 - 1,570
Other operating costs, net -334 - -334 -1,394 3 -1,391
Operating profit/loss 10 - 10 176 3 179
Net financial items -4 - -4 -65 -1 -66
Profit/loss after financial items 6 - 6 111 2 113
Taxes -9 - -9 -89 - -89
Profit/loss for the period -3 - -3 22 2 24
Whereof attributable to:
Parent company shareholders -3 - -3 17 2 19
Non-controlling interests 0 - 0 5 - 5
-3 - -3 22 2 24
Earnings per share before dilution, SEK -0.04 - -0.04 0.23 0.03 0.26
Earnings per share after dilution, SEK -0.04 - -0.04 0.23 0.03 0.26
MSEK
Acc. to
previous
principles
Jan-March
2012
Effect
change of
accounting
principles
Acc. to new
principles
Jan-March
2012
Acc. to
previous
principles
Full year
2012
Effect
change of
accounting
principles
Acc. to new
principles
Full year
2012
Profit/loss for the period -3 - -3 22 2 24
Other comprehensive income for the period
Items that will not be reclassified subsequently to
profit or loss
Actuarial gains and losses* - - - - -17 -17
Total items never reclassified to profit or loss - - - - -17 -17
Items that may be reclassified subsequently to
profit or loss
Translation differences in foreign operations -6 - -6 -64 2 -62
Hedging of net investments* -8 - -8 -3 - -3
Cash-flow hedges* -1 - -1 -4 - -4
Total items that may be reclassified to profit or
loss subsequently -15 - -15 -71 2 -69
Total other comprehensive income, net of taxes -15 - -15 -71 -15 -86
Total comprehensive income for the period -18 - -18 -49 -13 -62
Whereof attributable to:
Parent company shareholders -18 - -18 -52 -13 -65
Non-controlling interests 0 - 0 3 - 3
-18 - -18 -49 -13 -62
*Net of taxes
Note 1 Change of accounting principles, Group
As of January 1, 2013, Gunnebo applies the revised IAS 19 Employee Benefits. The amendment means that actuarial gains and losses relating to
defined benefit plans and plan assets are recognised immediately via other comprehensive income. Furthermore, the expected return on plan
assets is calculated using the same discount rate used to calculate the pension commitment. The effects of the amendments to IAS 19 are shown
below. For adjustments made in equity as a result of the amended accounting principle, please see "Changes in equity in brief".
Summary Group income statement, adjusted for change of accounting principles
Changes in Group comprehensive income in brief, adjusted for change of accounting principles
Notes

22
MSEK
Acc. to
previous
principles
Jan-March
2012
Effect
change of
accounting
principles
Acc. to new
principles
Jan-March
2012
Acc. to
previous
principles
Full year
2012
Effect
change of
accounting
principles
Acc. to new
principles
Full year
2012
Goodwill 1,104 - 1,104 1,320 - 1,320
Other intangible assets 111 - 111 182 - 182
Property, plant and equipment 316 - 316 327 - 327
Financial assets 139 - 139 60 - 60
Deferred tax assets 253 25 278 232 31 263
Inventories 564 - 564 580 - 580
Current receivables 1,239 - 1,239 1,201 - 1,201
Liquid funds 239 - 239 350 - 350
Total assets 3,965 25 3,990 4,252 31 4,283
Equity 1,776 -106 1,670 1,652 -119 1,533
Long-term liabilities 800 131 931 1,278 150 1,428
Current liabilities 1,389 - 1,389 1,322 - 1,322
Total equity and liabilities 3,965 25 3,990 4,252 31 4,283
MSEK
Acc. to
previous
principles
Jan-March
2012
Effect
change of
accounting
principles
Acc. to new
principles
Jan-March
2012
Acc. to
previous
principles
Full year
2012
Effect
change of
accounting
principles
Acc. to new
principles
Full year
2012
Cash flow from operating activities before changes
in working capital 6 - 6 156 - 156
Cash flow from changes in working capital -30 - -30 -20 - -20
Cash flow from operating activities -24 - -24 136 - 136
Net investments -20 - -20 -115 - -115
Acquisition of operations - - - -408 - -408
Disposal of participations in associated companies - - - 19 - 19
Cash flow from investing activities -20 - -20 -504 - -504
Change in interest-bearing receivables and
liabilities 9 - 9 573 - 573
Issue of warrants - - - 1 - 1
Dividend - - - -76 - -76
Cash flow from financing activities 9 - 9 498 - 498
Cash flow for the period -35 - -35 130 - 130
Liquid funds at the beginning of the period 239 - 239 239 - 239
Translation difference in liquid funds -2 - -2 -19 - -19
Liquid funds at the end of the period 202 - 202 350 - 350
Note 1 Change of accounting principles, Group cont.
Summary Group balance sheet, adjusted for change of accounting principles
Summary Group cash flow statement, adjusted for change of accounting principles

23
MSEK
Acc. to
previous
principles
Jan-March
2012
Effect
change of
accounting
principles
Acc. to new
principles
Jan-March
2012
Acc. to
previous
principles
Full year
2012
Effect
change of
accounting
principles
Acc. to new
principles
Full year
2012
Net sales 12 - 12 137 - 137
Administrative expenses -32 - -32 -135 - -135
Operating profit/loss -20 - -20 2 - 2
Net financial items -142 - -142 -84 -67 -151
Profit/loss after financial items -162 - -162 -82 -67 -149
Appropriations - - - - 67 67
Taxes 156 - 156 127 - 127
Profit/loss for the period -6 - -6 45 0 45
Note 2 Change of accounting principles, Parent company
As a result of an amendment to RFR 2, the parent company has changed accounting principle regarding group contributions. Group contributions received and
paid are now recognised as appropriations whereas they were previously recognised as financial income/expenses. See below for information on how
recognised periods have been restated in this report in accordance with the amended accounting principle below.
Summary parent company income statement, adjusted for change of accounting principles
The net result has not changed as a result of the change in accounting principles since group contributions according to previous principle were recognised as
financial income/expense in the income statement.

24
Derivatives
MSEK
31 March
2013
31 Dec
2012
Financial assets measured at fair value
- derivatives for which hedge accounting does not apply 7 11
7 11
Financial liabilities measured at fair value
- derivatives for which hedge accounting does not apply 0 4
- interest-swap agreements for which hedge accounting of cash flows applies 6 8
6 12
Borrowing
MSEK
31 March
2013
31 Dec
2012
Long-term borrowing 743 1,021
Short-term borrowing 316 61
1,059 1,082
Other financial assets and liab ilities
Note 3 Financial assets and liabilities measured at fair value
Measurement techniques
In IFRS 13, financial instruments are classified in a hierarchy of three levels, based on the information used
to establish their fair value. Level 1 refers to fair values based on quoted prices on an active market for
similar financial assets and liabilities. Level 2 refers to fair values established based on directly observable
market inputs other than Level 1 inputs. Level 3 refers to fair values based on valuation models with inputs
based on non-observable market data.
The Group possesses Level 2 derivatives for hedging purposes in the form of currency forwards and
interest-rate swap agreements. Measurement at fair value for the currency forwards is based on published
forward rates on an active market. Measurement of interest-rate swap agreements is based on forward
interest rates produced from observable yield curves.
Fair value hierarchy
The fair value of derivative instruments has been established using measurement techniques based on
observable market data. According to the fair value hierarchy, such measurement methods are referred to
as Level 2. As the Group only possesses financial instruments measured at fair value in accordance with
measurement methods belonging to this level, there have been no transfers between the different
measurement categories. The table below outlines the assets and liabilities measured at fair value.
Financial assets and liabilities measured at fair value
The Group´s borrowing primarily relates to long-term credit facilities but with short fixed interest rate periods.
The fair value is therefore deemed to be the same as the carrying value. The tabIe below presents the fair
value on the Group´s borrowing.
Fair value on borrowing
For financial instruments such as accounts receivable, accounts payable and other non-interest-bearing
financial assets and liabilities, which are recognised at accrued cost less any write-down, the fair value is
deemed to be the same as the carrying amount due to the short anticipated duration.

25
MSEK Assets Liabilities Net
Borrowing - -1,059 -1,059
Currency derivatives 7 0 7
Interest-rate swap agreements - -6 -6
Total 7 -1,065 -1,058
Note 4 Net accounting of financial assets and liabilities
See below for gross accounting of the Group´s borrowing and derivatives at balance sheet date.
The Group has entered into general agreements (ISDAs) with all of its counterparties regarding borrowing
and transactions in derivative instruments. All receivables and liabilities related to such instruments may,
therefore, be offset in their entirety. On March 31, 2013, the Group had not applied net accounting for
derivative instruments or for some other important assets and liabilities.
Jan-March incl.
non-recurring
items
Non-recurring
items
Jan-March excl.
non-recurring
items
MSEK 2013 2013 2013
Net sales 1,155 - 1,155
Cost of goods sold -827 5 -822
Gross profit 328 5 333
Gross margin 28.4% 28.8%
Other operating costs, net -327 5 -322
Operating profit/loss 1 10 11
Operating margin 0.1% 0.9%
Note 5 Non-recurring items per function

26
Definitions
Capital employed:
Total assets less non interest-bearing provisions
and liabilities.
Capital turnover rate:
Net sales in relation to average capital employed.
Cash flow per share:
Cash flow from operating activities divided by the
average number of shares in issue after dilution.
Debt/equity ratio:
Net debt in relation to equity.
Dividend yield
Dividend in relation to listed price on
December 31.
Earnings per share:
Profit/loss after tax attributable to the shareholders
of the parent company divided by the average
number of shares.
Equity per share
Equity attributable to the shareholders of the
parent company divided by the number of shares
at the end of the period.
Equity ratio:
Equity as a percentage of the balance sheet total.
Gross margin:
Gross profit as a percentage of net sales.
Interest coverage ratio:
Profit/loss after financial items plus interest costs, divided
by interest costs.
Net debt:
Interest-bearing provisions and liabilities less liquid
funds and interest-bearing receivables.
Operating cash flow:
Cash flow from operating activities, after capital
expenditure but before net financial items affecting cash
flow and tax paid.
Operating margin:
Operating profit/loss as a percentage of net sales.
Organic growth
Growth in net sales, or order intake, adjusted for
acquisitions, divestments and exchange rate effects.
P/E ratio
Listed price on December 31 divided by earnings per
share after dilution.
Profit margin:
Profit/loss after financial items as a percentage of net
sales.
Return on capital employed:
Operating profit/loss plus financial income as a
percentage of average capital employed.
Return on equity:
Profit/loss for the year as a percentage of average equity.
This interim report is a translation of the original in Swedish language. In the event of any textual inconsistencies between the English and the Swedish, the latter shall prevail.
Gunnebo AB (publ)
Box 5181 SE-402 26 GÖTEBORG Tel: +46-10-2095 000 Fax: +46-10-2095 010 Org.no. 556438-2629 e-mail: [email protected] web: www.gunnebogroup.com
Interim report January-June July 17, 2013
Capital Market Day 2013 September 19, 2013
Interim report January-September October 24, 2013
Year-end release 2013 January 31, 2014
AGM 2014 April 10, 2014
Interim report January-March 2014 April 29, 2014
Financial Calendar
The Gunnebo Security Group provides efficient and innovative security solutions to customers around the globe. It employs 5,700 people in 32 countries across Europe, Asia, Africa, Australia and Americas, and has a turnover of €580m. Gunnebo focuses its global offering on Bank Security & Cash Handling, Secure Storage, Entrance Control and Services. We make your world safer