japan icvpme rail valuation presentation 27oct15 europe - various russia ... — much more efficient...
TRANSCRIPT

Contact Information
11
Valuation of Japanese High Speed Rail Technology / System
9th ICVPME Conference,Tokyo, Japan
October 27, 2015

Contact Information
2
Presenter’s Contact Information
Raymond Rath, ASA, CFAManaging DirectorGlobalview Advisors LLC19900 MacArthur Boulevard, Suite 810Irvine, CA [email protected]

Contact Information
3
Contents
1. Introduction and Background2. Benefits / Costs / Risks of Investment in New High Speed Rail
Projects3. Assessing HSR Technology / System – Buy or Build Decision4. Valuation of Investments in New High Speed Rail Projects5. Benefits of Japanese High Speed Rail Technology / System6. Conclusion
7. Appendices:a. Project Feasibility Resourcesb. High Speed Rail Resources

Contact Information
4
Objectives
1. Provide overview of the complexity of high speed rail (“HSR”) technology and overall HSR system
2. Recognize range of benefits from HSR investment3. Overview of direct and indirect financial benefits4. Recognize concept and importance of “value capture”5. Discussion of indirect financial benefits6. Overview of types of non-financial benefits of HSR7. Overview of costs and risks associated with HSR investment8. Recognize attributes of a factor model for evaluating a potential
investment in HSR9. Understand benefits and risk reduction associated with investment
in Japanese HSR

Contact Information
55
Introduction and Background
Contact Information
6
Introduction - Valuation of High Speed Rail System
For any valuation, it is important to fully understand the valuation question at hand.
For our discussion, we will focus on the assessment of relative value impacts of different HSR technologies/systems to an entity considering the construction of a HSR project.
We will also provide an overview of factors in evaluating competing HSR systems
An alternative question would be what is the value of HSR to the various entities that have developed HSR technology. Our discussion will not address this different valuation question.
Contact Information
7
Introduction – Valuation of High Speed Rail Projects
High Speed Rail is an Extremely Complex System
HSR Investment has Significant Uncertainty
Traditional Valuation Viewpoint - Uncertainty Increases Risk and Greater Risk Reduces Value
We Will Discuss General Process, We Will Not Attempt to Estimate a Range of Value for HSR Projects
Economic Benefits of HSR are Both Direct and Indirect
Indirect Benefits are Significant but Not Readily Captured in a “Traditional” Valuation Model
Our Focus is the Relative Valuation of Different HSR Systems / Technologies on a HSR Project

Contact Information
8
Elements of HSR Technology / System
Train Cars (“Rail Set” or “Rolling Stock”)— Numerous unique elements
Separate Dedicated Track— Separate from other trains – improves safety— Built without road crossings at grade— No track access
Track and Automatic Train Control (No signal system needed)
Software Operating Protocols
— Inspection / Maintenance / Repair System / Other Other

Contact Information
9
Integrated Management of HSR System
Hardware — Dedicated track— Signaling system, automatic train control (“ATC”) — Rolling stock — Electrical facilities— Disaster countermeasure— Security
Software — Safety promotion structure — Employee education/training — Employee aptitude — Maintenance — Operation

Contact Information
10
Multiple Definitions For High Speed Rail Are In Use Worldwide
The International Union of Railways (UIC) make use of the European EC Directive 96/48, stating that high speed is a combination of all the elements which constitute the system:— infrastructure, — rolling stock and — operating conditions.
The International Union of Railways states that high-speed rail is a set of unique features, not merely a train travelling above a particular speed

Contact Information
11
Markets for High Speed Rail
Commuter vs. Freight Application— Very limited freight – TGV for French postal service
Characteristics of a Potential HSR Market— High passenger volumes (cities / population
centers)— “Moderate” distances - Best suited for journeys of 1
to 4½ hours (about 150–900 km or 93–559 miles) Shorter distances reduce HSR benefit Longer distances increase competition with air

Contact Information
12
Many Potential Markets for High Speed Rail
US / Canada –— Dallas to Houston— Atlanta to Columbus— Los Angeles to San
Francisco / San Diego— Washington DC to
Boston / Philadelphia / New York
— New York to Montreal— Montreal to Toronto— Chicago to St. Louis /
Detroit Africa – Johannesburg to
Durban Europe - Various Russia – Moscow to St.
Petersburg
■ Asia− India - New Delhi to
Chennai− Malaysia and Singapore− Thailand – Bangkok to
Chiang Mai− Vietnam – Hanoi to Ho Chi
Minh City− Indonesia− Sydney to Melbourne
■ South America− Brazil – Rio de Janeiro to
Sao Paolo− Argentina

Contact Information
13
Competition for High Speed Rail Investment
Traditional rail systems— Upgrade existing— Build new traditional rail systems
Other means of transit— Air transportation— Automobile / bus
Other infrastructure investments— Tunnels / bridges Repair New construction

Contact Information
14
Background on Japanese High Speed Rail
Construction started – April 1959 World’s first HSR passenger service – Tokaido
Shinkansen in 1964 Current HSR in Japan
— Longest service record — Over 2,300 kilometers of track— Many cities served— More than 10 billion passenger rides
Very timely service – 30 second average delay Very high frequency of service
— Up to 50 trains operating on a line – 4 minute spacing
Larger train cars

Contact Information
15
Background on Japanese High Speed Rail - Safety
Impeccable safety record – no fatalities despite being the first HSR and large passenger volumes
Safely shut down in major earthquake – March 11, 2011 earthquake— 27 Shinkansen trains running— Sensors pick up preliminary seismic waves Apply train brakes before seismic waves hit Turn off electrical supply

Contact Information
16
Background on Japanese High Speed Rail –Ecological Impacts
Improved air quality Reduced greenhouse gas Reduced energy use— Much more efficient than air or car / bus

Contact Information
17
Background on Japanese High Speed Rail – On-Time Record
Japanese HSR has very strong on-time record. Factors include:— Rail-set reliability— Near-total separation from slower traffic— Other
On-time performance— In 2012, JR Central reported that the Shinkansen's
average delay from schedule per train was 36 seconds. This includes delays due to uncontrollable causes, such as natural disasters.
— In 1997, the average delay was 18 seconds.

Contact Information
18
Competitors – Other Providers of HSR
Components or entire high speed rail systems are offered by a variety of sources. Reported bidders for rail sets for a planned HSR project in California include:— AnsaldoBreda (Italy)— Alstom (France)— Bombardier Transportation (Canada – parent entity)— China National Railway— Hyundai Rotem (Korea)— Kawasaki Heavy Industries Rolling Stock (Japan)— Siemens Mobility (Germany)— Talgo (Spain)— Hitachi

Contact Information
19
Status of California High Speed Rail Project
A brief overview of efforts to develop HSR in California highlights complexities for building HSR systems
California High Speed Rail Commission established in 1993 Phase 1 – Los Angeles to San Francisco
— Estimated cost of $68.4 billion— Blended system (some shared track) to reduce cost— Construction and funding in segments— Partially funded Bonds approved by California voters in November
2008 Federal grants
— Targeted completion of LA to SF by 2029

Contact Information
20
Status of California High Speed Rail Project
January 2015 California High-Speed Rail Authority issues Request for Proposals (RFP) for rolling stock. Anticipated award of contract in 2016.
Bidders include: — AnsaldoBreda (Italy)— Alstom (France)— Bombardier Transportation (Canada – parent entity)— China South Locomotive & Rolling Stock (China)— China North Locomotive and Rolling Stock (China)— Hyundai Rotem (Korea)— Kawasaki Heavy Industries Rolling Stock (Japan)— Siemens Mobility (Germany)— Talgo (Spain)

Contact Information
2121
Section 2Benefits / Costs / Risks of Investments in New HSR
Projects
Contact Information
22
Benefits of Investment in New High Speed Rail Projects
Benefits from HSR project investments are varied— Financial benefits Direct Indirect
— Other benefits Ability to measure the different benefits varies
Correctly identified HSR projects can be viewed as Transformational rather than simply as Transportation— Create dramatic changes in geographic areas

Contact Information
23
Benefits of Investment in New High Speed Rail Projects – Direct Financial Benefits
Operating cash flows upon completion— Ticket sales— Other revenue streams
Tax revenue increases— Property value increases leading to tax revenue
increases Land appreciation Addition of structures
— Income tax increases New businesses Expansion of existing businesses

Contact Information
24
Benefits of Investment in New High Speed Rail Projects – Indirect Financial Benefits Increased productivity / convenience (Time savings)
— Scheduling frequency and flexibility— Reliable, punctual operation – delays are minuscule— Comfort— Greater productivity during travel time
Job creation— Construction phase— After completion
Revitalization / reinvestment Generated traffic (new travel) Expansion of urban areas into “megaregions”
(Transformational)— Spread population away from dense downtowns
Alleviate pressure on existing air and auto transport infrastructure

Contact Information
25
Benefits of Investment in New HSR Projects –Indirect Financial Benefits (continued)
Expand labor pools – HSR reduction in travel time expands housing range for work force— Improve matching of workers to job opportunities— Greater specialization of labor supply leads to
greater efficiency and increased productivity— Knowledge spill-over (greater opportunity for
communication due to increased accessability)— Greater choice of jobs— Increased competition between companies and
individuals

Contact Information
26
Benefits of Investment in New HSR Projects –Other Benefits
Other benefit— Convenience— Safety— Reduced pollution— Energy efficiency— Prestige— Risk reduction due to transit diversification— Transport system capacity expansion HSR can reduce frequency of short hall air flights
and free up airport gates for longer distance flights
Contact Information
27
Costs of New HSR Projects
Direct— Land costs — Construction costs— Interest on investment— Possible relocations
Noise pollution — Tunnel boom significantly reduced due to
engineering solutions— Maglev actually quieter than traditional
Opportunity costs— Other uses of funds

Contact Information
28
Risks of New HSR Projects (cont’d)
Technical— Past HSR experience can mitigate
Cost Overruns— Technology development / acquisition— Land acquisition— Construction— Increased interest costs due to possible delays
Achieve Targeted Ridership, Operating Performance and other Performance Metrics
Political— Administrative / governmental / legal delays

Contact Information
2929
Section 3Assessing Development or Purchase of HSR System

Contact Information
30
Market Recognition of Complex Technology / System Value
Various transactions demonstrate the importance of developed technology / systems
Large markets with bargaining power may be able to require technology transfer to complete a transaction— Airplane, automotive, HSR and other contracts with
large markets often include direct or indirect technology transfer Some HSR rolling stock (train set) acquisitions
included requirements for local rather than foreign manufacture. Local manufacture increases likelihood of technology / skills transfer
Various aircraft and automotive contracts Large market buyers require that benefits cannot
only accrue to foreign economies

Contact Information
31
Buy vs. Build Decision for HSR Technology / System
A common investment question is often – “Buy” vs. “Build” Buy – Essentially a Market Approach— Go to market and obtain bids
Build – Essential a Cost Approach— Estimate costs to develop technology and system
internally Types of “build” costs to consider— Direct cost estimates— Indirect cost estimates— Capital costs associated with delays— Societal costs associated with delays

Contact Information
32
Buy vs. Build – Impact of Complex, Inter-related Intangible Assets on Cost to Create
The choice between the two options is almost always a function of the specific circumstance
HSR technology / systems involve numerous complex intangible elements associated with the technology and system
Complexity of interactions of the intangibles can lead to greater potential for additional costs and unexpected outcomes which can lead delays in completion
Assets / systems with less complexity would have more limited intangible elements
Intangibles are generally recognized as higher risk assets Complexity increases the potential range of costs to create Additional costs / delays can lead to other costs Greater cost uncertainty reduces attractiveness of the build scenario
and increases attractiveness of the buy scenario

Contact Information
33
Buy vs. Build – HSR Technology / System
For HSR, the purchase of existing HSR technology / system is expected to be a better investment decision
Factors include:— Very high degree of complexity of HSR systems— Complex, multi-factor learning curve— High development cost risk— Large capital investment increases risk associated with delays
Delays / second chances are costly— Multiple parties depend on timely completion given their
investment in tertiary developments
Contact Information
34
Buy vs. Build – Cost Approach and Estimation of Cost to Create
As complexity increases, estimation of cost to create becomes increasingly more challenging— Cost to include
Cost of successful efforts Costs of “failed” efforts (“dry holes”)
– Direct costs– Numerous other costs associated with delays
Overhead allocations Capital costs
Existing HSR technology / systems benefit from costs incurred from prior development efforts— Completed learning curve results in significant risk
reduction

Contact Information
35
HSR System Selection – Cost Considerations
Costs associated with unexpected delays— Capital costs— Litigation costs— Project reductions— Project terminations— Societal costs
Bankruptcies Transfer payments
Costs to sponsors associated with unexpected delays

Contact Information
3636
Section 4Valuation of Investment in
New HSR Projects

Contact Information
37
Valuation of Investment in New HSR Projects -Introduction Valuation of HSR Technology / Systems from the perspective
of the owner / licensor of system is complex— Future HSR Infrastructure spending is difficult to forecast
Number of projects and size Timing Competition
— HSR technology / systems includes multiple elements for consideration
— Separation of technology from other transaction components – technology that is integrated into the rolling stock
— Limited transactions — Available transactions involve multiple elements

Contact Information
38
Valuation of New HSR Project Investment –Valuation Methodology for Financial Benefits Financial benefits from HSR projects can be estimated
using traditional financial models Other benefits require alternative approaches
For financial benefits - Income Approach - Discounted Cash Flow Method
Key Assumptions— Cash flow estimates – Initial periods of cash outflows Subsequent periods of cash inflows
— Discount rate selection – government, private, other

Contact Information
39
Valuation of New HSR Project Investment –Challenges Measuring Direct Financial Benefits
Challenges modelling direct benefits— Capital costs uncertainty— Project completion uncertainty— Complexity of system (right-of-way requirements,
others)— Forecast market demand and pricing— Revenue mix Ticket sales Increasing focus on other revenue streams for
the HSR operator

Contact Information
40
Valuation of New HSR Project Investment – Value Capture and Indirect Financial Benefits
The concept of “value capture” recognizes many indirect financial benefits from infrastructure investment projects
Property value increases— Land value increases— Value of new and refurbished structures
Business value increases— Enhance customer traffic
In many jurisdictions, these benefits are recognized and those that benefit agree to tax and fee structures to help fund infrastructure investment that increases value of their assets— Special Assessment and/or Business Improvement Districts— Development Impact Fees

Contact Information
41
Valuation of New HSR Project Investment – Use of Multiple Scenarios
Cash-Flow Based Valuation Models Include Single or Multiple Scenarios
— Multiple scenario models recognize the range of potential future outcomes
Given complexity of HSR investment, any valuation would require complex multi-scenario valuation models
— Monte Carlo Simulation
— Key variables
— Ranges of estimates
Multiple scenarios models are recognition of HSR risks
Requirement for multiple scenarios suggests importance of risk mitigation efforts

Contact Information
42
Valuation of New HSR Project Investment –Discount Rate Estimates Developing discount rates for valuing infrastructure investment is
challenging. Benefits streams include financial and non-financial benefits Projection of current and future capital costs, future revenues and
operating expenses are difficult Infrastructure investment are frequently valued using discount rates
at the “low” end of the return spectrum Factors consistent with this view include
— High capital costs create barrier to entry and reduced risk— Income streams from property taxes are low risk – below debt
and equity costs for real estate— Government involvement suggests availability of lower cost
funding Public benefit projects often have lower discount rates due to
numerous non-financial benefits (“Social discount rate”)

Contact Information
43
Valuation of New HSR Project Investment –Indirect Financial and Non-Financial Benefits
Measuring multiple indirect financial and non-financial benefits is difficult— Employment benefits— Environmental benefits— Travel flexibility Increase competition Reduce risk of possible travel monopolies
— Overall property value increase— Technology transfer benefits to new markets— Numerous other
Known / proven HSR technology systems reduce uncertainties / risks

Contact Information
44
Evaluation of New HSR Project Investment May Use a Factor Model
Given many complex benefits, costs and competing options, HSR investment opportunities may be evaluated using factor models— Desired Economic and Non-Economic Benefits and
Costs Identified by Potential Buyer— Weights Afforded to Each Benefit (or Cost) (Criteria)— Evaluation and Scoring Method for Each Criteria— Examples HSR Investment U.S. Military Transport – Boeing vs. Airbus Contract Award (Greek Theatre in Los Angeles) Many, many others

Contact Information
45
Key Elements of Project Assessment
Sensitivity Analysis— Critical Variables
Probability Distribution for Each Critical Variable Calculation of the Distribution of Performance Indicators— Financial Net Present Value— Economic Net Present Value
Discussion of Results and Acceptable Levels of Risk Discussion of Ways to Mitigate Risks
Source: EU Guide to Large Scale Investment Projects

Contact Information
4646
Section 5Japan HSR and Impact on
Overall System Cost

Contact Information
47
HSR New Project Investment Summary
HSR Project investment is very capital intensive— Large up-front costs for land acquisition— Large up-front costs for system construction— Long time periods until completion— High capital costs –
Interest expense Cost increases if HSR system delayed
Importance of assessing costs and related benefits— Cost increases due to delays and other unexpected
factors could far exceed any potential cost savings associated with providers with a lower quoted up-front cost
Assessing different technology providers would require careful consideration of risk of delays
Contact Information
48
Japanese HSR Characteristics
Several key benefits/features of Japanese HSR systems include:— Safety
No passenger fatalities or injuries due to train accidents for 49 years
— Large Capacity Large capacity: 1,323 passengers per sixteen-car
trainset Ridership: 409,000 passengers per day, 149 million
passengers per year — Environmental Adaptability
Low energy consumption, low CO2 emissions Low wayside noise, small ground vibrations along
high-speed lines

Contact Information
49
Japanese HSR Characteristics
High Speed — System construction with separate tracks allows for high
speed operation High Frequency— 323 trips per day (Max. 410 trips per day)
Stability — Annual average delay: 0.5 minutes per train

Contact Information
50
Japanese High Speed Rail Benefits
Risk reduction due to deep expertise – given substantial investment and history of operation, reduction of adverse project events increases expected return on investment
Long record of safe operation suggests reduced risk of possible project delays. Reduced risks for: — Time for approval— Potential re-engineering and related costs
Lost investment Adverse impact of capital tie-up
Favorable reputation can improve community acceptance— Increase ridership— Increase investment in businesses supporting
completed rail system

Contact Information
51
Japan High Speed Rail Benefits
Greater perception / acceptance can lead to further expansion of HSR investment
Greater diversification of transport options— Reduce reliance on air and automotive transport— Frees up air and auto transport capacity
Regional transformation— Potential to spread development amount wider
geographic area covered by HSR

Contact Information
52
Japan HSR Benefits – Reduced Risk and Discount Rate Selection of a HSR vendor with a strong record— Increases potential cash flows by reducing potential for
adverse outcomes— Reduces the risk of these outcomes occurring
HSR project investment with a strong system provider has less risk and a lower return requirement (lower discount rate is appropriate)
HSR project investment involves significant cash outflows over an extended investment period followed by cash inflows from numerous sources (and other indirect benefits) beginning after the extended construction period
A lower discount rate will significantly increase the value of an HSR project due to the extended period over which cash flows are forecast.
Discount rate estimates also consider “social opportunity cost” which generally results in a lower discount rate

Contact Information
5353
Section 6Conclusion

Contact Information
54
Conclusions
HSR investment provides numerous benefits Japanese HSR technology reflects — Longest history of use, — High ridership volumes, — Most frequent scheduling of departures, — Construction in geographically challenging settings— Safest operating history of any HSR
Development cost expended and knowledge gained from almost 50 years or HSR operation are immense
High cost to develop new HSR technology, significant possible costs from delays and uncertainty associated with number of future HSR projects suggest purchase of existing HSR rather than creation of new technology is an optimal course

Contact Information
55
Conclusions
In assessing existing HSR system / technology options, unanticipated delays can lead to adverse economic impacts— Potential reduced public support
Reduced ridership Delays in completion
— Interest costs associated with sunk capital— Potential changes in cost of capital— Potential loss of funding— Delays in generating operating cash flows

Contact Information
56
Presentation – Key Takeaways
1. Valuation requirements and what is being appraised need to be clarified at onset.
2. Public infrastructure investment often reflects limited funds available and a choice between different infrastructure opportunities.
3. Public infrastructure investments are evaluated with models that extend beyond just a direct cash flow model.
4. Indirect economic benefits are an important consideration in public infrastructure investment.
5. Other indirect benefits (reduced pollution, reduced risk from limited transportation options) are important considerations
6. Quantitative measurement of indirect benefits can be extremely difficult.
7. Factor models where variables and weights are determined by a group with decision making responsibility are often used.
8. The variables and weights in factor models may vary.

Contact Information
57
Presentation – Key Takeaways (continued)
8. Evaluation of different vendors can be based on relative scores from factor models.

Contact Information
5858
Questions

Contact Information
59
Presenter’s Bio—Raymond Rath
Area of FocusManaging Director at Globalview Advisors LLC. Independent valuation firm with offices in Irvine, Boston and London.Recognized leader in the valuation of businesses, securities interests and intangible assets. Performs valuation projects for financial and tax reporting, transactions and litigation projects. Extremely active in enhancing the quality of valuation practice both domestically and internationally. Organize and moderate eight annual one-day conferences for the American Society of Appraisers on fair value issues including presentations by staff of the SEC, PCAOB, FASB and IASB. Led the development of two three-day valuation courses for the American Society of Appraisers (ASA) - Valuation of Intangible Assets and Special Topics in the Valuation of Intangible Assets. Led efforts resulting in an education and certification program for an Intangible Assets valuation specialty designation.

Contact Information
60
Presenter’s Bio—Raymond Rath
Professional Experience Managing Director, Globalview Advisors, LLC, November 2012 to
present.
Director, Transaction Services, Valuation Services Practice, PricewaterhouseCoopers LLP, April 2002 to October 2012.
Senior Manager, Valuation Services Practice, KPMG LLP and KPMG Consulting, Inc. 1994 to April 2002.
Experienced Manager, Arthur Andersen & Co., 1987 to 1994, Senior Consultant, 1984 to 1987.
Contact Information
61
Presenter’s Bio—Raymond Rath
Professional Affiliations Member, AICPA Investment Companies Task Force for AICPA Accounting
and Valuation Guide, Determining Fair Value of Portfolio Company Investments of Venture Capital and Private Equity Firms and other Investment Companies. Guide is presently in development.
Past Treasurer, Secretary and Member, Business Valuation Committee of the ASA. Elected by ASA international business valuation membership twice (maximum allowed).
Past President, Los Angeles Chapter of ASA (2004-2005). Accredited Senior Appraiser (“ASA”), American Society of Appraisers.
Accredited in Business, Intangible Asset valuation & Appraisal Review & Management.
Chartered Financial Analyst (“CFA”), CFA Institute. Member, Appraisal Issues Task Force.

Contact Information
62
Presenter’s Bio—Raymond Rath
Course Development and Instruction Lead Developer and Instructor, ASA courses Valuation of Intangible
Assets (BV 301) and Special Topics in the Valuation of Intangible Assets (BV 302).
Organize and moderate ten one day annual fair value conferences (May 2006 - 2015) for the ASA BVC. Presenters include SEC, PCAOB, FASB and IFRS.
Instructor, ASC courses BV 201, 202, 203 and 204. Course Developer and Instructor, IIBV 301, Valuation of Intangible
Assets, in Sao Paolo, Brazil. June 2012. Instructor, Current Developments in Valuation, Beijing, China,
December 2010.

Contact Information
63
Presenter’s Bio—Raymond Rath
Presentations Co-Presenter, Valuation of Deferred Revenue, ASA / CICBV
International Business Valuation Conference, Toronto, Canada, October 2014.
ASA Webinar, Business Valuation Concepts for Fixed Asset Appraisers, February 11, 2014
Presenter, Business Valuation Concepts for Fixed Asset Appraisers and Economic Obsolescence for Fixed Assets, International Conference on the Valuation of Plant, Machinery and Equipment, St. Petersburg, Russia, September 2013
Presenter, Valuation Developments in the United States, 2nd International Forum on New Developments in Valuation, WuHan, China, November 2012.
Lecturer, Valuation of Intangible Assets, Zhongnan University of Economics and Law, WuHan, China, November 2012.
Moderator, Fair Value Auditor Panel, ASA Conference, Chicago, IL 2011.

Contact Information
64
Presenter’s Bio—Raymond Rath
Presentations (continued)
Panelist, IPR&D Toolkit Update Panel, ASA Conference, Chicago, IL 2011.
Presenter, Valuation of Debt, ASA, Miami, FL 2010. Presenter, Valuation of Intangible Assets, 25th Pan Pacific Conference,
Bali, Indonesia, September 2010. Presenter, Attrition Measurement and Estimation, ASA Conference,
Boston, MA, Oct 2009.

Contact Information
65
Presenter’s Bio—Raymond Rath
Publications Author, Private Company Valuation chapter in the CFA Institute text
Equity Asset Valuation. Chapter is a required reading for CFA level 2 candidates globally.
Author, Thoughts on the Excess Earnings Method for Business Valuation, Financial Valuation and Litigation Expert, FVLE Issue 54, April/May 2015.
Author, Advancing the Quality of Valuations for Financial Reporting, Financial Valuation and Litigation Expert, FVLE Issue 50, August/ September 2014.
Author, Intangible Asset Valuation: The Distributor Method,Financial Valuation and Litigation Expert, FVLE Issue 41, February/March 2013.
Education M.B.A., University of Southern California. B.S., Business Administration, University of Kansas, Cum Laude.

Contact Information
6666
Appendices

Contact Information
67
Appendices
I – Resources II - ???

Contact Information
6868
Appendix I:Resources
Contact Information
69
Resources – Project Feasibility
Guide to Cost Benefit Analysis of Investment Projects, European Union, Directorate General Regional Policy, July 2008.
Benefit/Cost Analysis for Transportation Infrastructure: A Practitioner’s Workshop, Transportation Economics Center, Texas Transportation Institute, May 17, 2010, Washington, D.C.

Contact Information
70
Resources
Risk Management In A Large-scale New Railway Transport System Project ─ Evaluation of Korean High Speed Railway Experience ─ Sunduck D. SUH, Ph.D., P.E. Associate Professor, Division of Construction and Transportation Engineering Hanyang University Ansan, Korea (Received June 7, 2000)
Evaluation of EIB Financing on Rail Projects in the European Union, European Investment Bank, June 2005.
Comparing Approaches For Valuing Economic Development Benefits Of Transportation Projects, Glen Wesbrod, Michael Grovak.

Contact Information
71
END

Contact Information
72
OUT
Contact Information
73
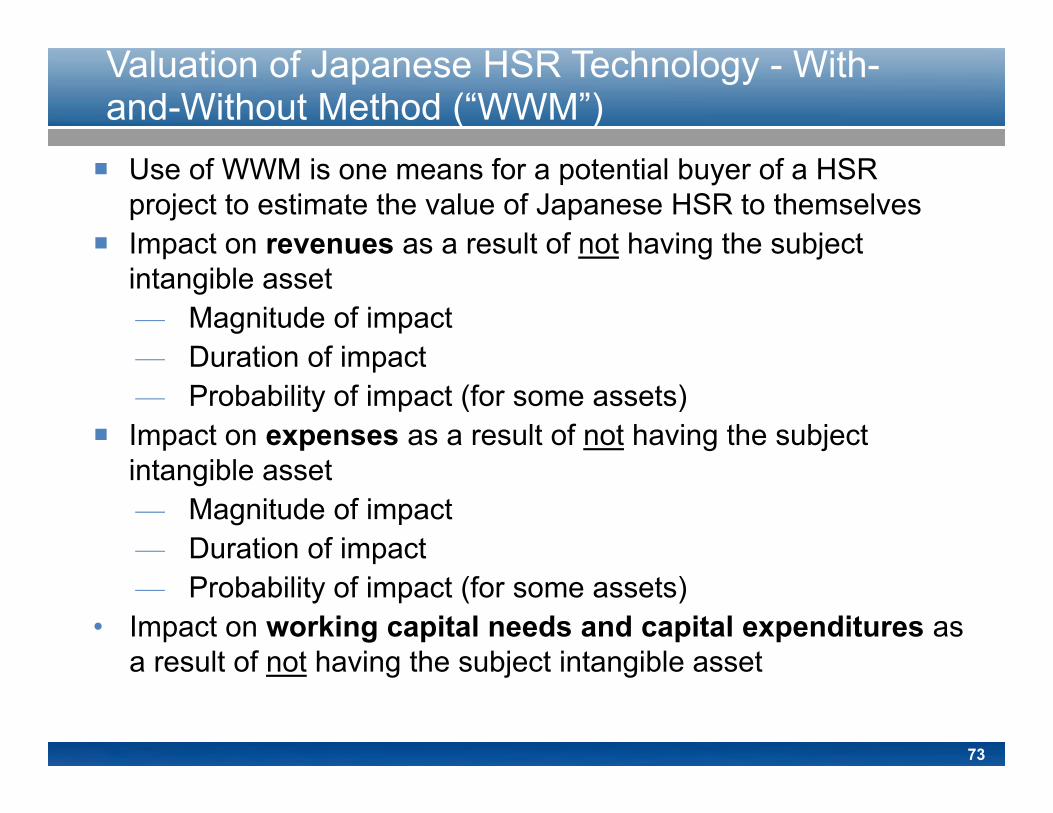
Valuation of Japanese HSR Technology - With-and-Without Method (“WWM”) Use of WWM is one means for a potential buyer of a HSR
project to estimate the value of Japanese HSR to themselves Impact on revenues as a result of not having the subject
intangible asset— Magnitude of impact — Duration of impact— Probability of impact (for some assets)
Impact on expenses as a result of not having the subject intangible asset— Magnitude of impact— Duration of impact — Probability of impact (for some assets)
• Impact on working capital needs and capital expenditures as a result of not having the subject intangible asset

Contact Information
74
WWM Example – Background
A very simple example can illustrate the general premise of the With-and-Without Method. Additional complexity can be added to reflect a more real world situation.
Scenario 1 is the optimal scenario. Construction of the asset takes three years.
Scenario 2 is the next best alternative scenario – construction requires an additional year to complete (4 years total).
As a result of construction delay, revenues are delayed by one year. All other assumptions are either held constant or are applied in a
consistent means to reflect the one year delay. Focusing on a single variable simplifies the presentation and
highlight the concepts of the WWM.

Contact Information
75
WWM Example – Scenario 1 – Three Years to Completion
With‐and Without MethodIncome Statement ForecastScenario 1 ‐ No Delay in Completion
Projected Income Statements1 2 3 4 5 6 7 8 9 10 Residual
Revenue 25,000 37,500 46,875 51,563 54,141 55,765 57,438 59,161 Growth Rate N/A 50.0% 25.0% 10.0% 5.0% 3.0% 3.0% 3.0%
Operating Expenses 97.5% ‐ ‐ ‐ 24,375 36,563 45,703 50,273 52,787 54,371 56,002 57,682 EBITDA ‐ ‐ ‐ 625 938 1,172 1,289 1,354 1,394 1,436 1,479 Depreciation ‐ ‐ ‐ 850 953 1,059 1,168 1,245 1,283 1,321 1,361 Operating Income 0 0 0 (225) (16) 113 121 108 112 115 118Interest Expense (Income) 250 500 750 850 953 1,059 1,168 1,281 1,397 1,516 1,639
Pretax Income (250) (500) (750) (1,075) (969) (946) (1,048) (1,173) (1,285) (1,401) (1,521)Income Taxes 40.0% (100) (200) (300) (430) (387) (379) (419) (469) (514) (561) (608)After‐Tax Earnings (150) (300) (450) (645) (581) (568) (629) (704) (771) (841) (913)
Projected Cash Flows and Present ValueAfter‐Tax Earnings (150) (300) (450) (645) (581) (568) (629) (704) (771) (841) (913) Capital Expenditures (5,000) (5,000) (5,000) (2,000) (2,060) (2,122) (2,185) (2,251) (2,319) (2,388) (2,460) Depreciation ‐ ‐ ‐ 850 953 1,059 1,168 1,281 1,397 1,516 1,639 Projected Cash Flow (5,150) (5,300) (5,450) (1,795) (1,688) (1,630) (1,646) (1,674) (1,693) (1,713) (1,733) Present Value Factor 5.0% 0.976 0.929 0.885 0.843 0.803 0.765 0.728 0.694 0.661 0.629 0.599 Present Value (5,026) (4,926) (4,824) (1,513) (1,355) (1,247) (1,198) (1,161) (1,118) (1,077) (1,038)
Sum of Present Values (23,446)
Notes:Simplified model to illustrate concepts only

Contact Information
76
WWM Example – Scenario 2 – Four Years to Completion
With‐and Without MethodIncome Statement ForecastScenario 1 ‐ One Year Delay in Completion
Projected Income Statements1 2 3 4 5 6 7 8 9 10 Residual
Revenue 25,000 37,500 46,875 51,563 54,141 55,765 57,438 Growth Rate N/A 50.0% 50.0% 25.0% 10.0% 5.0% 3.0% 3.0%
Operating Expenses 97.5% ‐ ‐ ‐ ‐ 24,375 36,563 45,703 50,273 52,787 54,371 56,002 EBITDA ‐ ‐ ‐ ‐ 625 938 1,172 1,289 1,354 1,394 1,436 Depreciation ‐ ‐ ‐ 953 1,059 1,168 1,186 1,245 1,283 1,321 Operating Income 0 0 0 0 (328) (122) 4 103 108 112 115Interest Expense (Income) 250 500 750 850 953 1,059 1,168 1,281 1,397 1,516 1,639
Pretax Income (250) (500) (750) (850) (1,281) (1,181) (1,165) (1,178) (1,289) (1,405) (1,524)Income Taxes 40.0% (100) (200) (300) (340) (512) (472) (466) (471) (515) (562) (610)After‐Tax Earnings (150) (300) (450) (510) (769) (708) (699) (707) (773) (843) (915)
Projected Cash Flows and Present ValueAfter‐Tax Earnings (150) (300) (450) (510) (769) (708) (699) (707) (773) (843) (915) Capital Expenditures (5,000) (5,000) (5,000) (2,000) (2,060) (2,122) (2,185) (2,251) (2,319) (2,388) (2,460) Depreciation ‐ ‐ ‐ ‐ 953 1,059 1,168 1,281 1,397 1,516 1,639 Projected Cash Flow (5,150) (5,300) (5,450) (2,510) (1,876) (1,771) (1,716) (1,677) (1,695) (1,715) (1,735) Present Value Factor 5.0% 0.976 0.929 0.885 0.843 0.803 0.765 0.728 0.694 0.661 0.629 0.599 Present Value (5,026) (4,926) (4,824) (2,116) (1,506) (1,354) (1,250) (1,163) (1,119) (1,079) (1,040)
Sum of Present Values (24,363)
Notes:Simplified model to illustrate concepts only

Contact Information
77
WWM Example – Comparison of 1 and 2
With‐and Without MethodComparison of Scenario 1 and 2
1 2 3 4 5 6 7 8 9 10 Residual TotalProjected Revenues
Scenario 1 ‐ ‐ ‐ 25,000 37,500 46,875 51,563 54,141 55,765 57,438 59,161 Scenario 2 ‐ ‐ ‐ ‐ 25,000 37,500 46,875 51,563 54,141 55,765 57,438 Difference ‐ ‐ ‐ 25,000 12,500 9,375 4,688 2,578 1,624 1,673 1,723
Projected EBITDAScenario 1 ‐ ‐ ‐ 625 938 1,172 1,289 1,354 1,394 1,436 1,479 Scenario 2 ‐ ‐ ‐ ‐ 625 938 1,172 1,289 1,354 1,394 1,436 Difference ‐ ‐ ‐ 625 313 234 117 64 41 42 43
Projected Operating Income (EBIT)Scenario 1 ‐ ‐ ‐ (225) (16) 113 121 108 112 115 118 Scenario 2 ‐ ‐ ‐ ‐ (328) (122) 4 103 108 112 115 Difference ‐ ‐ ‐ (225) 313 234 117 5 3 3 3
Projected After Tax EarningsScenario 1 (150) (300) (450) (645) (581) (568) (629) (704) (771) (841) (913) Scenario 2 (150) (300) (450) (510) (769) (708) (699) (707) (773) (843) (915) Difference ‐ ‐ ‐ (135) 188 141 70 3 2 2 2
Projected Capital ExpendituresScenario 1 5,000 5,000 5,000 2,000 2,060 2,122 2,185 2,251 2,319 2,388 2,460 32,785 Scenario 2 5,000 5,000 5,000 2,000 2,060 2,122 2,185 2,251 2,319 2,388 2,460 32,785 Difference ‐ ‐ ‐ ‐ ‐ ‐ ‐ ‐ ‐ ‐ ‐ ‐
Projected Cash FlowsScenario 1 (5,150) (5,300) (5,450) (1,795) (1,688) (1,630) (1,646) (1,674) (1,693) (1,713) (1,733) Scenario 2 (5,150) (5,300) (5,450) (2,510) (1,876) (1,771) (1,716) (1,677) (1,695) (1,715) (1,735) Difference ‐ ‐ ‐ 715 188 141 70 3 2 2 2
Projected Present Value of Cash FlowsScenario 1 (5,026) (4,926) (4,824) (1,513) (1,355) (1,247) (1,198) (1,161) (1,118) (1,077) (1,038) (24,484) Scenario 2 (5,026) (4,926) (4,824) (2,116) (1,506) (1,354) (1,250) (1,163) (1,119) (1,079) (1,040) (25,402) Difference ‐ ‐ ‐ 603 151 108 51 2 1 1 1 918

Contact Information
78
WWM Example - Observations
The simplified example highlights the premise of the WWM. Different assets or, in this case, investment decisions may generate different cash flow benefit streams.
Scenario one provides a significant advantage as a result of the avoidance of the assumed delay associated with scenario two.
Key notes on the general assumptions include:— As HSR is an investment with significant public benefits, pricing
is assumed to lead to approximate breakeven operations— Model assumes 100 percent debt financing.— Indirect economic benefits and other external benefits
previously discussed are not captured in the model

Contact Information
79
Valuation of HSR Technology – Summary
Use of With-and-Without Method may be a viable means of estimating the relative benefits of Japanese HSR technology compared to other HSR technology
— Forward looking approach
— Captures economic impact