japan international cooperation agency - jica · about by climate change will indeed have great...
TRANSCRIPT

Impacts of Climate Change upon Asian Coastal Areas:
The case of Metro Manila
Muto, M., Morishita, K., and Syson, L.
Japan International Cooperation Agency
With the cooperation of Integrated Research System for Sustainability Science (IR3S), Institute for Global Change Adaptation Science (ICAS), CTI International, ALMEC Corporation, Ateneo de Manila University, and National Statistics Office, Republic of the Philippines. We are also grateful for the assistance provided by Ms. Asami Takeda and Ms. Kayo Ikeda.

Impacts of Climate Change upon Asian Coastal Areas: The case of Metro Manila
Summary
Climate models supporting the IPCC Fourth Assessment Report predict that climate change will
increase local temperatures and precipitation in monsoon regions in Asia, where the number of large
cities is increasing and existing urban areas are expanding, particularly along the coasts. In this study,
Metro Manila, typical of Asian coastal megacities, is used as a case study to comprehensively
simulate impacts of future climate change and identify necessary adaptation measures.
In spite of the various uncertainties inherent in predictions, this study translates future global climate
scenarios to regional climate scenarios, a process called “downscaling”. The B1 and A1FI scenarios
of the IPCC SRES framework provide a basis for discussing local temperature and precipitation
changes in Metro Manila. Based on these scenarios, hydrological conditions such as river overflow
and storm surge were projected. Flood simulation maps were then constructed showing the range of
potential spatial spreads, inundation depths and flooding durations anticipated in the metropolis.
Based on the flood simulation maps, socio-economic impact analyses were applied to understand the
characteristics and magnitude of flood damage anticipated in the year 2050. The benefit side of the
analysis calculated avoided damage at the aggregate level. Tangible direct losses were assessed as in
conventional flood control project analyses. Incremental costs to transportation (VOC and time
costs), and lost wages and income (sales) due to flooding were combined for tangible indirect costs.
Note that the simulated flood maps and impacts are some cases among a wide range of future
possibilities resulting from a “cascade of uncertainties” inherent in the various steps of the
methodology.
If flood control infrastructure improvements were stopped now, and the A1FI climate scenario is
assumed, a 100-year return period flood could cause aggregate damages of up to 24% of the GRDP,
while damages from a 30-year return period flood would be about 15% of the GRDP. If, however,
infrastructure improvement based on the 1990 Master Plan is continued and climate scenario B1 is
assumed, the projected damages would be only 9% of the GRDP for a 100-year return period flood,
and 3% for a 30-year return period flood.
Finally, options for adapting to the scenarios were selected, with the objective of eliminating as
much as possible of the flooding projected in the flood simulations. Economic evaluations using
economic internal rate of return (EIRR) and net present value (NPV) were conducted by combining
the costs of the adaptation options with the damages avoided by implementing those options. The

EIRR and NPV evaluations yielded different results, but they both suggest that filling the
infrastructure gap identified under the current Master Plan (for status quo climate) is the first and
foremost priority.

Chapter 1 Introduction and Brief Description of Metro Manila
1.1 Introduction
Assessment reports on climate change impacts prepared by the Intergovernmental Panel on Climate
Change (IPCC) show that global warming will likely progress further in the 21st century.
Greenhouse gases (GHGs) discharged in the course of industrialization and modernization of
socio-economic activities over the world have the changed the carbon concentration in the
atmosphere. This gradual change has caused the global temperature to increase, and consequently
sea levels have risen, so that ecological systems and human societies may suffer from complex
large-scale effects. The international community recognizes that climate change is the most critical
issue in the centuries to come and that tackling this issue through reduction of GHG emissions and
adoption of appropriate adaptation measures on a global basis is imperative.
Climate models supporting the IPCC Fourth Assessment Report of 2007 predict that climate change
will increase local temperatures and precipitation in monsoon regions in Asia, where the number of
large cities is increasing and existing urban areas are expanding as their economies grow, especially
in coastal areas. Expected to be the most prone to frequent flooding brought on by global warming,
these areas will experience the most complex effects, both directly and indirectly.
In the policy arena, Asian megacities’ increased vulnerability to climate change has been perceived
as a new challenge to be addressed. In general, vulnerability is defined as the degree to which a
system or unit is likely to experience harm due to perturbations or stresses and responses of, and
impacts on, social groups, ecosystems, and places.1 Significantly, a society’s vulnerability is in
part dependent on the society’s technical, institutional, economic, and cultural ability to prevent or
cope with these impacts.
In this regard, adaptation relates to the degree to which a particular group can cope with adverse
effects of climate change, including climate variability and extremes.2 Developing countries have
identified various adaptation policies, most of which focus on direct and tangible impacts.
However, climate change impacts are not limited to tangible damages: the drastic changes they bring
also have enormous influence on people’s daily lives in affected communities and economic
activities in affected areas. In the case of floods, examples of such effects are the halt of industrial
and commercial activities, infrastructure malfunctions, increased risk of infectious diseases,
environmental pollution, and the necessity of relocating people. Thus, physical changes brought
1 The vulnerability of natural systems should be differentiated from that of socio-economic ones. This report refers to
the latter (Nicholls, 1998 cited in Porio 2008, p.4). 2 Carter and Kankaanpaa 2003, IPCC 2001, Porio 2008, p. 4.
1
about by climate change will indeed have great local impact socially, economically, environmentally,
and psychologically.
In this context, Metro Manila, typical of Asian megacities, was chosen as a case study to
comprehensively simulate the impacts of future climate change and identify necessary actions. It is
the center of political, economic and socio-cultural activities of the nation. Its strategic location by
Manila Bay has supported the capital city’s growth and expansion into large suburbs over the last
several decades. Metro Manila, whose per capita gross regional domestic product (GRDP) is by far
the highest in the country, maintains its position as the premier economic center of the nation as
home to the headquarters of domestic and international business establishments. The regional
economic growth of Metro Manila is expected to continue to lead the national economy until at least
the year 2050, our target timeframe. At the same time, since Metro Manila is in a low-lying area
facing the sea, a large lake (Laguna de Bay) and embracing two river systems, it is prone to flooding
disasters.
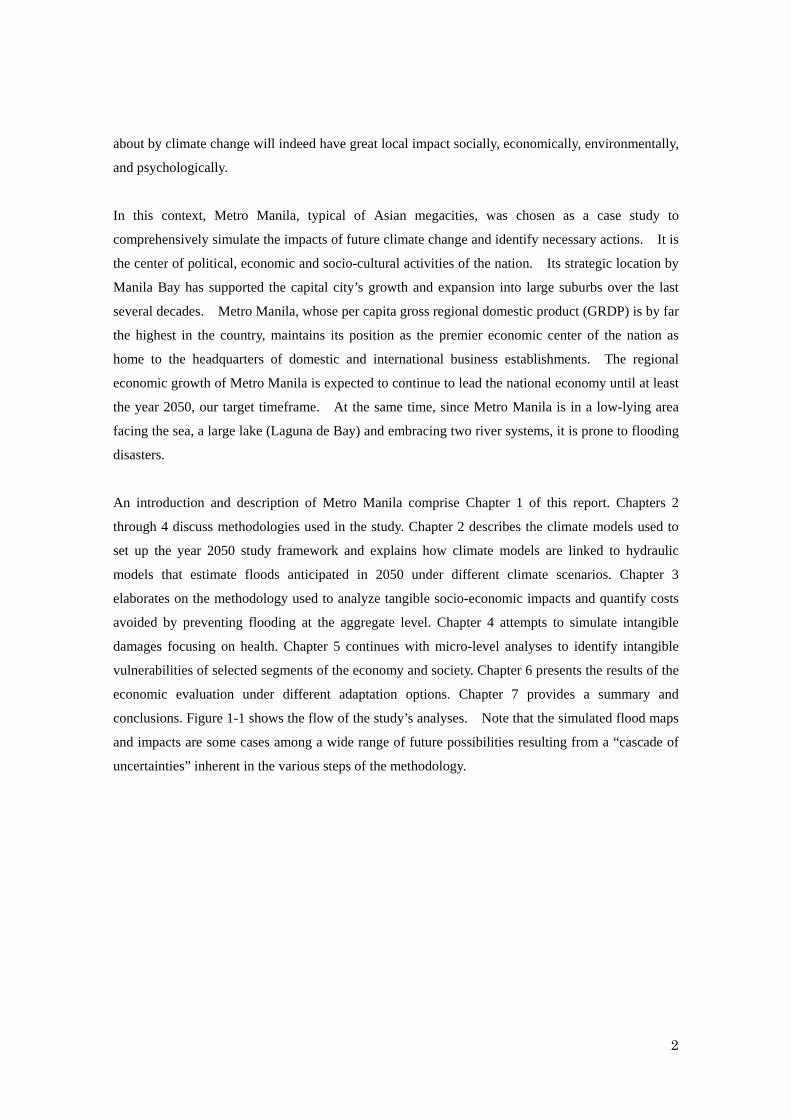
An introduction and description of Metro Manila comprise Chapter 1 of this report. Chapters 2
through 4 discuss methodologies used in the study. Chapter 2 describes the climate models used to
set up the year 2050 study framework and explains how climate models are linked to hydraulic
models that estimate floods anticipated in 2050 under different climate scenarios. Chapter 3
elaborates on the methodology used to analyze tangible socio-economic impacts and quantify costs
avoided by preventing flooding at the aggregate level. Chapter 4 attempts to simulate intangible
damages focusing on health. Chapter 5 continues with micro-level analyses to identify intangible
vulnerabilities of selected segments of the economy and society. Chapter 6 presents the results of the
economic evaluation under different adaptation options. Chapter 7 provides a summary and
conclusions. Figure 1-1 shows the flow of the study’s analyses. Note that the simulated flood maps
and impacts are some cases among a wide range of future possibilities resulting from a “cascade of
uncertainties” inherent in the various steps of the methodology.
2
Calculate Economic Net Present Value and Estimated Internal Rate of Return
Consider investment mix and cost of adaptation options.
Based on the flood maps produced for 18 cases (3 climate scenarios x 2infrastructure scenarios x 3 return periods), estimate socioeconomic impact (both direct and indirect) with available data to estimate benefits derived from adaptation options.
Simulate different types of hydraulic effects: 1) through river systems,2) through accumulation of water in Laguna de Bay, and 3) through sea level rise and storm surge at the coast (combination depends on city)
Assess local effects on precipitation and combine with sea level rise / storm intensification
Downscale IPCC Climate Models for temperature expected in 2050 under B1 and A1FI scenarios
Figure 1-1 Study Analysis Flow
1.2 Study Locations
Metro Manila was chosen as the site of this study because of the diverse hydrological characteristics
existing in the same urban area. The Pasig-Mariquina area has several river systems; the
KAMANAVA (Kalookan, Malabon, Navotas, Valenzuela) area along the low lying coast is prone to
typhoons. West of Mangahan facing Laguna de Bay Lake is prone to interior flooding.
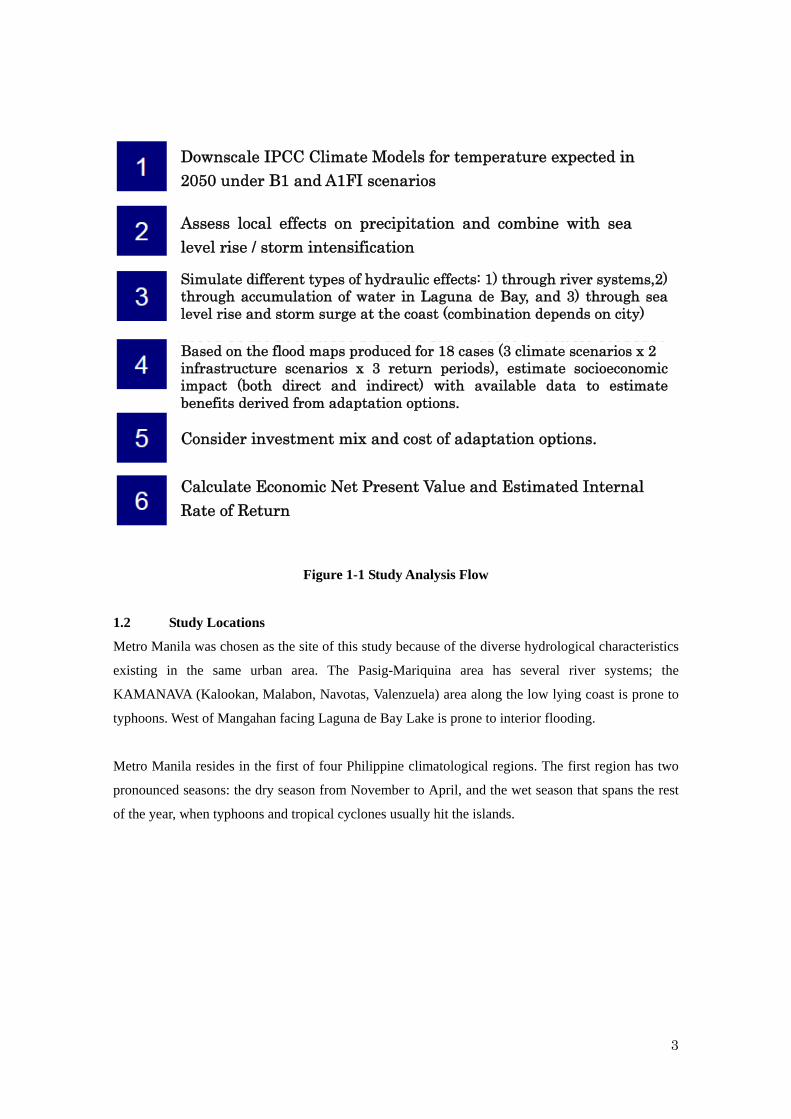
Metro Manila resides in the first of four Philippine climatological regions. The first region has two
pronounced seasons: the dry season from November to April, and the wet season that spans the rest
of the year, when typhoons and tropical cyclones usually hit the islands.
3
No dry season, but pronounced maximum rainfall from November to January
Seasons not pronounced, but relatively dry from November to April, wet during remainder of year
Rainfall distributed relatively evenly throughout the year
Two pronounced seasons: Dry season: November to April Wet season: remainder of the year
Note: Frequency of tropical cyclones is the probability of a cyclone passing through the indicated area (land).
Figure 1-2 Climatologic Regions in the Philippines
Metro Manila lies on a semi-alluvial plain formed by sediment flows from the Meycawayan and
Malabon-Tullahan river basins in the north, the Pasig-Marikina river basin in the east. The city is
open to Manila Bay on the West and to a large lake, Laguna de Bay, on the southeast. Thus, “the
metropolitan area is a vast drainage basin that experiences frequent inundations from overflowing
rivers and storm waters that render the existing system of esteros (modified natural channels) and
canals constructed during the Spanish and American colonial periods inadequate.”3
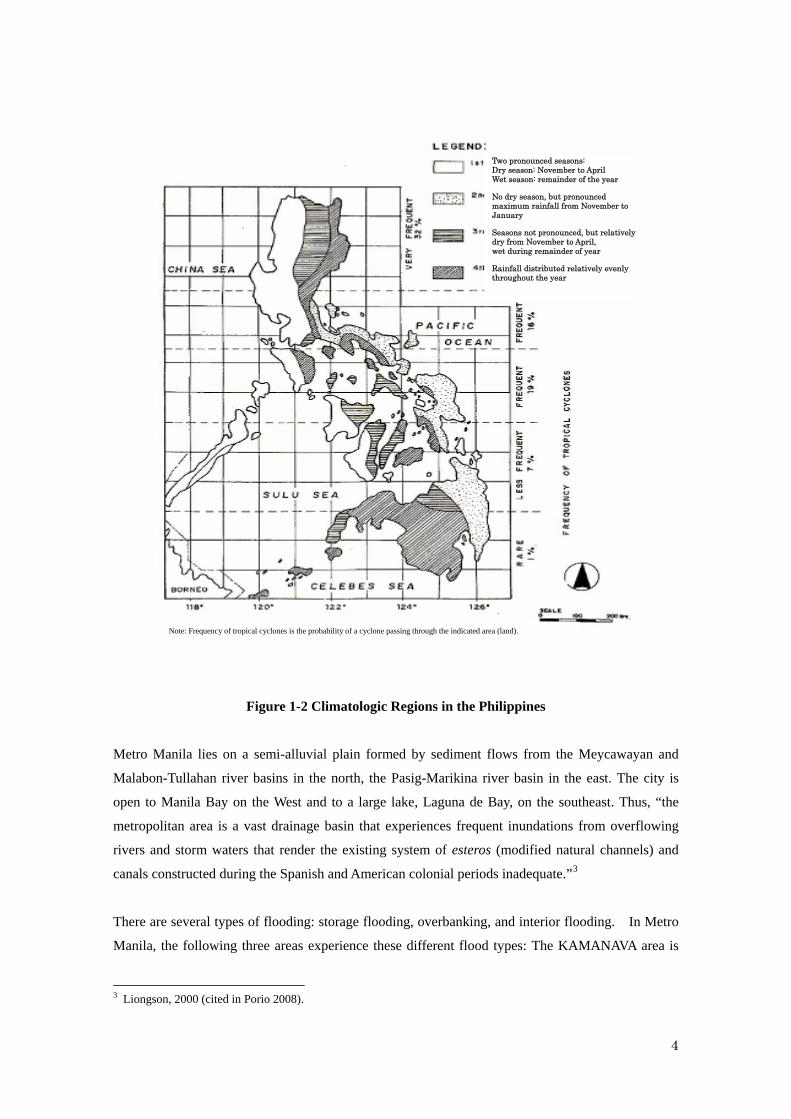
There are several types of flooding: storage flooding, overbanking, and interior flooding. In Metro
Manila, the following three areas experience these different flood types: The KAMANAVA area is
3 Liongson, 2000 (cited in Porio 2008).
4
vulnerable to storage-type flooding, the Pasig-Marikina river basin (hereinafter “Pasig-Marikina”) is
prone to overbanking, and the West Mangahan area (hereinafter “West Mangahan”) experiences
interior flooding (Figure 1-3).
Figure 1-3 Map of Study Areas in Metro Manila
1.2.1 KAMANAVA Area4
The KAMANAVA area is low and flat with elevations ranging from around sea level to two to three
meters above. Its current population is in excess of one million in an area of approximately 18.5 km2.
Before the 1960’s, the KAMANAVA area was made up of widely spread lagoons used as fishponds,
but it was partially filled to its current configuration, which consists mainly of commercial districts
and residential areas along with fishponds.
Floods covering large areas occur throughout the year, but are particularly frequent during the rainy
season from May to October when high tides coincide with heavy rains. These floods are caused by
a combination of overflow of the Malabon-Tullahan River and inadequate local drainage systems
4 “KAMANAVA Area Flood Control and Drainage System Improvement Project,” 2001 (cited by CTI, p. 11).
5

aggravated by high tides in Manila Bay.
The “KAMANAVA Area Flood Control and Drainage System Improvement Project” is a
multi-faceted project designed to relieve flooding based on a 10-year return period flood. The
project works include construction of a polder dike, heightening of river walls on the Malabon and
Marala Rivers, construction of a submersible radial navigation gate facility, construction of flood
gates, construction of control gates, construction of pumping stations, and improvement and new
construction of drainage channels.
Fig. 1-4 KAMANAVA Area Flood Control and Drainage System Improvement Project
6

1.2.2 Pasig-Marikina River Area5
The Pasig-Marikina River System has a catchment area of 651 km2 including the catchment area of
the San Juan River. It is composed of the 10 cities and municipalities of Mandaluyong, Manila,
Marikina, Quezon, San Juan, Antipolo, Cainta, Rodriguez, San Mateo, and Pasay. The downstream
part of the river system belongs to Metro Manila, but the upper part is under the jurisdiction of Rizal
Province. The section of the river system between the river mouth (Manila Bay) and the Napindan
Channel confluence point is called the Pasig River, while upstream from there is called the Marikina
River. The Marikina River is also connected with Laguna de Bay Lake at the Rosario Weir through
the Mangahan Floodway.
Excess flood runoff overflows from the Pasig and Marikina riverbanks. Similarly, storm water
flowing in drainage and creek networks creates inundation. Excess runoff water from the Marikina
River is diverted to the Lake through the Mangahan Floodway during floods to protect Metro
Manila’s city core. The flood runoff stored in the Laguna de Bay is slowly released to the Pasig
River through the Napindan Hydraulic Control Structure (NHCS) in Napindan channel when the
water level recedes in the Pasig River and ultimately drains into Manila Bay.
Another broad flood control project, known as the “Pasig-Marikina River Channel Improvement
Project” was formulated based on a 30-year return period scale. Aiming at increasing the flow
capacity of the Pasig-Marikina River, the channel will be improved for a stretch of about 31 km from
the river mouth to Santo Niño. The construction of the Marikina Control Gate Structure (MCGS), an
urgent 30-year return period flood control project, is indispensable for securing smooth flood
diversion to Laguna de Bay. Improvement of the upper Marina River is also required in line with
the construction of the MCGS. Tasks making up the project include heightening of existing parapet
walls and rehabilitation of revetments, dredging and excavation, providing new parapet wall
embankments and construction of the MCGS, river widening, etc.
1.2.3 West Mangahan Area6
The total area west of the Mangahan Floodway is 39 km2, covering the five cities of Makati, Pasig,
Pateros, Taguig, and Taytay. In the area there are a number of drainage channels discharging into
Laguna de Bay Lake or the Napindan River, such as the Tapayan, Abasing, Taguig-Pateros and
Hagonoy drainage channels.
5 “Detailed Engineering Design of Pasig-Marikina River Channel Improvement Project,” 2002 (cited by CTI, p. 11). 6 “Detailed Design of the North Laguna Lakeshore Urgent Flood Control and Drainage Project,” 1992 (cited by CTI, p. 12).
7

8
The West Mangahan drainage area topography is flat, and is a typical interior-flood-prone area along
Laguna de Bay Lake. Storm rainfall and high water levels in the lake cause flooding in the area.
There are several drainage channels and rivers. Storm water runoff is stranded due to the high lake
water level. Since urbanization of the paddy fields has progressed in these places, the inundation
affects not just paddy fields but also towns, communities, and subdivisions thriving in the area.
This area usually starts being inundated when the water stage of Laguna de Bay rises to
approximately 11.5 m, and most of the area is submerged at a water stage of approximately 13.5 m,
though the lake is not affected by storm surges. The Mangahan Floodway was constructed in 1985
to divert floodwaters from the Marikina River into Laguna de Bay at a design discharge of 2,400
m3/s with the flood flow regulated at the proposed MCGS. The northwestern portion of the lake is
flanked by Metro Manila while the provinces of Rizal and Quezon bound its northeastern and
southeastern borders. Laguna, Batangas, and Cavite provinces border the lake on the south and
southwest. The construction of the flood control project in the area west of the Mangahan
Floodway was completed in 2007. The project work included a lakeshore dike, bridges at two sites,
in Mangahan and Napindan, a parapet wall with a top elevation of 14.1 m, floodgates at eight sites,
four pumping stations, and regulation ponds at four sites.
West Mangahan
Marikina Pasig-SanJuan
Figure 1-5 Pasig-Marikina Area and West Mangahan Area

Chapter 2 Methodology Part One: Modeling Climate Change scenarios and the Hydrology
of Coastal Cities
2.1 Climate Change Scenarios
2.1.1 Climate Change Scenarios.1
Any climate impact assessment starts with specifying a global climate scenario that provides the
boundary conditions for subsequent analysis. This study is based on global climate projections
provided by the Fourth Assessment Report (AR4) of the IPCC, adopting the B1 and A1FI scenarios
from the IPCC’s Special Reports on Emissions Scenarios (SRES), and comparing them with the
Status Quo (SQ) scenario. B1 is the scenario projected by the IPCC to represent the least
anticipated change, which makes it the most sustainable case. A1FI, on the other hand represents a
large change scenario due to high economic growth. The target year is set as 2050, the halfway
mark of the IPCC SRES timeframe. The spatial spreads of flooding for the year 2050 under the SQ,
B1, and A1FI scenarios are taken as the basis for impact analyses.
2.1.2 Uncertainties.
It should be borne in mind that the present IPCC climate models cannot be directly applied to impact
studies on local climate change because of various uncertainties: emission scenarios due to economic
growth rates and energy efficiency improvements, carbon cycle response to changes in climate,
global climate sensitivity, discrepancies in regional climate change scenarios, and changes in
ecosystems, etc. Simulations of local climate change are fundamentally more uncertain than global
mean values. Local climate is heavily influenced by atmospheric and oceanic circulation, such as
prevailing weather situations and wind directions. For example, global mean precipitation changes
do not necessarily determine the changes in local precipitation, so it is impossible to conclusively
determine future precipitation rate extremes.
Although climate projections are based on global climate models or general circulation models
(GCMs), their results contain various biases. If the raw GCM outputs were used for impact studies,
the biases would surely contaminate the assessment outcome. Precipitation remains a stringent test
for climate models. Many biases in precipitation statistics remain in both precipitation means and
variability, especially in the tropics.2 Comparison between observations and simulations of 20th
1 This Chapter is based on Masahiro Sugiyama, University of Tokyo, “Methodological notes on regional climate scenarios for Study on Climate Change Impact and Adaptation in Asian Coastal Cities,” (2008) 2 Randall et al, “Climate Models and Their Evaluation,” Climate Change 2007: The Physical Science Basis. Contribution of Working Group I to the Forth Assessment Report of the Intergovernmental Panel on Climate Change, Cambridge University Press, Cambridge, United Kingdom and New York, NY, USA, 2007.
9

century conditions reveals that most models do not accurately simulate precipitation extremes.3
2.1.3 Downscaling
Despite these various uncertainties, global climate scenarios can be translated to regional climate
scenarios, a process called “downscaling.”4, which is employed for this study. While there has
been an increasing recognition of the explicit treatment of uncertainty in environmental assessments
recently, this report deals with uncertainties qualitatively, rather than quantitatively.5 Downscaling
requires local-level, bias-corrected climate information. The analyses below discuss development
of regional climatic changes in the period up to 2050.6 IPCC SRES scenarios B1 and A1FI provide
a basis for discussing changes in local temperature and precipitation in Metro Manila, based on
which hydrological conditions such as sea-level rise, storm surge, and land subsidence are projected.
2.1.4 Temperature
IPCC provides projections for global mean temperature changes for various IPCC SRES scenarios
up to the year 2100. Projected global temperature rise can be set using projected values as
illustrated in fig 2-1.
3 A simple example is to calculate the difference in a model between its 20th and 21st century estimates and add that difference to the observed 20th century climate. This renders the estimated variable (at least partially) independent of the model used to simulate the 20th century. Otherwise, the resulting 21st-century modeled precipitation level could be in error. This could lead to a biased impact assessment if used directly without correction. In the case of a 20th century model simulation where precipitation is underestimated at 7 mm/day, the model could project an increase of precipitation to 9mm/day in the future. Since the 21st century figure carries along the underestimation of the 20th century estimate, using it directly would produce precipitation increases that are too small. The simple procedure of adding the difference between the two model simulations to the observed 20th century value can ameliorate this trouble. .4 Since downscaling is a common technique, there are a number of useful references for experts and non-experts alike. From a technical viewpoint, Chapter 11 of IPCC AR4 is a good start. Its last section is dedicated to regional climate projection methodologies. The Technical Summary of Working Group I is also helpful. IPCC’s Task Group on Data and Scenario Support for Impact and Climate Assessment (TGICA) produces guidelines on the use of regional scenarios. “Guidelines for Use of Climate Scenarios Developed from Regional Climate Model Experiments” (Mearns et al. 2003) and “Guidelines for Use of Climate Scenarios Developed from Statistical Downscaling Methods” (Wilby et al., 2004) are of particular relevance. For more broad information, various downscaling techniques for non-experts are compiled by UNFCCC in its “Compendium on Methods and Tools to Evaluate Impacts of, and Vulnerability and Adaptation to, Climate Change” (2008). 5 There are a number of ways to formally generate probability information at the local scale, including multi-model ensemble and perturbed physics runs. For examples, Chapter of IPCC AR4 provides a concise review of various papers. 6 Projected climate change up to the year 2050 is highly likely to occur, and has already started to be observed.
10
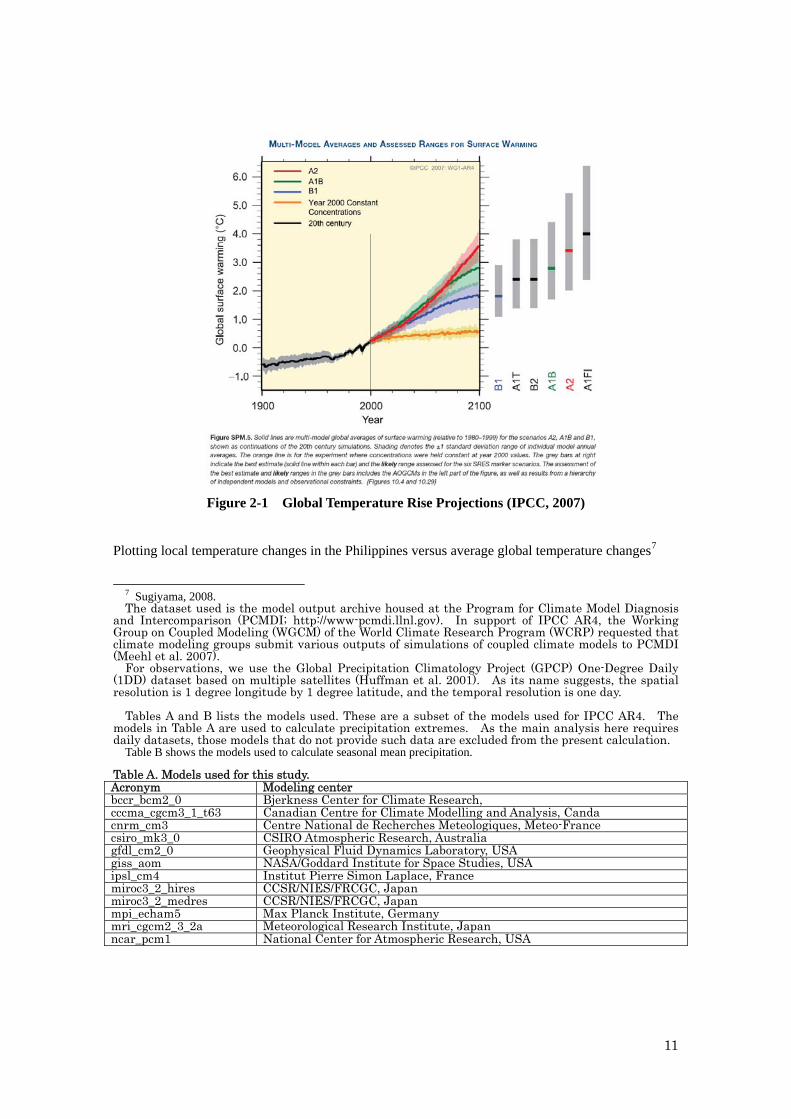
Figure 2-1 Global Temperature Rise Projections (IPCC, 2007)
Plotting local temperature changes in the Philippines versus average global temperature changes7
7 Sugiyama, 2008. The dataset used is the model output archive housed at the Program for Climate Model Diagnosis
and Intercomparison (PCMDI; http://www-pcmdi.llnl.gov). In support of IPCC AR4, the Working Group on Coupled Modeling (WGCM) of the World Climate Research Program (WCRP) requested that climate modeling groups submit various outputs of simulations of coupled climate models to PCMDI (Meehl et al. 2007).
For observations, we use the Global Precipitation Climatology Project (GPCP) One-Degree Daily (1DD) dataset based on multiple satellites (Huffman et al. 2001). As its name suggests, the spatial resolution is 1 degree longitude by 1 degree latitude, and the temporal resolution is one day.
Tables A and B lists the models used. These are a subset of the models used for IPCC AR4. The models in Table A are used to calculate precipitation extremes. As the main analysis here requires daily datasets, those models that do not provide such data are excluded from the present calculation.
Table B shows the models used to calculate seasonal mean precipitation. Table A. Models used for this study. Acronym Modeling center bccr_bcm2_0 Bjerkness Center for Climate Research, cccma_cgcm3_1_t63 Canadian Centre for Climate Modelling and Analysis, Canda cnrm_cm3 Centre National de Recherches Meteologiques, Meteo-France csiro_mk3_0 CSIRO Atmospheric Research, Australia gfdl_cm2_0 Geophysical Fluid Dynamics Laboratory, USA giss_aom NASA/Goddard Institute for Space Studies, USA ipsl_cm4 Institut Pierre Simon Laplace, France miroc3_2_hires CCSR/NIES/FRCGC, Japan miroc3_2_medres CCSR/NIES/FRCGC, Japan mpi_echam5 Max Planck Institute, Germany mri_cgcm2_3_2a Meteorological Research Institute, Japan ncar_pcm1 National Center for Atmospheric Research, USA
11

predicted by The B1 and A1FI scenarios and fitting a regression line to them as presented in Fig. 2-2
shows a high correlation between the global mean temperature rise and the local temperature rise in
the Philippines. In fact, the local temperature increase in the Philippines is about 90 % of the global
average temperature increase.
△T Philippines [K]
Circles represent different models, with red ones denoting the SRES A1B scenario and blue ones corresponding to SRES B1.
Figure 2-2 Relationship between Local and Global Temperature Changes
Table B. Models used for calculations of mean precipitation change.
Modeling Center Model Bjerknes Centre for Climate Research, Norway BCM2.0 Canadian Centre for Climate Modelling and Analysis, Canada CGCM3.1 Canadian Centre for Climate Modelling and Analysis, Canada CGCM3.1(hires) Centre National de Recherches Meteorologiques, France CNRM-CM3 CSIRO Atmospheric Research, Australia CSIRO Mk3.0 Geophysical Fluid Dynamics Laboratory, USA GFDL_CM2.0 Geophysical Fluid Dynamics Laboratory, USA GFDL_CM2.1 NASA/Goddard Institute for Space Studies, USA GISS AOM NASA/Goddard Institute for Space Studies, USA GISS ModelE Institute of Atmospheric Physics, China FGOALS1.0_g National Institute of Geophysics and Volcanology, Italy INGV-SXG Iistitute for Numerical Mathematics, Russia INMCM3.0 Institut Pierre Simon Laplace, France IPSL-CM4_v1 CCSR/NIES/FRCGC, Japan MIROC3.2(hires) CCSR/NIES/FRCGC, Japan MIROC3.2(medres) University of Bonn, Germany ECHO-G Max Planck Institute for Meteorology, Germany ECHAM5/MPI-OM Meteorological Research Institute, Japan MRI-CGCM2.3.2a National Center for Atmospheric Research, USA CCSM3.0 National Center for Atmospheric Research, USA PCM Hadley Center, Met Office, UK HadCM3 Hadley Center, Met Office, UK HadGEM1
12

2.1.5 Precipitation
Local precipitable water, the source of the intense rainfall that is a main cause of storm events,
increases in the Philippines in the modeled scenarios. The increase could be as much as 8 % of the
local temperature rise in degrees Kelvin. This ratio was determined by plotting changes in local
precipitable water increases versus local temperature increases in the Philippines. The results of a
regression analysis relating them are presented in Fig. 2-3.8
△WPrecip [%]
Changes of precipitable water for Manila
Circles represent different models, with red ones denoting the SRES A1B scenario and blue ones corresponding to SRES B1.
Figure 2-3 Relationship between Changes in Precipitable Water and Temperature Increase in
the Philippines
Increases in (peak) precipitable water are then translated into increased (peak) water discharge rates
for river flood simulation. This means that in the simulations, water discharge at given recurrence
periods increases. In this report, 10-year, 30-year, and 100-year recurrence periods are set as target
flood levels. To explain the shift caused by climate change, one way is to decrease the number of
years in the recurrence periods and the other way is to increase the peak precipitation, but for this
report we increase the level of peak precipitation.
2.1.6 Sea level rise
Fifty percent of the sea level rise for the year 2100 as projected in IPCC AR4 is assumed for the year
2050. Sea level, as a boundary condition for flood simulation can be estimated by adding tidal
factors. High tidal level is a critical determiner of flooding. In consideration of future global climate
change, sea level rise must be added to the high tide level. Therefore, the Mean Spring High High
Water (MSHHW) level in Manila Bay is set as the baseline level for flood simulation, and sea level
8 Ibid.
13

rises predicted from the global warming scenarios are placed above that level.
For a global average temperature rise of 2 degrees, the global sea level is estimated to have risen an
average of 29 cm in 2050.9 In Metro Manila, local sea levels would rise and flooding in some parts
may intensify as global warming progresses, while droughts may become more severe in other
locations.
2.1.7 Storm surge
The historic typhoon that caused the largest rise above general sea level was used as the model
typhoon. Typhoons with the lowest pressures or strongest winds do not always cause the highest
storm surge. After choosing the model typhoon, its at-sea winds and barometric pressure field were
calculated, which were then used to estimate the storm surge. In addition, an intensified storm surge
case (the model typhoon with 10% lower central pressure) was calculated.10 Table 2-1 shows the
maximum calculated surge based on a typhoon that hit the islands in November 1957.
Table 2-1 Maximum Simulated Tidal Deviation Caused by Storm Surge in Manila Bay
Simulated storm Maximum water
level increase
Reproduction of Historical Typhoon 0.91 m
10 % Increase over Historical Typhoon 1.00 m
2.1.8 Land subsidence
Projecting land subsidence in space and time is very difficult, since its occurrence and intensity
depend on local geological settings, not on climate change. Future land subsidence in the Metro
Manila area is not considered in the simulations due to data constraint.
2.1.9 Climate- Hydrological matrix
The matrix below is a summary of climatic-hydrological conditions for the SQ, B1, and A1FI
scenarios. Return periods of 10, 30, and 100 years are considered. These conditions provide a basis
for flood impact analysis for this entire study, including analyses for other cities.
9 CTI, “Study on Climate Impact Adaptation and Mitigation in Asian Coastal Mega Cities,” March 2008. 10 Ibaraki University, “Prediction of storm surges for Manila, Bangkok and Mekong Delta.” 31 July, 2008.
14

Table 2-2 Global Climate Scenario Settings and Conditions for Inundation Simulations for Metro Manila11
Simulation Case Temperature Rise (°C) (downscaled)
Sea Level Rise (cm) (global)
Increase Rate of Rainfall (%)
Storm Surge Height (m) in Manila Bay
1 Status quo climate 0 0 0 0.91
2 B1 scenario with stormlevel at status quo
1.17 19 9.4 0.91
3 B1 scenario with strengthened storm level
1.17 19 9.4 1.00
4 A1FI scenario with storm level at status quo
1.80 29 14.4 0.91
5 A1FI scenario with strengthened storm level
1.80 29 14.4 1.00
2.1.10 Flood Control Infrastructure Scenarios
In choosing an infrastructure scenario, this report focuses on flood control. During the past several
decades, the Philippine government has been implementing a series of strategic flood control
infrastructure projects protecting Metro Manila, covering the Pasig-Marikina River Basin, the
KAMANAVA (Kalookan- Malabon- Navotas- Valenzuela) Area, and the area west of Mangahan.
Recently implemented flood control projects are included in those identified in the JICA 1990
Master Plan. In addition, the government has several other flood control projects planned that will
complete the implementation of the priority projects identified in the 1990 Master Plan. These
projects are summarized in Table 2-3 and their locations around the Metro Manila area are shown in
Fig. 2-4.
11 JICA, Ibid.
15

Table 2-3 Flood Control Studies and Projects in Metro Manila
Flood Control Studies and Projects Funding Source Northern Section KAMANAVA Area Flood Control and Drainage System Improvement Project
JICA (PH-P212, Special Yen Loan)
Feasibility Study on Valenzuela-Obando-Meycauayan Area Drainage System Improvement and Related Works Project
JICA (F/S: Completed in March 2001)
Central Section Metro Manila Flood Control Project – West of Mangahan Floodway
JICA (PH-P179, 21st Yen Loan)
Pasig-Marikina River Channel Improvement Project JICA (D/D: 23rd Yen Loan, Construction I: 26th Yen STEP Loan)
San Juan River Flood Control Project JICA (F/S: Completed in 2002) Study on Drainage Improvement in the Core Area of Metropolitan Manila
JICA (Completed in March 2005)
Feasibility Study on Marikina-Cainta Area (East of Mangahan) Flood Control Project
JICA (Pre-F/S: Completed in March 2007)
Southern Section Feasibility Study on the Integrated Drainage Improvement Project in Ninoy Aquino International Airport and its Vicinity
JETRO (Completed in March 2004)
16

Fig. 2-4 Flood Control Studies/Projects in Metro Manila
In order to identify necessary adaptation measures, two flood control infrastructure scenarios were
considered. The first is the existing infrastructure level, including projects completed by base year
2008. The second is the 1990 Master Plan scenario, which assumes continued implementation of
projects identified in the 1990 Master Plan until the year 2050. Consequently, the two flood control
infrastructure scenarios are added to the Climate-Hydrological Matrix below (Table 2-4).
17

Table 2-4. Climate-Hydrologic-Infrastructure scenarios: Summary
Cases Return
period
Climate Hydrological
(storm surge)
Infrastructure
EX: existing
MP:1990 M/P
Adaptation
100-SQ-cu-EX SQ current EX -
100-SQ-cu-MP current MP -
100-B1-st-EX-wD B1 strengthened EX with Dam
100-B1-st-MP-wD strengthened MP with Dam
100-A1FI-st-EX-wD A1FI strengthened EX with Dam
100-A1FI-st-MP-wD
100 years
strengthened MP with Dam
30-SQ-cu-EX SQ current EX -
30-SQ-cu-MP current M/P -
30-B1-st-EX-wD B1 strengthened EX with Dam
30-B1-st-EX-nD strengthened EX no Dam
30-B1-st-MP-wD strengthened MP with Dam
30-B1-st-MP-nD strengthened MP no Dam
30-A1FI-st-EX-wD A1FI strengthened EX with Dam
30-A1FI-st-EX-nD strengthened EX no Dam
30-A1FI-st-MP-wD strengthened MP with Dam
30-A1FI-st-MP-nD
30 years
strengthened MP no Dam
10-SQ-cu-EX SQ current EX -
10-SQ-cu-MP current M/P -
10-B1-st-EX-nD B1 strengthened EX no Dam
10-B1-st-MP-nD strengthened MP no Dam
10-A1FI-st-EX-nD A1FI strengthened EX no Dam
10-A1FI-st-MP-nD
10 years
strengthened MP no Dam
The case code consists of 5 sets of alphanumeric symbols. The first set (100, 30, 10) indicates the
assumed return period; the second set (SQ, B1, A1FI) shows the climate scenario; the third (cu, st)
tells whether storm surge was set at the current (cu) or strengthened level (st). In the fourth set, EX
or MP denotes the infrastructure scenario. Lastly, wD/nD means with or without the Maikina Dam.
2.1.11 Hydrologic Modeling
For each climate-hydrologic-infrastructure scenario described above, a flood simulation was
18

conducted using a suitable hydrologic model for each river basin or drainage area, considering the
topography and flooding type. The interface between the climate scenarios and the hydrologic
modeling is increased peak precipitation that affects the hydrodynamics of the river. Depending on
the target area, sea level rise, storm surge in Manila Bay or the Laguna de Bay lake water level were
added as variables to produce the flood map. Flood inundation model setup and information related
to each target area are described in the following sub-sections.
2.2 Flood Analysis Areas
2.2.1 Pasig-Marikina River Basin
The Pasig-Marikina River basin was divided into two parts from a flooding viewpoint, the Marikina
River basin and the Pasig-San Juan River basin, as illustrated in Fig. 2-5.
2.2.2 Marikina River Basin
The upper reaches of the Pasig River are called the Marikina River. Considering the extent of
previous and computed probable flooding, the stretch upstream from the diversion point to the
Napindan channel is regarded as the Marikina River in this study. The floodwater flows down, being
confined to the valley-bottom plain in this stretch. Therefore, a one-dimensional unsteady flow
model can simulate the flooding mechanism there. The MIKE 11 model was used to do these
computations. The following basic data are used for the hydraulic simulation:
River channel survey results from the Pasig-Marikina River Improvement Project were used for
river cross-section data.
Manning’s roughness coefficients of 0.03 and 0.10 were used for the river channel and
floodplain, respectively.
19

West Mangahan
Marikina Pasig-SanJuan
Figure 2-5 Pasig-Marikina River System
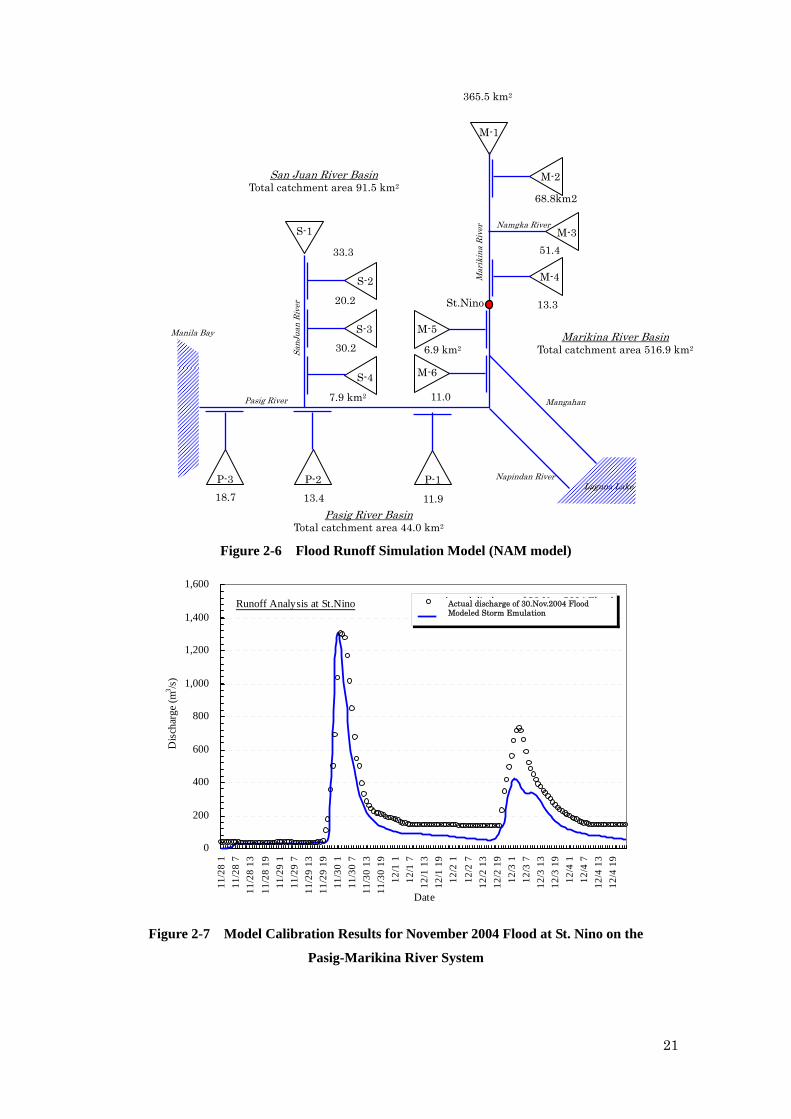
The flood runoff simulation model of the Pasig-Marikina River system is illustrated in Fig. 2-6.
Flood runoff is computed using the NAM Model, which is one of the simulation components of the
MIKE 11 model. Its computation mechanism is similar to the Tank Model. Flood inundation
simulation is done directly by the MIKE 11 model using flood runoff computed by the NAM Model
for the Marikina River basin. In the Pasig River basin simulation, flood runoffs of the Pasig, and San
Juan rivers and the outflow of the Marikina River are given to the Pasig model as upstream boundary
conditions.
The model parameters of the NAM Model were calibrated by adjusting the model to match the
November 2004 flood at St. Nino station. The model calibration results are shown in Fig. 2-7.
20
365.5 km2
San Juan River Basin Total catchment area 91.5 km2
Manila Bay
33.3
Mar
ikin
a R
iver
S-1
SanJ
uan
Riv
er
Pasig River 7.9 km2
S-4
30.2
S-3
20.2
S-2
P-3 P-2
St.Nino
M-5 Marikina River Basin
Total catchment area 516.9 km2
Napindan River Laguna Lake
Mangahan
P-1
M-6
11.0
6.9 km2
M-4
Namgka River
51.4
M-3
68.8km2
M-2
M-1
13.3
18.7 13.4 11.9
Pasig River Basin Total catchment area 44.0 km2
Figure 2-6 Flood Runoff Simulation Model (NAM model)
Runoff Analysis at St.Nino
0
200
400
600
800
1,000
1,200
1,400
1,600
11/2
8 1
11/2
8 7
11/2
8 13
11/2
8 19
11/2
9 1
11/2
9 7
11/2
9 13
11/2
9 19
11/3
0 1
11/3
0 7
11/3
0 13
11/3
0 19
12/1
1
12/1
7
12/1
13
12/1
19
12/2
1
12/2
7
12/2
13
12/2
19
12/3
1
12/3
7
12/3
13
12/3
19
12/4
1
12/4
7
12/4
13
12/4
19
Date
Dis
char
ge (
m3 /s
)
Actual discharge of 30.Nov.2004 FloodRe-creation calculation
Actual discharge of 30.Nov.2004 Flood Modeled Storm Emulation
Figure 2-7 Model Calibration Results for November 2004 Flood at St. Nino on the
Pasig-Marikina River System
21

2.2.3 Pasig and San Juan River Basin
Overbanking floodwater spreads out toward the northern low-lying area in a stretch of the Pasig
River. A two-dimensional unsteady flow model is appropriate for this stretch. The following basic
data are used for the hydraulic simulation:
A Digital Elevation Model (DEM) was adopted, based on a 100 m grid, using data produced by
the Pasig-Marikina River Improvement Project. The DEM elevations along the river course were
adjusted based on cross-sectional survey results from that project.
The floodplain’s roughness coefficient was determined using land uses and principal values
from Japan as reference points; dry fields have a coefficient of 0.060; roads, 0.047; and other
uses, 0.030. A coefficient of 0.030 was used for the Pasig and San Juan River channels.
Large-scale pumping stations are incorporated into the model as flood control facilities.
In the Pasig River system storm surge and flood peaks can be treated experimentally as independent
phenomena. Thus the lower boundary condition of Pasig River flooding is the tidal fluctuation at
MSHHW without storm surge as tabulated in Table 2-5. Since the tidal peak with storm surge
exceeds the height of the design dike crown and storm surge can be regarded as an independent
phenomenon from flood peak, the tidal hydrograph shown in Fig. 2-8 was used to simulate flood
inundation as the lower boundary condition. The tidal hydrograph was adjusted so that its peak
coincides with the flood runoff peak as presented in Fig. 2-8. In addition, the storm surge
hydrographs for the simulation cases enumerated in Table 2-5 are shown in Fig. 2-9.
Table 2-5 Relevant Meteo-hydrological Data in Simulation Cases
Simulation Case Temperature Rise (oC)
Sea Level Rise (cm)
Increase in
Rainfall Rate (%)
Sea Level Conditions without
Storm Surge [A] (EL.m)
Sea Level Conditions with
Storm Surge (EL.m)
1 Status quo 0 0 0 11.40 (=11.4+0)
12.31 (=A1+0.91)
2 B1 with storm level at status quo
1.17 19 9.4 11.59 (=11.4+0.19)
12.50 (=A2+0.91)
3 B1 with strengthened storm level
1.17 19 9.4 11.59 (=11.4+0.19)
12.59 (=A3+1.00)
4 A1FI with storm level at status quo
1.80 29 14.4 11.69 (=11.4+0.29)
12.60 (=A4+0.91)
5 A1FI with strengthened storm level
1.80 29 14.4 11.69 (=11.4+0.29)
12.69 (=A5+1.00)
Note 1) Projected temperature rise in the Philippine is about 90 % of global temperature rise. 2) Increase in rainfall rate is estimated at around 8 % per degree Kelvin of temperature rise. 3) In the no-storm surge sea level condition column, the first term indicates the Mean Spring High High Water level in Manila Bay; and the second term indicates sea level rise by global warming. In the sea level condition with storm surge column, the second term indicates tidal deviation due to storm surge. The figures in the table are the local values for the mouth of the Pasig River.
22

Tidal Level at Manila Bay
10.000
10.500
11.000
11.500
12.000
12.500
13.000
13.500
14.000
14.500
15.000
8/24
08/
24 2
8/24
48/
24 6
8/24
88/
24 1
08/
24 1
28/
24 1
48/
24 1
68/
24 1
88/
24 2
08/
24 2
28/
25 0
8/25
28/
25 4
8/25
68/
25 8
8/25
10
8/25
12
8/25
14
8/25
16
8/25
18
8/25
20
8/25
22
8/26
08/
26 2
8/26
48/
26 6
8/26
8
Sea-
Lev
el (
m)
0
200
400
600
800
1000
1200
1400
1600
1800
2000
Dis
char
ge(m
3/s
)
Status Quo
B1
A1FI
Discharge(Status quo)
Figure 2-8 Tidal Hydrograph for Simulation of Flood Inundation in the Pasig River
A1FI
A1FI with strengthened storm
B1
B1 with strengthened storm
Status Quo
8/24 08/24 2 8/24 4 8/24 6 8/24 8 8/24 108/2 4 128/24 148/24 168/24 188/24 208/24 228/25 08/25 28/25 48/25 68/25 88/25 108/25 128/25 148/25 168/25 188/25 208/25 228/26 0 8/26 2 8/26 4 8/26 6 8/26 8
13.500
13.000
12.500 Sea-Level (m)
12.000
11.500
11.000
Storm Surge at Manila Bay
Figure 2-9 Tidal Hydrograph of Storm Surge at the Pasig River mouth
As described earlier for the Marikina River Basin, the boundary conditions for the Pasig River,
including flood runoff inflows are summarized in Fig. 2-10.
23

Discharge
Pasig River
San
Juan
Riv
er
Inflow at .5 km, 3.0 km, 3.5 km, 4.7 km, 5.9 km, 6.3 km, 7.1 km, 8.3 km, 9.5 km
Time
10.5 km
Time
Discharge
Manila Bay
Discharge from upper Marikina River
Discharge
16.9 km
Time
Tidal level at Manila bay
Time
0.0 km S.L
Discharge
Inflow at 1.5 km,2.2 km,3.2 km,3.4 km,4.7 km,5.0 km,8.0 km,10.8 km,12.3 km,13.7 km,14.2 km
Time
Figure 2-10 Boundary Conditions for Simulation of Flood Inundation of the
Pasig River
2.2.4 West of Mangahan Area
The West of Mangahan drainage area has flat topography and is a typical interior-flood-prone area
along the Laguna de Bay Lake. In that area, there are several drainage channels and rivers. Storm
rainfall and high water levels in the lake bring on floods, and storm water runoff is stranded due to
the high water. To improve the drainage conditions, projects employing a combination of a
lakeshore dike to prevent inflow from the lake, and pumping stations to discharge the storm water
runoff have been proposed. In due consideration of these conditions, a pond model was employed
for flood inundation simulation in this area.
Figure 2-11 West of Mangahan Drainage Area
24

The drainage area is divided into two basins, WM-1 and WM-2, as illustrated in Figure 2-11. Flood
runoff is computed using the rational formula in the same manner as for drainage improvement plans.
The estimates are summarized below, and flood hydrographs are shown in Figure 2-12.
Table 2-6 Rational Formula Parameters and Results of Flood Runoff Simulation
WM-1 WM-2
Area 13.49 km2
From DEM elevation data 25.52 km2
From DEM elevation data Runoff Coefficient* 0.5 0.5 Flow Velocity* 0.90 m/s 0.90 m/s
Concentration Time 110 min Longest channel length = 5800 m 5800 m/0.9 m/s /60 s/min=107.4 min
160 min Longest channel length = 8700 m 8700m/0.9 m/s/ 60 s/min = 161.1 min
Boundary Condition (Rainfall)
Existing: probability 1/10 B1: probability 1/10 × 9.4% increase A1FI: probability 1/10 × 11.4% increase
Peak Discharge) Status quo: 111.9 m3/s B1: 122.0 m3/s A1FI: 128.1 m3/s
Status quo: 176.2 m3/s B1: 192.1 m3/s A1FI: 201.6 m3/s
*Detailed Engineering Design of the North Laguna Lakeshore Urgent Flood Control and Drainage Project
25

Hydro graph (WM-1)
0
20
40
60
80
100
120
140
160
180
200
220
240
1:00
2:00
3:00
4:00
5:00
6:00
7:00
8:00
9:00
10:0
011
:00
12:0
013
:00
14:0
015
:00
16:0
017
:00
18:0
019
:00
20:0
021
:00
22:0
023
:00
24:0
01:
002:
003:
004:
005:
006:
007:
008:
009:
0010
:00
11:0
012
:00
13:0
014
:00
15:0
016
:00
17:0
018
:00
19:0
020
:00
21:0
022
:00
23:0
024
:00
Dis
char
ge (
m2 /s
)
Status quo
B1 Case
A1FI Case
Hydrograph WM1
Hydro graph (WM-2)
0
20
40
60
80
100
120
140
160
180
200
220
240
1:00
2:00
3:00
4:00
5:00
6:00
7:00
8:00
9:00
10:0
011
:00
12:0
013
:00
14:0
015
:00
16:0
017
:00
18:0
019
:00
20:0
021
:00
22:0
023
:00
24:0
01:
002:
003:
004:
005:
006:
007:
008:
009:
0010
:00
11:0
012
:00
13:0
014
:00
15:0
016
:00
17:0
018
:00
19:0
020
:00
21:0
022
:00
23:0
024
:00
Dis
char
ge (
m2 /s
)
Status quo
B1 Case
A1FI Case
Hydrograph WM2
Fig. 2-12 Flood Hydrographs for the West of Mangahan Area
For the pond model, the water level-area-storage volume (H-A-V) relationship was developed using
a digital elevation model (DEM) as shown in Fig. 2-13.
26

Elevation - Storage Volume
9.0
10.0
11.0
12.0
13.0
14.0
15.0
16.0
0 10,000,000 20,000,000 30,000,000 40,000,000 50,000,000
Volume(m3)
Ele
vatio
n (m
)
West Mangahan 1
West Mangahan 2
Elevation - Inundation Area
9.0
10.0
11.0
12.0
13.0
14.0
15.0
16.0
0 5,000,000 10,000,000 15,000,000 20,000,000
Inundation area(m2)
Ele
vatio
n (m
)
West Mangahan 1
West Mangahan 2
Figure 2-13 Water Level-Area-Storage Volume (H-A-V) Relationship in the area West of
Mangahan
27

2.2.5 KAMANAVA Area
The KAMANAVA area experiences storage-type floods. The model shown in Fig. 2-14 was
constructed to simulate storage type inundation. In the KAMANAVA area, there are several esteros
(primary open drainage channels), drainage mains (closed or piped channels) and outfalls to rivers.
Floods are brought on by storm rainfall and high tides in Manila Bay. Storm water runoff is stranded
due to the high tide. Improvement of the drainage condition by employing a combination of a ring
levee (polder dike) to prevent inflow from Manila Bay and pumping stations to discharge the storm
water runoff is proposed. The MOUSE-DHI program was used in the planning stages of the
KAMANAVA Project, and the same model was used in this study assuming the conditions outlined
above.
Figure 2-14 Schematic Diagram of KAMANAVA Area Flood Analysis
28

29
The KAMANAVA drainage Area is divided into seven hydraulically independent sub-drainage areas
as shown below:
Table 2-7 KAMANAVA Area Sub-Drainage Basins
Name of Drainage Area Area (ha.)
1 Bangkulasi 75.4 2 Catmon 355.5 3 Spine 173.1 4 Maypajo 241.2 5 North Navotas 475.5 6 Dampalit 233.1 7 South Pinagkabalian 254.6
Total 1,808.4
Figure 2-15 KAMANAVA Area Sub-Drainage Basins
.
Based on the hydrodynamic analysis described above, the study produced simulation maps showing
the different spatial spreads and inundation depths of flooding expected in the metropolis due to the
different climate-hydrologic-infrastructure scenarios (Figure 2-16). Another set of simulation maps
illustrate the inundation duration(Figure 2-17).
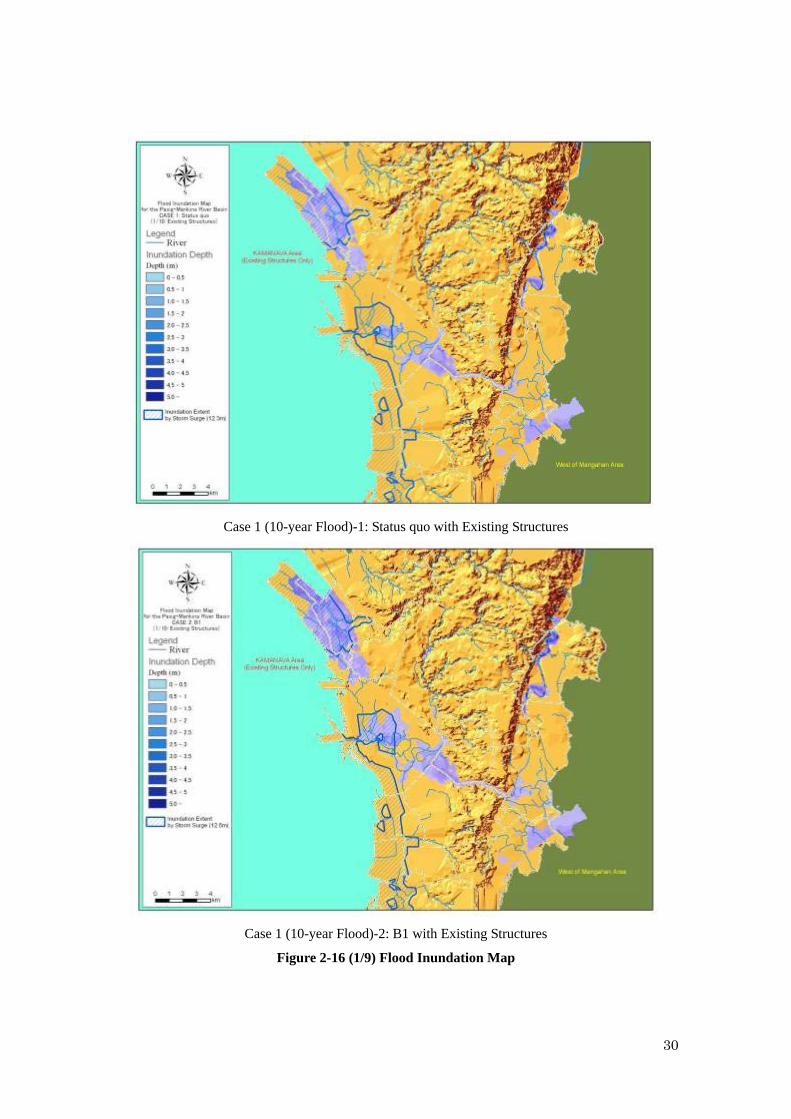
Case 1 (10-year Flood)-1: Status quo with Existing Structures
Case 1 (10-year Flood)-2: B1 with Existing Structures
Figure 2-16 (1/9) Flood Inundation Map
30

Case 1 (10-year Flood)-3: A1FI with Existing Structures
Case 1 (10-year Flood)-4: Status quo with Improvements as per the 1990 Master Plan
Figure 2-16 (2/9) Flood Inundation Map
31

Case 1 (10-year Flood)-5: B1 with Improvements as per the 1990 Master Plan
Case 1 (10-year Flood)-6: A1FI with Improvements as per the 1990 Master Plan
Figure 2-16 (3/9) Flood Inundation Map
32

Case 2 (30-year Flood)-1: Status quo with Existing Structures
Case 2 (30-year Flood)-2: B1 with Existing Structures
Figure 2-16 (4/9) Flood Inundation Map
33

Case 2 (30-year Flood)-3: A1FI with Existing Structures
Case 2 (30-year Flood)-4: Status quo with Improvements as per the 1990 Master Plan
Figure 2-16 (5/9) Flood Inundation Map
34

Case 2 (30-year Flood)-5: B1 with Improvements as per the 1990 Master Plan
Case 2 (30-year Flood)-6: A1FI with Improvements as per the 1990 Master Plan
Figure 2-16 (6/9) Flood Inundation Map
35

Case 3 (100-year Flood)-1: Status quo with Existing Structures
Case 3 (100-year Flood)-2: B1 with Existing Structures
Figure 2-16 (7/9) Flood Inundation Map
36

Case 3 (100-year Flood)-3: A1FI with Existing Structures
Case 3 (100-year Flood)-4: Status quo with Improvements as per the 1990 Master Plan
Figure 2-16 (8/9) Flood Inundation Map
37

Case 3 (100-year Flood)-5: B1 with Improvements as per the 1990 Master Plan
Case 3 (100-year Flood)-6: A1FI with Improvements as per the 1990 Master Plan
Figure 2-16 (9/9) Flood Inundation Map
38
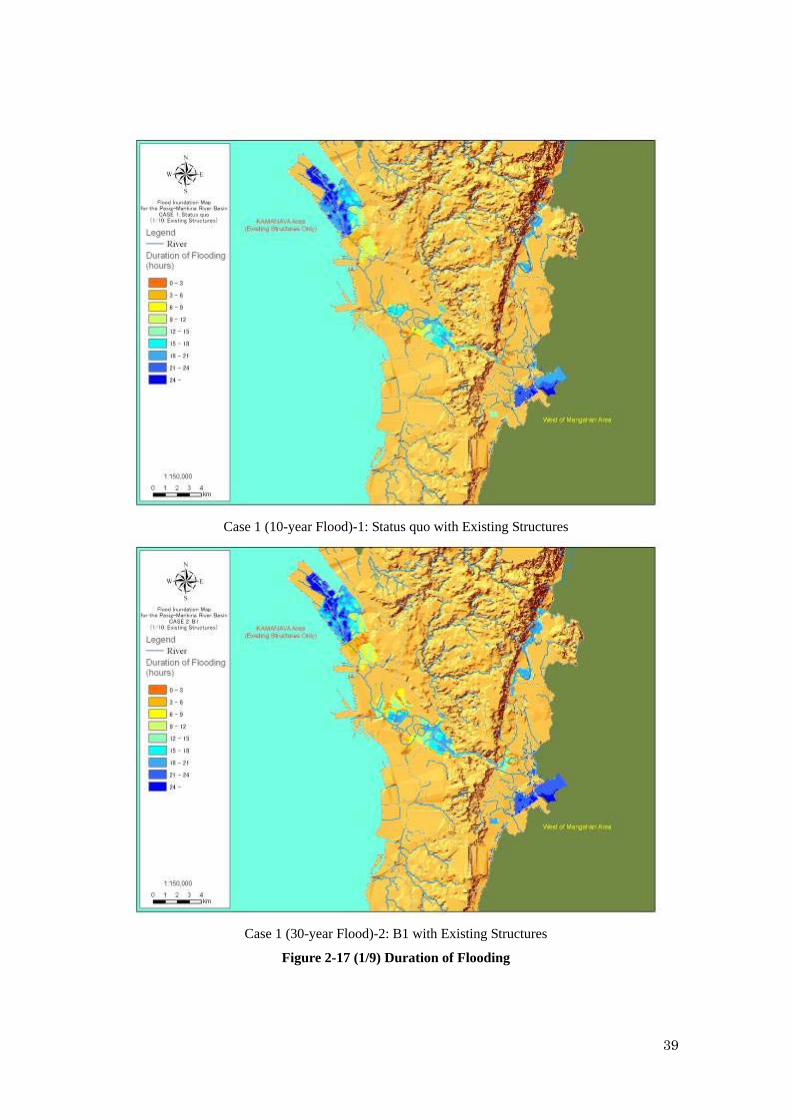
Case 1 (10-year Flood)-1: Status quo with Existing Structures
Case 1 (30-year Flood)-2: B1 with Existing Structures
Figure 2-17 (1/9) Duration of Flooding
39

Case 1 (10-year Flood)-3: A1FI with Existing Structures
Case 1 (10-year Flood)-4: Status quo with Improvements as per the 1990 Master Plan
Figure 2-17 (2/9) Duration of Flooding
40

Case 1 (10-year Flood)-5: B1 with Improvements as per the 1990 Master Plan
Case 1 (10-year Flood)-6: A1FI with Improvements as per the 1990 Master Plan
Figure 2-17 (3/9) Duration of Flooding
41

Case 2 (30-year Flood)-1: Status quo with Existing Structures
Case 2 (30-year Flood)-2: B1 with Existing Structures
Figure 2-17 (4/9) Duration of Flooding
42

Case 2 (30-year Flood)-3: A1FI with Existing Structures
Case 2 (30-year Flood)-4: Status quo with Improvements as per the 1990 Master Plan
Figure 2-17 (5/9) Duration of Flooding
43

Case 2 (30-year Flood)-5: B1 with Improvements as per the 1990 Master Plan
Case 2 (30-year Flood)-6: A1FI with Improvements as per the 1990 Master Plan
Figure 2-17 (6/9) Duration of Flooding
44

Case 3 (100-year Flood)-1: Status quo with Existing Structures
Case 3 (100-year Flood)-2: B1 with Existing Structures
Figure 2-17 (7/9) Duration of Flooding
45
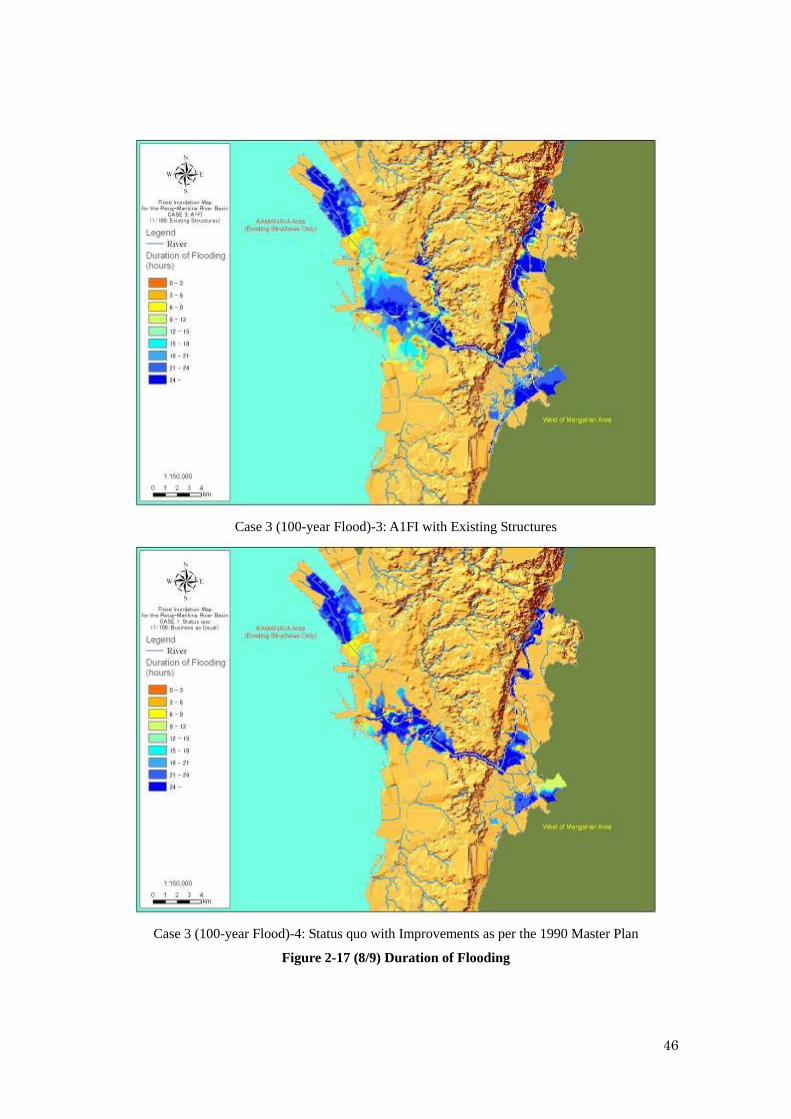
Case 3 (100-year Flood)-3: A1FI with Existing Structures
Case 3 (100-year Flood)-4: Status quo with Improvements as per the 1990 Master Plan
Figure 2-17 (8/9) Duration of Flooding
46

47
Case 3 (100-year Flood)-5: B1 with Improvements as per the 1990 Master Plan
Case 3 (100-year Flood)-6: A1FI with Improvements as per the 1990 Master Plan
Figure 2-17 (9/9) Duration of Flooding

48
Chapter 3 Methodology Part Two: Socio-Economic Analysis to identify tangible damages
avoided by implementation of planned flood control projects
3.1 General framework
This chapter describes the socioeconomic impact analyses used to understand the characteristics and
magnitude of the damage caused by floods expected in year 2050, including damage caused by climate
change. The benefits of flood control projects, measured as the damage avoided by implementing them,
are estimated based on the SQ, B1, and A1FI climate scenarios, assuming two infrastructure conditions,
the “existing infrastructure (EX)” and “1990 Master Plan (MP)”. The MP condition assumes the
completion of infrastructure improvements planned based on current climate conditions1, while the EX
condition assumes that present infrastructure conditions remain unchanged until the year 2050. The
scenarios are further classified into three levels by the return periods (10, 30 and 100 years) of the
design floods. In total, there are 18 (3 climate scenarios X 2 infrastructure states X 3 return periods)
scenarios to be considered.
3.2 Benefits
3.2.1 Benefit characteristics
Benefits, for the sake of this analysis are taken to be the future aggregate-level flood damage avoided by
implementing flood control infrastructure improvements. The types of benefits included in this study
go beyond conventional flood impact assessments that deal with direct losses only. For example, in
conventional analyses of direct losses, damage to buildings is converted into monetary terms based on
simple information such as flood depth and building use. Such direct impacts are limited to damage
caused by physical contact of the floodwater with humans, property and other objects.
Flooding, however, interacts with the patterns of human activities in the metropolis in more complex
ways. Not all tangible losses are direct, because floods not only affect structures themselves but also
their contents and the activities undertaken within them. Examples of such losses are disruption of
traffic and business. Such secondary impacts are damages induced by the direct impacts and may
occur outside the flood event in space or time. In addition, there are intangible impacts such as health
hazards. Table 3-1 itemizes the types of damage incurred by flooding.
1 Details of the infrastructure plan as per the 1990 Master Plan depend on the return period. For example, for a return period of 30 years, the flood infrastructure scenario does not include the Marikina Dam, but the scenario for a 100-year return period does assume its completion.

49
Table 3-1 Tangible and Intangible Flood Losses and Damages
Tangible Loss
Intangible Loss
(Currently not possible to measure in
monetary terms)
Form of Flood
Damage or
Loss Private Sector Public Sector Private Sector Public Sector
Direct
Cost of cleaning,
repairing, or replacing
residential, commercial,
and industrial buildings,
contents and land.
Cost of cleaning,
repairing or replacing
contents and cost of lost
crops and livestock.
Cost of repairing or
replacing roads, bridges,
culverts and dams.
Cost of repairing
damage to stormwater
systems, sanitary
sewerage systems and
other utilities.
Cost of restoring parks
and other public places.
Loss of life.
Health hazards.
Psychological
stress endured
during and after
flooding.
Disruption of
normal community
activities.
Loss of
archaeological sites.
Indirect
Cost of temporary
evacuation and
relocation.
Lost wages.
Lost production and
sales.
Incremental cost of
transportation.
Cost of post-flood
floodproofing.
Cost of purchasing and
storing flood response
equipment and materials.
Incremental costs to
governmental units as a
result of flood response
measures.
Cost of post-flood
engineering and
planning studies and of
implementing structural
and non-structural
management measures.
Cost of purchasing and
storing flood response
equipment and
materials.
Reluctance by
individuals to
inhabit flood-
prone areas,
thereby
depreciating
riverine or flood
prone area
property values
by an unknown
amount.
Psychological
stress caused by
possibility of
future floods.
Reluctance by
business interests to
continue
development of
flood-prone
commercial and
industrial areas,
adversely affecting
the community tax
base.
Source: Adapted from Southeastern Wisconsin Regional Planning Commission (1976) and Green et al., (1983)
In this report, direct and tangible losses are first assessed, such as damage to buildings and roads. Direct
impacts on public utilities such as the power supply and railways are discussed in this chapter but not
included in the estimates of total damage due to difficulties in value aggregation. Indirect and tangible
losses are then assessed where possible with available data. For indirect and tangible losses, this report
combines the incremental cost of transportation (vehicle operating cost (VOC) and incremental time

50
costs), lost wages and lost sales brought about by the flooding. The intangible losses (in this report,
health hazards) are presented separately in the next chapter. Figure 3-1 shows the process of impact
assessment in schematic form.
Figure 3-1 Impact Assessment Flowchart
3.2.2 Base data
This section shows the base data related to assessing direct impacts on population, buildings, the power
supply, railroads, water, roads, and vehicles. The analysis relies on extensive GIS data collected as
shown in the list below. The basic parameters for analyzing the impacts of climate change in the
metropolis are the spatial spread, water depth, and duration of flooding, which rely heavily on GIS
analysis.
Infra structure

51
Table 3-2 List of GIS Data Targeted for Collection
Field Item Data Collected
Generation Location of generation facilities, boundaries, year of completion, generation volumes, cost of generation
Distribution Location of distribution towers, boundaries, height of towers, year of completion, distribution volume
Transformation Location of transformer facilities, boundaries, year of completion, throughput volume
Electricity / Power
Distribution network, etc. Distribution route (polyline) and coverage, materials, year installed, distribution line capacities
Road Alignment, ROW and width of carriageways, height of embankments, surface materials, year of completion, traffic volume by vehicle type
Railway2/ Alignment, ROW and track line, height of embankments, year completed, transport capacity
Bridge Location, shape line, boundaries, width, girder height, structure, material, year completed, traffic volume by vehicle type
Transportation and Traffic
Port, Airport2/, etc. Location, boundary, year completed, number of carriers/airplanes, volume of cargo handling, number of warehouses, capacity of warehouses
Purification plant Location, boundaries, area, year completed, volume of water intake/distribution
Water pipe Line shape, diameter, material, year completed, elevation of pipe
Pumping station Location, boundaries, area, year completed, capacity
Water Supply and Drainage
Distribution network, etc. Distribution route, capacity of distribution Discharge channel Line shape, year completed, material, capacity Pumping station Location, boundaries, area, year completed, capacity Embankment Line shape, boundary, height, thickness, type of soil
Flood Control
Drainage network, etc. Drainage route, capacity of drainage
Waste management Location of waste management facility, boundaries, area, method of treatment, collection route, place for collection, number and capacity of collection vehicles
Healthcare center Location, number of beds, number of staff Public health
Hospital, etc. Location, boundaries, number of beds and number of staff Industrial use Location, utilization, electricity usage Commercial use Location, utilization, electricity usage
Ordinal Building and Infrastructures 1/
Residential use, etc. Location, electricity usage Community Disaster Management Facility
Location, facility, stock on hand, capacity
Meeting hall Location, boundaries, capacity Others1/
Religious facility, etc. Location, boundaries, type, capacity 1/ Information was collected for the flood-affected areas only.
3.3 Affected area and population
3.3.1 Affected area
Table 3-3 shows the maximum area of inundation due to a 100-year return period flood under different
climate and infrastructure conditions.

52
Table 3-3 Areas of Study Sites Inundated by Simulated 100-year Return Period Flood (km2)
Ex MP
SQ B1 A1FI SQ B1 A1FI
Pasig-Marikina
River basin 53.73 63.19 67.97 29.14 40.09 44.14
West of Mangahan 10.65 11.09 11.42 7.79 8.16 8.3
KAMANAVA 18.24 18.24 18.24 - - -
(a) By site and scenario (b) Total inundated area by scenario
Figure 3-2 Areas Inundated by 100-year Return Period Simulation
As expected, less area is affected under the MP conditions than with the current infrastructure (EX).
Under the SQ, B1, and A1FI scenarios, the local government units (LGUs) in the Pasig Marikina River
basin (particularly the municipalities of Manila, Mandaluyong, and Marikina) and the KAMANAVA
area are more prone to floods than the West of Mangahan area, as shown in Fig. 3-3.
Figure 3-3 Flooding Rates of Affected Areas in Metro Manila
0 10 20 30 40 50 60 70 80
Region Pasig-Marikina River Basin West Mangahan
Area
KAMANAVA
Area
% Ex-SQ Ex-B1 Ex-A1F1 MP-SQ MP-B1 MP-A1F1
EXSQ EXB1 EXA1FI MPSQ MPB1 MPA1FI

53
3.3.2 Affected Population
The population of Metro Manila has been growing rapidly, from 5.93 million in 1980 to 7.95 million in
1990 and 9.93 million in 2000.
(a) (b)
Figure 3-4 (a) Metro Manila Population Trends (1970-2020), (b) Population Affected in SQ, B1,
and A1FI Scenarios for EX and MP conditions
The population of the cities and municipalities comprising the study areas are presented in Table 3-4
below.2 In general, while the population of the Pasig-Marikina river basin is decreasing, the
populations of the area West of Mangahan and the KAMANAVA area are increasing rapidly due to rapid
commercialization and increased settlement. In the Pasig-Marikina River basin, all the cities’ growth
rates are negative, except for Marikina and Quezon, where the rates are quite high. In the cities that
compose the commercial centers of Metro Manila, such as Mandaluyong, Manila, Makati, and San Juan,
the population is expected to decrease. Meanwhile, in the West of Mangahan and KAMANAVA areas,
population influx is taking place. The population density in Navotas is by far the highest (88,617
persons/km2) in the national capital region. The population is expected to have increased rapidly in
Taguig (52.4%) and Pasig (18%) in the area West of Mangahan and in Kalookan (24.7%) in the
KAMANAVA area in the period from 2000 to 2010.
2 Based on National Statistics Office, 2000 and Detailed Engineering Design of Pasig-Marikina River Channel Improvement Project, 2000.
EXSQ EXB1 EXA1F1 MPSQ MPB1 MPA1F1
Percen
t Flo
od
ed

54
Table 3-4 Changes in Population Growth Rates in Study Areas3
Region City Census
Population
(2007)
Population
Density
(persons/km2)
Population
Growth Rate
(%)
(1990-2000)
Population
Growth Rate
(%)
(2000-2010)
Mandaluyong 305,576 10,711 1.16 -0.8
Manila 1,660,714 41,282 -0.13 -15.1
Marikina 424,610 10,056 2.35 20.5
Quezon 2,679,450 13,080 2.67 8.1
San Juan 125,338 11,315 -0.75 -16.9
Pasig-Marikina
River basin
Pasay NA NA NA -0.5
Makati 510,383 14,878 -0.18 -3.2
Pasig 397,679 38,851 2.42 18.0
Pateros 57,407* 5,520 1.11 NA
Taguig 340,227 13,869 5.77 52.4
West of Mangahan
Taytay 198,183* 5,108 5.83 NA
Kalookan 1,378,856
*
21,104 4.43
24.7
Malabon 363,681* 14,481 1.93 14.5
Navotas 245,344* 88,617 2.08 10.3
KAMANAVA
Valenzuela 568,928* 10,328 3.62 NA
(Source: National Statistics Office)
3 CTI Engineering International Co. Ltd., “Study on Climate Impact Adaptation and Mitigation in Asian Coastal Mega Cities: Case of Manila,” June 2008, pp. 35-36.

55
Figure 3-5 Percentages of Population Affected in Metro Manila Local Governments by
100-Year Flooding under SQ, B1, and A1FI Scenarios with EX and MP Infrastructure Conditions
Based on the affected cities’ year 2007, the percentages affected by flooding were compared under the
SQ, B1, and A1FI scenarios with EX and MP infrastructure conditions (Fig. 3-5). The population of
Manila in the Pasig-Marikina River basin and Malabon and Navotas in the KAMANAVA area are more
prone to floods than are other Metro Manila cities and municipalities.
3.4 Direct building impacts
Figure 3-6 Damage to buildings: Flowchart
The authors inventoried buildings affected by flooding by building height. Structures located in areas
with floodwater less than 8 inches (20cm) deep were considered for further impact estimation.
Flood-affected floor areas of structures were calculated based on the buildings’ footprints.
Affected Building numbers
× Processing
action
Flood
affected floor areas
Value of finishing
and household
effects
GIS
Land use
Inundation depth
Base Unit Cost
Damage
Flood Damage
Rate

56
Table 3-5 Inundated Floor Areas in Metro Manila (100-Year Flood)
(Existing Infrastructure)
Inundated Floor Areas (m2) by Water Depth (P100, EX)
Water Depths with Present Land Use Water Depths with Future Land Use Climate
Scenario Land Use
20 cm to
50 cm
>50 cm to
3 m
>3 m to
6 m
>6 m to 9
m <9 m <50 cm
50 cm to
3 m
>3 m
to 6 m
>6 m to
9 m >9 m
Residential 1,825,925 6,624,579 259,954 19,719 198 1,561,807 6,523,200 213,135 25,754 -
Commercial 561,611 1,192,165 9,818 27,554 534 1,001,849 2,312,735 18,719 11,258 534
Institutional 303,515 657,157 2,893 - - 315,143 597,179 3,523 582 -
Status
Quo
Industrial 398,711 1,989,335 29,410 12,622 - 181,406 977,637 21,590 29,239 -
Residential 1,488,290 9,071,261 289,572 46,598 256 850,632 8,081,618 223,221 38,021 -
Commercial 471,270 1,624,147 14,427 27,554 15,038 1,165,249 4,059,993 31,747 2,589 15,038
Institutional 184,700 925,930 2,893 - - 245,698 1,102,962 2,941 582 - B1
Industrial 294,114 2,655,751 26,308 10,021 - 119,962 1,064,117 21,590 27,554 -
Residential 1,747,771 10,127,129 325,131 51,077 751 1,181,815 8,791,215 241,259 41,177 701
Commercial 441,927 1,898,583 16,274 27,554 15,038 1,152,368 4,744,357 40,053 322 17,305
Institutional 144,796 1,037,482 5,249 - - 178,354 1,247,366 4,726 582 - A1FI
Industrial 347,281 2,891,794 25,365 14,456 2,267 117,535 1,156,340 12,524 34,254 -
(As per 1990 Master Plan)1
Inundated Floor Areas (m2) by Water Depth (P100, MP)
Water Depths in Present Land Use Water Depths in Future Land Use Climate
Scenario Land Use
20 cm to
50 cm
>50 cm to
3 m
>3 m to
6 m
>6 m to 9
m <9 m <50 cm
>50 cm to
3 m
>3 m to
6 m
>6 m to 9
m <9 m
Residential 622,660 2,149,855 168,607 19,896 33 494,960 2,316,001 124,441 25,754 -
Commercial 327,619 282,205 7,842 27,554 - 698,063 684,963 12,570 8,992 -
Institutional 175,938 308,002 3,562 - 4,372 226,198 391,260 - 582 7,185Status Quo
Industrial 461,558 1,137,983 37,980 29,614 2,780 113,667 362,089 6,991 43,507 -
Residential 927,401 2,739,498 167,638 32,306 331 622,189 2,835,434 117,667 31,875 981
Commercial 509,926 520,704 7,151 27,554 - 1,112,457 1,284,863 15,785 8,194 -
B1
Institutional 225,356 421,335 1,967 - 2,893 264,368 555,860 1,786 582 5,706

57
Inundated Floor Areas (m2) by Water Depth (P100, MP)
Water Depths in Present Land Use Water Depths in Future Land Use Climate
Scenario Land Use
20 cm to
50 cm
>50 cm to
3 m
>3 m to
6 m
>6 m to 9
m <9 m <50 cm
>50 cm to
3 m
>3 m to
6 m
>6 m to 9
m <9 m
Industrial 276,333 1,356,389 19,082 28,816 2,780 77,022 378,426 6,690 43,507 -
Residential 1,048,617 3,180,302 192,363 46,678 331 711,451 3,193,996 146,915 38,267 981
Commercial 622,941 622,237 7,151 27,554 - 1,140,501 1,445,776 15,785 8,194 -
Institutional 276,010 475,502 1,967 - 2,893 281,583 585,019 1,786 582 2,941A1FI
Industrial 268,455 1,600,375 19,868 27,130 15 64,407 437,330 6,690 41,822 -
1/ No simulation for KAMANAVA area in this table
Table 3-6 Inundated Floor Areas in Metro Manila, (30-Year Flood)
(Existing Infrastructure)
Inundated Floor Areas (m2) by Water Depth (P30, EX)
Water Depths in Present Land Use Water Depths in Future Land Use Climate
Scenario Land Use
20 cm- 50
cm
>50 cm to
3 m
>3 m to
6 m
>6 m to
9 m <9 m
Less than
50 cm
>50 cm to
3 m
>3 m to
6 m
>6 m to 9
m <9 m
Residential 1,726,740 3,640,676 137,428 3,358 165 1,292,795 3,530,545 104,768 3,520 -
Commercial 536,294 357,341 30,011 - 534 1,220,328 965,783 10,574 2,267 534
Institutional 236,669 313,495 2,893 - - 217,356 420,078 6,287 - -
Status
Quo
Industrial 360,007 1,089,694 27,075 4,195 - 154,410 460,389 38,422 - -
Residential 1,651,974 5,531,078 179,761 15,955 165 1,037,077 5,183,963 136,221 16,693 -
Commercial 596,236 754,877 30,653 - 534 1,368,919 1,895,124 13,545 2,267 534
Institutional 299,988 473,622 2,893 - - 490,496 528,712 6,287 - -B1
Industrial 475,019 1,569,391 27,075 2,267 - 130,730 740,060 38,422 - -
Residential 1,621,789 6,429,553 210,206 15,824 165 931,262 5,976,304 165,568 16,562 -
Commercial 577,434 955,035 9,550 17,877 534 1,328,662 2,409,263 17,913 - 534
Institutional 305,820 573,724 2,893 - - 492,204 633,285 6,287 - -A1FI
Industrial 352,714 1,887,437 28,056 - - 132,764 833,619 17,319 17,877 -

58
(As per 1990 Master Plan)1
Inundated Floor Areas (m2) by Water Depth (P30, MP)
Water Depths in Present Land Use Water Depths in Future Land Use Flood
Scenario Land Use
20 cm-
50 cm
>50 cm to
3 m
>3 m to
6 m
>6 m to 9
m <9 m
Less than
50 cm
>50 cm to
3 m
>3 m to
6 m
>6 m to
9 m <9 m
Residential 384,225 985,517 102,071 786 - 397,778 1,103,144 79,144 1,669 -
Commercial 64,186 78,423 27,895 - - 151,782 206,626 15,463 - -
Institutional 28,264 80,408 96 2,893 - 25,803 52,670 582 5,706 -
Status
Quo
Industrial 180,199 418,605 30,382 10,348 - 54,552 104,682 32,540 7,567 -
Residential 422,999 1,400,147 116,706 6,867 - 440,441 1,491,325 84,463 11,702 -
Commercial 166,636 145,823 28,253 - - 253,874 328,649 15,499 322 -
Institutional 125,858 144,530 96 2,893 - 188,324 150,673 - 6,287 -B1
Industrial 283,575 572,621 18,840 22,039 - 78,998 174,730 25,839 14,268 -
Residential 455,971 1,656,144 134,065 8,670 - 510,660 1,728,679 93,534 15,416 -
Commercial 243,563 192,689 28,253 - - 458,569 420,344 17,824 322 -
Institutional 144,608 190,306 96 2,893 - 159,798 204,081 - 6,287 -A1FI
Industrial 402,318 637,210 19,942 22,039 - 63,247 169,087 4,234 5,706 -
1/ No simulation for KAMANAVA in this table
Assumptions for costs were derived from past infrastructure and flood studies for Metro Manila as
follows:
(i) The cost of buildings is based on LGUs’ recent schedule of base unit costs, which is usually less
than fair market value;
(ii) The value of assets and stocks/inventories of commercial, institutional and industrial buildings is
based on the National Statistics Office’s data for establishments.
The base costs assigned for residential, commercial, institutional and industrial buildings are given in
Table 3-7 through Table 3-10, respectively.
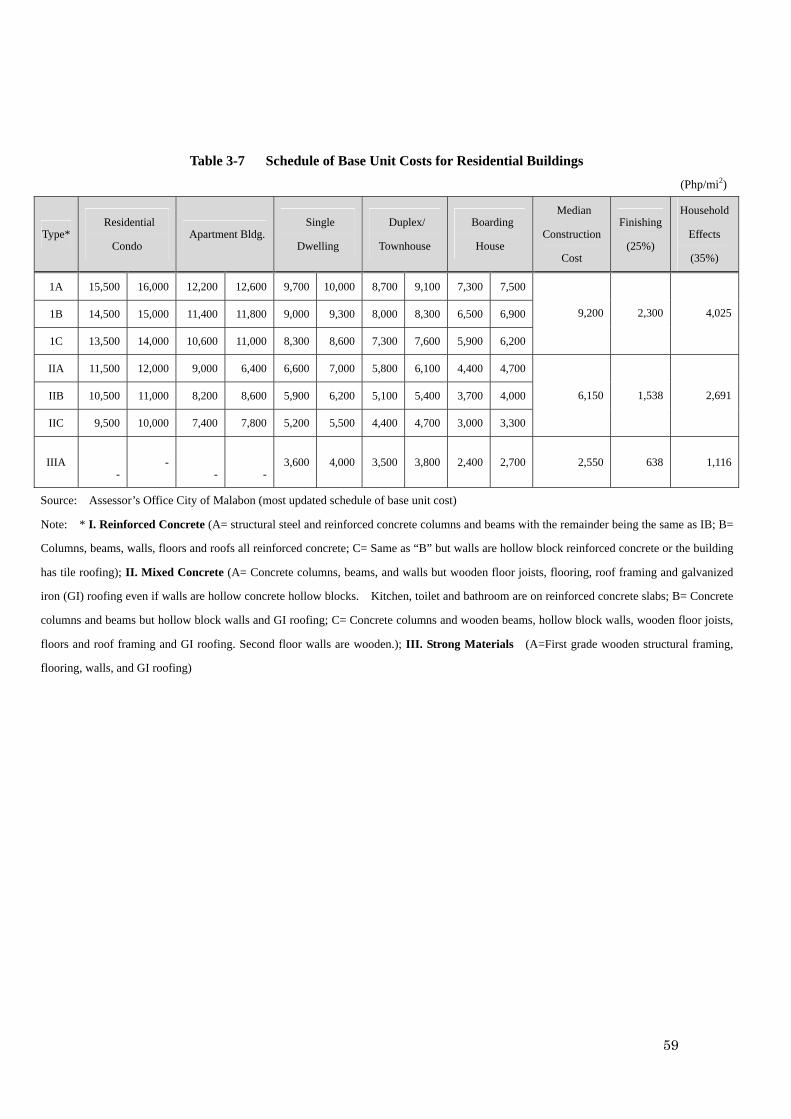
59
Table 3-7 Schedule of Base Unit Costs for Residential Buildings
(Php/mi2)
Type* Residential
Condo Apartment Bldg.
Single
Dwelling
Duplex/
Townhouse
Boarding
House
Median
Construction
Cost
Finishing
(25%)
Household
Effects
(35%)
1A 15,500 16,000 12,200 12,600 9,700 10,000 8,700 9,100 7,300 7,500
1B 14,500 15,000 11,400 11,800 9,000 9,300 8,000 8,300 6,500 6,900
1C 13,500 14,000 10,600 11,000 8,300 8,600 7,300 7,600 5,900 6,200
9,200 2,300 4,025
IIA 11,500 12,000 9,000 6,400 6,600 7,000 5,800 6,100 4,400 4,700
IIB 10,500 11,000 8,200 8,600 5,900 6,200 5,100 5,400 3,700 4,000
IIC 9,500 10,000 7,400 7,800 5,200 5,500 4,400 4,700 3,000 3,300
6,150 1,538 2,691
IIIA
- -
-
- 3,600 4,000 3,500 3,800 2,400 2,700 2,550 638 1,116
Source: Assessor’s Office City of Malabon (most updated schedule of base unit cost)
Note: * I. Reinforced Concrete (A= structural steel and reinforced concrete columns and beams with the remainder being the same as IB; B=
Columns, beams, walls, floors and roofs all reinforced concrete; C= Same as “B” but walls are hollow block reinforced concrete or the building
has tile roofing); II. Mixed Concrete (A= Concrete columns, beams, and walls but wooden floor joists, flooring, roof framing and galvanized
iron (GI) roofing even if walls are hollow concrete hollow blocks. Kitchen, toilet and bathroom are on reinforced concrete slabs; B= Concrete
columns and beams but hollow block walls and GI roofing; C= Concrete columns and wooden beams, hollow block walls, wooden floor joists,
floors and roof framing and GI roofing. Second floor walls are wooden.); III. Strong Materials (A=First grade wooden structural framing,
flooring, walls, and GI roofing)

60
Table 3-8 Schedule of Base Unit Costs for Commercial Buildings
(Php/mi2)
Type1 Commercial
Bldg. Shopping Bldg.
Theater,
Convention HallRestaurant
Median
Construction
Cost
Durable
Assets2 Stocks2
1A 14,200 14,700 8,500 8,900 13,200 13,700 10,700 11,000
1B 13,200 13,700 7,800 8,100 12,200 12,700 10,100 10,500
1C 12,200 12,700 7,100 7,400 11,200 11,700 9,400 9,700
11,100 27,750 333,000
IIA 10,200 10,700 5,600 5,900 9,200 9,700 7,800 8,100
IIB 9,200 9,700 4,800 5,300 8,200 8,700 7,400 7,700
IIC 8,200 8,700 4,100 4,600 7,200 7,700 6,600 7,000
7,750 19,375 232,500
IIIA 5,400 6,000 5,700 14,250 171,000
Source: Assessor’s Office City of Malabon (most updated schedule of base unit cost)
1/ I. Reinforced Concrete (A= Structural steel and reinforced concrete columns and beams, the remainder being the same as IB; B=
Columns, beams, walls, floors and roofs all reinforced concrete; C= Same as “B” but walls are hollow block reinforced concrete or the
building has tile roofing); II. Mixed Concrete (A= Concrete columns, beams, and walls but wooden floor joists, flooring, and roof framing
and galvanized iron (GI) roofing even if walls are concrete hollow blocks. Kitchen, toilet and bathroom are on reinforced concrete slabs;
B= Concrete columns and beams but hollow block walls and GI roofing; C= Concrete columns and wooden beams, hollow block walls,
wooden floor joists, floors and roof framing and GI roofing. Second floor walls are wooden.); III. Strong Materials (A=First grade wooden
structural framing, flooring, walls, and GI roofing).
2/ Based on NSO Data on the Value of Assets per Establishment from “Pasig-Marikina River Channel Improvement Project,” Volume II,
DPWH, 2002

61
Table 3-9 Schedule of Base Unit Cost for Institutional Buildings
(Php/mi2)
Type1 Office Bldg Hospitals Schools Church/ Chapel
Median
Construction
Cost
Durable
Assets2 Stocks2
1A 11,800 12,200 12,700 13,100 10,100 10,400 11,400 11,800
1B 11,000 11,400 11,900 12,300 9,400 9,700 10,600 11,000
1C 10,200 10,600 11,100 11,500 8,700 9,000 9,800 10,200
11,000 2,970 1,100
IIA 8,700 9,100 9,100 9,500 6,900 6,500 7,900 6,300
IIB 7,900 8,300 8,300 8,700 6,200 6,500 7,100 7,500
IIC 7,100 7,500 7,500 7,900 5,500 5,800 6,300 6,700
7,500 2,025 750
IIIA 3,900 4,300 4,100 1,107 410
Source: Assessor’s Office City of Malabon (most updated schedule of base unit cost)
1/ I. Reinforced Concrete (A= Structural steel and reinforced concrete columns and beams, with the remainder being the same as IB; B=
Columns, beams, walls, floors and roofs all reinforced concrete; C= Same as “B” but walls are hollow block reinforced concrete or the
building has tile roofing); II. Mixed Concrete (A= Concrete columns, beams, and walls but wooden floor joists, flooring, and roof framing
and galvanized iron (GI) roofing even if walls are concrete hollow blocks. Kitchen, toilet and bathroom are on reinforced concrete slabs;
B= Concrete columns and beams but hollow block walls and GI roofing; C= Concrete columns and wooden beams, hollow block walls,
wooden floor joists, floors, and roof framing and GI roofing. Second floor walls are wooden.); III. Strong Materials (A=First grade
wooden structural framing, flooring, walls, and GI roofing).
2/ Based NSO Data on the Value of Assets per Establishment from the “Pasig-Marikina River Channel Improvement Project,” Volume II,
DPWH, 2002.

62
Table 3-10 Schedule of Base Unit Cost for Industrial Buildings
(Php/mi2)
Type1 Industrial Bldg Warehouse Cold Storage Factory
Median
Construction
Cost
Durable
Assets2 Stocks2
1A 7,200 7,500 5,700 6,000 7,800 8,000 5,900 6,200
1B 6,500 6,800 5,000 5,700 7,100 7,400 5,200 5,500
1C 5,800 6,100 4,300 4,600 6,400 6,700 4,500 4,800
6,050 26,620 22,990
IIA 4,300 4,600 3,400 3,700 4,900 5,200 3,800 4,100
IIB 3,600 3,900 2,800 3,200 4,200 4,500 3,200 3,500
IIC 2,900 3,200 2,200 2,400 3,500 3,800 2,500 2,600
3,550 15,620 13,490
IIIA 1,700 2,000 1,800 2,100 1,900 8,360 7,220
Source: Assessor’s Office City of Malabon (most updated schedule of base unit cost)
1/ I. Reinforced Concrete (A= Structural steel and reinforced concrete columns and beams, with the remainder the same as IB; B= Columns,
beams, walls, floors and roofs all reinforced concrete; C= Same as “B” but walls are hollow block reinforced concrete or the building has tile
roofing); II. Mixed Concrete (A= Concrete columns, beams, and walls but wooden floor joists, flooring, and roof framing and galvanized
iron (GI) roofing even if walls are concrete hollow blocks. Kitchen, toilet and bathroom are on reinforced concrete slabs; B= Concrete
columns and beams but hollow block walls and GI roofing; C= Concrete columns and wooden beams, hollow block walls, wooden floor
joists, floors, and roof framing and GI roofing. Second floor walls are wooden.); III. Strong Materials (A=First grade wooden structural
framing, flooring, walls, and GI roofing).
2/ Based on NSO Data on the Value of Assets per Establishment from the “Pasig-Marikina River Channel Improvement Project,”
Volume II, DPWH, 2002
In the flood damage estimates, no building replacement costs (or construction costs) were imputed since
there is no certainty that structures will be destroyed without data on the rate or strength of floodwater
flow. Rather, the cost of repairing finishings and the cost of damage to assets and stocks are utilized.
Moreover, conservative estimates for mixed concrete type structures (IIA, IIB, and IIC) were used in the
calculations. Table 3-11 gives the applicable damage rates based on the “Manual for Economic Study
on Flood Control” by the Ministry of Construction of Japan, which was cited in a recent Metropolitan
Manila Development Authority drainage study.

63
Table 3-11 Flood Damage Rates by Building Use and Inundation Depth
Building Use Cost Item <50 cm 100-200 cm 200-300 cm >300 cm
Finishings 0.0920 0.119 0.580 0.834 Residential
Household Effects 0.1450 0.326 0.928 0.991
Assets 0.2320 0.453 0.9661 0.966 Business Entities1
(Commercial,
Institutional, and
Industrial)
Stocks 0.1280 0.267 0.8971 0.8971
Source: Adapted from the Manual for Economic Study on Flood Control, May 2000, Ministry of Construction (presently
the Ministry of Land, Infrastructure and Transport), Japan
1/ maximum rate given is for depths of 200-299 cm. The same rates are applied to institutional and industrial entities.
Finally, damage to buildings is aggregated as follows. First, the most common flood depth of a
municipality was identified based on the table of water depths and affected buildings in each local
government unit. Next, damages to buildings were added up, totaling the cost of damages calculated
based on land use and water depth by municipality. In doing so, damage to upper floors of buildings was
not included if the flood water level did not reach those floors. Table 3-12 shows the results of these
calculations for the B1 climate scenario, 100-year flood, and existing flood infrastructure.
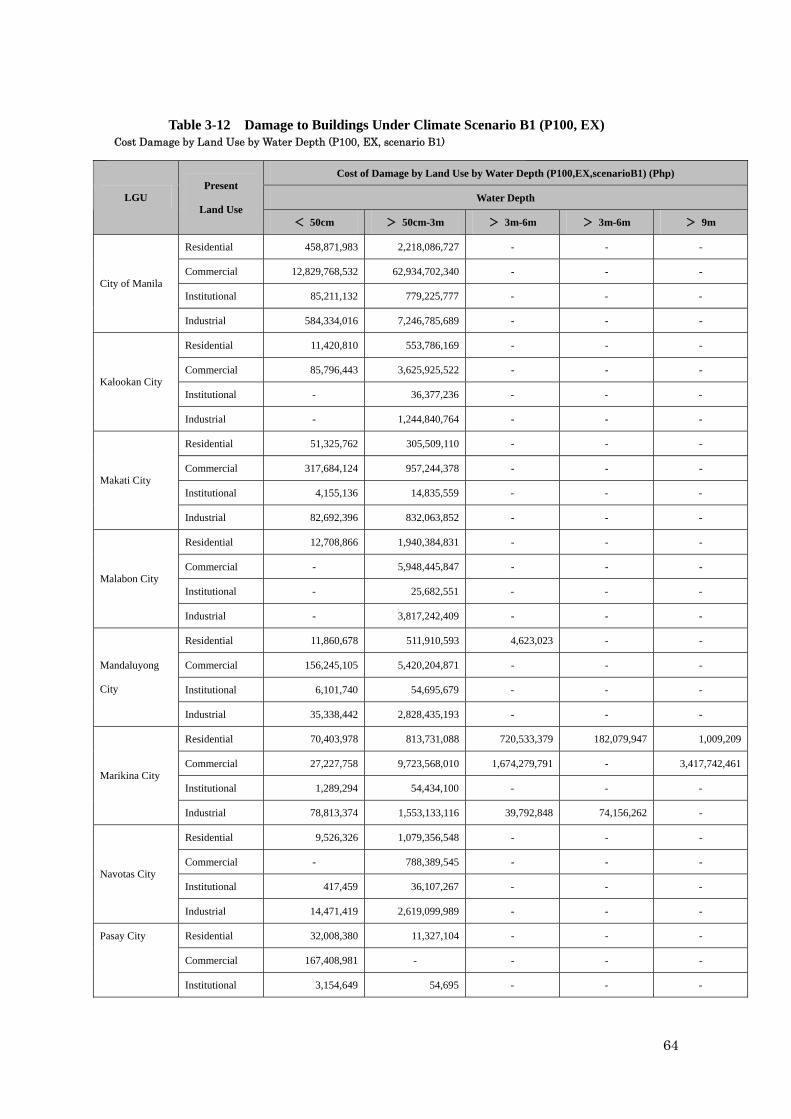
64
Table 3-12 Damage to Buildings Under Climate Scenario B1 (P100, EX)
Cost of Damage by Land Use by Water Depth (P100,EX,scenarioB1) (Php)
Water Depth LGU Present
Land Use < 50cm > 50cm-3m > 3m-6m > 3m-6m > 9m
Residential 458,871,983 2,218,086,727 - - -
Commercial 12,829,768,532 62,934,702,340 - - -
Institutional 85,211,132 779,225,777 - - - City of Manila
Industrial 584,334,016 7,246,785,689 - - -
Residential 11,420,810 553,786,169 - - -
Commercial 85,796,443 3,625,925,522 - - -
Institutional - 36,377,236 - - - Kalookan City
Industrial - 1,244,840,764 - - -
Residential 51,325,762 305,509,110 - - -
Commercial 317,684,124 957,244,378 - - -
Institutional 4,155,136 14,835,559 - - - Makati City
Industrial 82,692,396 832,063,852 - - -
Residential 12,708,866 1,940,384,831 - - -
Commercial - 5,948,445,847 - - -
Institutional - 25,682,551 - - - Malabon City
Industrial - 3,817,242,409 - - -
Residential 11,860,678 511,910,593 4,623,023 - -
Commercial 156,245,105 5,420,204,871 - - -
Institutional 6,101,740 54,695,679 - - -
Mandaluyong
City
Industrial 35,338,442 2,828,435,193 - - -
Residential 70,403,978 813,731,088 720,533,379 182,079,947 1,009,209
Commercial 27,227,758 9,723,568,010 1,674,279,791 - 3,417,742,461
Institutional 1,289,294 54,434,100 - - - Marikina City
Industrial 78,813,374 1,553,133,116 39,792,848 74,156,262 -
Residential 9,526,326 1,079,356,548 - - -
Commercial - 788,389,545 - - -
Institutional 417,459 36,107,267 - - - Navotas City
Industrial 14,471,419 2,619,099,989 - - -
Residential 32,008,380 11,327,104 - - -
Commercial 167,408,981 - - - -
Pasay City
Institutional 3,154,649 54,695 - - -
Cost Damage by Land Use by Water Depth (P100, EX, scenario B1)
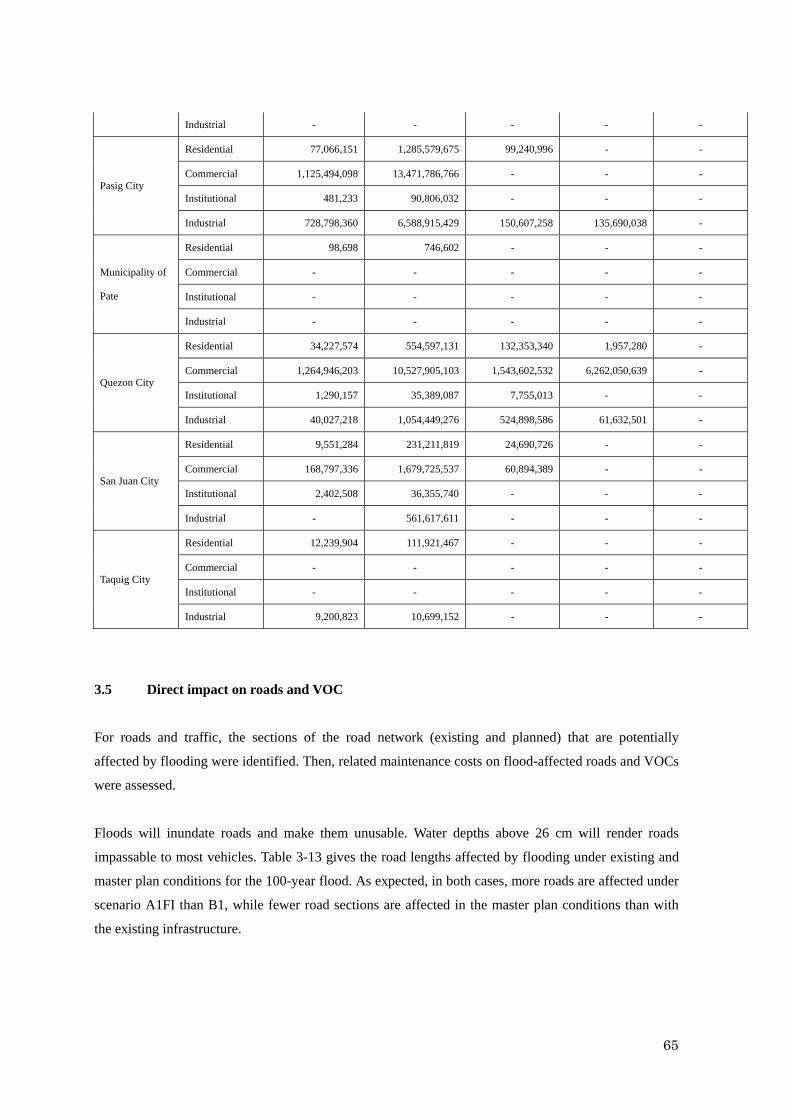
65
Industrial - - - - -
Residential 77,066,151 1,285,579,675 99,240,996 - -
Commercial 1,125,494,098 13,471,786,766 - - -
Institutional 481,233 90,806,032 - - - Pasig City
Industrial 728,798,360 6,588,915,429 150,607,258 135,690,038 -
Residential 98,698 746,602 - - -
Commercial - - - - -
Institutional - - - - -
Municipality of
Pate
Industrial - - - - -
Residential 34,227,574 554,597,131 132,353,340 1,957,280 -
Commercial 1,264,946,203 10,527,905,103 1,543,602,532 6,262,050,639 -
Institutional 1,290,157 35,389,087 7,755,013 - - Quezon City
Industrial 40,027,218 1,054,449,276 524,898,586 61,632,501 -
Residential 9,551,284 231,211,819 24,690,726 - -
Commercial 168,797,336 1,679,725,537 60,894,389 - -
Institutional 2,402,508 36,355,740 - - - San Juan City
Industrial - 561,617,611 - - -
Residential 12,239,904 111,921,467 - - -
Commercial - - - - -
Institutional - - - - - Taquig City
Industrial 9,200,823 10,699,152 - - -
3.5 Direct impact on roads and VOC
For roads and traffic, the sections of the road network (existing and planned) that are potentially
affected by flooding were identified. Then, related maintenance costs on flood-affected roads and VOCs
were assessed.
Floods will inundate roads and make them unusable. Water depths above 26 cm will render roads
impassable to most vehicles. Table 3-13 gives the road lengths affected by flooding under existing and
master plan conditions for the 100-year flood. As expected, in both cases, more roads are affected under
scenario A1FI than B1, while fewer road sections are affected in the master plan conditions than with
the existing infrastructure.

66
Table 3-13 Affected Length of Road by Inundation Depth
Road Length by Inundation Depth (km)
8-20 cm 21-50 cm Above 50 cm Existing
Infrastructure Major Minor Major Minor Major Minor
Total
Status Quo 4.5 3.9 22.1 23.8 31.9 39.8 125.9
B1 5.4 9.7 13.6 15.1 47.9 55.6 147.3
A1FI 5.3 6.9 14.6 18.2 53.6 60.3 158.9
Road Length by Inundation Depth (km)
8-20 cm 21-50 cm Above 50 cm Master Plan
Infrastructure Major Minor Major Minor Major Minor
Total
Status Quo 3.78 4.33 6.40 10.45 7.45 13.42 45.82
B1 7.24 8.15 9.54 15.73 12.07 20.82 73.55
A1FI 9.45 9.05 12.62 16.28 14.97 25.63 87.99
Table 3-18 lists the flooding effects on the future Metro Manila transportation network envisioned in the
transportation Master Plan of the Metro Manila Urban Transportation Integration Study (MMUTIS)
under existing and planned flood infrastructure conditions.
Table 3-14 Future Road Network Affected Under SQ, B1, and A1FI Scenarios
(EX and MP Conditions)
(Status Quo)
Affected Length (SQ Scenario)(km)
Depth 0.08 m-0.20 m Depth 0.21 m-0.50 m Depth above 0.51 m Total Length(km)
Commited Proposed Commited Proposed Commited Proposed Commited Proposed
Road - 0.25 - 1.33 - 3.91 - 5.48
Rail 2.50 - 5.37 - 6.08 - 13.95 -
Expressway - 0.45 0.24 1.48 4.20 5.14 4.44 7.07
(B1)
Affected Length (B1 Scenario)(km)
Depth 0.08 m-0.20 m Depth 0.21 m-0.50 m Depth above 0.51 m Total Length(km)
Commited Proposed Commited Proposed Commited Proposed Commited Proposed
Road - 1.01 - 1.20 - 5.18 - 7.39
Rail 2.66 0.04 5.03 0.35 9.57 - 17.26 0.39
Expressway - 1.83 - 1.35 4.44 6.03 4.44 9.21

67
(A1F1)
Affected Length (A1FI Scenario)(km)
Depth 0.08 m-0.20 m Depth 0.21 m-0.50 m Depth above 0.51 m Total Length(km)
Commited Proposed Commited Proposed Commited Proposed Commited Proposed
Road - 1.00 - 1.16 - 5.82 - 7.98
Rail 1.46 - 6.64 0.22 10.53 0.27 18.63 0.49
Expressway - 0.68 0.08 2.79 4.44 7.14 4.52 10.61
1/Based on MMUTIS Transport Network
3.5.1 Maintenance Cost of Flood-Affected Roads
Basic assumptions for calculating the maintenance costs of flood-affected roads were derived from road
feasibility studies done by the Department of Public Works and Highways (DPWH), which deals with
asphalt and concrete pavement on generally flat terrain. In these conditions, routine maintenance cost is
set at 50,000 Php/km while periodic maintenance cost is 972 Php/vehicle unit. This study determined
the total length of major and minor roads that will be affected by floods brought about by 30- and
100-year return period flooding, (Tables 3-15 and 3-16) but traffic volumes were only established for
major roads. Annual Average Daily Traffic (AADT) on those roads was converted to Vehicle Units
using DPWH factors as shown in Table 3-17.
Table 3-15 Present Network Roads Affected by 100-Year Flooding by LGU (km)
Depth: 8-20cm Depth: 21-50cm Depth: Above50cm

68
Table 3-16 Present Network Roads Affected by 30-Year Flooding by LGU (km)
Table 3-17 DPWH Traffic Conversion Factors
The total maintenance cost is given by:
3.5.2 Vehicle Operating Cost
Vehicle operating cost (VOC) is based on vehicles’ running cost, fixed cost, and time cost. It can be
measured either in cost per distance (Peso/km) or cost per time (Peso/hour) of vehicle operation. VOC
increases when vehicles traverse roads in bad condition, including flooded roads. The time element is
disregarded since there is no available information on alternate routes used to avoid flooded areas. Table
3-18 shows the Inundation Unit Cost for vehicles in Metro Manila.
Depth: 8-20cm Depth: 21-50cm Depth:Above50cm
MC = L* RMC + VU*PMC,
Where: MC - Maintenance Cost
L - Total length of flood-affected roads(in km)
RMC - Routine maintenance cost/km
VU - Total Vehicle Units
PMC - Periodic maintenance cost/VU

69
Table 3-18 Inundation Unit Cost for Vehicles in Metro Manila
Road Condition Public Mode (Peso/km/vehicle) Private Mode (Peso/km/vehicle)
Good/Fair 9,614 11,795
Inundated(Bad) 14,316 16,962
Incremental Flooding Cost 4,702 5,167
The annual VOC on roads with good to fair condition can be calculated as:
The total VOC on roads during flooded days can be computed as:
Damage attributable to VOC is the difference between TVOC G and TVOC B
3.6 Indirect impact on travel time
Another impact of inundated roads can be translated into travel delay costs, which are the product of
extra time spent traveling multiplied by unit costs. Travel time unit costs vary depending on the type
TVOCG = {(AADTPb*VOCGPb) + (AADTPr*VOCGPr)} *L*365 days,
Where:
TVOCG - Total vehicle operating cost(good condition)
AADTPb - Public vehicle traffic (in AADT)
VOCGPb - VOC - public mode, good condition
AADTPr - Private vehicle traffic (in AADT)
VOCGPr - VOC - private mode, good condition
L - Length of road (km)
TVOCB = {(AADTPb*VOCBPb) + (AADTPr*VOCBPr)} *L*NF,
Where:
TVOCB - Total vehicle operating cost(good condition)
AADTPb - Public vehicle traffic (in AADT)
VOCBPb - VOC - public mode, good condition
AADTPr - Private vehicle traffic (in AADT)
VOCBPr - VOC - private mode, good condition
L - Length of road (km)
NF - Number of flooded days in a year
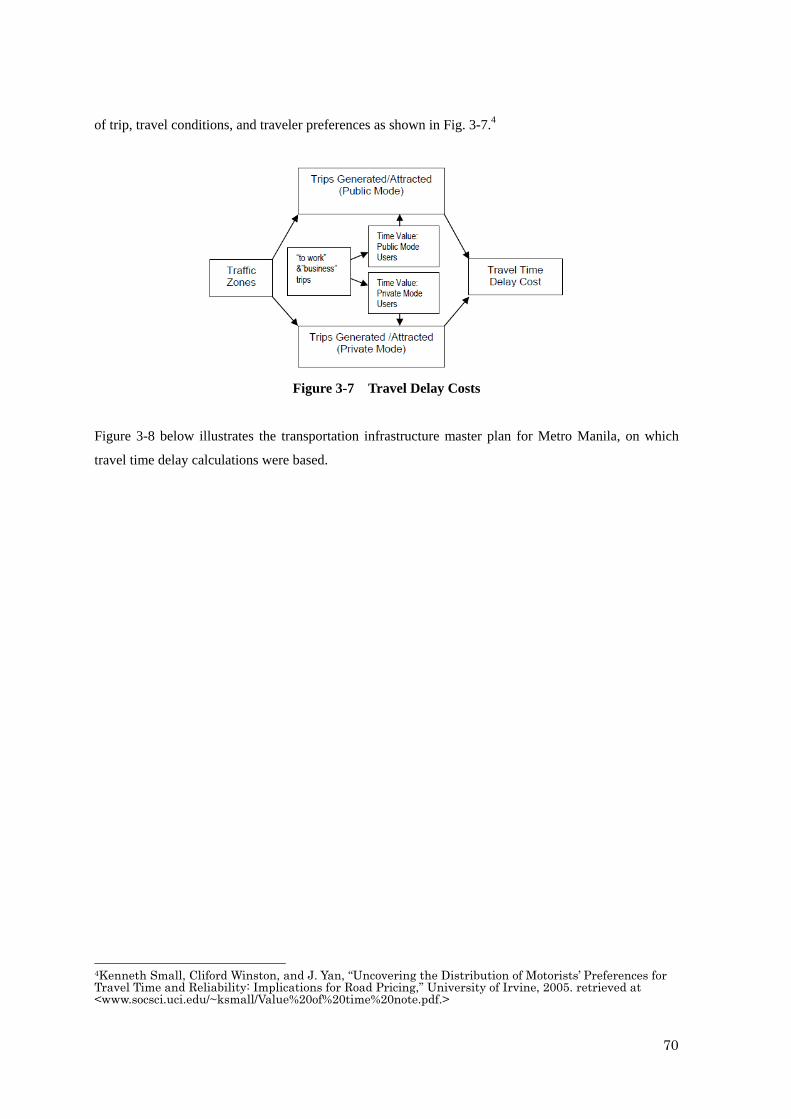
70
of trip, travel conditions, and traveler preferences as shown in Fig. 3-7.4
Figure 3-7 Travel Delay Costs
Figure 3-8 below illustrates the transportation infrastructure master plan for Metro Manila, on which
travel time delay calculations were based.
4Kenneth Small, Cliford Winston, and J. Yan, “Uncovering the Distribution of Motorists’ Preferences for Travel Time and Reliability: Implications for Road Pricing,” University of Irvine, 2005. retrieved at <www.socsci.uci.edu/~ksmall/Value%20of%20time%20note.pdf.>

71
Source: MMDA-JICA Baseline Study on the Present Status and Issues on the MMUTIS Master plan
Figure 3-8 Metro Manila Transportation Infrastructure, 2015
There are two ways to quantify time costs. The first starts with the number of passengers counted at

72
the roadside during the 1999 MMUTIS. The number of road trips in the metropolis was recorded
during the 1999 MMUTIS based on a metropolis-wide Person Trip Survey. This information allowed
trip data by transportation mode for each LGU zone to be created. Table 3-19 gives the number of
trips generated and attracted to each LGU by public and private transportation modes.
Table 3-19 Trips Generated and Attracted by LGU, 1999
Passengers are classified into those using public and private transportation, with the modal share being
determined by household income based on data collected in the 1999 person-trip survey. The average
income of public mode users, which was calculated to be P45.45/hour, was multiplied by the counted
number of public mode passengers to obtain their aggregate travel time cost per hour. The travel time
delay cost for private mode users, on the other hand, is better ascertained based on their perceived time
value, which was estimated to be P81.30/hour based on an interview survey conducted in 2002.5 Trips
with financial bearing are generally made by income-earning individuals. These trips can be derived
from the MMUTIS data on “to work” and “business” purpose trips tabulated by the Person Trip Survey.
Considering this information, the number of trips can further be refined, resulting in 14 percent of total
public trips and 5 percent of private trips being classified as “to work” and “business” trips.
Table 3-20 shows the year 2002 per-hour time values of trip makers. It should be noted that not all
flood-affected areas had roadside traffic counts and therefore cost changes determined by this method
cannot be directly related to flooding scenarios.
5 JICA-DPWH, “The Development of the Public-private Partnership Technique for the Metro Manila Urban Expressway Network,” March, 2002.

73
Table 3-20 Time Value of Trip Makers (Pesos/hour)
Mode Type 2002 Php/hr
Private 81.30
Public 45.45
Table 3-21 Passengers’ Travel Delay Costs Based on 1999 Roadside Counts
In this regard, the second method of quantifying costs, which relates to the area’s traffic zones (Fig. 3-9)
and the number of generated and attracted trips recorded during the MMUTIS, is useful. Its area-based
method grasps the transportation conditions better, as all inundated areas are overlain on traffic zones
used in past transport studies.6 Traffic zones and their corresponding trips are segmented into 265
zones in the MMUTIS, which are converted to the 185 zoning system of the Public-Private Partnership
of the Metro Manila Urban Expressway Network (PPP-MMUEN).
6 JICA, JICA Update of Manila Studies of Urban Transport (JUMSUT, 1984), MMUTIS (1999), and PPP-MMUEN (2003). Traffic zones and their corresponding trips are given in Appendix 5.3.1 in terms of the 265 zoning system in MMUTIS converted to the 185 zoning system of PPP-MMUEN

74
Figure 3-9 Traffic Zones in Metro Manila
This report adopts the second method in quantifying travel delay costs.7 The private-mode trips
generated by and attracted to the zones are summed up for each city and refined considering only the
income-earning trip-makers. Using the travel time values given in Table 3-20 and the number of trips,
the cumulative travel time delay cost is calculated for 2002 for all flood scenarios.
Cumulative travel time delay costs (per hour) in Metro Manila for the SQ, B1, and A1FI scenarios with
7 JICA studies: JUMSUT in 1984, MMUTIS in 1999, and PPP-MMUEN in 2003.

75
both existing and master plan conditions are summarized below. The number of hours the effects will
span was estimated from flood duration data to obtain the aggregate time delay cost.
3.7 Affected residents’ income loss
3.7.1 Formal residents
The number of residents or households affected by floods is difficult to measure. However, the number
of residential buildings affected can be counted. Hence, the number of households was assumed based
on the number of buildings. The incomes were based on the per capita income data from the National
Statistics Office (NSO).
Table 3-22 gives the flood-affected residential buildings below 12 meters in height in each local
governmental unit. 1.5 families were assumed for each of these residential building. Formal residents
were calculated by multiplying the number of affected residential buildings by 1.5 families and 750
Philippine Pesos per day, which is the 2002 per capita household income. Figures for 2008 and 2050 are
derived by applying 5% growth per year.
Table 3-22 Flood-Affected Residential Buildings (P100, EX, SQ)
(100-Year Flooding, Status Quo Climate, Existing Infrastructure)
Flood-Affected Buildings LGU
Less Than 12 m Tall
City of Manila 66,057
Kalookan City 9,356
Makati City 7,593
Malabon City 32,876
Mandaluyong City 6,227
Marikina City 12,721
Navotas City 23,384
Pasay City 953
Pasig City 19,059
Municipality of
Pateros 20
Quezon City 6,600
San Juan City 2,102
Taguig City 4,104
Total 191,052

76
3.7.2 Informal Residents
Table 3-23 gives the number of affected informal residential structures and income loss per day from
each local governmental unit. Two families are assumed per structure. The number of informal settlers
was calculated by multiplying the number of affected informal residential structures by 2 families and
266 Philippine Pesos per day, which is poverty threshold household income based on National
Statistical Coordination Board (NSCB) data. Figures in 2008 and 2050 are derived by applying 5%
growth per year.
Table 3-23 Informal Residents’ Income Loss (P100, EX)
(100-Year Flooding, Existing Infrastructure)
Daily Income Loss to Informal Residents
Status Quo Flood Level B1 Flood Level A1FI Flood Level LGU
Number of
Structures
Income Loss/
day (Php)
Number of
Structures
Income Loss/
day (Php)
Number of
Structures
Income Loss/
day (Php)
City of Manila 2,620 1,393,840 4,063 2,161,516 4,294 2,284,408
Kalookan City 1,864 991,648 1,870 994,840 1,871 995,372
Makati City 1 532 1 532 1 532
Malabon City 2,425 1,290,100 2,425 1,290,100 2,425 1,290,100
Mandaluyong City 8 4,256 8 4,256 8 4,256
Marikina City - - - - - -
Navotas City 2,712 1,442,784 2,712 1,442,784 2,712 1,442,784
Pasay City 249 132,468 299 159,068 349 185,668
Pasig City 97 51,604 150 79,800 245 130,340
Municipality of Pateros - - - - - -
Quezon City 1,393 741,076 1,403 746,396 1,416 753,312
San Juan City 5 2,660 5 2,660 5 2,660
Taguig City - - - - - -
Total 11,374 6,050,968 12,936 6,881,952 13,326 7,089,432
3.8 Income (sales) loss to affected firms
A 2008 survey conducted by the NSO on the Income of Flood Affected Firms provided information on
business income (sales) losses due to past floods. Income loss was approximated by loss in sales, as it
is difficult to identify the cost of sales. The income losses were averaged by economic activity and
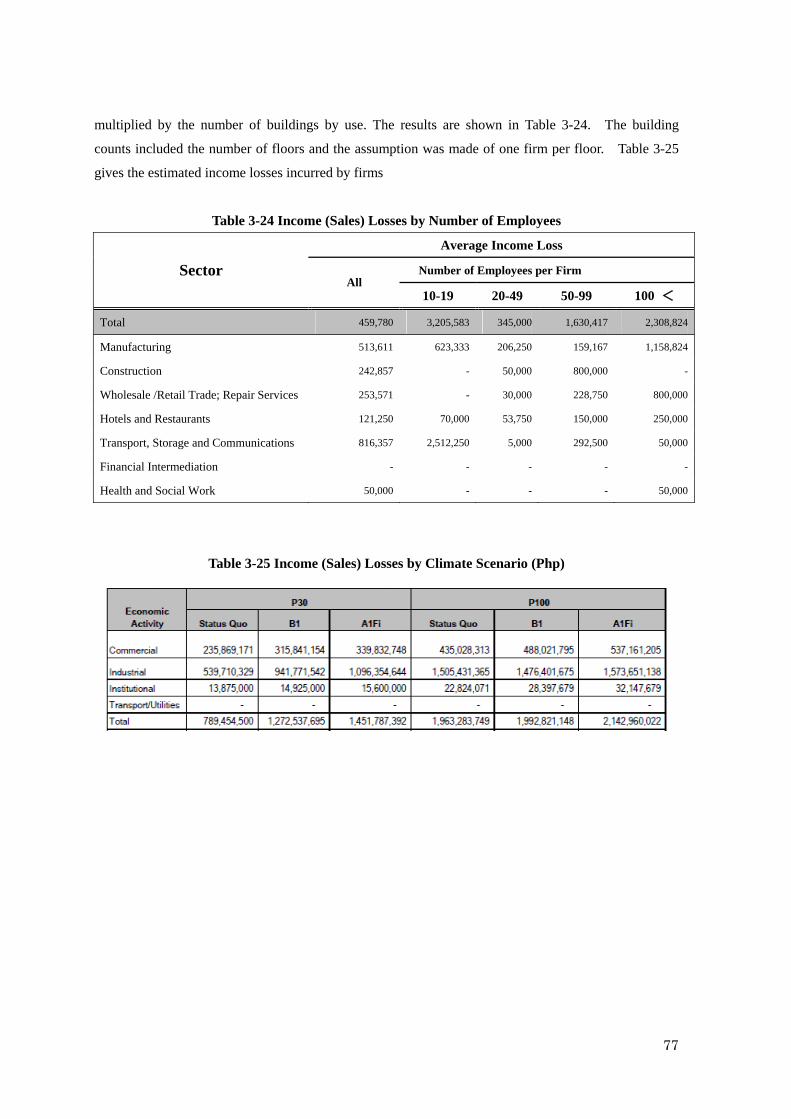
77
multiplied by the number of buildings by use. The results are shown in Table 3-24. The building
counts included the number of floors and the assumption was made of one firm per floor. Table 3-25
gives the estimated income losses incurred by firms
Table 3-24 Income (Sales) Losses by Number of Employees
Average Income Loss
Number of Employees per Firm Sector All
10-19 20-49 50-99 100 <
Total 459,780 3,205,583 345,000 1,630,417 2,308,824
Manufacturing 513,611 623,333 206,250 159,167 1,158,824
Construction 242,857 - 50,000 800,000 -
Wholesale /Retail Trade; Repair Services 253,571 - 30,000 228,750 800,000
Hotels and Restaurants 121,250 70,000 53,750 150,000 250,000
Transport, Storage and Communications 816,357 2,512,250 5,000 292,500 50,000
Financial Intermediation - - - - -
Health and Social Work 50,000 - - - 50,000
Table 3-25 Income (Sales) Losses by Climate Scenario (Php)

78
3.9 Summary tables
Finally, we show the tables for "damage cost"(Tables 3-26 to 28) as well as "avoided damage" (Tables 3-29 to 31). The latter refers to the damage
that can potentially be reduced by adaptation measures.

79
Table 3-26 Damage assessment (2008 Php): 100-year return period
Cost in 2008 Pesos SQ EX SQ MP B1 EX B1 MP A1FI EX A1FI MP
Residential 3,688,647,788 1,045,670,772 6,022,893,816 1,326,288,039 7,517,544,912 2,101,690,472
Commercial 37,699,327,245 15,298,341,749 63,871,514,594 25,506,211,401 68,021,524,157 37,713,082,264
Institutional 298,785,692 158,994,559 485,447,235 173,893,911 1,874,981,233 253,765,175Damage to buildings
Industrial 8,650,623,155 5,694,313,706 16,556,719,073 5,532,356,399 17,850,618,995 9,193,023,327
Current roads 8,143,240 3,010,272 9,677,159 4,831,659 10,443,791 5,780,183Maintenance cost on flood
affected roads Future roads 360,001 360,001 485,467 485,467 524,226 524,226
VOC 50,729,576 22,855,337 62,246,103 36,684,130 68,001,872 43,885,751
Travel time cost 706,986,380 277,477,558 1,082,134,984 197,675,748 1,420,426,406 340,173,579
Assets (this is already included in damages to buildings) Firms’ loss of business
Sales 13,403,412,143 6,567,976,899 14,085,687,162 7,745,705,319 14,639,854,088 8,339,388,091
Formal residents 214,933,500 67,473,375 230,942,250 95,140,125 481,092,750 105,586,875Residents’ income loss
Informal residents 6,050,968 584,668 6,881,952 1,247,540 7,089,432 2,091,824
Total 64,727,999,688 29,137,058,896 102,414,629,796 40,620,519,739 111,892,101,862 58,098,991,768
2008 METRO Manila GRDP
468,382,396,000 *Source: National Statistical Coordination Board
% of GRDP 14% 6% 22% 9% 24% 12%
EX: Existing infrastructure, MP: Continuing 1990 Master plan

80
Table 3-27 Damage assessment (2008 Php): 30-year return period
Cost in 2008 in Pesos P30 SQ EX P30 SQ MP P30 B1 EX P30 B1 MP P30 A1FI EX P30 A1FI MP
Residential 1,802,689,882 399,849,739 3,660,228,253 549,439,668 4,210,760,389 637,339,590
Commercial 22,710,938,518 2,273,492,105 35,692,199,142 7,069,333,943 39,538,199,655 10,143,817,110
Institutional 158,250,637 23,533,947 270,248,699 85,001,479 334,199,868 96,920,697Damage to buildings
Industrial 4,216,676,982 1,330,430,240 9,932,796,023 2,657,311,465 11,606,388,976 3,456,942,255
Current road 5,286,655 1,102,956 6,846,841 1,937,811 7,482,737 2,313,418Maintenance cost on flood
affected roads Future road 244,376 244,376 302,185 302,185 329,119 329,119
VOC 40,138,658 8,374,141 51,984,296 14,712,729 56,812,303 17,564,506
Travel time cost 374,633,321 31,760,926 421,032,785 74,184,136 573,888,428 85,170,808
Assets (this is already included in damages to buildings) Firms’ loss of business
Sales 10,756,786,447 3,281,670,824 11,832,564,006 4,515,810,393 12,434,679,407 5,075,470,880
Formal residents 93,848,625 39,640,500 184,246,875 49,636,125 196,321,500 51,926,625Residents income loss
Informal residents 4,731,076 92,036 5,367,880 111,188 5,750,388 118,636
Total 40,164,225,177 7,390,191,790 62,057,816,985 15,017,781,123 68,964,812,770 19,567,913,643
2008 METRO Manila GRDP
468,382,396,000 *Source: National Statistical Coordination Board
% of GRDP 9% 2% 13% 3% 15% 4%
EX: Existing infrastructure, MP: Continuing 1990 Master plan

81
Table 3-28 Damage assessment (2008 Php): 10-year return period
Cost in 2008 in Pesos P10 SQ EX P10 SQ MP P10 B1 EX P10 B1 MP P10 A1FI EX P10 A1FI MP
Residential 785,486,988 320,880,033 842,295,372 491,606,130 595,395,243 546,225,294
Commercial 8,641,501,748 610,789,400 9,658,314,207 1,611,046,487 13,750,520,244 2,326,289,074
Institutional 66,863,814 20,189,999 91,707,535 37,209,916 96,826,650 37,268,296Damage to buildings
Industrial 2,890,401,496 1,173,449,757 2,414,697,965 1,461,799,749 1,756,641,760 1,346,409,219
Current road 1,162,100 346,199 1,587,787 463,132 2,632,955 543,277Maintenance cost on flood
affected roads Future road 44,014 30,219 44,014 31,532 91,969 38,102
VOC 8,823,186 2,628,501 12,055,195 3,516,306 19,990,575 4,124,802
Travel time cost 33,199,847 8,380,787 45,754,992 11,655,307 71,672,669 13,646,330
Assets (this is already included in damages to buildings) Firms’ loss of business
Sales 2,816,137,180 2,704,662,851 2,961,770,824 2,822,212,152 3,044,628,088 2,881,793,868
Formal residents 32,629,500 20,444,625 49,763,250 26,401,500 49,437,000 29,098,125Residents’ income loss
Informal residents 85,652 51,072 151,620 51,072 255,892 72,352
Total 15,276,335,523 4,861,853,444 16,078,142,760 6,465,993,284 19,388,093,046 7,185,508,737
2008 METRO Manila GRDP
468,382,396,000 *Source: National Statistical Coordination Board
% of GRDP 3% 1% 3% 1% 4% 2%
EX: Existing infrastructure, MP: Continuing 1990 Master plan,

82
Table 3-29 Gross summary of costs used to calculate EIRR/NPV by adaptation option: P100*
Cost in 2008 in Pesos P100 SQ EX P100 SQ MP P100 B1 EX P100 B1 MP P100 A1FI EX P100 A1FI MP
Residential 2,032,678,209 1,045,670,772 3,581,994,723 1,326,288,039 4,938,356,848 2,101,690,472
Commercial 33,658,358,514 15,298,341,749 56,812,993,791 25,506,211,401 60,548,031,143 37,713,082,264
Institutional 265,215,324 158,994,559 419,111,179 173,893,911 1,804,114,489 253,765,175Damage to buildings
Industrial 5,098,786,299 5,694,313,706 11,390,565,953 5,532,356,399 12,481,231,557 9,193,023,327
Current road 7,971,703 3,736,418 9,912,070 5,940,825 10,906,505 7,051,890Maintenance cost on flood
affected roads Future road 434,377 434,377 603,324 603,324 668,553 668,553
VOC 50,729,576 22,855,337 62,246,103 36,684,130 68,001,872 43,854,503
Travel time cost 24,425,094 6,777,512 27,511,321 10,015,447 29,685,666 13,027,249
Assets (this is already included in damages to buildings) Firms’ loss of business
Sales 9,783,823,274 6,567,976,899 10,275,458,777 7,630,789,127 10,744,074,387 8,076,336,098
Formal residents 705,577,500 236,156,813 781,020,000 280,705,500 1,097,884,125 413,874,000Residents’ income loss
Informal residents 11,632,180 2,046,338 15,771,140 3,661,224 21,847,644 5,192,320
Total 51,857,476,996 29,109,794,526 83,647,021,228 40,603,026,930 92,141,704,102 57,981,565,022
*Excludes KAMANA (Kalookan City, Malabon City, and Navotas City)
P100: 100-year return period flooding, EX: Existing infrastructure, MP: Continuing 1990 Master plan
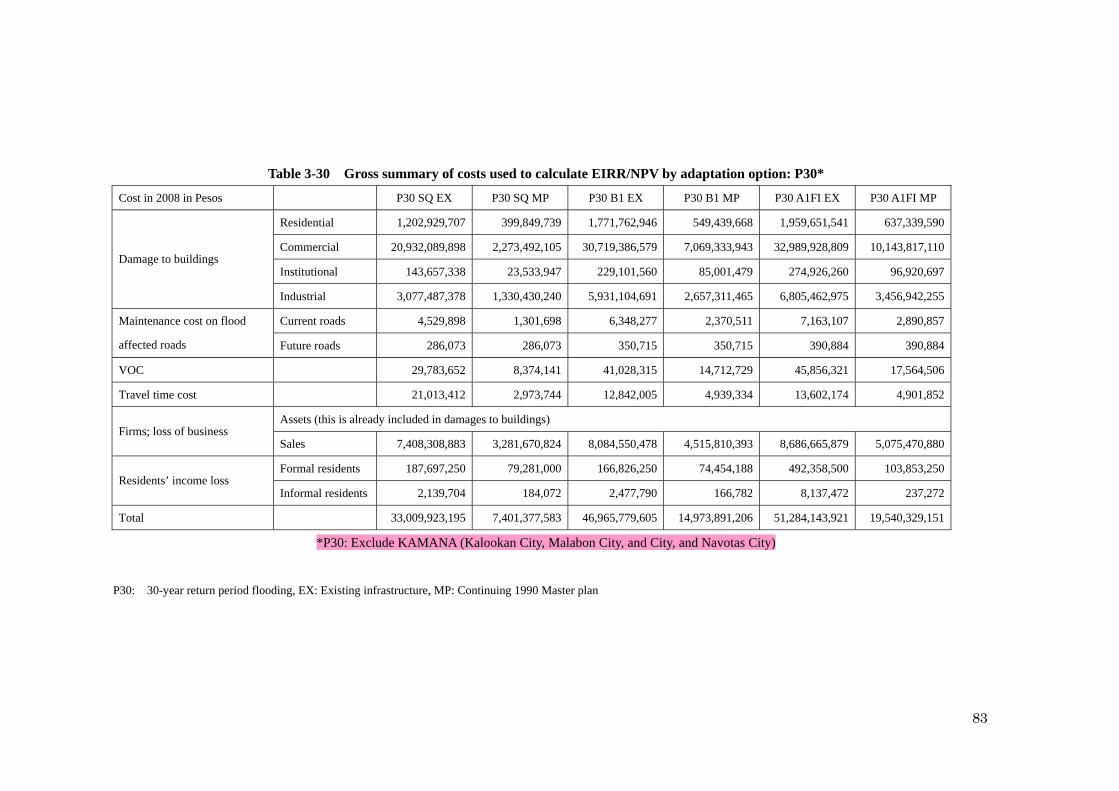
83
Table 3-30 Gross summary of costs used to calculate EIRR/NPV by adaptation option: P30*
Cost in 2008 in Pesos P30 SQ EX P30 SQ MP P30 B1 EX P30 B1 MP P30 A1FI EX P30 A1FI MP
Residential 1,202,929,707 399,849,739 1,771,762,946 549,439,668 1,959,651,541 637,339,590
Commercial 20,932,089,898 2,273,492,105 30,719,386,579 7,069,333,943 32,989,928,809 10,143,817,110
Institutional 143,657,338 23,533,947 229,101,560 85,001,479 274,926,260 96,920,697Damage to buildings
Industrial 3,077,487,378 1,330,430,240 5,931,104,691 2,657,311,465 6,805,462,975 3,456,942,255
Current roads 4,529,898 1,301,698 6,348,277 2,370,511 7,163,107 2,890,857Maintenance cost on flood
affected roads Future roads 286,073 286,073 350,715 350,715 390,884 390,884
VOC 29,783,652 8,374,141 41,028,315 14,712,729 45,856,321 17,564,506
Travel time cost 21,013,412 2,973,744 12,842,005 4,939,334 13,602,174 4,901,852
Assets (this is already included in damages to buildings) Firms; loss of business
Sales 7,408,308,883 3,281,670,824 8,084,550,478 4,515,810,393 8,686,665,879 5,075,470,880
Formal residents 187,697,250 79,281,000 166,826,250 74,454,188 492,358,500 103,853,250Residents’ income loss
Informal residents 2,139,704 184,072 2,477,790 166,782 8,137,472 237,272
Total 33,009,923,195 7,401,377,583 46,965,779,605 14,973,891,206 51,284,143,921 19,540,329,151
*P30: Exclude KAMANA (Kalookan City, Malabon City, and City, and Navotas City)
P30: 30-year return period flooding, EX: Existing infrastructure, MP: Continuing 1990 Master plan

84
Table 3-31 Gross summary of costs used to calculate EIRR/NPV by adaptation option: P10*
Cost in 2008 in Pesos P10 SQ EX P10 SQ MP P10 B1 EX P10 B1 MP P10 A1FI EX P10 A1FI MP
Residential 0 0 0 0 0 0
Commercial 0 0 0 0 0 0
Institutional 0 0 0 0 0 0Damage to buildings
Industrial 0 0 0 0 0 0
Current roads 0 0 0 0 0 0Maintenance cost on flood
affected roads Future roads 0 0 0 0 0 0
VOC 0 0 0 0 0 0
Travel time cost 0 0 0 0 0 0
Assets (this is already included in damages to buildings) Firms’ lost business
Sales 438,472,844 326,998,515 584,106,488 444,547,816 666,963,752 504,129,532
Formal settlers 48,944,250 30,666,938 74,644,875 39,602,250 74,155,500 43,647,187Residents’ income loss
Informal settlers 128,478 76,608 227,430 76,608 383,838 108,528
Total 487,545,572 357,742,061 658,978,793 484,226,674 741,503,090 547,885,248
*P10: Exclude KAMANA (Kalookan City, Malabon City, and Navotas City)
P10: 10-year return period flooding, EX: Existing infrastructure, MP: Continuing 1990 Master plan

85
3.10 Impacts on other public infrastructures and utilities
3.10.1 Power
This report identifies the critical parts of the existing power infrastructure that are vulnerable to
floods based on information from power-related companies. The potentially affected facilities and
related costs are presented and a rough estimate of the losses caused by power outages is calculated.
In the Philippines, the production, transmission and distribution of power are handled by three main
entities: the National Power Corporation (NAPOCOR), the National Transmission Corporation
(TRANSCO) and Meralco. NAPOCOR is mainly responsible for energy production, while
TRANSCO handles the main transmission and Meralco distributes energy to end-users.
Of the three TRANSCO substations in the Metro Manila area, two, as shown in Fig. 3-10, could be
affected by flooding. One of these, the Araneta substation, is located within an area of Quezon City
that has an estimated water depth of about 2 meters in the simulated flood. The company claims,
however, that the substation is on higher ground and would not be affected by flooding. Meralco,
on the other hand, has approximately 117 substations that serve the metropolis. Similar to Araneta,
most of these substations are located on high ground and only a few would be affected even if water
depths reach 6 meters. However, once water reaches ground level, these substations automatically
shut down for a few hours until the water has receded and switching equipment has fully dried out.

86
Figure 3-10 Flood-affected TRANSCO substations in Metro Manila
Table 3-32 below presents Meralco substations potentially vulnerable to floods and their
corresponding service areas. The potentially vulnerable areas are concentrated in Pasay, Manila,
and Taguig.
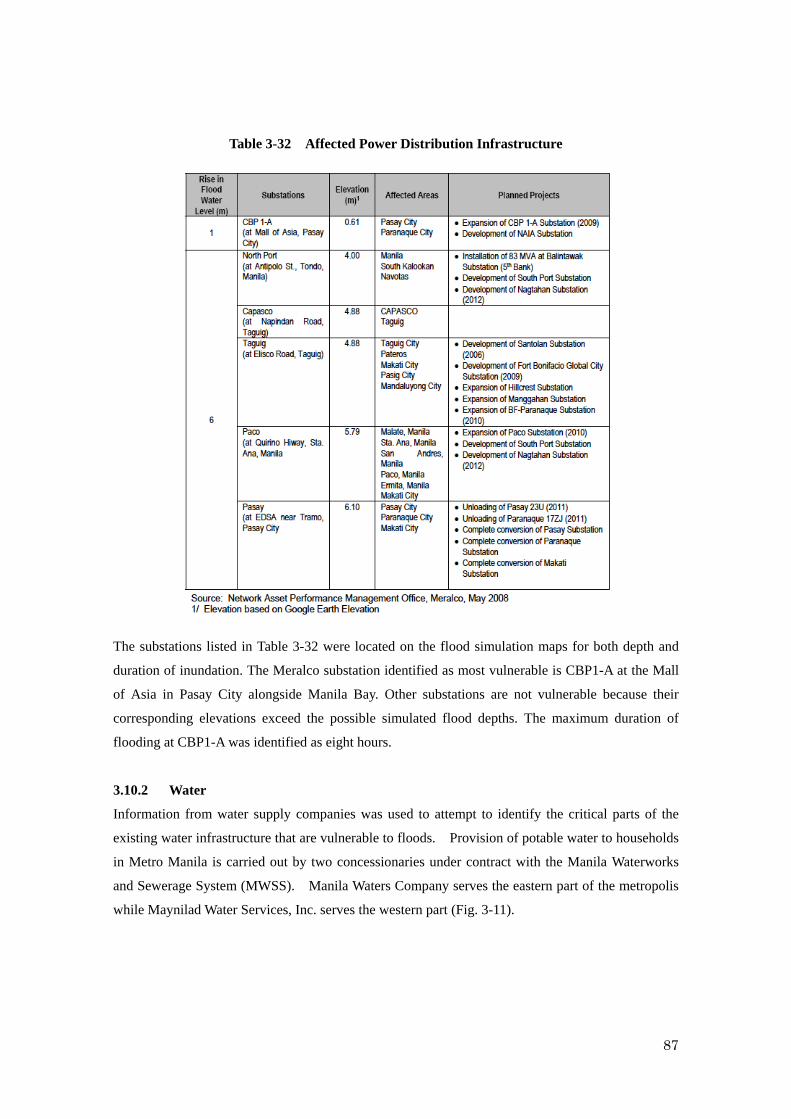
87
Table 3-32 Affected Power Distribution Infrastructure
The substations listed in Table 3-32 were located on the flood simulation maps for both depth and
duration of inundation. The Meralco substation identified as most vulnerable is CBP1-A at the Mall
of Asia in Pasay City alongside Manila Bay. Other substations are not vulnerable because their
corresponding elevations exceed the possible simulated flood depths. The maximum duration of
flooding at CBP1-A was identified as eight hours.
3.10.2 Water
Information from water supply companies was used to attempt to identify the critical parts of the
existing water infrastructure that are vulnerable to floods. Provision of potable water to households
in Metro Manila is carried out by two concessionaries under contract with the Manila Waterworks
and Sewerage System (MWSS). Manila Waters Company serves the eastern part of the metropolis
while Maynilad Water Services, Inc. serves the western part (Fig. 3-11).

88
Figure 3-11 Water supply facilities in Metro Manila
According to interviews with the water supply companies, flooding is not a concern for these water
providers as they claim that their pipes are positively charged. This means the pressure in the pipes
is strong thereby preventing infiltration of dirty water or other contaminants. They also claim that
their facilities, such as pumping stations, are above flood levels. There is no record of flooding
incidents in their databases. It is, therefore, not possible to assume any detailed damage to the
functioning of the water system due to flooding. Households that depend on wells, however, can be
affected by flooding.
3.10.3 Rail
Rail operations are vulnerable to floods. There are three major urban elevated rails operating within
Metro Manila: the Light Rail Transit Line (LRT1), the Metro Rail Transit Line 2 (MRT2), and the
Metro Rail Transit 3 (MRT3). The routes and stations of each line are given below in Table 3-33.
Since Meralco provides power for urban rails and the power rectifier substations (RSS) of all urban
rails are located at ground level, the entire transportation system in Metro Manila is greatly

89
influenced by power cuts caused by intensified flooding.
Table 3-33 Urban Rail System in Metro Manila
Table 3-34 lists the substations potentially affected by flooding. Under the SQ and A1FI scenarios,
LRT 1 is partially paralyzed due to discontinued operation of substations RSS 3 and 7. If RSS 5
and 6 also shut down, the entire line will stop.
Table 3-34 Flood-affected RSS Supporting Urban Rail Transport8
Converting this effect into monetary terms would mean an income loss of 4.7 M Php per day for the
line.9 However, we have not included this number in the damage cost as the effect of LRT 1
shutting down may also be accounted for through loss of daily income.
8 Any impact on RSS nos. 5 and 6 would paralyze the entire line. 9 ALMEC, pp. 4-17. This is based on the reported 2007 Income of the LRT Line 1 of P 1.707.67 M with 360 operating days.

90
Chapter 4 Methodology Part Three: Intangible Risk Analysis (Health)1
4.1 Introduction
This section aims to characterize and quantify human health risks associated with exposure to
pathogens present in floodwater as an example of an intangible risk related to flooding in Metro
Manila. Here, exposure scenarios based on different inundation levels are developed in which direct
and indirect contact with water are assumed to occur.
4.2 Data and Methodology
4.2.1 Data
In this study, the authors combined GIS population density and flood inundation (Status Quo and
A1FI climate scenarios, existing flood control infrastructure) data and then calculated the level of
relevant risk. The GIS data include city boundaries as of 2003 within Metro Manila, grouped
together by District; population statistics based on the 2000 census conducted by the National
Statistics Office; and flood inundation GIS data, based on different climate scenarios.2
The US Environment Research Institute’s (ERSI) ArcGIS 9.2 software was used to match population
with district boundaries. The output of that process, a shapefile, contains Metro Manila district
boundaries as of 2000 matched with year 2000 population. Based on this shapefile, a population
density (people/hectare) map was created. The GIS inundation data was then used to create
inundation maps. The minimum flood level (in meters) of the Status Quo and A1FI climate scenarios
form the basis for the maps. Risk, depending on different exposure scenarios, was assessed
according to inundation levels and the results were matched with the inundation map to create a new
map of potential risk at different locations.
4.2.2 Risk Assessment
Quantifiable risk assessment was initially developed to assess human health risks associated with
exposure to chemicals (Hass, 1999). In its simplest form, it consists of four steps, namely:
Hazard assessment
Exposure assessment
Dose-response analysis
Risk characterization
1 This Chapter is based on the findings of Tran Thi Viet Nga and Fukushi, K. (2008) “Infected Risk Assessment with Exposure to Pathogens in the Flood Water- Case of Metro Manila”. 2 Flood inundation data from Chapter 2.

91
4.2.2.1 Hazard assessment
A human health risk assessment was conducted to evaluate the risk associated with pathogen (E.
coli) exposure in the flooding areas for the following scenarios: (1) Inundation depths of 0-50 cm;
(2) Inundation depths of 50-100 cm; (3) Inundation depths of 100-200 cm, and (4) Inundation depths
above 200 cm. These scenarios are chosen based on the classification of “human interactions” set in
the Flood Fighting Act, Japan, 2001:
Table 4-1 Classification of Inundation Depth
Level Inundation depth Human interaction
I 0-50 cm Most houses will stay dry and it is still possible to walk
through the water
II 50-100 cm There will be at least 50 cm of water on the ground floor
III 100-200 cm The ground floor of houses will be flooded
IV > 200 cm Both the first floor and often the roof will be covered by
water
Note: Classification based on Flood Fighting Act, Japan, 2001
In this analysis, exposure scenarios according to inundation levels were developed in which direct
and indirect contact with water was assumed to occur. Probabilities of gastrointestinal infection were
estimated based on established dose-response relationships for the indicator pathogen (E. coli),
which is present in floodwater. Due to data limitations, the E. coli concentration in contaminated
surface water from a previous study (Nga, 1999) was used to evaluate the risk. Ingestion was
assumed to be the exposure route. Figure 4-1 shows the exposure mechanism schematically.

92
Figure 4-1 Infection routes through direct and indirect contact with contaminated floodwater
4.2.2.2 Exposure Assessment
Various groups of people have different vulnerabilities, experiences, coping behaviors and responses
to flooding among due to gender, age, job, lifestyle and other factors. Because of data constraint
the analysis here focuses on age. The Metro Manila population was divided in to four groups,
namely a) 0 to 4 year-olds, b) 5 to 14 year-olds, c) 15-59 year-olds, and d) those above 60 years old,
based on the 2000 census conducted by the National Statistics Office (NSO, 2000). The proportion
of each age group is displayed in Fig. 4-2. Daily activities and behaviors of each age group were
examined and studied through a literature review to determine the amount of time people would
spend in water in the event of a flood. Default ingestion intake values were derived from the U. S.
Environmental Protection Agency (USEPA) Risk Assessment Guidance for Superfund (RAGS).
For each exposure scenario, risk was first calculated for a single exposure event.
Flood
WaterConcentration of
pathogen in
water environment
(CFU/mL)
Accidental ingestion of contaminated water
through daily activities in the flood period
(washing, bathing, fishing, moving furniture,
cooking, playing in the flood…
Ingestion of contaminated water through
eating and drinking
Infection routes

93
Figure 4-2 Distribution of Age in Metro Manila
Source: NSO, 2000 Census of Population and Housing
(1) Inundation depth of 0-50 cm
Direct floodwater contact in this scenario occurs primarily while walking on roads. For this
assessment, it was assumed that in one day the total time spent outdoors for the age groups of 4 years
and under, 5-14 years, 15-59 years and over 60 years old are 2, 4, 4, and 1 hour, respectively, with
the assumption that 50% of total outdoor time would be spent in water. Since the inundation depth is
less than 50 cm, water-contact activities would likely only occur during walking on flooded streets.
The potential route of pathogen exposure is indirect ingestion of floodwater as result of hand-to
mouth activities. Hand to mouth transfer may be significant for the baby group (< 4-years old) who
spend time playing with water. In this analysis, the mean incidental ingestion rate was assumed to be
50 ml/hour for babies (less than 4 years old) and 10 ml/hour for children (5-14), adults (15-59), and
seniors (over 60 years old). These values are derived from the USEPA’s Risk Assessment Guidance
for Individuals Exposed to Surface Water During Wading.
(2) Inundation depths of 50-100 cm
At this depth, people would likely be in water whenever they go out, so it was assumed that 100% of
the time outdoors would be spent in the water. The exposure route is again indirect ingestion from
moving in floodwater. Floodwater may also be used for bathing or washing personal belongings.
11 %
19 %
64 %
6 %
0 ‐4 years old ‐
5 ‐14 years old ‐
15 ‐59 years old
over 60 years old ‐
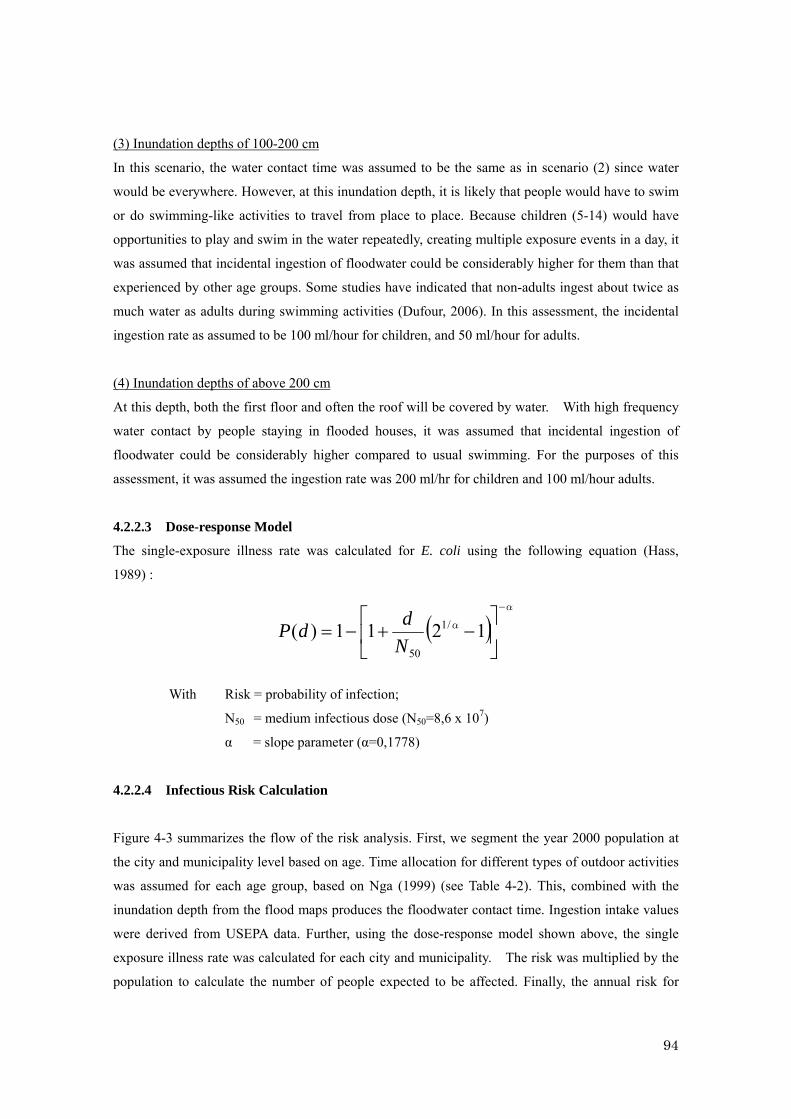
94
(3) Inundation depths of 100-200 cm
In this scenario, the water contact time was assumed to be the same as in scenario (2) since water
would be everywhere. However, at this inundation depth, it is likely that people would have to swim
or do swimming-like activities to travel from place to place. Because children (5-14) would have
opportunities to play and swim in the water repeatedly, creating multiple exposure events in a day, it
was assumed that incidental ingestion of floodwater could be considerably higher for them than that
experienced by other age groups. Some studies have indicated that non-adults ingest about twice as
much water as adults during swimming activities (Dufour, 2006). In this assessment, the incidental
ingestion rate as assumed to be 100 ml/hour for children, and 50 ml/hour for adults.
(4) Inundation depths of above 200 cm
At this depth, both the first floor and often the roof will be covered by water. With high frequency
water contact by people staying in flooded houses, it was assumed that incidental ingestion of
floodwater could be considerably higher compared to usual swimming. For the purposes of this
assessment, it was assumed the ingestion rate was 200 ml/hr for children and 100 ml/hour adults.
4.2.2.3 Dose-response Model
The single-exposure illness rate was calculated for E. coli using the following equation (Hass,
1989) :
With Risk = probability of infection;
N50 = medium infectious dose (N50=8,6 x 10⁷)
α = slope parameter (α=0,1778)
4.2.2.4 Infectious Risk Calculation
Figure 4-3 summarizes the flow of the risk analysis. First, we segment the year 2000 population at
the city and municipality level based on age. Time allocation for different types of outdoor activities
was assumed for each age group, based on Nga (1999) (see Table 4-2). This, combined with the
inundation depth from the flood maps produces the floodwater contact time. Ingestion intake values
were derived from USEPA data. Further, using the dose-response model shown above, the single
exposure illness rate was calculated for each city and municipality. The risk was multiplied by the
population to calculate the number of people expected to be affected. Finally, the annual risk for
α
α
1211)( /1
50N
ddP

95
each age category was estimated.
Figure 4-3 Flowchart for Risk Calculation
Table 4-2 Assumptions used in risk calculations
Parameter Symbol Unit Distribution/notes
E. coli Concentration
CE
MPN/100
ml
A mean value of 30,000 MPN/100
mL (18,000-50000) was taken as the
E. coli concentration in flood water
(Nga, Master’s thesis, 1999)
Water Ingestion Rate during walking
Age <4
Age 5-14
Age 15-59
Age >60
ml/hour
50 ml/h
10 ml/h
10 ml/h
10 ml/h
Water Ingestion Rate during swimming
Age 5-14
Age 15-59
ml/hour
100 ml/h
50 ml/h
Time spent outdoors
Age <4
Age 5-14
Age 15-59
Age >60
T hours/day
Assumed 1 hour
Assumed 4 hours
Assumed 4 hours
Assumed 1 hours
Fraction of outdoor time spent in water F % Assumed, varies according to
inundation levels
Dose-response model (Hass equation)
< 4 years old
5-14 15-59 > 60
Outdoor time contact time with flood water
intake rate ingestion volume
Dose
POPULATION
Infection risk TOTAL RISK
years old years old years old

96
N50
α
8.6 x 10^7
0.1778
4.3 Results and Discussions
4.3.1 Flood Identification
Figure 4-4 shows that among the 17 cities and municipalities in Metro Manila, the western coastal
district of Manila City has highest population density, more than 500 people per hectare. The areas
in the south and northeast have lowest population density, less than 110 people per hectare.

97
Figure 4-4 Population density map of Metro Manila
Map was created by overlaying city boundary polygons on classified population
densities in ArcMap 9.2
The GIS inundation data was then used to create inundation maps. We used the minimum level (in
meters) of the Status Quo and A1FI climate scenarios to produce the map shown in Figure 4-5.
Areas showing serious flooding with high inundation levels and high population densities are Manila
City, Quezon City, Pasig City, Markina City, San Juan and Mandaluyong City.

98
Figure 4-5 Status Quo Climate Metro Manila Inundation Map
Map produced in ArcMap 9.2 by overlaying district boundaries on classified minimum
inundation levels of (1) < 50 cm; (2) 50-100 cm; (3) 100-200 cm, and (4) > 200 cm.
City Boundaries
Distinct Boundaries
Less than 0.5m
0.5-1.5m
1.0-2.0m
2.0-5.0m
Legend
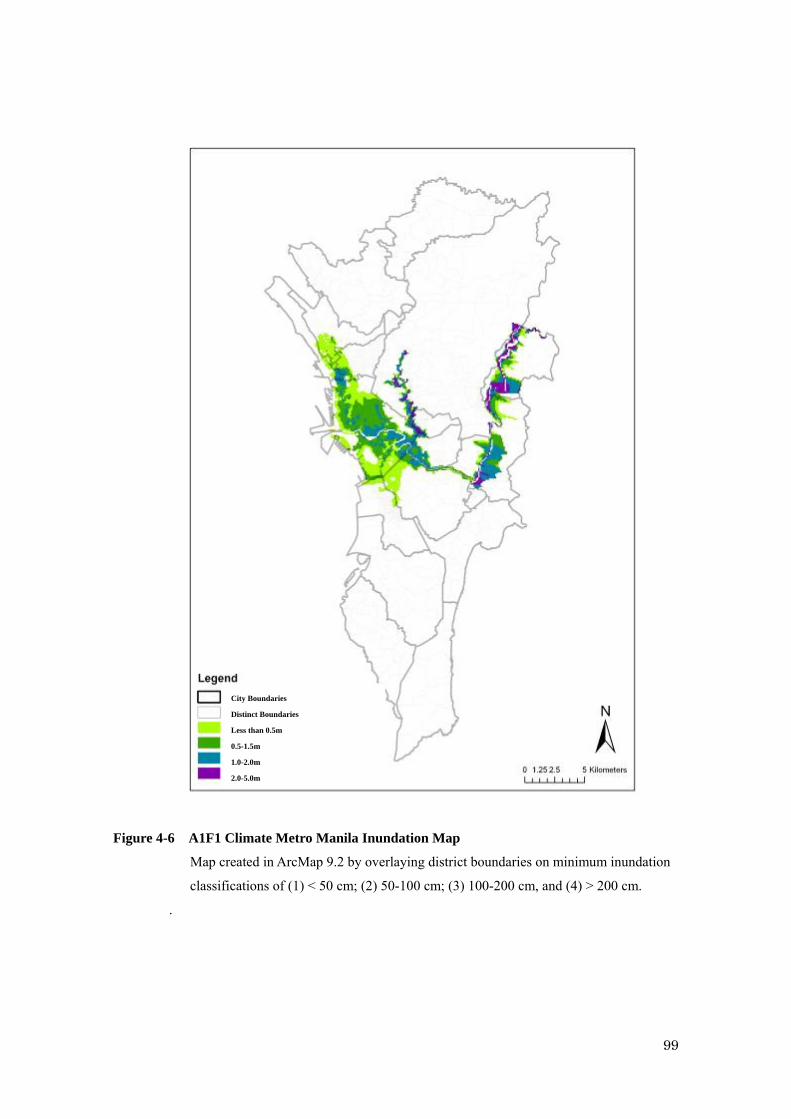
99
Figure 4-6 A1F1 Climate Metro Manila Inundation Map
Map created in ArcMap 9.2 by overlaying district boundaries on minimum inundation
classifications of (1) < 50 cm; (2) 50-100 cm; (3) 100-200 cm, and (4) > 200 cm.
.
City Boundaries
Distinct Boundaries
Less than 0.5m
0.5-1.5m
1.0-2.0m
2.0-5.0m

100
4.3.2 Exposure Assessment and Estimated Risk of Infection
4.3.2.1 Daily risk
Figures 4-7 and 4-8 show the infection risk throughout Metro Manila for the Status Quo and A1FI
scenarios. Figures 4-9 and 4-10 show the number of people infected in each scenario.
Figure 4-7 Distribution of estimated daily risk of infection via incidental ingestion of flood
water (Status-quo climate scenario) in Metro Manila.
Map created in ArcMap 9.2 by overlaying district boundaries on risk classifications.
City Boundaries
Distinct Boundaries

101
Daily risks of gastrointestinal illness via incidental ingestion for the Status Quo scenario were
0.000674, 0.001345, 0.005631 and 0.010328 for inundations of 0-50 cm, 50-100 cm, 100-200 cm,
and above 200 cm, respectively.
Figure 4-8 Estimated daily risk of infection via incidental ingestion of flood water
(A1FI climate scenario) in Metro Manila.
Map created in ArcMap 9.2 by overlaying district boundaries on risk classifications.
The risk of infection was calculated using the mean E. coli exposure level of 30,000 MPN/100 ml
from contaminated surface water data (Nga, 1998). Daily risks of gastrointestinal illness via
incidental ingestion for the A1FI climate scenario were 0.000674, 0.001345, 0.005631 and 0.010328
City Boundaries
Distinct Boundaries

102
for inundations of 0-50 cm, 50-100 cm, 100-200 cm, and above 200 cm, respectively.
Figure 4-9 Number of infected people due to gastrointestinal illness via incidental ingestion
of flood water in Metro Manila (Status-Quo climate).
Map created in ArcMap 9.2 by overlaying risk classification map on population density map
City Boundaries
Distinct Boundaries

103
Figure 4-10 Number of infected people due to gastrointestinal illness via incidental
ingestion of flood water in Metro Manila (A1FI climate).
Map created in ArcMap 9.2 by overlaying risk classification map on population density map
Table 4-3 shows the expected daily infections due to different flooding for conditions for each local
government.
City Boundaries
Distinct Boundaries

104
Table 4-3 Expected Number of people infected per day in Metro Manila by inundation level for Status-Quo and A1FI flooding
Infected people (based on SQ inundation data year
2003)
Infected people (based on A1FI inundation data
year 2003) Local Government
Unit Population
0-50 cm50-100
cm
100-200
cm
>200
cm
Total
(persons)0-50 cm
50-100
cm
100-200
cm
>200
cm
Total
(persons)
Manila City 1581082 60 114 316 11 500 275 729 1487 86 2576
Mandaluyong City 278474 6 28 200 10 244 5 22 318 31 377
Marikina City 391170 16 16 135 383 550 19 35 208 494 756
Pasig City 505058 11 55 270 97 433 13 56 489 225 783
Quezon City 2173831 14 21 118 186 339 15 21 198 270 504
San Juan 117680 3 5 70 57 135 2 3 62 138 205
Kaloocan City 1177604 21 9 0 - 30 57 45 112 - 215
Malabon 338855 3 0 0 - 3 69 12 0 - 81
Navotas 230403 17 10 0 - 27 29 9 29 - 66
Makati City 444867 36 28 77 - 141 66 31 103 - 207
Pasay City 354908 10 - - - 10 32 6 - - 38
Pateros 57407 - - 1 - 1 - - 1 - 1
Valenzuela City 485433 - - - - - - - - - -
Las Piñas City 472780 - - - - - - - - - -
Muntinlupa City 379310 - - - - - - - - - -
Parañaque City 449811 - - - - - - - - - -
Taguig 467375 - - - - - - - - - -

105
4.3.2.2 Estimation of Annual risk
According to Zoleta-Nantes (2000), 18 to 20 floods occur annually in Metro Manila. In this
analysis, one flood will count as one exposure, and we assume that one exposure will be one day
long. The annual risk based on a single exposure was estimated as in Hass (1999) and is
shown in Table 4-4:
Where n: number of exposures per year
Table 4-4 Single exposure and annual risk by age group due to pathogen exposure during
flooding
Inundation depth (cm) Group of
Age Risk
< 50 50-100 100-200 >200
daily risk 0.001491 0.002968 0.005879 0.005879 0-4
total risk 0.029407 0.057715 0.111231 0.111231
daily risk 0.000598 0.001194 0.005879 0.011536 5 to 14
total risk 0.011898 0.023615 0.111231 0.207095
daily risk 0.000598 0.001194 0.005879 0.011536 15 to 59
total risk 0.011898 0.023615 0.111231 0.207095
daily risk 0.000150 0.000299 0.001491 0.001491 >60
total risk 0.002992 0.005972 0.029407 0.029407
daily risk 0.000674 0.001345 0.005631 0.010328 Total
total risk 0.013398 0.026556 0.106796 0.187491
4.4 Conclusion
The risk of contracting gastrointestinal illness due to E. coli from incidental ingestion of flood
water in Metro Manila over the course of a year is 0.013398, 0.026556, 0.106796, and 0.187491
for inundation levels of less than 50 cm, from 50-100 cm, from 100-200 cm, and above 200 cm,
respectively. The risk of gastrointestinal illness is highest for the group from 4 -15 years old.
While the health risks associate with E. coli in this assessment are considerable, the risk of
nannual dPP )(11

106
gastrointestinal illness may actually be significant higher because other potentially pathogenic
microorganisms might be present in flood water that affect especially the young, the old and
those have frequent contact with water. Further, as with any risk assessment, there are many
sources of uncertainty in the analysis.

Chapter 5 Vulnerabilities of selected segments of the society and economy
5.1 Introduction
This chapter presents the results of analyses conducted to identify vulnerabilities of selected
segments of the society and economy. The first section covers an analysis at the household level,
focusing on the experiences of those living in areas affected by flooding, typhoons, and tidal surges
in the current climate. The household level respondents found difficulty in effectively
distinguishing the difference between typhoon events, as well as distinguishing between floods,
typhoons, and tidal surges. Therefore, the impacts discussed in the household section combine the
effects of floods, typhoons, and tidal surges. The second section covers an analysis of businesses at
the firm level, focusing on their experience in Typhoon Milenyo (2006) and other flood events.
5.2 Metro Manila: Urban development, environment and socio-economic characteristics
Metro Manila is the center of the Philippines’ political, economic and socio-cultural activities. Its
strategic location by Manila Bay and the mouth of the Pasig River led its growth and development as
the country’s capital city. Being near a river and a good harbor made possible the development and
expansion of the city and its suburbs over the last 30 years.
Over time, with large in-migration and rapid population growth, the city expanded to the suburbs,
and surrounding municipalities, including swampy areas, areas near or above esteros or water canals,
areas along the river or earthquake fault lines, and other sites that are risky for habitation. A large
part of the development occurring in informal settlements is unregulated. Thus, in Metro Manila,
many structures are built in dangerous areas near the seashore, in flood zones, or on unstable ground
that is prone to landslides.
Socio-economic forces like land use practices, infrastructure development, building standards, codes
and practices, urban development policies and programs have greatly shaped the settlement and
building patterns of the city. These forces generate an environment that poses high risks to
residents and infrastructure alike, especially in low-lying flood-prone areas.
A large portion of the population does not have job or housing security. Moreover, the 2008
Philippine Asset Reform Report Card estimated that only 61% of households in Metro Manila have
sufficient basic services, as most of the informal settlements do not have access to the water supply
or sewage facilities of the Manila Waterworks Sewage and Sewerage System (MWSS). The
metropolis has an estimated housing backlog of 4 million, about a third of its population.
107

Figure 5-1 Informal Settlements in Metro Manila, 2007
5.3 Household Level Effects1
5.3.1 Objectives and Methodology
The objective of this section is to assess the current strategies and modes of survival of residents in
flood-prone areas undergoing climate change, with particular focus on vulnerable groups in three
flood-prone areas of Metro Manila, namely, 1) the Pasig-Marikina River Basin, 2) the West
Mangahan area, and 3) the KAMANAVA area.
5.3.2 Methodology
A team from Ateneo de Manila University conducted preliminary fieldwork in the communities and
cities of KAMANAVA (Kalookan, Navotas, and Valenzuela), Cainta, Taytay, Marikina, Pasig and
1 This section is based on the findings of Porio, E. (2008) “Vulnerability, Adaptation and Resilience to Flood and Climate Change-Related Risks among Riverline Communities in Metro Manila”.
108

West of Mangahan to finalize the research framework and sampling design of the study. 2
After the field reconnaissance, the study selected poor urban communities from the KAMANAVA
(Kaloocan, Malabon, Navotas and Valenzuela) area, the Pasig-Marikina river basin, and the area
West of Mangahan because of their frequent experiences of flooding and regular tidal and storm
surges.
The study conducted household interviews in the following communities of the KAMANAVA area:
(1) San Agustin and (2) Longos in Malabon, (3) Navotas West, (4) Bangkulasi and (5) Bagumbayan
South, and (6) West Navotas in Navotas, and (7) Barangay 28 in Caloocan City. In the
Marikina-Pasig River Basin, the study chose the following communities: (1) Rosario, (2) Bagong
Ilog, and (3) Ugong in Pasig City and (4) Tumana in Marikina City. Lastly, in the West of
Mangahan area, the following sites were selected: In Taguig City, the barangays (districts) of (1)
Ibayo Tipas (2) Calzada, and (3) Napindan, and in Pasig City, (4) San Joaquin. The study
interviewed a total of 300 households (100 in each of the river basins) located in low-lying areas of
these barangays along the Pasig River System and its connecting tributaries
The study utilized a systematic sampling strategy with a random start (e.g., every 5 households
depending on the sampling area population) in selecting the 300 sample household respondents.
5.3.3 Environmental and social characteristics of the study sites
As mentioned earlier, the households in the study live in three flood-prone areas of Metro Manila,
namely, 1) the Pasig-Marikina River Basin, 2) the West Mangahan area, and 3) the KAMANAVA
area. These households are also located in low-lying areas, mostly wetlands and swamplands
around the following river systems and their tributaries: the Pasig-Marikina River, the Napindan
River in West Mangahan, and the Malabon and Tullahan Rivers in the KAMANAVA area, which are
connected to the sea (Manila Bay) and Laguna de Bay Lake. Thus, aside from their being
flood-prone, these areas also suffer the effects of heavy monsoon rains, typhoons, and in
KAMANAVA and West Mangahan, regular tidal surges. Most of the surveyed households belong
to informal slums or squatter settlements, with no security of tenure in their housing and no adequate
access to basic services like water, electricity, sewerage and drainage systems.
2 The flood data maps supplied to the research group needed field validation by local officials and residents in the flood-prone areas as communities along the river basins varied in terms of levels of flood experience, from none to very frequent. Because of this variation, it was very hard to determine the levels of risks in relation to the flood map. Most of the interviews were also conducted during the dry season, which may have made the respondents not so conscious of the risks generated by heavy monsoon rains, typhoons and floods.
109
Because of their location, the sample communities selected here are prone to floods from typhoons
and heavy monsoon rains from June to November, Metro Manila’s traditional rainy season.
Meanwhile, throughout the year, the KAMANAVA area is particularly susceptible to the effects of
sea level rise (SLR) through tidal surges. During the last few years, the residents have observed
changes in the climate patterns like typhoons and heavy monsoon rains continuing past the end of
the expected rainy season, into December or January or beginning early, in May.
5.3.4 Socio-economic and demographic characteristics of households
The study surveyed a total of 300 households in communities located in the three river basins. The
respondents were mostly female (86%) as they were the ones available and more willing to be
interviewed, compared to male household members. Their ages ranged from 18 to 92 years old,
with a median age of 42 years old. They were mostly legally married (61%), or had
live-in/cohabitation arrangements (20%), while the rest were widowed or separated (14%), or single
(4%). Their mean household income was Php 10,033 per month and the median monthly
household income was Php 8,000. Of the communities surveyed, the barangays of West Navotas
and San Joaquin in Pasig and Ibayo Tipaz in Taguig had the lowest monthly median income of Php
8,000 while Longos in Malabon and Bangkulasi in Navotas with Php 23,250 and Php 18,000,
respectively, had higher median income levels. Most of the poorest households, whose members
were old, widowed or separated, had no income and who were dependent on food support given by
their children or relatives came from these low-income communities.
Most of the respondents had obtained an average of 8.5 years of schooling, i.e., reached high school.
Only respondents from Malabon had attained some college education, with an average of 11.20
years in school. This low education level explains their low levels of formal employment, with
most of them deriving their sources of income from the informal sector, and therefore having low
household income levels. Tables 5-1, 5-2, and 5-3 give breakdowns of the survey respondents’ age,
civil status, and education, respectively.
110

Table 5-1 Age of respondent by area
Table 5-2 Civil status of respondent by area
West Mangahan
West Mangahan
111

Table 5-3 Education by area
5.3.5 Effects of Typhoons, Floods, and Storm/Tidal Surges
Of the 300 households interviewed, about two-thirds reported that they had been affected in the past
by floods (two-thirds), storm/tidal surges (almost one-half), and typhoons (almost three-fourths).
The respondents found it difficult to effectively distinguish different typhoon events, as well as
between floods, typhoons, and tidal surges. Therefore, in the section reporting household survey
results the impacts of floods, typhoons, and tidal surges are combined.
Table 5-4 Percentages of respondents affected by flooding by area
Affected by flooding
West of Mangahan
West Mangahan
112

5.3.5.1 Effects on Basic Services
Sewage, Garbage, Drainage, and Toilets
Slightly more than one-fourth (27 %) of the households have substandard toilets (antipolo type or
dug latrines) or none at all (they discharge direct to the river or sea or use their neighbor’s toilets).
These same households reported that floods and storm/tidal surges affected their toilets. Of those
who have toilets, about 27 % complained that during times of flooding, their toilets become clogged
with waste overflowing to their floor and they are forced to relieve themselves in the river/sea or in a
neighbor’s toilet that is located far from the flooded area. They complained that during floods and
tidal/storm surges their neighborhoods smell very bad and become quite dirty with floating
garbage, plastic bags, and human waste. Aside from the smell, dirt and environmental pollution,
they also complained that sometimes, huge worms or snakes emerge from their toilets, sewers,
and/or drainage pipes.
The respondents also complained about garbage carried by the floods and the tidal/storm surges
clogging the nearby canals and drainage channels. The residents of the KAMANAVA area,
particularly in San Agustin, Malabon and Bagumbayan South in Navotas complained that garbage,
mostly plastic bags, from other communities of the metropolis float near or under their floors.
According to the residents, this continuous flow of garbage discourages them from disposing of their
own trash properly because even if they do, their environment is still littered with garbage from
other people in other communities. Yet this polluted environment does not prevent children from
swimming in these waters, especially during heavy rains.
Electricity
Only 39 % of households have their own electric meter while 42 % of them buy their electricity from
their neighbor at a higher price. Meanwhile, 10 % of them admitted obtaining electricity through
illegal connections (i.e., stealing, using jumpers) from their neighbors and almost 9 % do not have
electricity at all and use oil lamps and candles for light. Candles and oil or gas lamps heighten the
risks faced by these households, as these are often the cause of fires in informal settlements. Those
who do have electric connections complained that during typhoons and floods, they often experience
energy fluctuations, “brown-outs”, and their electricity sources sometimes “ground out”. During
these times, the barangay police (tanod) ask them to shut off their electricity as a safety precaution.
Water
Almost one-third (32.3 %) of the households have a direct supply of piped water while the remaining
two-thirds (65.2 %) buy their water from suppliers or neighbors who have MWSS water connections
113

or have artesian or dug wells. Slightly less than one-fourth (23 %) of them have their water supply
affected when there are floods and storm/tidal surges. They then have to buy potable water from
water suppliers, who in turn, increase their prices. Thus, during floods and water surges, household
expenditures on water, as well as food commodities and transportation increase.
Sickness
Owing to the inadequate supply of potable water and compromised sanitation, a substantial number
of the respondents reported that they or their household members have become sick from the
typhoons, monsoon rains, and floods. The respondents reported losing from 2 to 98 days in the last
rainy season because they were sick and had to stay home or could not report for work or pursue
their business/livelihood activities. They complained that they themselves or their household
members suffered from skin itchiness/allergies, psoriasis, athlete’s foot, fever, colds, diarrhea,
typhoid, dengue, and the resurgence of primary complex or TB infections among children and the
elderly. Of those who suffered from flooding, the respondents themselves or their household
members were sick an average of 12 days.
Loss of income and assets
Those who were absent from work reported that they could not get out of their place nor could they
cross the river or streets or find transportation to their schools or place of work. During floods, the
transportation available (non-motorized tricycles and pedi-cabs) are not only few but also charge
higher fares (the driver may charge double the usual fare, for example Php 50 for a Php 25 tricycle
fare). Those who were unable to pursue their work or livelihoods said that business slowed down
during floods or it was impossible to vend or pursue their work and earn their livelihood during high
monsoon rains, typhoons, or floods. Some of the respondents also choose not to leave their homes
when floods or high tidal surges occur because they worry about their household appliances or
clothing getting wet and being destroyed. They lost between 1 and 15 days of income, averaging 4
days, losing an average Php 925, with the median being Php 500, during floods or tidal surges when
they could not go to work. Whether they work inside their homes, within the barangay, or in the city,
typhoons and floods still negatively affect them. If they work at home, their work is disrupted
because of the dirty water coming onto their floors. If they work outside the home, they cannot get
out of their house, through the street or get transportation to their place of work.
Those who were not able to work or pursue their livelihood activities reported losing earnings
ranging from Php 98 to Php 2,000 (average Php 1,081; median Php 500) in the last rainy season.
Aside from losses in earnings, the respondents also reported losses or damages to their household
appliances (refrigerators, TVs, washing machines, bed mattresses, roofs, cabinets, radios, electric
114

fans, water dispensers, etc.). The costs of these household assets ranged from Php 2 pesos to Php
50,000, with the average household loss being Php 4615 in the last rainy season.
School Absences
The parents in the study complained that their children also suffered from the monsoon rains,
typhoons and floods. About one-third of the children had had to be absent from their classes,
tremendously affecting their academic performance. The respondents reported that their children
were unable to go school for roughly 4 days in the last rainy season. Among the communities
surveyed, the respondents from Napindan and Calzada in Taguig City reported the most days missed
(7) while those from Longos, Malabon reported the least (1.5 days). The respondents as a whole
reported that their children could not go to school for an average of 5 days because of floods.
Disaster preparation
In preparation for floods and typhoons, residents store food supplies and other necessities; they
gather and put their household appliances and things on top of tables, shelves or in high places in
their homes so that water will not reach them. A few of them evacuate and go to neighbors’ or
relatives’ homes when the weather becomes bad and they expect their homes to be flooded.
In the KAMANAVA area, where there are regular tidal/storm surges, residents have adapted by
putting their clothes, furniture, and appliances in high places in their homes. Some of them have
devised platforms that they raise when water surges come.
A very small percentage (5%) of the respondents said that after the occurrence of typhoons and
floods, some community officials, religious leaders or associations came to their aid. They received
food, relief goods, medicine, housing materials, and instructions. Their barangay officials
instructed them to be careful.
The barangay officials in IbayoTipas, Calzada, and Napindan in Taguig reported that they vigilantly
watch the rise of water during floods to decide if they need to evacuate vulnerable residents to
nearby schools. In the case of Ibayo Tipas, the barangay officials evacuate the residents in
slum/squatter settlements to a nearby structure that is an extension of a bakery owned by the
barangay captain’s mother. She helps the evacuees with food and clothing for the wet children.
Support Network Availability
When asked what kind of support they received from their relatives, neighbors, friends and
community officials, the respondents showed a high level of reliance on informal networks. Those
115

who were able to get support from their relatives, friends and neighbors borrowed money for
subsistence, medicine, hospitalization, and school expenses. They also asked their support networks
to watch over their houses, children, or possessions during floods, typhoons and tidal surges.
More importantly, the interviews with key information sources revealed that the poor and vulnerable
households who do not have a wide network of friends, relatives or neighbors who can provide
support are also not able to access much support from formal institutions like the health clinic or
social work department of the local government unit.
5.3.6 Coping Strategies
5.3.6.1 Households: Water-based Lifestyle
Coping with the risks of storm/tidal surges and floods has been a key survival strategy for most
residents. They seem to have gotten used to constant flooding in their premises. According to some
residents, they have adjusted to a “water-based lifestyle”. They have gotten used to the floods and
regular rise of dirty water.
Residents have adjusted to flooding or to water rising onto their floors, streets, and surroundings.
Their perception or consciousness of risks or dangers posed by these risks is not very high. They
say “Hindi ka naman namamatay dahil sa baha!” (You do not die from floods or rising waters here!).
For example, the risk of catching an infection like leptospirosis, a deadly disease contracted through
contact with rat urine, is not high in their consciousness. The risks of catching a disease or
infection from floodwater that can compromise their health does not seem to be very well recognized
among the respondents.
5.3.6.2 Local solutions/coping strategies
The local governments of Metro Manila have been finding innovative solutions to their
flooding-related problems. These solutions range from short-term to long-term strategies.
Navotas
In 2005 in the community of Bangkulasi, the Navotas mayor installed a “bombastic” (water pump)
to the delight of the residents who used to suffered from constant flooding and had to use mini-boats
made of Styrofoam to cross the streets and the river. In fact, during the field interviews, these
“styro” boats could still be seen hanging in the respondents’ houses. As a water diversion
technique, the pump drains the flooded barangay of water but other barangays nearby that do not
116

have a “bombastic” installed are then more likely to be flooded.
Barangay Bagongbayan South (BBS), which is located near Bangkulasi, started having more and
higher floods three years ago when Bangkulasi’s “bombastic” was installed. Floods that used to
reach the knees of BBS residents now reached their waists. This particularly affects the poor urban
settlers at the mouth of the river flowing towards Manila Bay. The garbage carried by the river
from different parts of the metropolis often floats into the houses of the residents during tidal surges
and floods during heavy monsoon rains and typhoons. Owing to the rising water level, houses near
the river are totally covered by water. These houses are connected by bamboo or wood bridges
which pose hazards such as the risk of falling into piles of debris and dirty, murky water to children
and adults walking at night as there are no lights.
Malabon
Most of the houses in Barangay San Agustin are located on the bank of the mouth of the river before
it joins Manila Bay. Some homes are on stilts over the water. During the last few years, some have
added another story or two to their housing structures to escape the rising waters. A cemented sea
wall, which some use as a wall for their lean-to-housing structures serves as a pathway for the
community but many people have fallen from it and drowned, especially during floods.
Pasig City
The residents in Barangay Rosario, in Pasig City, reported that in the past, tidal waters did not reach
the school and that tidal surges would only be up to their knees but for the last few years it has been
reaching their waists. In Rosario, whenever the water rises because of monsoon rains, typhoons
and tidal surges, residents have to put their appliances on top of tables, cabinets, or on movable
platforms that they hoist with ropes.
To cope with the rising waters, residents have built multiple level housing structures. Most of these
have rooms as rental units for people who work in nearby factories. But these multiple-level
structures also make the residents helpless during floods as they can be isolated and cannot go out.
During floods, residents reported that sludge and human wastes get inside the lower floors. This
causes respiratory and water-borne diseases.
Taguig City
Taguig has always been flooded, being a swampy area facing Laguna de Bay. To a certain extent, a
dike built several years ago along the Napindan River has protected the residents in nearby areas
from floods and tidal/storm surges. But it has also prevented the drainage of sewage and other
117

wastes to the river as well compromising the free flow of the of household/community drainage
system.
Heightening the impacts of floods and tidal/storm surges on the poor urban communities in the area
is the continuous building of middle-class residential and industrial structures in the swampy areas of
this city. The construction intensifies the flow of silt and clogging of substandard drainage
channels because of the fill materials used to strengthen the land.
Napindan
Building riprap or river walls to stem tidal surges and floods from monsoon rains or typhoons is one
of the strategies adopted by residents in Purok 5 and other communities along the Napindan River.
The residents have also built mini-ports or landing areas for boats transporting goods across the river
and for access to dry places where they can travel to their places of work. To mitigate the
destructive tendencies of floods, some better-off residents have raised their ground floors and/or
built second or third floors onto their homes.
During floods, some residents stay at home and wait for the floods to subside. Others intentionally
do not go to work but fish after the floods as they can make more money catching the milkfish that
wash out or escape from nearby fishponds in Laguna Lake than they can at their regular jobs.
Ibayo Tipas and Calzada
Residents in this area have constructed makeshift bamboo bridges to connect one household to
another. They also have formed warning groups or networks that alert residents to rising water or
floods or the coming of storms. The barangay officials have also organized groups, which if
needed, can coordinate and facilitate the evacuation of residents to nearby schools.
Marikina
Among the local governments of Metro Manila, Marikina has been one of the most successful in
constructing flood mitigation structures with the help of external assistance. In 1992, the Marikina
government reported a total of 6.36 square kilometers of flooded area but in 2004 this was reduced
to 4.40 square kilometers. What did the LGU do to achieve this reduction?
The LGU made concreting of roads a priority to reduce the amount of sand, pebbles, and
mud entering the drainage system.
Improvements were made to major outfalls. Rehabilitation and new construction now allows
flooded areas to recede faster and in the process, reduce flood damage and other impacts.
118

Regular massive dredging operations are undertaken allowing faster discharge of
floodwaters from residential subdivisions to creeks and rivers.
Obstructions such as squatters’ shantytowns/informal settlements along rivers, creeks and
drainage channels have been demolished waterways.
The LGU has improved existing water diversion channels.
In particular, Marikina has constructed river barriers and relocated squatters living along the
Marikina River. It has also cleared canals and constructed up-to-standard drainage systems.
Like most cities in Metro Manila, Marikina is characterized by rapid population growth due to
in-migration and high fertility. It has witnessed increasing densities in residential and industrial
sectors and decreasing agricultural land uses. But the local government is regulating these forces
through close monitoring of people settling in danger zones and regulation of residential subdivision
construction and industrial establishments that can cause pollution.
5.3.6.3 Characteristics of the Vulnerable Population
In summary, the surveyed households have a high level of social vulnerability given their common
characteristics:
All live in low-lying and/or swampy/wetlands, vulnerable to floods and storm/tidal surges.
The monthly median income is Php 8,000, which translates into only about Php 44/day (less
than US$ 1/day per person, given the current rate of exchange and consumer price index)
per person for food in a typical six-member household.
Most people live in slum/squatter settlements with no security of tenure in their housing,
and inadequate sources of water, electricity, health services, drainage and sanitation.
Of these 300 households, two-thirds regularly suffer damages due to typhoons floods, and
tidal/storm surges such as loss of income, health, and household assets. They have no
access to adequate basic services like potable water, toilet and sanitation facilities, electricity,
and endure inconveniences like evacuation or having to use their neighbor’s toilet or a
waterway as a toilet due to typhoons, floods and tidal/storm surges.
The study found a strong interaction between the environmental or ecological vulnerability of
communities along the river systems (Pasig-Marikina, Malabon-Tullahan and Napindan) and the
social vulnerability of the residents in these areas’ poor urban households. Thus, the effects on
poor households of climate changes like intensified typhoons, floods and storm/tidal surges are
heightened by the location of their homes and their low socio-economic status (i.e., low income, no
119

housing tenure, inadequate access to water, electricity, and drainage/sewage systems).
Among the urban poor, the very poorest are extremely vulnerable because they have no alternatives
for where to build or relocate their houses, find alternative jobs, or schools for their children. As
reported in the community survey, those who are elderly, sick, disabled or dependent on others have
less capacity to cope with the impacts of climate change. They are least able to cope with the
losses suffered from frequent typhoons, floods or tidal surges such as sickness, loss of income,
inability to pursue their livelihood, and loss of household assets. Women also bear the brunt of
taking care of sick children and of their homes during floods.
More importantly, the capacity to cope with these disasters is also weakened by the inability of their
local and national governments to provide necessary infrastructure and services or to repair and
restore existing ones. Among the local governments in the study, only Marikina and Navotas seem
to have actively responded with infrastructure development and innovation in order to stem the
effects of floods and other impacts of climate change.
5.4 Effects on Business a the Firm Level3
5.4.1 Objectives
The National Statistics Office (NSO) was commissioned by JICA to conduct the 2008 Survey on
Impact of Floods on Establishments (SIFE) in Metro Manila. The 2008 SIFE aimed to provide data
on flood risks and impacts on socio-economic vulnerability in selected areas in the National Capital
Region (NCR) or Metro Manila. In order to identify the vulnerability experienced by firms, The
SIFE focused on typhoon “Milenyo” which passed near Metro Manila in 2006 in addition to flood
risks in general under the current climate. Specifically, the SIFE asked for data on:
Firms’ general situation in regard to flood risks
Direct damages to firms’ physical assets
Sources of financing for rehabilitation of fixed assets and inventories
Impacts indirectly induced by the above damages such as production, profit, employment,
etc
Current and future measures adopted by firms in response to flood risks, and
Formal and informal roles of local communities in mitigating the impact of floods.
3 This section is based on the findings of National Statistics Office, Republic of the Philippines. (2008) “2008 Survey on Impact of Floods on Establishments, Final Report”
120

5.4.2 SIFE Areas
The 2008 SIFE covered four areas. The first three areas were determined according to the causes of
flooding. These areas are: the Pasig-Marikina Area where flooding is caused by the overflow of the
Pasig-Marikina River; the KAMANAVA Area where flooding is caused mainly by the rise in sea
level; and the West Manggahan Area where flooding is due to the overflow of Laguna de Bay lake.
The fourth area, Other Barangays, is located in KAMANAVA but is not identified as part of the
KAMANAVA Area for the purpose of this study. It consisted of flood-prone barangays reported by
Local Government Units, the National Statistics Office - National Capital Region (NSO-NCR) field
offices, and the websites of the Citizen’s Disaster Response Center and Philippine newspapers
archives.
The SIFE covered sample establishments from 47 barangays. There were 28 total barangays from
the Pasig-Marikina Area (4 barangays from Marikina, 10 from Pasig, and 14 from KAMANAVA).
For the KAMANAVA Area, the total number of barangays was 22 and for the West Mangahan Area,
7. Ten barangays were surveyed for the Other Barangays category.
The 2008 SIFE covered establishments with Average Total Employment (ATE) of 10 and over. The
survey canvassed only formal businesses in the following seven sectors of the amended 1994
Philippine Standard Industrial Classification (PSIC):
Manufacturing
Construction
Wholesale and Retail Trade, Repair of Motor Vehicles, Motorcycles and Personal
and Household Goods
Hotels and Restaurants
Transport, Storage and Communications
Financial Intermediation and Health and Social Work
5.4.3 Profile of Respondents
In the different target areas, the number of responding establishments were: 179 in the
Pasig-Marikina Area; 66 in the KAMANAVA Area; 58 in the West Mangahan Area; and 76 in Other
Areas. By sector, 53.9% of the total responding establishments engaged in manufacturing; 13.4% in
wholesale and retail trade; 5.2% in transport, storage and communications; and 4.5% in health and
social work. Hotels and restaurants, construction, and financial intermediation were also represented
(Table 5-5). Overall, the great majority (74.2%) of the respondent establishments were corporations
and the nationality of the stockholders or owners were overwhelmingly Filipinos (97.0%).
121

Table 5-5 Distribution of Establishments by 1994 PSIC Major Division by Area: 2008 SIFE
Number of Establishments by 1994 PSIC Major Divisions
SIFE Survey Areas Total Number of
Establishments D F G H I J N
(1) (2) (3) (4) (5) (6) (7) (8) (9)
ALL ESTABLISHMENTS 286 168 12 43 23 16 5 19
PASIG-MARIKINA BGYS 179 106 9 24 14 12 3 11
KAMANAVA BGYS 66 43 2 11 1 4 2 3
WEST MANGAHAN BGYS 58 38 2 9 1 3 5
OTHER BARANGAYS 76 41 1 14 9 4 1 6
PSIC Divisions: D - manufacturing, F - Construction, G - Wholesale and Retail Trade, Repair of Motor Vehicles,
Motorcycles and Household Goods, H - Hotels and Restaurants, I - Transport, Storage, and Communication, J
--Financial Intermediation, N - Health and Social Work
5.4.4 General Situation with regard to Flood Risks
The highest average number of times establishments experienced flooding was 40 times during
2005-2007 in the Pasig-Marikina and KAMANAVA Areas. In the West Mangahan Area, the
maximum average yearly number of times establishments experienced flooding has decreased from
11 in 2005 to 8 in 2007. Most respondents reported having flooding no more than five times yearly
from 2005 to 2007 in the Pasig-Marikina, West Mangahan area, and Other areas. The highest
maximum number of days establishments stopped operation in any of the four areas was 14, reported
by establishments in the West Mangahan area. Most establishments had one to two days of work
stoppage. Table 5-6 summarizes the flood-caused work stoppages by area.
122

Table5-6 Number of affected firms and days of work stoppage by area
West Mangahan Bgys
5.4.5 Magnitude of Damages to the Establishments Caused by Typhoon Milenyo
5.4.5.1 Description of Typhoon MILENYO
When typhoon Milenyo hit the Philippines before noon of 27 September 2006, everything in its path
felt the fury of the heavy rains and strong winds. The hardest hit areas were the Bicol region and
Southern Tagalog provinces as water supply, electricity and landline communication were cut off.
Landslides were very common. Human lives were lost. Other lives were dramatically saved.
Houses were buried or washed away. Rivers overflowed. Planted crops were destroyed.
PAG-ASA, the Philippine weather bureau, raised signal no. 3 when typhoon Milenyo hit Metro
Manila at around 10:00 am. It carried with it maximum winds of 130 kph and gusts of up to 160 kph.
At about 4:00 pm of that day, the typhoon signal was lowered to no. 2. While the metropolis also
suffered from the wrath of Milenyo, the damages to lives and property were in many cases caused by
the strong winds that brought debris from uprooted trees, pieces of galvanized iron sheets, and fallen
electric poles and billboards resulting to power outage and unavailability of water supply in almost
all parts of the metropolis. Operation of the overhead train system (MRT and LRT) also stopped.
Two runways of the Ninoy Aquino International Airport faced closure for five hours.
The government declared all schools and offices closed on that day and the day after. Many private
firms including large business establishments also stopped operation for the day as they sent home
their employees. The high degree of damages, if any, was the main reason why some firms
remained closed the following day.
123

5.4.5.2 Number of Days Establishments Temporarily Stopped Operation
About 165 of the 233 establishments that were affected by typhoon Milenyo reported to have
temporarily stopped operation, for periods ranging from 0.08 days to 7 days, during the onslaught of
the typhoon. The number of days that these establishments temporarily stopped operating varied
according to the major industry division in which they operated.
Table 5-7 Number of Establishments that Temporarily Stopped Operation Due to Typhoon
MILENYO and the Minimum and Maximum Days of Stoppage by Area and Main Economic
Activity: 2008 SIFE
5.4.5.3 Reasons Cited For Effects on Business Operation
The survey results showed that business operations were definitely affected by the strong winds that
came with the typhoon, which lasted for roughly five hours. From among the many possible
reasons why business operation was affected by typhoon Milenyo, the 233 affected sample
establishments, in the following order, pointed out three main reasons:
Shortage of electricity/power outage (73.8 %)
Insufficient number of employees who reported to work (66.1 %)
Sales of goods and services were lower than the usual level (46.8 %).
The inability of establishments to deliver finished goods and the inability of suppliers to deliver raw
materials and supplies were considered to be other main causes affecting business operations.
124

Table 5-8 Reasons why business operations were affected by typhoon Milenyo
5.4.5.4 Employees Who Did Not Report to Work
Nearly half (49%) of the affected establishments reported that from 1% to 50% of their employees
did not report to work immediately after typhoon Milenyo hit the country. Over 20% reported that
at least 50% of their workforce did not report to work the following day after typhoon Milenyo hit
Metro Manila. This was expected as many parts of Metro Manila, including the flood-prone areas,
were still having transportation problems and power outages. In addition, many employees needed
to remain at home to repair their houses.
Table 5-9 Reasons for employees' absence from work
Reasons
Problems delivering products Low Sales Problems receiving raw materials Employee shortage Machines/Equipment Inventory Damage Cancelled orders Electrical power outage Damages to Telecommunication/Internet
Water Shortage Others
West Mangahan Bgys
Unavailability of Transportation
Health Problems
TroubleSecuring Food
House Repairs
Other
<Reason>
Area Area
5.4.5.5 Amount of Sales Lost
The temporary stoppage of business operation in 165 establishments during the onslaught of typhoon
Milenyo certainly brought loss in sales. Sectors that depend on the daily patronage of customers
for their income, like hotels and restaurants and transport, storage and communication, were one of
the hardest hit. Losses in sales ranged from a low of Php 5,000 to a maximum of Php 5,000,000. A
maximum of Php 10 million in sales was reported to be lost in a manufacturing establishment when
typhoon Milenyo hit Metro-Manila.
125

Table 5-10 Sales and asset loss caused by typhoon Milenyo by Area (Php)
Note: Number of affected firms is given in parentheses
West Mangahan Bgys
Table 5-11 Sales and asset loss caused by typhoon Milenyo by Sector (Php)
Note: Number of affected firms is given in parentheses
5.4.5.6 Damaged assets (fixed assets and inventories)
About 93 of the 286 establishments interviewed reported that their fixed assets and inventories were
damaged by typhoon Milenyo. Establishments engaged in the manufacturing sector experienced the
126

highest prevalence of damage with 80.7%, while the lowest belonged to the transport storage and
communications sector with 57.1%.
5.4.5.7 Sources of Financing for the Rehabilitation of Fixed Assets and Inventories Damaged
by Typhoon Milenyo
Out of the 286 establishments interviewed, 65 establishments reported that they used their own funds
to pay for flood damages, 11 obtained loans from private banks, and 12 establishments got money
from their insurance policies. There were three establishments who reported that they received
assistance from their parent companies located in Metro Manila. Establishments located in the four
study areas got their financing from the same sources. In all areas, the highest percentage of
financing came from the establishments’ own funds, followed by insurance and loans from formal
private banks.
5.4.5.8 Flood Countermeasures Undertaken by Establishments
Changing Business Location
For all establishments, 74 out of 286 establishments or 25.6% of establishments changed locations as
a flooding countermeasure. The maximum number of moves was four. Financial intermediation
had the highest percentage offices that moved with 80.0% while hotel and restaurant establishments
had the smallest percentage with 8.7%.
Adding Fill to Land Within Premises
There were 67 establishments or 23.4% that had refilled some or all of the land within their premises
in the last five years. The number times that fill had been added varied from one to seven times.
Establishments situated in the KAMANAVA area had the highest percentage (51.5%) and had
refilled their land a maximum of seven times.
Increasing the Number of Stories in Buildings
Only 19 out of 286 establishments interviewed or 6.6% had increased the number of stories of any of
their buildings in the last five years. The highest percentage was by establishments in the
KAMANAVA area with 10.6%, while Other Barangays had the lowest with only 3.9%. There were
12 establishments or 4.2% reporting that they still planned to increase the number of stories in any of
their buildings.
Other Measures to Minimize the Effects of Flooding
In 2008, 36 establishments protected their vital records. Thirty-one implemented safe storage of
127

hazardous materials. Twenty-eight said that they were maintaining sufficient inventories of raw
materials and supplies and had installed disaster prevention plans. Only 17 establishments had
prepared for transportation in emergencies and installed disaster recovery plans. Among other
measures taken by establishments to minimize the effects of flooding included installation of motor,
electric, or automatic submerged pumps; cleaning or declogging of drainage, building their own
drainage systems or open canals, and improving or repaired their drainage systems.
5.4.5.9 Measures Managed by Private Community-Based Organizations to Mitigate the
Damages Caused by Floods
Level of Awareness and Preparatory Measures Undertaken by Private Community-Based
Organizations to Mitigate Damages Caused by Floods
About 15.7% of establishments were aware of preparatory measures undertaken by private
community-based organizations. By area, the level of awareness was highest among
establishments based in the West Mangahan area at 24.1%, followed by those in Pasig-Marikina with
17.9 %.
The most common type of preparatory measures to mitigate damages caused by floods undertaken
by private community-based organization were preparation of emergency transportation and
construction of dikes, reported by 18 and 15 establishments, respectively. Firms also reported that
private organizations had undertaken cleaning and improvement of canals, drainage and sewage
systems.
Types of Cooperative Activities that Exists Among Establishments to Restore the Normal
Business Environment after Flooding Occurs
There were several cooperative activities that existed among the establishments to restore the normal
business environment after occurrence of flooding. The top three activities were:
Repair of damages to public infrastructure
Provision of loans or assistance for recovery
Lending of machines, equipment and tools
Nine establishments mentioned cleaning and declogging of drainage and canals as other type of
cooperative activities.
Types of Assistance Provided by Business Organizations
Of the 286 surveyed establishments, only 23, or 8.0% were aware of any type of assistance provided
by business organizations to mitigate damages caused by floods. By area, the level of awareness was
128

129
highest for establishments in Pasig-Marikina (11.2%) and the lowest in Other Barangays (2.6%). The
types of assistance from business organizations respondents mentioned were:
Conducting training or seminars
Lending of machines, equipment and tools
Provision of loans or assistance for recovery
Dredging of rivers near the vicinity of the establishment
Immediate supply of raw materials and supplies
Repair of damages to public infrastructure.
5.4.5.10 Countermeasures for Floods Undertaken by Government Agencies
Type of Government Agencies Providing Assistance
Of the responding establishments, 175 reported awareness of assistance provided by the Local
Government Units (LGUs) and 68 knew of assistance provided by national government agencies
(NGAs). Of the 141 establishments in thee Pasig-Marikina barangays that were aware of
government assistance, 132 were aware of assistance from LGUs and 33 knew of NGAs’ assistance.
Types of Assistance
Of the 68 establishments that were aware that assistance was available from national government
agencies to mitigate the effects of flooding, 55 stated that the assistance was in the form of repair of
damages to public infrastructure and 29 listed construction of dikes. Nine mentioned provision of
loans or assistance for recovery and five cited drainage cleaning and improvement. Similarly,
repair of damaged infrastructure (140), construction of dikes (66), cleaning, construction, and
improvement of drainage or sewerage systems (41) were among the types of help cited by the 175
establishments that were aware of assistance provided by LGUs to mitigate effects of flooding.

Chapter 6 Adaptation Options and Economic Evaluation
6.1 Introduction
This Chapter first describes the methodology employed to derive the adaptation options and their
corresponding costs. The adaptation options are selected with the objective of eliminating, as much
as possible1, the floods shown in the previously presented flood simulations. Next, the results of
economic evaluation, Economic Internal Rate of Return (EIRR) and Net Present Value (NPV) are
presented by combining the adaptation options (cost side) with the damages that can be avoided
(benefit side) shown in Chapter 3.
6.2 Deriving adaptation options
6.2.1 Flood levels to be examined
The target flood level is set in accordance with the safety level of existing flood control
infrastructure projects in the target areas. If the difference between the target flood level and the
safety level of existing flood control projects is too large, the effects of infrastructural improvements
such as river improvement, diking systems and drainage facilities cannot be examined through
hydraulic simulation. In this context, the target flood level is determined as shown in Table 6-1. In
the case of the Pasig-Marikina river basin, a 100-year return period target flood level was possible
(an exceptional case) because the 1990 Master Plan covered such hydraulic analysis.
Table 6-1 Target Flood Level to be examined (return period in years)
River Basin/Drainage Area Design Level for Flood
control project Target Flood
Level Pasig-Marikina River Basin 30-year 100-year
KAMANAVA Area 10-year 10-year
West of Mangahan Area 10-year 10-year
6.3 Structural measures to be examined
For preventing flood damage caused by climate change, structural measures like dam construction
and dike raising are considered for each river basin/drainage area.
1 Note that for the KAMANAVA and West of Mangahan Areas, total elimination is impossible because of the low elevation. Rather, pumping capacity improvement is considered to minimize the duration of flooding.
130
6.3.1 Pasig-Marikina River Basin
Case 1: Improvement of embankments without the Marikina Dam (P30)
In order to prevent overbanking-type flooding from the river, raising the embankment was
considered. The necessary additional embankment height can be determined by trial calculations of
the embankment heights until the overbanking flow is eliminated. This case is subject to the
condition that the Marikina dam is not constructed.
Case 2: Improvement of embankment with Marikina Dam (P100, P30)
The method described above was also used to examine how much the embankments would need to
be raised assuming that the Marikina dam is in operation.
6.3.2 West of Mangahan and KAMANAVA Area
For the West of Mangahan and KAMANAVA areas, the pump capacity required to keep flooding
depths under an allowable inundation of 30 cm was determined. When the usual local runoff
drainage plan for the interior areas was applied, all of the rainwater could not be drained due to
excessive cost for the benefit achieved. In this study, allowable inundation depths of around 30 cm
are assumed because only negligible damages would occur with such inundation and it would be
possible to evacuate residents under those conditions.
6.3.3 Storm Surge barrier for the coastal area
For preventing overflow from the Manila Bay caused by typhoon-induced storm surge, the necessary
height of storm surge barrier was examined.
6.4 Adaptation options
6.4.1 Pasig Marikina River Basin
As a result of hydraulic analysis, the necessary increased embankment heights were calculated as
shown in Table 6-2. Raising the embankments approximately 0.5 m would relieve the flood
damage.
131

Table 6-2 Adaptation Measures for Climate Change – Raising Embankments
Return Period: 30 years
Scenario Case River Increased
Embankment Height Length
Pasig - - San Juan - -
Without Marikina
dam Marikina + 0.5 m 16,400 m Pasig - - San Juan - -
B1 With
Marikina Dam Marikina Less than + 0.5 m 16,400 m
Pasig + 0.2 m 25,380 m San Juan - -
Without Marikina
dam Marikina + 0.5 m 16,400 m Pasig San Juan - -
A1FI With
Marikina Dam Marikina Less than + 0.5 m 16,400 m
Return Period: 100 years
Scenario Case River Increased
Embankment Height Length
Pasig + 0.4 m 27,250 m San Juan - - B1
With Marikina
Dam Marikina + 0.5 m 16,400 m Pasig + 0.6 m 28,690 m San Juan - - A1FI Ditto Marikina + 0.5 m 16,400 m
6.4.2 KAMANAVA Area
In the KAMANAVA area, the storm water drainage plan is designed for a 10-year return period and
the total planned drainage pump capacity is 44 cubic m3/s. In order to mitigate the expected
increase in flooding volume caused by climate change, pump capacity increases should be
considered. The necessary capacity increases estimated by the pond model analysis for the
KAMANAVA area are tabulated in Table 6-3.
132

Table 6-3 Necessary Pumping Capacity Increases (KAMANAVA)
Unit: m3/s
ScenarioReturn Period
Capacity for Master plan
Necessary Pump Capacity
Additional Capacity
1/10 73 29 1/30 81 37 B1
1/100 90 46 1/10 83 39 1/30 94 50 A1FI
1/100
44 (10-year return
period)
105 61
6.4.3 West of Mangahan Area
In the West of Mangahan area, drainage plan is also designed for a 10-year return period and the
total planned drainage pump capacity is 72 m3/s. In order to mitigate the expected increase in
flooding volume caused by climate change, pump capacity increases should be considered here as
well. The necessary capacity increases estimated by the pond model analysis for the West of
Mangahan area are tabulated in Table 6-4.
Table 6-4 Necessary Pumping Capacity Increases (West of Mangahan)
Unit: m3/s
ScenarioReturn Period
Capacity for Master plan
Necessary Pump Capacity
Additional Capacity
1/10 86 14 1/30 99 27 B1
1/100 105 33 1/10 94 22 1/30 115 43 A1FI
1/100
72 (10-year
return period)
125 53
6.4.4 Storm Surge
In order to calculate the necessary height and length of storm surge barriers, the elevation along the
coastal area and storm surge water levels were compared. The necessary height and length of
barriers determined in this way are shown in Table 6-5.
133

Table 6-5 Improvement of Storm Surge Barrier
Scenario Storm Surge
Level Length
Average Required Embankment Height
Increase
SQ 12.31 m 26,200 m 0.59 m
B1 12.59 m 27,700 m 0.83 m
A1FI 12.69 m 28,600 m 0.91 m
6.5 Cost Estimation
6.5.1 Construction Cost of components related to the 1990 Master plan
In order to conduct economic analyses for measures used to adapt to climate change, construction
cost units used in the 1990 Master Plan2 were reviewed. Construction costs in Japanese Yen,
estimated in 1990, were converted to present values using Japanese deflator figures.
6.5.1.1 Pasig Marikina River
1) Return Period: 100 years
Construction costs estimated in 1990 are shown in Table 6-6, with details for the Marikina dam
given in Table 6-7. According to the 1990 conversion rate, 1 Philippine peso was equivalent
to 6.20 Yen. To roughly estimate capital costs, 40% of direct costs are assumed to be
attributable to administration cost, as 40% is empirically used in other similar projects in the
Philippines.
2 Flood Control and Drainage Projects in Metro Manila (JICA, 1990)
134
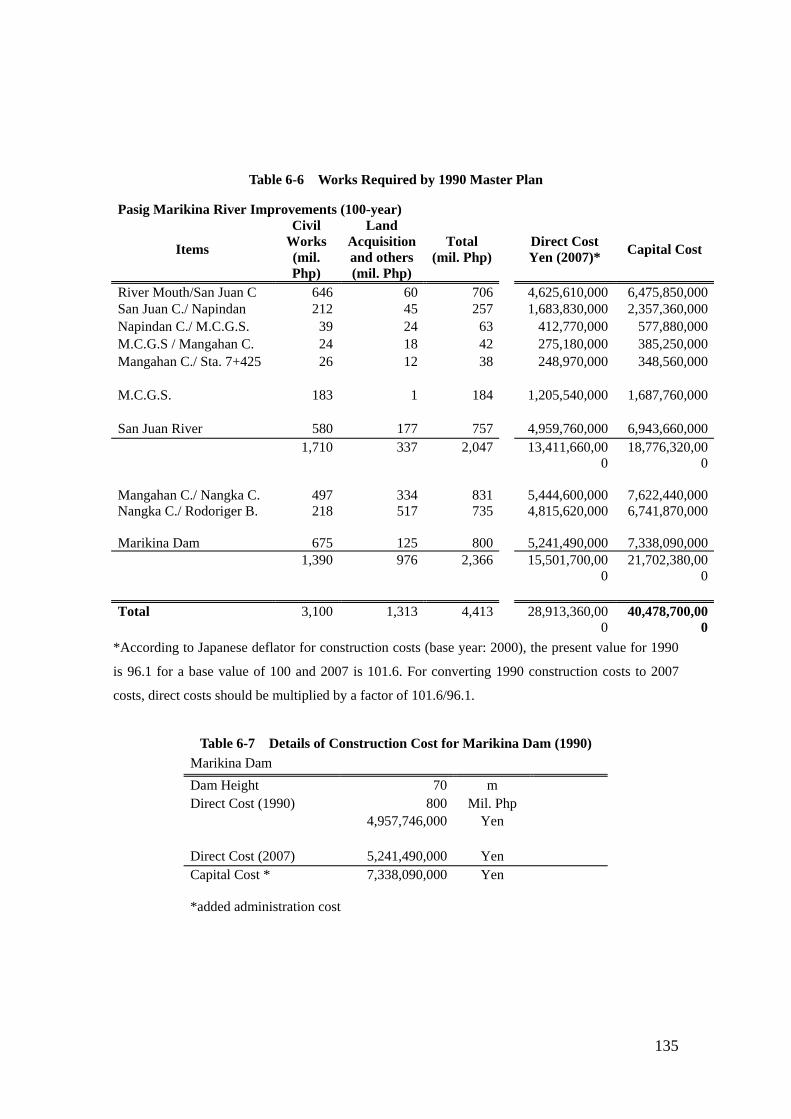
Table 6-6 Works Required by 1990 Master Plan
Pasig Marikina River Improvements (100-year)
Items
Civil Works (mil. Php)
Land Acquisition and others(mil. Php)
Total (mil. Php)
Direct Cost Yen (2007)*
Capital Cost
River Mouth/San Juan C 646 60 706 4,625,610,000 6,475,850,000San Juan C./ Napindan 212 45 257 1,683,830,000 2,357,360,000Napindan C./ M.C.G.S. 39 24 63 412,770,000 577,880,000M.C.G.S / Mangahan C. 24 18 42 275,180,000 385,250,000Mangahan C./ Sta. 7+425 26 12 38 248,970,000 348,560,000
M.C.G.S. 183 1 184 1,205,540,000 1,687,760,000
San Juan River 580 177 757 4,959,760,000 6,943,660,000
1,710 337 2,047 13,411,660,000
18,776,320,000
Mangahan C./ Nangka C. 497 334 831 5,444,600,000 7,622,440,000Nangka C./ Rodoriger B. 218 517 735 4,815,620,000 6,741,870,000
Marikina Dam 675 125 800 5,241,490,000 7,338,090,000
1,390 976 2,366 15,501,700,000
21,702,380,000
Total 3,100 1,313 4,413 28,913,360,000
40,478,700,000
*According to Japanese deflator for construction costs (base year: 2000), the present value for 1990
is 96.1 for a base value of 100 and 2007 is 101.6. For converting 1990 construction costs to 2007
costs, direct costs should be multiplied by a factor of 101.6/96.1.
Table 6-7 Details of Construction Cost for Marikina Dam (1990)
Marikina Dam
Dam Height 70 m Direct Cost (1990) 800 Mil. Php
4,957,746,000 Yen
Direct Cost (2007) 5,241,490,000 Yen Capital Cost * 7,338,090,000 Yen
*added administration cost
135

2) Return Period: 30 years
Construction costs for the 30-year return period were converted to present values as described above.
Construction costs estimated for JICA’s 2002 Department of Public Works and Highways Detailed
Design (DPWH D/D) are shown in Table 6-8. According to the conversion rate for 2002, 1
Philippine peso was equivalent to approx 2.6 Yen
Table 6-8 Works Required for 2002 Detailed Design
Capital Cost for Pasig Marikina River Improvement (30 Year) (Mil. Php)
1 Main Construction Cost 8,355
2 Compensation Cost 2,362
3 Administration Cost 292
4 Engineering Service 657
Total 11,666
Reference:2002 JICA-DPWH D/D
Japanese Yen(2002) 30,004,952,000
Japanese Yen(2007) 31,558,000,000
6.5.2 Improvement costs for components not included in the 1990 Master plan
6.5.2.1 Cost of Increasing Embankment Height
Additional cost estimation for improvements along the Pasig-Marikina River produced the rough
costs for parapet walls shown in Table 6-9 below.
Table 6-9 Construction Cost for Parapet Walls (2008)
Parapet Wall Rate: 1.913
H Concrete Reinforcing Bar Anchor Bar Concrete Chipping
(m) Volume
(m3/m)
Unit Cost
(Php/m3)
Cost
(Php/m)
Weight
(t/m)
Unit Cost
(Php/t)
Cost
(Php/m)
Weight
(kg/m)
Unit Cost
(Php/kg)
Cost
(Php/m)
Area
(m2/m)
Unit Cost
(Php/m2)
Cost
(Php/m)
Total Cost
(Php/m)
Total Cost(Yen/m)
0.41 ~ 0.5
0.113 7,000 788 0.010 65,000 645 4.972 500 2,486 0.5 500 250 5,000 9,600
0.91 ~ 1
0.250 7,000 1,750 0.016 65,000 1,015 4.972 500 2,486 0.5 500 250 6,000 11,500
1.41 ~ 1.5
0.413 7,000 2,888 0.023 65,000 1,512 4.972 500 2,486 0.5 500 250 8,000 15,400
136

Cost-Estimation for Parapet Wall
0
5,000
10,000
15,000
20,000
0.0 0.5 1.0 1.5 2.0
Height of Parapet Wall (m)
Cos
t (Y
en)
Figure 6-1 Relationship between Height of Parapet Wall and Construction Cost (Yen)
The unit price of adding additional height to embankments is obtained by assuming a linear
relationship between the height and the unit price for a parapet wall, as shown above in Fig. 6-1.
For instance, the cost for raising an embankment by 50 cm is calculated as follows.:
11,500 Yen/m (cost for 1.0 m high wall) – 9600 Yen/m (cost for 0.5 m high wall) = 1,900 Yen/m
6.5.2.2 Cost of Increasing Drainage Pump Capacity
If existing pumps are improved to enhance drainage capacities, the cost is approximately 50,000,000
yen per m3/s, while constructing a new pump station costs approximately 100,000,000 yen per m3/s.
These units were employed to make rough cost estimates for increasing drainage pump capacities.
6.5.3 Cost estimation for improvement work
6.5.3.1 Pasig-Marikina River Basin
Table 6-10 presents rough cost estimates for improvements based on necessary height increases and
unit prices.
137

Table 6-10 Costs of Measures for Adaptation to Climate Change
Return Period: 30 years
Scenario Dam River Raising of
Embankment Capital Cost
(Yen) Total Cost
(Yen) Pasig - 0 San Juan - 0 None Marikina + 0.5 m 89,550,000
89,550,000
Pasig - 0 San Juan - 0 Marikina Less than + 0.5 m 89,550,000
B1 Marikina
Dam Dam Construction Cost 7,338,090,000
7,427,640,000
Pasig + 0.2 m 67,510,000 San Juan 0 None Marikina + 0.5 m 89,550,000
157,060,000
Pasig 0 San Juan 0 Marikina Less than + 0.5 m 89,550,000
A1FI Marikina
Dam Dam Construction Cost 7,338,090,000
7,427,640,000
Return Period: 100 years
Scenario Dam River Raising
Embankment Capital Cost
(Yen) Total Cost
(Yen) Pasig + 0.4 m 148,070,000 San Juan 0 B1
Marikina Dam
Marikina + 0.5 m 89,550,000 237,620,000
Pasig + 0.6 m 231,720,000 San Juan 0 A1FI
Marikina Dam
Marikina + 0.5 m 89,550,000 321,270,000
*Master plan for the 100-year return period originally included the construction of Marikina Dam.
138

6.5.3.2 KAMANAVA Area
Rough cost estimates based on necessary additional pump capacity are shown in Table 6-11.
Table 6-11 Additional Pump Capacity Costs
Scenario Return Period
Pump Capacity for Master Plan
(m3/s)
Necessary Pump
Capacity(m3/s)
Additional Capacity
(m3/s)
Capital Cost (yen)
10 years 73 29 1,450,000,00030 years 81 37 1,850,000,000B1
100 years 90 46 2,300,000,00010 years 83 39 1,950,000,00030 years 94 50 2,500,000,000A1FI
100 years
44 (10-year return
period)
105 61 3,050,000,000*unit price:50,000,000 yen / m3/s
6.5.3.3 West of Mangahan
Rough cost estimates based on necessary additional pump capacity are shown in Table 6-12.
Table 6-12 Additional Pump Capacity Costs
Scenario Return Period
Pump Capacity for Master Plan
(m3/s)
The Necessary Pump
Capacity(m3/s)
Additional Capacity
(m3/s)
Capital Cost (yen)
10 years 86 14 700,000,00030 years 99 27 1,350,000,000B1
100 years 105 33 1,650,000,00010 years 94 22 1,100,000,00030 years 115 43 2,150,000,000A1FI
100 years
72 (10-year return
period)
125 53 2,650,000,000*unit price:50,000,000 yen / m3/s
6.5.3.4 Storm Surge Barriers
For raising storm surge barriers, rough estimates of costs based on the necessary additional height,
length and unit cost, are given in Table 6-13.
139

Table 6-13 Construction Costs for Storm Surge Barrier
Scenario H.H.W.L Elev. (m)
Length (m)
Height (m)
Unit (yen /m)
Direct Cost (yen)
Capital Cost (yen)
SQ 12.31 26,200 0.6 2,700 70,740,000 99,040,000
B1 12.59 27,700 0.8 4,300 119,110,000 166,750,000
A1FI 12.69 28,600 0.9 5,100 145,860,000 204,200,000
H.H.W.L. – Highest High Water Level calculated for each climate scenario
6.6 Economic evaluations
The objective of this section is to derive the cost and benefit streams for determining the Economic
Internal Rate of Return (EIRR) and Net Present Value (NPV) for a range of possible adaptation
investments proposed specifically for the Pasig-Marikina River basin area, the West of Mangahan
area, and the KAMANAVA area of Metro Manila.
6.6.1 Methodology for EIRR and NPV calculation
The major components needed to calculate the economic internal rate of return (EIRR) and net
present value (NPV) of an infrastructure project are the following:
1) Project Costs, consisting of construction cost, engineering service cost, land acquisition and
compensation (if needed), project management cost, and physical and price contingencies.
2) Investment Schedule, showing how the investment will be distributed during the implementation
period of the project (i.e., initial investment) and over its project life (i.e., for improvements or
maintenance). The durable life of an infrastructure project is usually assumed to be 50 or 60 years
if properly maintained. In this analysis, the construction period is 5 years starting from 2010 and
project life is expected to last until 2060. Investments after the completion of the Master Plan are
assumed to start from 2014. No maintenance cost was included in the analysis.
3) Project Benefits - these are the benefits (i.e., avoided damages) attributable to the investment.
We estimated the most direct benefits and the ones possible for quantification although there are still
various social benefits that are not quantifiable. The benefits are estimated in terms of
building/asset damage, road damage, VOC, travel time, income loss (for both firms and households),
etc. Benefits are usually subject to an inflation/deflation rate for economic cash flows over the
140

project life to take into account projected changes based on past economic performance.
4) Discount rate - According to the National Economic and Development Authority of the
Philippines, the discount rate used to judge the economic feasibility of projects is 15%. This rate is
used as the discount rate in the NPV calculation.
6.6.4 Deriving EIRR and NPV for adaptation options
Economic evaluation of the adaptation projects given in the previous sections of this Chapter and the
benefits (avoided damages) provided in Chapter 3 requires several calculation steps. It is important
to note that the total gross avoided damages determined in Chapter 3 do not directly feed in to the
EIRR and NPV annual benefit flows. This is because there are three geographical areas, and
depending on the return period and adaptation investments, only the relevant benefits are considered.
For example, embankment improvements on the Pasig-Marikina River do not affect the coast side
KAMANAVA area, thus such improvements do not benefit the KAMANAVA area.
Each damage item was converted to 2008 and 2050 values using a 5% growth rage per annum. For
example, affected floor area was calculated using year 2000 DPWH base unit costs. These values
were converted to 2008 or 2050 values with the 5% growth rate.
The benefit side of the cash stream for EIRR and NPV was then calculated by taking the integral of
the probability distribution function plotting 10-year, 30-year and 100-year return period damages
for each climate/infrastructure scenario as shown in Figure 6-2.
Two different cases were considered in the analysis:
1) Improvements that take the infrastructure from its existing state (EX) to the full adaptation level
(the difference between EX and full adaptation lines in the figure)
2) Further improvements above those in the 1990 master plan level (MP) to achieve the full adaptation
level (the difference between MP and full adaptation lines in the figure)
141

0
20,000
40,000
60,000
80,000
100,000
120,000
0.00 0.02 0.04 0.06 0.08 0.10
Yearly Probability
Existing infrastructure (EX)
1990 Mater Plan level (MP)
Full adaptation Damage Cost (Php in million)
Damage Cost (Php in million)
Figure 6-2 Comparison of damage costs for different adaptation levels and probabilities
Third, the adaptation costs given in the previous sections were combined with the benefit stream
(damages avoidable) for each climate/infrastructure/return period scenario. P100 adaptation
structures are assumed to prevent P30 and P10 floods. Careful matching was conducted between
adaptation measures and avoided damages since flood control structures intended for specific areas
cannot prevent floods in other areas, as mentioned before.
Significant deviations in estimates can arise when calculating the damages to high-rise buildings.
Conventional methods do not specify how to value buildings’ higher floors. In this study, we
assumed that the value of upper floor areas remains intact while the fixtures of the affected floors are
damaged depending on the flood depth. Similarly, the income and activities of residents and firms
in upper floors are assumed to be unaffected. In this sense, the benefit numbers are on the
conservative side.
Adaptation options for the P30 return period are divided into those that do no include the Marikina
dam and those that do. Without the dam, the necessary investments for embankments and pumping
increase. The Master Plan for the 100-year return period has always included the Marikina dam.
Table 6-14 presents the economic analyses for each scenario/return period/adaptation level
combination, and Table 6-15 lists the priorities by which the adaptation measures were compared.
142

Table 6-14 EIRR and NPV Results
Cases EIRR NPV 15% (Php) Adaptation cost in
2008 (Php)
Duration
(days)
1 P100 SQ EX wD 18% 3,735,417,996 13,501,553,721 5
2 P100 SQ MP wD N/A 4,747,146,081 0 3.5
3 P100 B1 EX wD 23% 10,119,764,171 13,604,450,310 5
4 P100 B1 MP wD 140% 7,578,065,582 102,896,589 3
5 P100 A1FI EX wD 24% 11,941,808,517 13,640,673,269 6.5
6 P100 A1FI MP wD 141% 10,393,996,079 139,119,548 4
7 P30 SQ EX wD 16% 791,013,521 14,121,102,133 2
8 P30 SQ EX nD 18% 2,921,383,920 10,943,489,020 2
9 P30 SQ MP wD 19% 1,194,339,182 3,177,613,113 1.5
10 P30 SQ MP nD N/A 3,324,709,581 0 1.5
11 P30 B1 EX wD 20% 5,615,755,728 14,232,087,722 3
12 P30 B1 EX nD 23% 7,746,126,127 11,054,474,609 3
13 P30 B1 MP wD 26% 3,506,324,553 3,216,390,949 2
14 P30 B1 MP nD 174% 5,636,694,952 38,777,837 2
15 P30 A1FI EX wD 21% 7,041,428,985 14,248,304,696 4
16 P30 A1FI EX nD 24% 9,152,200,101 11,099,925,438 4
17 P30 A1FI MP wD 31% 5,498,525,059 3,216,390,949 2
18 P30 A1FI MP nD 160% 7,609,296,174 68,011,692 2
19 P10 SQ EX nD 49% 209,952,438 42,887,291 1.5
20 P10 SQ MP nD *N/A because Master Plan beyond EX does not exist.
21 P10 B1 EX nD 10% (349,951,115) 1,003,222,253 1.5
22 P10 B1 MP nD *N/A because Master Plan beyond EX does not exist.
23 P10 A1FI EX nD 8% (581,704,127) 1,409,166,226 1.5
24 P10 A1FI MP nD *N/A because Master Plan beyond EX does not exist.
Note: P10, P30, and P100 are the 10, 30, and 100-year return period flooding levels. SQ, B1, and
A1FI are the climate scenarios, EX and MP denote existing and master plan infrastructure conditions.
wD and nD denote the presence or absence of the Marikina Dam, respectively.
143

Table 6-15 Adaptation priorities for NPV and EIRR comparisons (without Marikina dam)
Adaptation
Project Priority
NPV EIRR
1st priority Prepare for P30 flooding under
A1FI climate (p30 A1FI EX nD)
First, continue investments under the
current Master Plan in the
Pasig-Marikina river basin and then
add additional investments for full
adaptation
Prepare for P30 flooding under B1
climate (p30 B1 MP nD)
Additional adaptation investments for
full adaptation (provided that the current
Master Plan in the Pasig-Marikina river
basin is completed on time)
2nd priority Prepare for P30 flooding under
A1FI climate (p30 A1FI MP nD)
Additional adaptation investments for
full adaptation (provided that the
current Master Plan in the
Pasig-Marikina river basin is
completed on time)
Prepare for P30 flooding under A1FI
climate (p30 A1FI MP nD)
Additional adaptation investments for
full adaptation (provided that the current
Master Plan in the Pasig-Marikina river
basin is completed on time)
3rd priority Prepare for P30 flooding under B1
climate (p30 B1 EX nD)
First, continue investments under the
current Master Plan in the
Pasig-Marikina river basin and then
add additional investments for full
adaptation
Prepare for P10 flood under status
quo climate (p10 SQ EX nD)
Continue investments necessary under
the status quo climate in the
KAMANAVA and West of Mangahan
flood control project areas
144

Table 6-16 (for reference) Adaptation priorities for NPV and EIRR comparisons (including
cases with the Marikina dam)
Priority of the
adaptation
projects
NPV EIRR
1st priority Prepare for P100 flood under A1FI
climate (p100 A1FI EX wD)
First, continue investments under the
current Master Plan in the
Pasig-Marikina river basin and then
add additional investments for full
adaptation, including the Marikina
Dam
Prepare for P30 flood under B1
climate (p30 B1 MP nD)
Additional adaptation investments for
full adaptation (provided that the current
Master Plan in the Pasig-Marikina river
basin is completed on time)
2nd priority Prepare for P100 flood under A1FI
climate (p100 A1FI MP wD)
Additional adaptation investments for
full adaptation including the
Marikina Dam (provided that the
current Master Plan in the
Pasig-Marikina river basin is
completed on time)
Prepare for P30 flood under A1FI
climate (p30 A1FI MP nD)
Additional adaptation investments for
full adaptation (provided that the current
Master Plan in the Pasig-Marikina river
basin is completed on time)
3rd priority Prepare for P100 flood under B1
climate (p100 B1 EX wD)
First, continue investments under the
current Master Plan in the
Pasig-Marikina river basin and then
add additional investments for full
adaptation, including the Marikina
Dam
Prepare for P100 flood under A1FI
climate (p100 A1FI MP wD)
Additional adaptation investments for
full adaptation including the Marikina
Dam (provided that the current Master
Plan in the Pasig-Marikina river basin is
completed on time)
6.7 Discussion of adaptation priorities based on economic evaluations
The ranking of the EIRR evaluation and the ranking of the NPV evaluation show different results,
but they are common in suggesting that filling the infrastructure gap identified under the current
145

146
Master Plan (for the status quo climate) is the first and foremost priority. If maximizing the
avoided damages is most important, following the NPV results is preferable, but if investment
efficiency is more of a concern, following the EIRR results would be better. The decision also
depends on the level of return period that is targeted.
Assuming no dam in the adaptation options, the NPV results prioritize investments to protect the city
from the 30-year return period under the A1FI climate scenario. The recommended investment
package is to first continue investments under the current Master Plan in the Pasig-Marikina river
basin and then add additional investments for full adaptation to the A1FI scenario. This suggests
that the flood control investments in the Pasig-Marikina river basin to fill the gap between the
existing infrastructure and the Master Plan are priority investments in the process to adapt to climate
change. This is the option currently chosen by the Government of the Philippines, by
implementing the Pasig- Marikina Flood Control Project Phase II to avoid damages from 30-year
flooding.
The EIRR results prioritize additional investments to prepare for P30 flood under the B1 climate
scenario after the Master Plan components for the current climate are completed. The
recommended progression is to invest in additional adaptation projects for full adaptation for the B1
scenario, provided that the current Master Plan in Pasig-Marikina river basin is completed before the
projects are undertaken. This also suggests that the flood control investments in the Pasig-Marikina
river basin to fill the gap between the existing infrastructure and the Master Plan are prerequisites to
adapt to climate change. It is important to note that preparing for 10-year flooding in the status quo
climate comes in third place. This suggests that additional investments to the KAMANAVA and
West of Mangahan areas under the status quo climate are important. In fact, some KAMANAVA
area municipalities are introducing their own pumping stations (“bombastics”) in limited numbers.
The above discussion confirms that the on-going flood control projects in Metro Manila are
integrated components of adaptation to climate change. At least in the case of Metro Manila,
adaptation investments are not a completely new additional effort, but a continuation of the on-going
flood control efforts both in terms of planning and financing.

Chapter 7: Summary and policy discussions
7.1 Introduction
This chapter summarizes the main contents of Chapters 1 to 6 and discusses policy measures to
adapt to climate change. The policy recommendations are based on the findings in this report as
well as dialogues with Metro Manila communities and local governments.
7.2 Summary of previous chapters
7.2.1 Chapter 1
Climate models supporting the IPCC’s Fourth Assessment Report (AR4) indicate that climate change
is likely to increase local temperatures and local precipitation in monsoon regions in Asia, where the
number of large cities is increasing and existing large urban areas are expanding, particularly along
the coasts.
Metro Manila, typical of Asian coastal megacities, was chosen as a case study to comprehensively
simulate impacts of future climate change and identify necessary policy actions. Metro Manila
maintains its premiership as the economic center of the Philippines holding the headquarters of
domestic and international business establishments. At the same time, since Metro Manila is in a
low-lying area, facing the sea, a lake and two river systems, it is prone to disastrous flooding.
There are several flood types in Metro Manila: storage, overbanking, and interior flooding. The
following three areas are each vulnerable to one of these: the KAMANAVA (Kalookan, Malabon,
Navotas, and Valenzuela) area is susceptible to storage type flooding, the Pasig-Marikina river basin
often experiences overbanking, and the West Mangahan area is prone to interior flooding.
The KAMANAVA area is low and flat with elevations ranging from around sea level to two to three
meters above mean sea level. Flooding in the KAMANAVA area is caused by a combination of
overflow of the Malabon-Tullahan River and inadequate local drainage aggravated by high tides in
Manila Bay. A JICA-financed flood control project, the KAMANAVA Area Flood Control and
Drainage System Improvement Project, has a 10-year return period design scale.
The Pasig-Marikina River System has a catchment area of 651 km2, composed of the 10 cities and
municipalities of Mandaluyong, Manila, Marikina, Quezon, San Juan, Antipolo, Cainta, Rodriguez,
147

San Mateo and Pasay. The section of the river system between the river mouth (Manila Bay) and
the confluence point with the Napindan Channel is called the Pasig River, and the section of the river
system upstream from the Napindan confluence is the Marikina River. Excess flood runoff
overflows the riverbanks of the Pasig and Marikina rivers. A JICA-funded flood control project
known as the Pasig-Marikina River Channel Improvement Project has been formulated based on
a 30-year return period.
The Marikina River’s excess runoff water is diverted to the Laguna de Bay Lake through the
Mangahan Floodway during floods to protect the Metro Manila city core. The total area west of the
Mangahan Floodway facing Laguna Lake is 39 km2, covering the five cities of Makati, Pasig,
Pateros, Taguig, and Taytay. The topography of the West Mangahan drainage area is flat, and it is a
typical interior-flood-prone area. Floods are assumed to be brought on by storm rainfall and high
water levels in the lake.
7.2.2 Chapter 2
This report is based on global climate projections provided by the IPCC’s Fourth Assessment Report.
Two scenarios, B1 and A1FI, from the IPCC’s Special Reports on Emissions Scenarios (SRES) were
adopted and compared with the status quo (SQ) scenario. A target year of 2050 was set as the
halfway mark of the IPCC SRES. Simulated spatial spreads of flooding under scenarios SQ, B1,
and A1FI in the year 2050 were used as the bases of impact analyses.
In spite of various uncertainties, in this study we translated global climate scenarios to regional
climate scenarios, a process called “downscaling”. Scenarios B1 and A1FI of the IPCC SRES
scenarios provide a basis for discussing changes in local temperature and precipitation in Metro
Manila, based on which hydrological conditions such as river overflow and storm surge are
projected. The study produced flood simulation maps that show different spatial spreads and
flooding inundation depths in the metropolis, depending on the climate-hydrologic infrastructure
scenario.
7.2.3 Chapter 3
Chapter 3 discusses socio-economic impact analyses conducted to understand the characteristics and
the magnitude of the damage of floods expected in the year 2050. The benefit side of the analysis
is the aggregate-level damage avoidable through adaptation. The types of benefits included in this
study go beyond conventional flood impact assessments that deal only with direct losses such as
148

buildings.
In this report, direct and tangible losses are first assessed, as is performed in conventional flood
control project analyses. Then, indirect and tangible losses are assessed where possible with
available data. For indirect, tangible losses, this report combines the incremental cost of
transportation (VOC and time costs), lost wages and income (sales) triggered by flood. Intangible
losses (in this report, health hazards) are presented separately in Chapter 4.
If infrastructure improvement were halted now, assuming the A1FI climate scenario, flood damages
could be up to 24% of GRDP under 100-year flooding conditions. If infrastructure improvement
based on 1990 Master Plan is implemented and the B1 climate scenario is assumed, the damages due
to 100-year flooding would be only 9% of GRDP. For a 30-year return period, the above
percentages are 15% and 3% respectively.
7.2.4 Chapter 4
Chapter 4 characterizes and quantifies human health risks associated with exposures to pathogens
present in floodwater, as an example of intangible risks related to flooding in Metro Manila. Here,
exposure scenarios based on different inundation levels were developed in which direct and indirect
contacts with water were assumed to occur.
The risk of gastrointestinal illness due to E. Coli from incidental ingestion of floodwater in Metro
Manila is calculated for different flood depths. The number of infected people is estimated to be high
in densely populated flood areas such as the city of Manila, Pasig city, and Marikina city.
7.2.5 Chapter 5
This chapter presents the results of the analyses undertaken to identify the vulnerabilities of selected
segments of society and the economy. The first section covers a household level analysis focusing
on the experiences of those living in areas affected by flooding, typhoons, and tidal surges in the
current climate. The second section covers a firm-level analysis of businesses, focusing on their
experiences in Typhoon Milenyo (2006) and other flood events.
The urban poor who live in flood-prone areas consist of recent migrants from outside Metro Manila.
Their choice of where to live coincides with the vulnerability of their livelihoods. The interviewed
households have an income level of less than 1 USD a month per person, and most of them live in
149

slums and squatter settlements with no security of tenure nor adequate access to water, electricity,
health services, drainage, or sanitation services. Among those residents, two-thirds regularly suffer
losses (income, health, household assets), and inconvenience (evacuation, having to use rivers or
creeks for toilet, etc.) due to flooding.
Many establishments in flood-prone areas of Metro Manila have had to temporarily halt their
operations, especially during Typhoon Milenyo in 2006. The three main reasons for the work
stoppage were a shortage of electricity or power outages (mainly due to strong winds), an
insufficient number of workers reporting to work, and low sales. The main reason for employees’
absence from work was unavailability of transportation, which can be related to flooding.
7.2.6 Chapter 6
This Chapter first describes the methodology used to derive the adaptation options and their
corresponding costs. The adaptation options were selected, guided by the objective of eliminating,
as much as possible, the floods shown in the previously presented flood simulations. Finally, the
results of economic evaluations based on Economic Internal Rate of Return (EIRR) and Net Present
Value (NPV) are presented.
The ranking of improvements based on EIRR and NPV evaluations differ, but they are common in
suggesting that filling the infrastructure gap identified under the current Master Plan (for the status
quo climate) is the first and foremost priority. If maximizing the avoided damages is most
important, following the NPV results is preferable, but if investment efficiency is a larger concern,
following the EIRR results is recommended. The decision also depends on the targeted return period.
If construction of the Marikina dam is not considered in the adaptation options, NPV calculations
prioritize investments to protect the city from 30-year return period flooding under the A1FI climate
scenario. The recommended investment package is to first continue investments under the current
Master Plan in the Pasig-Marikina river basin and then add additional investments toward full
adaptation for the A1FI scenario. This suggests that the flood control investments in the
Pasig-Marikina river basin aimed at filling the gap between the existing infrastructure and the Master
Plan are priority investments in the process to adapt to climate change. This is the strategy
currently chosen by the Government of the Philippines as they implement the Pasig- Marikina Flood
Control Project Phase II to avoid damages from 30-year return period floods.
150

The EIRR analysis prioritizes additional investments to prepare for 30-year flooding under the B1
climate scenario after the Master Plan components for the current climate are completed. The
recommended flow of investment is to fund additional adaptation investments for full adaptation for
the B1 scenario, provided that the current Master Plan in the Pasig-Marikina river basin is completed
before those projects are undertaken. This also suggests that flood control investments in the
Pasig-Marikina river basin to fill the gap between the existing infrastructure and the Master Plan are
prerequisites to adapting to climate change. It is important to note that preparing for 10-year
flooding under the status quo climate comes in third place. This suggests that additional
investments to the KAMANAVA and West of Mangahan areas under the status quo climate are
important. In fact, some KAMANAVA area municipalities are introducing their own pumping
stations (“bombastics”) in limited numbers.
The above discussion confirms that the ongoing flood control projects in Metro Manila are
integrated components of adaptation to climate change. At least in the case of Metro Manila,
adaptation investments are not a completely new additional effort, but a continuation of ongoing
flood control efforts both in terms of planning and financing.
7.3 Policy discussions
7.3.1 New flood control infrastructure
As described in Chapter 6, new flood control infrastructure is required to adapt to the flood situation
in 2050 assuming climate change. Our analysis suggests that filling the infrastructure gap in
responding to the current climate is the first and foremost priority. As a next adaptation priority,
additional flood control investments in the Pasig-Marikina river basin were identified. This
investment consists mainly of raising embankments along the Pasig-Marikina River.
7.3.2 Fine-tuning and improvement of the existing flood control infrastructure
Although the above economic evaluations highlight the priority of currently implemented flood
control infrastructure investment, discussions with communities and local governments also call for
an assessment of the design of existing structures to better respond to the new hydrodynamics to be
faced by flood prone communities.
151

1) KAMANAVA area
The KAMANAVA Area Flood Control and Drainage System Improvement Project has a 10-year
return period design scale.
However, recent observations by residents and barangay officials in the area (e.g. Barangay
Bangkulasi, Barangay Bagonbayan South) suggest that tides are reaching unprecedented levels,
especially when combined with floods from the upstream sections of the Malabon-Tullahan River or
with storm surges. As a remedial response, the barangay captains are introducing drainage pumps,
locally known as “bombastics” in their respective areas to remove floodwater. However, as
neighboring barangays are just discharging water to each other, this remedial response is not
significantly reducing water levels in the respective areas.
Therefore, an additional assessment is necessary to understand the relatively recent hydrodynamics,
which may not necessarily be due to climate change, and consider local policies that can create
solutions that benefit all of the neighboring areas. In conducting the assessment, a close
coordination with the National Government (DPWH) is necessary to assure technical consistency
between DPWH-led infrastructure projects (the KAMANAVA Area Flood Control and drainage
under national roads), and local government initiatives (pumping, drainage under local roads, land
use, social housing, etc.)
2) Pasig-Marikina river basin
Marikina city is located alongside the Marikina River. With strong political leadership, it has
successfully strengthened its capacity to cope with flooding. First, under the Pasig-Marikina River
Channel Improvement Project Phase I, the city government successfully relocated almost 10,000
households that were squatting along the Marikina River. Now both sides of the river are cleared
and pleasant walkways and bikeways where families come to enjoy walking, have been constructed
together with dike structures. Drainage of the riverbed is regularly conducted. The city planning
office has a comprehensive information database of the hydrodynamics of the city area, allowing for
setting design standards for local drainage infrastructure projects. Marikina is the only city that can
demand that the DPWH conform to the city’s design standards when the DPWH constructs drainage
facilities under national roads.
Despite this excellent performance, the city of Marikina is not prepared for climate change.
According to this study’s flood simulation, because of its steep topography, Marikina is one of the
areas worst affected by climate change. The types of structures or policies necessary to cope with
152

climate change at the local level have yet to be identified by the city government. As chapter 6
suggests, at the Metro Manila level, improvement of river embankments to protect against B1
climate scenario conditions is a priority for adapting to climate change.
3) West of Mangahan area
The city of Taguig stretches alongside Laguna de Bay Lake. Some large scale development
projects brought high rise condominiums and shopping centers to the southern part of the city, while
the swampy areas in the northern part are a mix of middle income and low income residential areas,
with some remaining paddies and fishing areas. The West of Mangahan flood control project
consists of a long road dike alongside the lake and several pumping stations. Floods are assumed to
be brought on by storm rainfall and high water levels in the lake.
Flood simulations in this study, however, show that when taking climate change into consideration,
the risk of intensive rain in the inner urban area will increase, causing water to flow from the inner
urban area to Laguna Lake. With the presence of the road dike, this will lead to flooding in the
northern part of the city of Taguig. In this case, additional pumping structures will be necessary to
permit the water to flow both ways.
Partly due to the completion of the road dike, the city of Taguig is busy evaluating unsolicited
development plans in the areas previously used as paddies and fishing fields. However, these plans
typically do not accompany drainage plans or flood mitigation plans. For the city of Taguig
assessment of the hydrodynamics of the area (with climate change considered) and development of
land use plans that have appropriate drainage and flood mitigation plans in addition to the
appropriate evaluation of environmental considerations is urgent.
7.3.3 Other policy areas for consideration
1) Capacity building (city planning)
As described in 7.3.2, cities’ capabilities of coping with flooding problems under the status quo
climate differ widely. In particular, assessing the local hydrodynamics, building design standards
for drainage systems, land use planning and enforcement, and social housing, including resettlement,
seem to be the key areas in adapting to climate change. As is already done among cities and
municipalities in Metro Manila, continuous upgrading of technical capabilities (including recruiting)
as well as learning from examples of excellent management such as in the case of Marikina, are
153

154
fundamental to the improvement of city level capabilities, along with the obvious importance of
strong political leadership.
2) Capacity building (disaster preparedness)
As described in 5.3.6, the local governments in Metro Manila have been finding innovative solutions
to their flooding and other related problems. However, as is evident in the case of ad hoc
installations of water pumps (“bombastics”), solutions designed for a particular area may be
counterproductive to a coordinated, collective solution. It is urgent to communicate to the local
governments the necessity for coordinated, collective solutions and to instill strong leadership in the
existing coordinating mechanisms (through HUDCC, MMDA or other councils).
Interviews with local communities show that many local governments are active in monitoring water
levels, conducting evacuations, and providing shelter (including food and medicine) in the case of
disasters. However, interviews with poor urban households reveal that many of them are left with
minimum care, so they opt to adopt “water based lifestyles” in which they cope with the flooding
any way they can. This includes adding floors to their structures and raising their appliances up
onto movable platforms. More importantly, interviews with key information sources revealed that
the poor and vulnerable households who do not have a wide network of relatives, neighbors, or
friends who can support them, are also unable to access much support from formal institutions like
health clinics run by local government units’ social workers. Effective methods of intervention to
help these segments of the society should be strengthened, with the help of capable stakeholders
such as NGOs operating in the area of disaster management.
3) Adaptation in combination with mitigation
During discussions with the MMDA (Metro Manila Development Authority), it was pointed out that
they are expecting a new study assessing mitigation effects. The MMDA is leading the efforts to
control traffic in Metro Manila. These efforts are expected to increase the mitigation measures that
will be taken by the government of the Philippines. Assessment of the combined efforts covering
both mitigation and adaptation for a given city is our next research topic.

References
ALMEC Corporation. (2008) “Final Report on the Study on Climate Change Impact over Asian Mega Cities (Phase
2): Metro Manila”, Submitted to JICA
CTI Engineering International Co. Ltd. (2008) “Report on the Study on Climate Impact Adaptation and Mitigation in
Asian Coastal Mega Cities -Case of Metro Manila- Final Report”, Submitted to JICA.
Ibaraki University, Institute for Global Change Adaptation Science (2008) “Final Report on Climate Change Impact
over Asian Mega Cities: Advisory for Coastal Engineering and Adaptation”, Submitted to JICA
National Statistics Office, Republic of the Philippines. (2008) “2008 Survey on Impact of Floods on Establishments,
Final Report”, Submitted to JICA
Porio, E. (2008) “Vulnerability, Adaptation and Resilience to Flood and Climate Change-Related Risks among
Riverline Communities in Metro Manila”, Submitted to JICA
Sugiyama, M. (2008) “Final Report for the Study on Climate Impact Adaptation and Mitigation in Asian Coastal
Mega Cities of Integrated Research System for Sustainability Science, University of Tokyo”, Submitted to JICA
Tran Thi Viet Nga and Fukushi, K. (2008) “Infected Risk Assessment with Exposure to Pathogens in the Flood Water-
Case of Metro Manila,” submitted to JICA
Muto, M., Morishita, K., and Syson, L. (2010) “Impacts of Climate Change to Asian Coastal Areas: The case of
Metro Manila”, JICA Manila Report forthcoming as JICA Research Institute Working Paper
Sugiyama, M., Shiogawa, H., and Emori,S. (2009) “Precipitation extreme changes exceeding moisture content
increases in MIROC and IPCC climate models. Proceedings of The National Academy of Sciences of The United
States of America”, vol.107 No.2. p.571-575.