japan low-carbon society (lcs) studygroup3: investment: enabling low-carbon societies jose alberto...
TRANSCRIPT

1
Japan Low-Carbon Society (LCS) Study
Designed by Hajime Sakai
http://2050.nies.go.jp/interimreport/20070215_report_e.pdf
1. If we cannot go to LCS,…2. LCS offers higher QOL with
less energy demand and lower-carbon energy supply
3. LCS needs good design, early action, and innovations
Junichi Fujino (NIES), 17th Feb, 2008The 13th AIM International Workshop, Ohyama Memorial Hall, Tsukuba
2東大気候システム研究センター・国立環境研究所・地球環境フロンティア研究センター
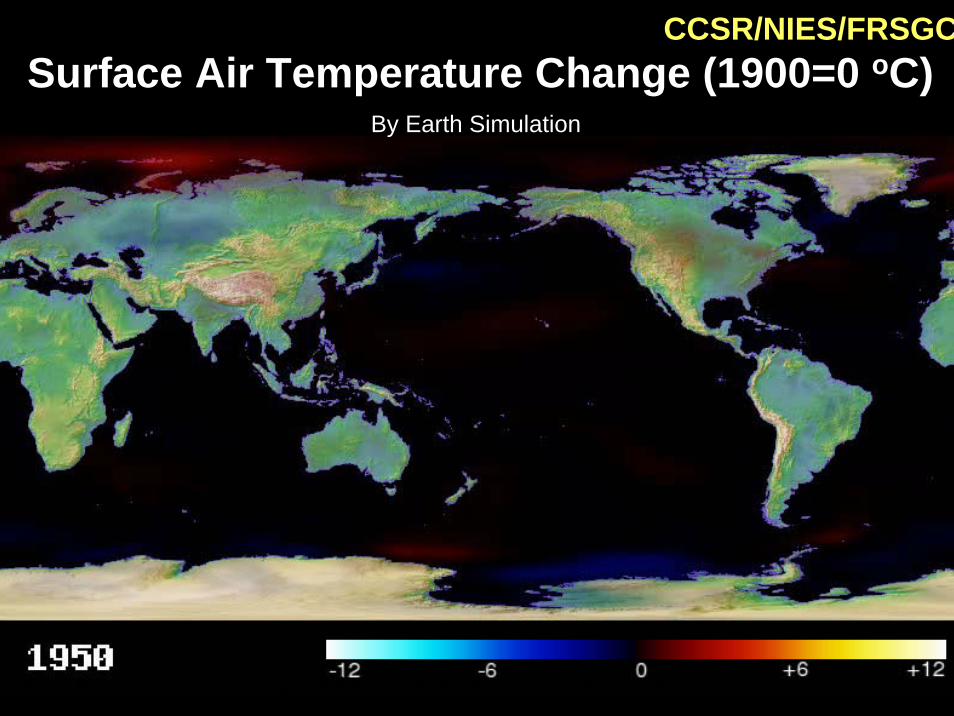
By Earth Simulation
CCSR/NIES/FRSGCSurface Air Temperature Change (1900=0 oC)
3
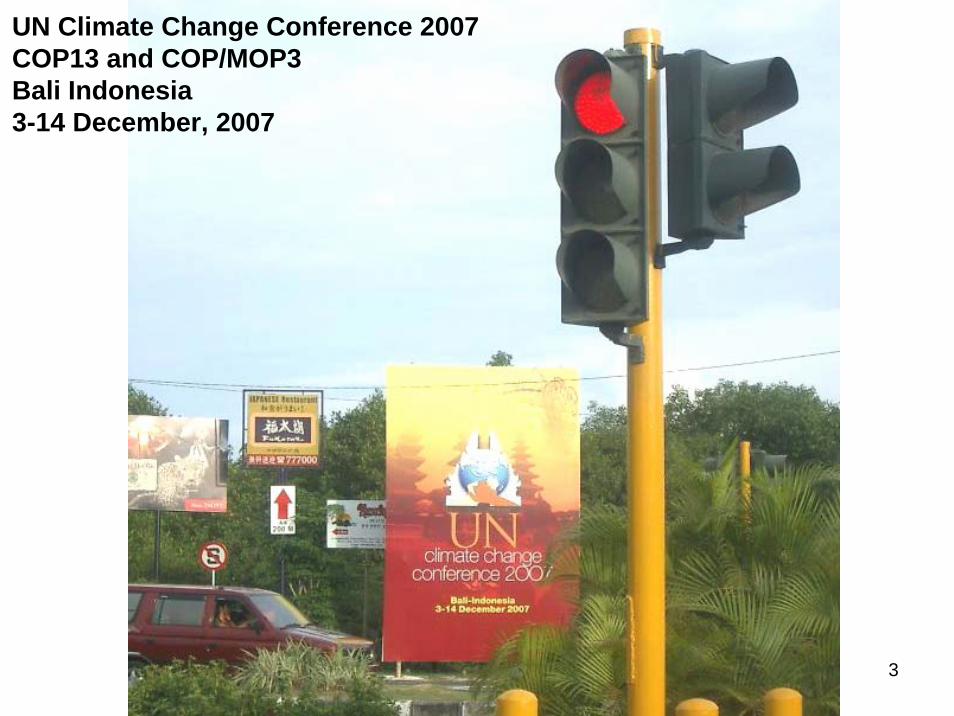
UN Climate Change Conference 2007COP13 and COP/MOP3Bali Indonesia3-14 December, 2007
4
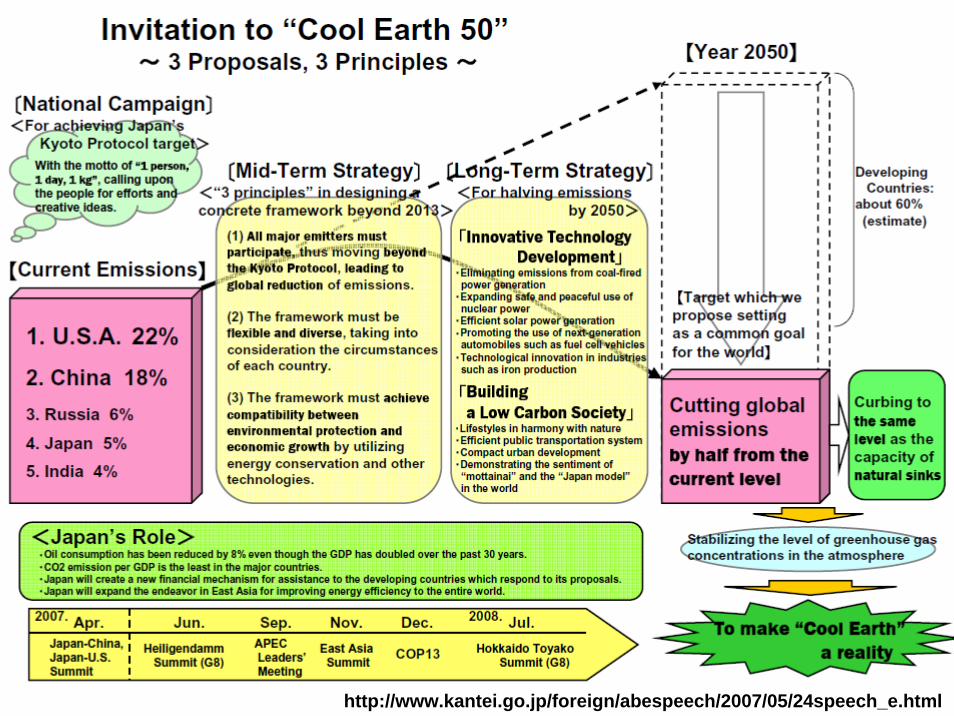
http://www.kantei.go.jp/foreign/abespeech/2007/05/24speech_e.html
5
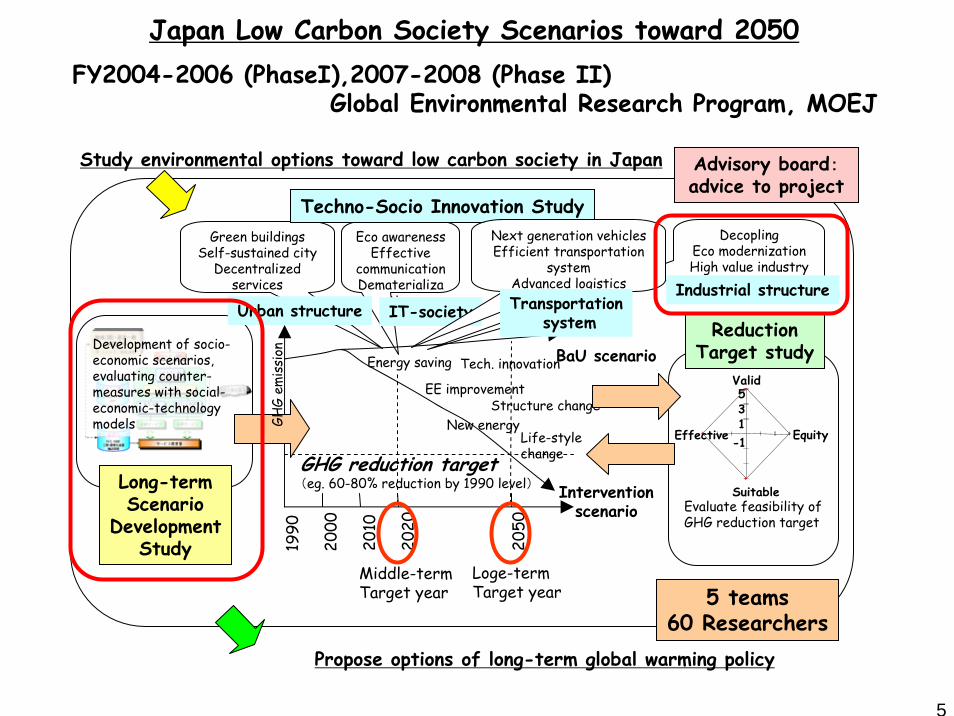
Japan Low Carbon Society Scenarios toward 2050FY2004-2006 (PhaseI),2007-2008 (Phase II)
Global Environmental Research Program, MOEJ
Green buildingsSelf-sustained city
Decentralized services
Eco awarenessEffective
communicationDematerializa
tion19
90
2000
2020
2050
2010
BaU scenario
Interventionscenario
EE improvement
New energy
Energy saving
Structure change
Life-stylechange
Tech. innovation
Urban structure IT-society
Techno-Socio Innovation Study
GHG reduction target(eg. 60-80% reduction by 1990 level)
Evaluate feasibility of GHG reduction target
Long-termScenario
DevelopmentStudy
Development of socio-economic scenarios, evaluating counter-measures with social-economic-technology models GH
G em
issi
on
DecoplingEco modernizationHigh value industry
Middle-termTarget year
Loge-termTarget year
-1135
Valid
Equity
Suitable
Effective
ReductionTarget study
Study environmental options toward low carbon society in Japan Advisory board:advice to project
5 teams60 Researchers
Propose options of long-term global warming policy
Next generation vehiclesEfficient transportation
systemAdvanced logisticsTransportation
system
Industrial structure
6
JapanJapanLowLow--
Carbon Carbon SocietySocietyProjectProject
BaU GHG-475ppm GHG-500ppm GHG-550ppm GHG-650ppm
0
5
10
15
20
25
1990
2000
2010
2020
2030
2040
2050
2060
2070
2080
2090
2100
年
温室
効果
ガス
排出
量 (二
酸化
炭素
換算
:G
tC/年
)
0.0
1.0
2.0
3.0
4.0
5.0
1990
2000
2010
2020
2030
2040
2050
2060
2070
2080
2090
2100
2110
2120
2130
2140
2150
年
気温
上昇
(199
0年=0
.6℃
)
GHG475ppm
GHG: Greenhouse gases50% reduction
650
550500
BaU
Tem
pera
ture
rais
e(a
bove
the
pre-
indu
stria
l lev
el)
Year
GH
G e
mis
sion
s (G
t-Ceq
)
475
650550500
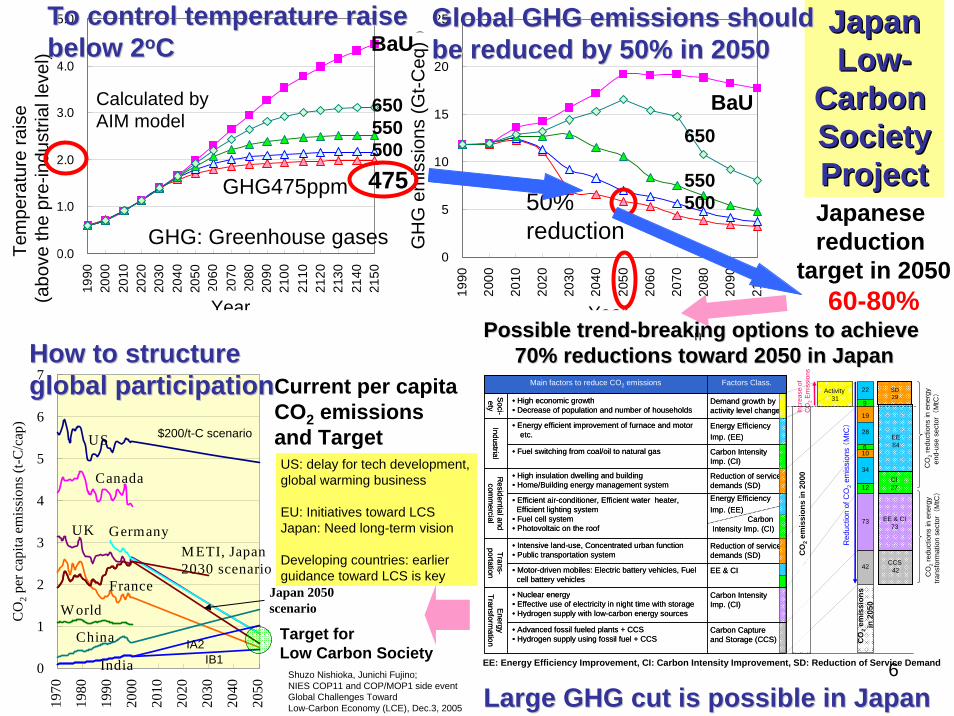
BaUGlobal GHG emissions should Global GHG emissions should be reduced by 50% in 2050be reduced by 50% in 2050
Calculated by AIM model
To control temperature rTo control temperature raaise ise below 2below 2ooCC
Year
Japanese reduction
target in 205060-80%
US
Canada
UK
France
China
India
W orld
0
1
2
3
4
5
6
7
1970
1980
1990
2000
2010
2020
2030
2040
2050
CO
2 per
cap
ita e
mis
sion
s (t-C
/cap
)
GermanyMETI, Japan2030 scenario
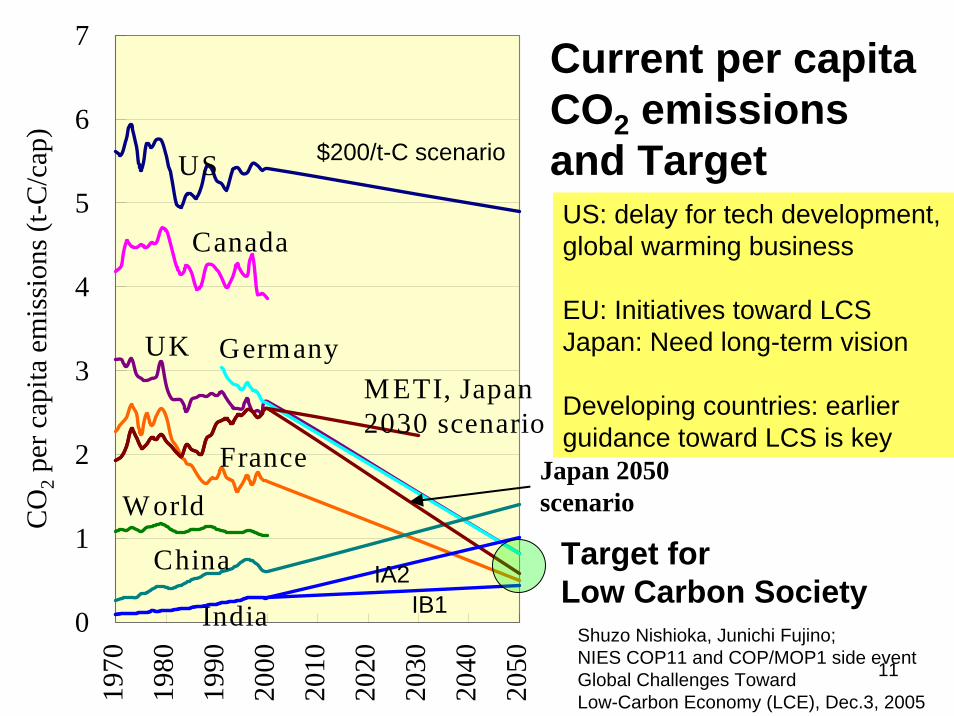
Current per capita CO2 emissions and Target
Target for Low Carbon SocietyIB1
IA2
Japan 2050 scenario
US: delay for tech development, global warming business
EU: Initiatives toward LCSJapan: Need long-term vision
Developing countries: earlierguidance toward LCS is key
$200/t-C scenario
Shuzo Nishioka, Junichi Fujino; NIES COP11 and COP/MOP1 side eventGlobal Challenges Toward Low-Carbon Economy (LCE), Dec.3, 2005
How to structure How to structure global participation global participation
Large GHG cut is possible in JapanLarge GHG cut is possible in Japan
Possible trendPossible trend--breaking options breaking options to achieve to achieve 70% reductions toward 2050 in Japan70% reductions toward 2050 in Japan
Intensity Imp. (CI)
Imp. (EE)Carbon
Carbon Capture and Storage (CCS)
• Advanced fossil fueled plants + CCS• Hydrogen supply using fossil fuel + CCS
EE & CI• Motor-driven mobiles: Electric battery vehicles, Fuel cell battery vehicles
Energy Efficiency • Efficient air-conditioner, Efficient water heater, Efficient lighting system
• Fuel cell system• Photovoltaic on the roof
Carbon Intensity Imp. (CI)
• Fuel switching from coal/oil to natural gas
Demand growth by activity level change
• High economic growth• Decrease of population and number of households
Soci-ety
Carbon Intensity Imp. (CI)
Reduction of service demands (SD)
Reduction of service demands (SD)
Energy Efficiency Imp. (EE)
Factors Class.
• Nuclear energy• Effective use of electricity in night time with storage• Hydrogen supply with low-carbon energy sources
Energy Transform
ation
• Intensive land-use, Concentrated urban function• Public transportation system
Trans-portation
• High insulation dwelling and building• Home/Building energy management system
Residential and com
mercial
• Energy efficient improvement of furnace and motor etc.
Industrial
Main factors to reduce CO2 emissions
Intensity Imp. (CI)
Imp. (EE)Carbon
Carbon Capture and Storage (CCS)
• Advanced fossil fueled plants + CCS• Hydrogen supply using fossil fuel + CCS
EE & CI• Motor-driven mobiles: Electric battery vehicles, Fuel cell battery vehicles
Energy Efficiency • Efficient air-conditioner, Efficient water heater, Efficient lighting system
• Fuel cell system• Photovoltaic on the roof
Carbon Intensity Imp. (CI)
• Fuel switching from coal/oil to natural gas
Demand growth by activity level change
• High economic growth• Decrease of population and number of households
Soci-ety
Carbon Intensity Imp. (CI)
Reduction of service demands (SD)
Reduction of service demands (SD)
Energy Efficiency Imp. (EE)
Factors Class.
• Nuclear energy• Effective use of electricity in night time with storage• Hydrogen supply with low-carbon energy sources
Energy Transform
ation
• Intensive land-use, Concentrated urban function• Public transportation system
Trans-portation
• High insulation dwelling and building• Home/Building energy management system
Residential and com
mercial
• Energy efficient improvement of furnace and motor etc.
Industrial
Main factors to reduce CO2 emissionsActivity
31
CO
2em
issi
ons
in 2
000
SD29
EE84
CI27
EE & CI73
CCS42
CO
2re
duct
ions
in e
nerg
yen
d-us
e se
ctor(
MtC
)C
O2
redu
ctio
ns in
ene
rgy
trans
form
atio
n se
ctor(
MtC)
Red
uctio
n of
CO
2em
issi
ons
(M
tC)
Incr
ease
of
CO
2Em
issi
ons
22
9
19
28
610
34
12
73
42
EE: Energy Efficiency Improvement, CI: Carbon Intensity Improvement, SD: Reduction of Service Demand
CO
2em
issi
ons
in 2
050
7
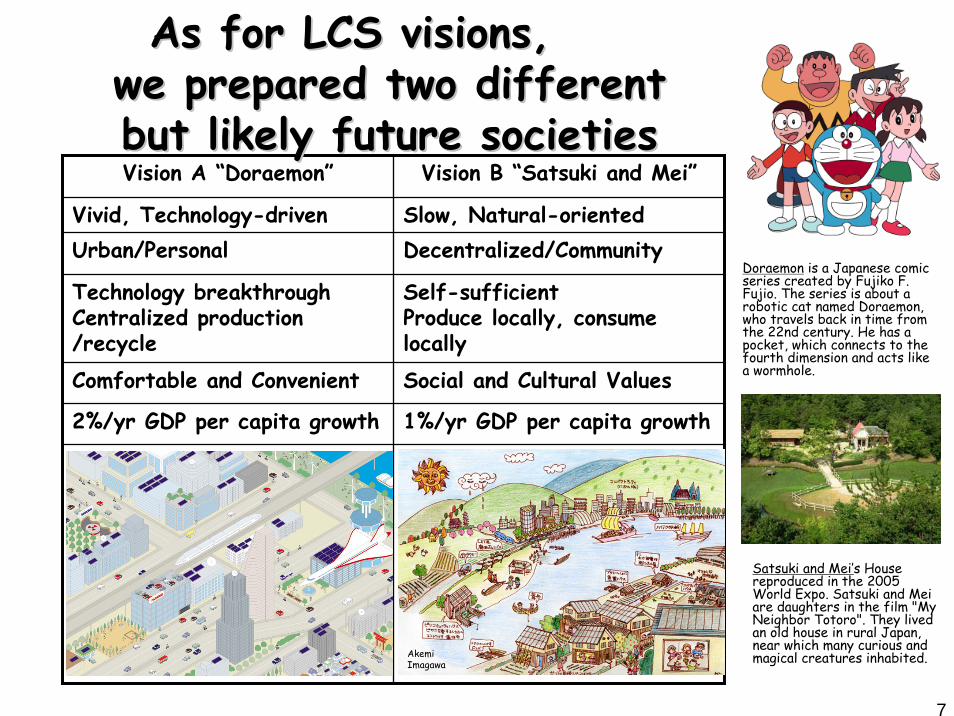
Vision A “Doraemon” Vision B “Satsuki and Mei”
Vivid, Technology-driven Slow, Natural-orientedUrban/Personal Decentralized/Community
Technology breakthroughCentralized production /recycle
Self-sufficientProduce locally, consume locally
Comfortable and Convenient Social and Cultural Values
2%/yr GDP per capita growth 1%/yr GDP per capita growth
As for LCS visions, As for LCS visions, we prepared two different we prepared two different but likely future societiesbut likely future societies
Akemi Imagawa
Doraemon is a Japanese comic series created by Fujiko F. Fujio. The series is about a robotic cat named Doraemon, who travels back in time from the 22nd century. He has a pocket, which connects to the fourth dimension and acts like a wormhole.
Satsuki and Mei’s House reproduced in the 2005 World Expo. Satsuki and Mei are daughters in the film "My Neighbor Totoro". They lived an old house in rural Japan, near which many curious and magical creatures inhabited.
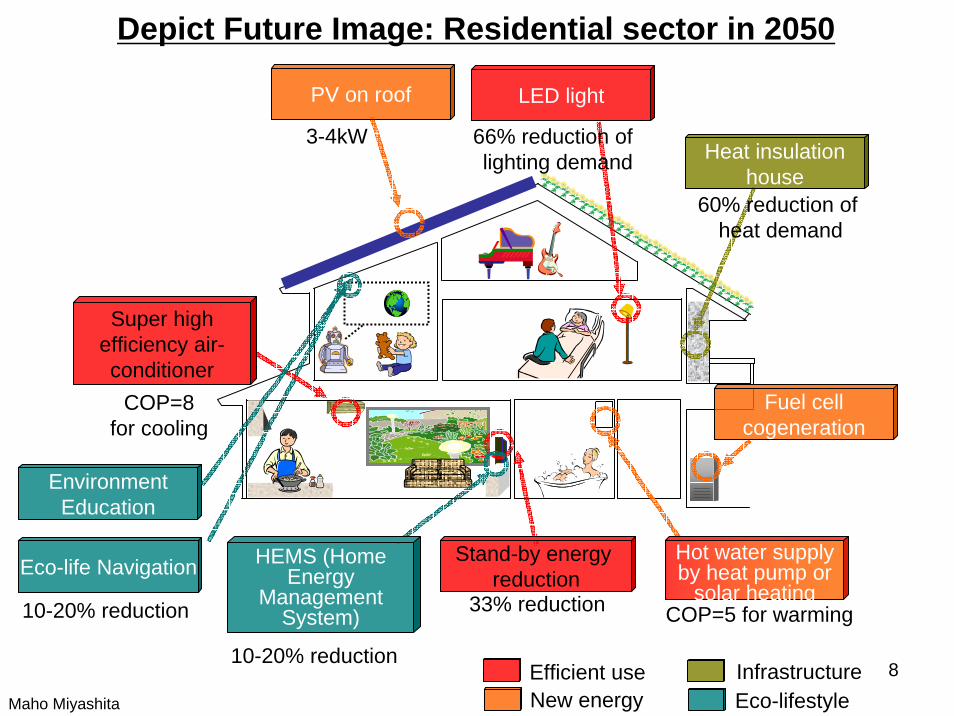
8Efficient useNew energy
InfrastructureEco-lifestyle
Super high efficiency air-conditioner
Stand-by energy reduction
LED lightPV on roof
Fuel cell cogeneration
Heat insulation house
Hot water supply by heat pump or
solar heating
HEMS (Home Energy
Management System)
Eco-life Navigation
COP=8for cooling
EnvironmentEducation
10-20% reduction
66% reduction oflighting demand
60% reduction of heat demand
33% reduction COP=5 for warming
3-4kW
Depict Future Image: Residential sector in 2050
10-20% reduction
Maho Miyashita

9
17
10
23
9
3 43 4
0
10
20
30
40
50
60
70
2000 2050A 2050B
Ene
rgy
Con
sum
ptio
n (M
toe)
Change of the numberof householdsChange of servicedemand per householdChange of energydemand per householdImprovement of energyefficiencyElectricity consumption
H2 consumption
Solar consumption
Biomass consumption
Gas consumption
Oil consumption
Energy consumption in2000
Residential sector CO2 reduction potential: 50%
Hi-Insulated housing
Energy Effiency
Social Innovations
TechnologicalInnovations
Change of the number of households: the number of households decrease both in scenario A and BChange of service demand per household: convenient lifestyle increases service demand per householdChange of energy demand per household: high insulated dwellings, Home Energy Management System (HEMS) Improvement of energy efficiency: air conditioner, water heater, cooking stove, lighting and standby power

10
Main factors to reduce CO2 emissions Factors Class.
Soci-ety • High economic growth
• Decrease of population and number of householdsDemand growth by activity level change
• Fuel switching from coal/oil to natural gas Carbon Intensity Imp. (CI)
Energy Efficiency Imp. (EE)
Carbon Intensity Imp. (CI)
• Motor-driven mobiles: Electric battery vehicles, Fuel cell battery vehicles
EE & CI
• Advanced fossil fueled plants + CCS• Hydrogen supply using fossil fuel + CCS
Carbon Capture and Storage (CCS)
• Efficient air-conditioner, Efficient water heater, Efficient lighting system
• Fuel cell system• Photovoltaic on the roof
Energy Efficiency Imp. (EE)
Reduction of service demands (SD)
Reduction of service demands (SD)
Carbon Intensity Imp. (CI)
• Energy efficient improvement of furnace and motor etc.
Industrial
• High insulation dwelling and building• Home/Building energy management system
Residential and com
mercial
• Intensive land-use, Concentrated urban function• Public transportation system
Trans-portation
• Nuclear energy• Effective use of electricity in night time with storage• Hydrogen supply with low-carbon energy sources
Energy
Transformation
Activity31
CO
2em
issi
ons
in 2
000
SD29
EE84
CI27
EE & CI73
CCS42
CO
2re
duct
ions
in e
nerg
yen
d-us
e se
ctor(
MtC
)C
O2
redu
ctio
ns in
ene
rgy
trans
form
atio
n se
ctor(
MtC)
Red
uctio
n of
CO
2em
issi
ons
(M
tC)
Incr
ease
of
CO
2Em
issi
ons
GHG 70% reduction in 2050 Scenario A: Vivid Techno-driven Society
22
9
19
28
610
34
12
73
42
EE: Energy Efficiency Improvement, CI: Carbon Intensity Improvement, SD: Reduction of Service Demand
CO
2em
issi
ons
in 2
050
Demand side energy -40% + Low carbonization of primary energy+CCSwith moderate cost of technological options as 0.3% of GDP in the year of 2050
11
US
Canada
UK
France
China
India
W orld
0
1
2
3
4
5
6
7
1970
1980
1990
2000
2010
2020
2030
2040
2050
CO
2 per
cap
ita e
mis
sion
s (t-C
/cap
)
GermanyMETI, Japan2030 scenario
Current per capita CO2 emissions and Target
Target for Low Carbon SocietyIB1
IA2
Japan 2050 scenario
US: delay for tech development, global warming business
EU: Initiatives toward LCSJapan: Need long-term vision
Developing countries: earlierguidance toward LCS is key
$200/t-C scenario
Shuzo Nishioka, Junichi Fujino; NIES COP11 and COP/MOP1 side eventGlobal Challenges Toward Low-Carbon Economy (LCE), Dec.3, 2005
12
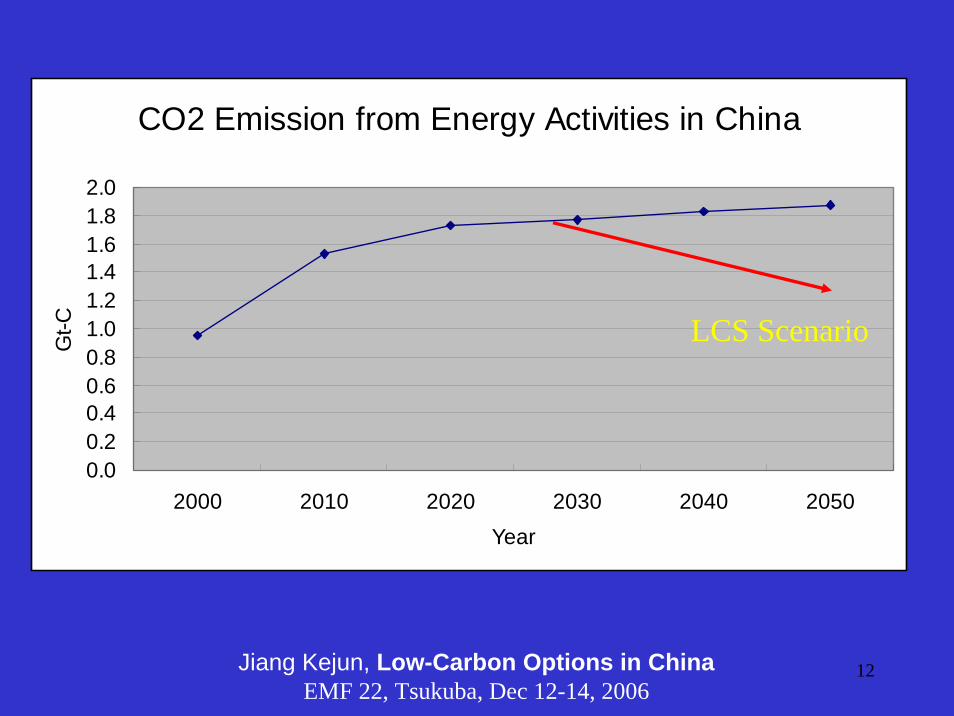
CO2 Emission from Energy Activities in China
0.00.20.40.60.81.01.21.41.61.82.0
2000 2010 2020 2030 2040 2050Year
Gt-C LCS Scenario
Jiang Kejun, Low-Carbon Options in ChinaEMF 22, Tsukuba, Dec 12-14, 2006
13http://2050.nies.go.jphttp://2050.nies.go.jp
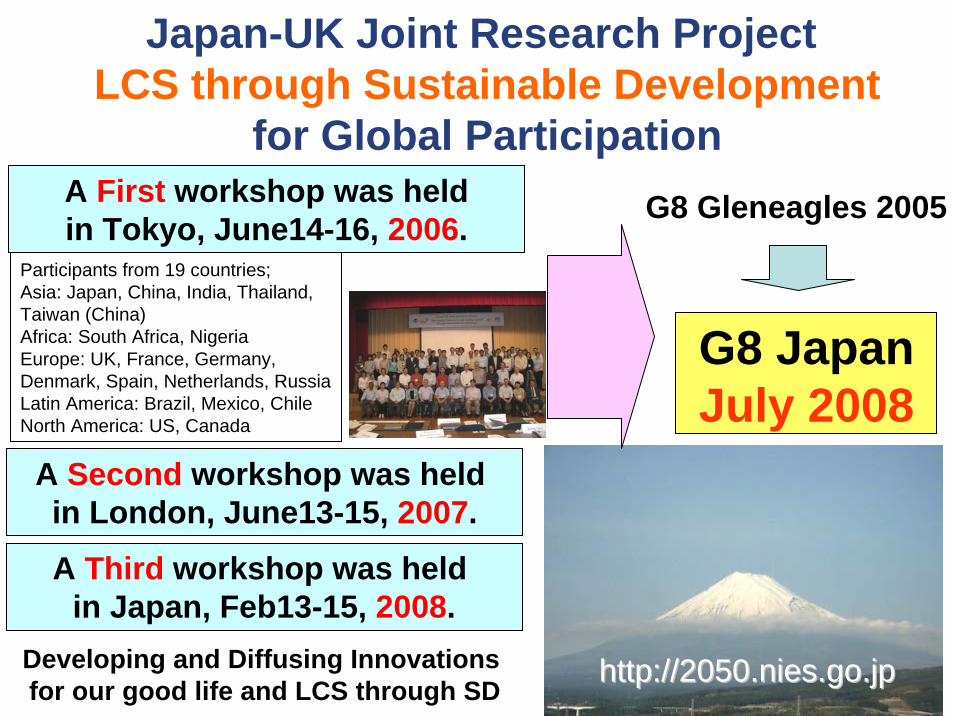
Japan-UK Joint Research ProjectLCS through Sustainable Development
for Global Participation
A Second workshop was held in London, June13-15, 2007.
A Third workshop was held in Japan, Feb13-15, 2008.
A First workshop was held in Tokyo, June14-16, 2006.
G8 JapanJuly 2008
G8 Gleneagles 2005
Developing and Diffusing Innovations for our good life and LCS through SD
Participants from 19 countries;Asia: Japan, China, India, Thailand, Taiwan (China)Africa: South Africa, NigeriaEurope: UK, France, Germany, Denmark, Spain, Netherlands, RussiaLatin America: Brazil, Mexico, ChileNorth America: US, Canada

14
15
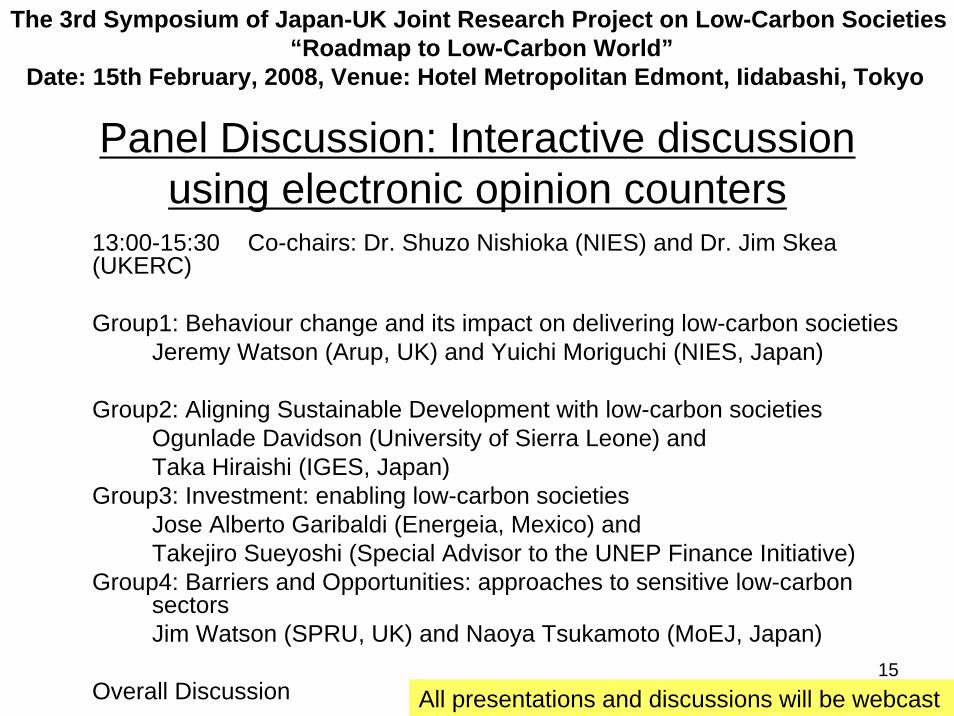
Panel Discussion: Interactive discussion using electronic opinion counters
13:00-15:30 Co-chairs: Dr. Shuzo Nishioka (NIES) and Dr. Jim Skea(UKERC)
Group1: Behaviour change and its impact on delivering low-carbon societiesJeremy Watson (Arup, UK) and Yuichi Moriguchi (NIES, Japan)
Group2: Aligning Sustainable Development with low-carbon societiesOgunlade Davidson (University of Sierra Leone) andTaka Hiraishi (IGES, Japan)
Group3: Investment: enabling low-carbon societiesJose Alberto Garibaldi (Energeia, Mexico) and Takejiro Sueyoshi (Special Advisor to the UNEP Finance Initiative)
Group4: Barriers and Opportunities: approaches to sensitive low-carbon sectorsJim Watson (SPRU, UK) and Naoya Tsukamoto (MoEJ, Japan)
Overall Discussion
The 3rd Symposium of Japan-UK Joint Research Project on Low-Carbon Societies“Roadmap to Low-Carbon World”
Date: 15th February, 2008, Venue: Hotel Metropolitan Edmont, Iidabashi, Tokyo
All presentations and discussions will be webcast
16
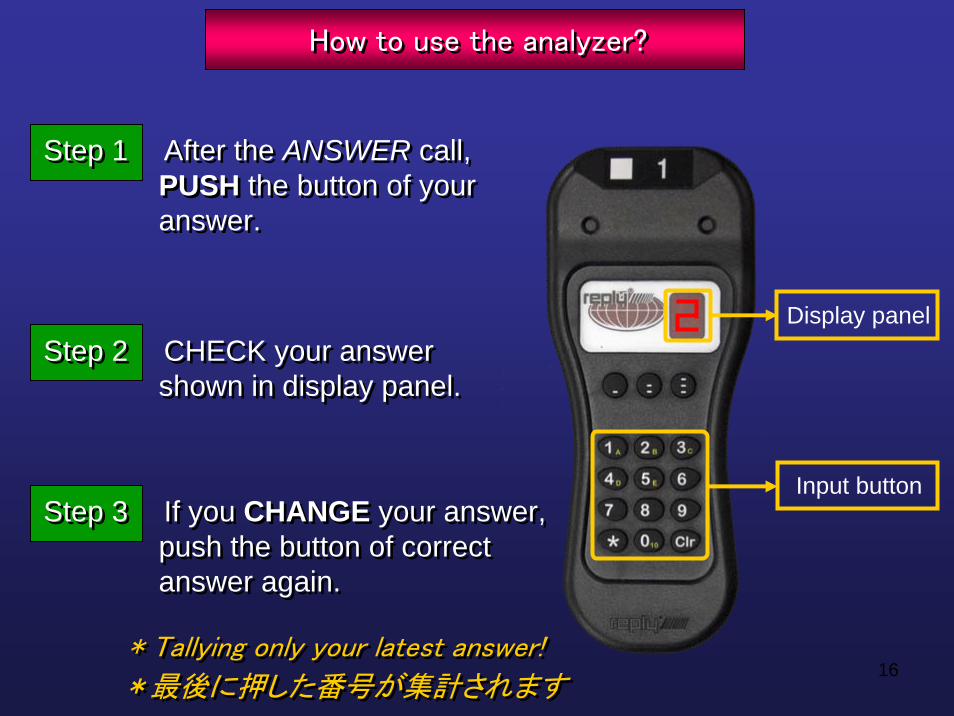
Step 1 After the ANSWER call,PUSH the button of youranswer.
Step 1 After the ANSWER call,PUSH the button of youranswer.
Step 2 CHECK your answershown in display panel.
Step 2 CHECK your answershown in display panel.
Step 3 If you CHANGE your answer,push the button of correctanswer again.
Step 3 If you CHANGE your answer,push the button of correctanswer again.
Input button
Display panel
How to use the analyzer?How to use the analyzer?
* Tallying only your latest answer!* Tallying only your latest answer!
*最後に押した番号が集計されます*最後に押した番号が集計されます
17
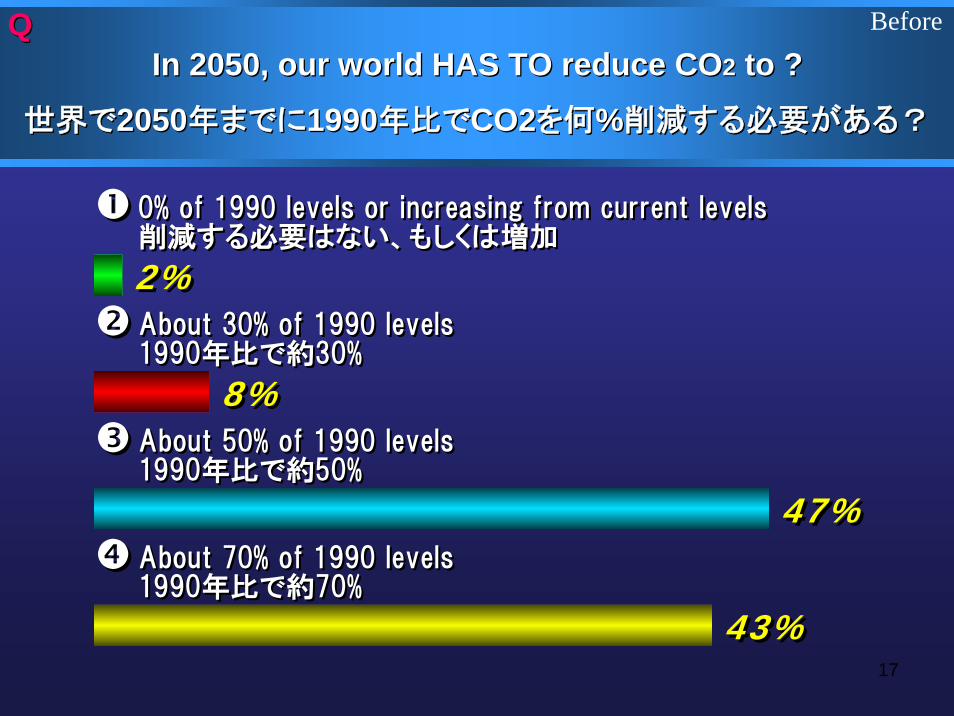
2%2%
8%8%
47%47%
43%43%
0% of 1990 levels or increasing from current levels 0% of 1990 levels or increasing from current levels 削減する必要はない、もしくは増加 削減する必要はない、もしくは増加
About 30% of 1990 levels About 30% of 1990 levels 1990年比で約30% 1990年比で約30%
About 50% of 1990 levels About 50% of 1990 levels 1990年比で約50% 1990年比で約50%
About 70% of 1990 levels About 70% of 1990 levels 1990年比で約70% 1990年比で約70%
In 2050, our world HAS TO reduce COIn 2050, our world HAS TO reduce CO22 to ?to ?QQ
世界で世界で20502050年までに年までに19901990年比で年比でCO2CO2を何を何%%削減する必要がある?削減する必要がある?
Before
18
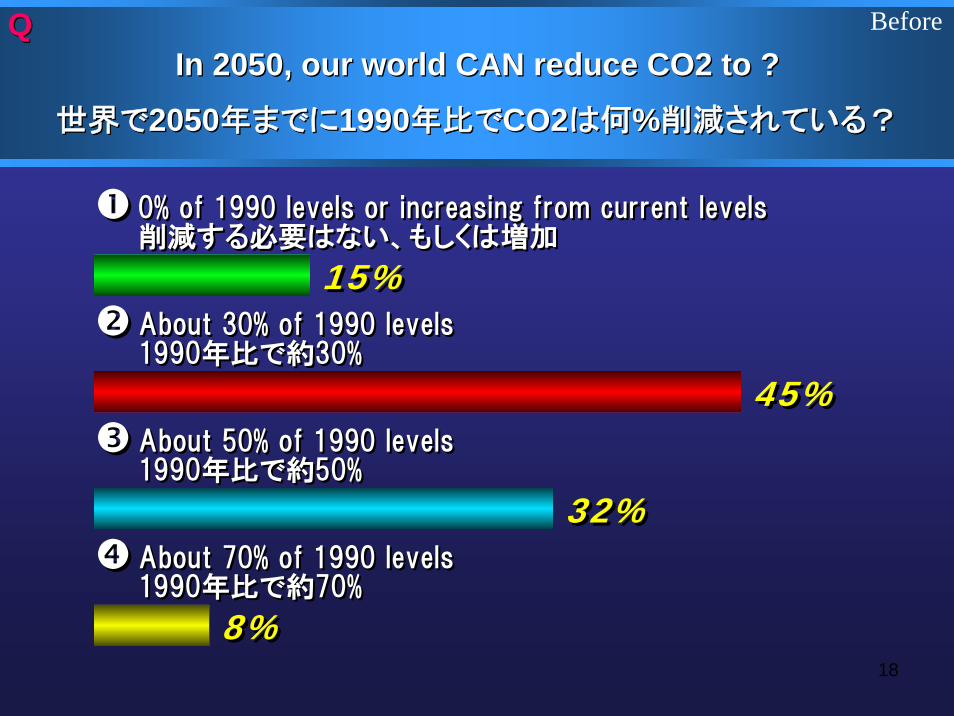
15%15%
45%45%
32%32%
8%8%
0% of 1990 levels or increasing from current levels 0% of 1990 levels or increasing from current levels 削減する必要はない、もしくは増加 削減する必要はない、もしくは増加
About 30% of 1990 levels About 30% of 1990 levels 1990年比で約30% 1990年比で約30%
About 50% of 1990 levels About 50% of 1990 levels 1990年比で約50% 1990年比で約50%
About 70% of 1990 levels About 70% of 1990 levels 1990年比で約70% 1990年比で約70%
In 2050, our world CAN reduce CO2 to ?In 2050, our world CAN reduce CO2 to ?QQ
世界で世界で20502050年までに年までに19901990年比で年比でCO2CO2は何は何%%削減されている削減されている??
Before
19
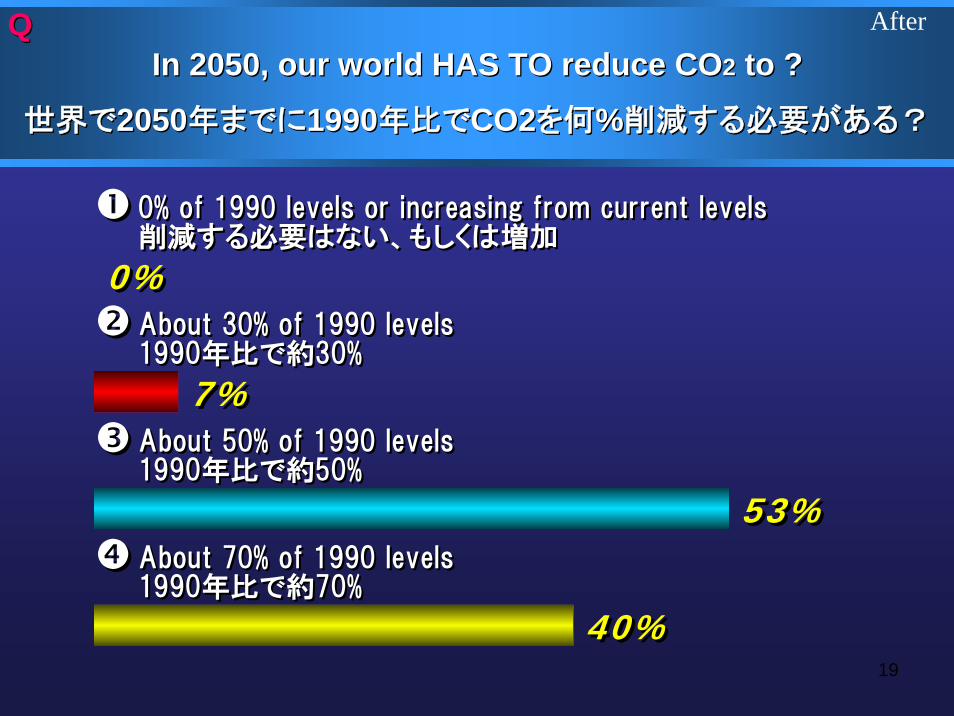
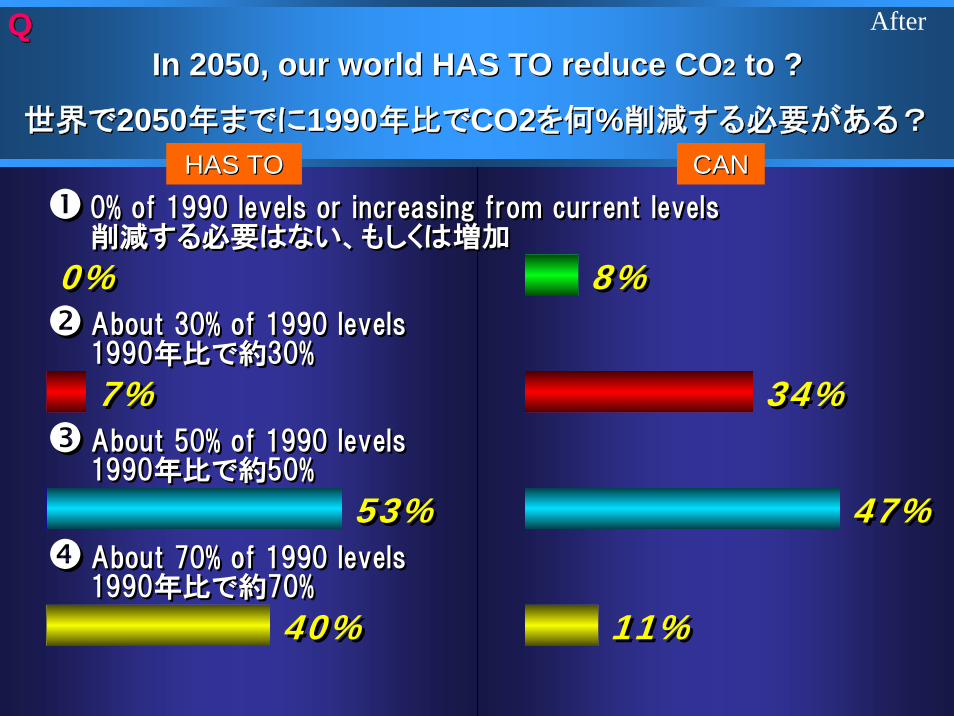
0%0%
7%7%
53%53%
40%40%
0% of 1990 levels or increasing from current levels 0% of 1990 levels or increasing from current levels 削減する必要はない、もしくは増加 削減する必要はない、もしくは増加
About 30% of 1990 levels About 30% of 1990 levels 1990年比で約30% 1990年比で約30%
About 50% of 1990 levels About 50% of 1990 levels 1990年比で約50% 1990年比で約50%
About 70% of 1990 levels About 70% of 1990 levels 1990年比で約70% 1990年比で約70%
In 2050, our world HAS TO reduce COIn 2050, our world HAS TO reduce CO22 to ?to ?QQ
世界で世界で20502050年までに年までに19901990年比で年比でCO2CO2を何を何%%削減する必要がある?削減する必要がある?
After
20
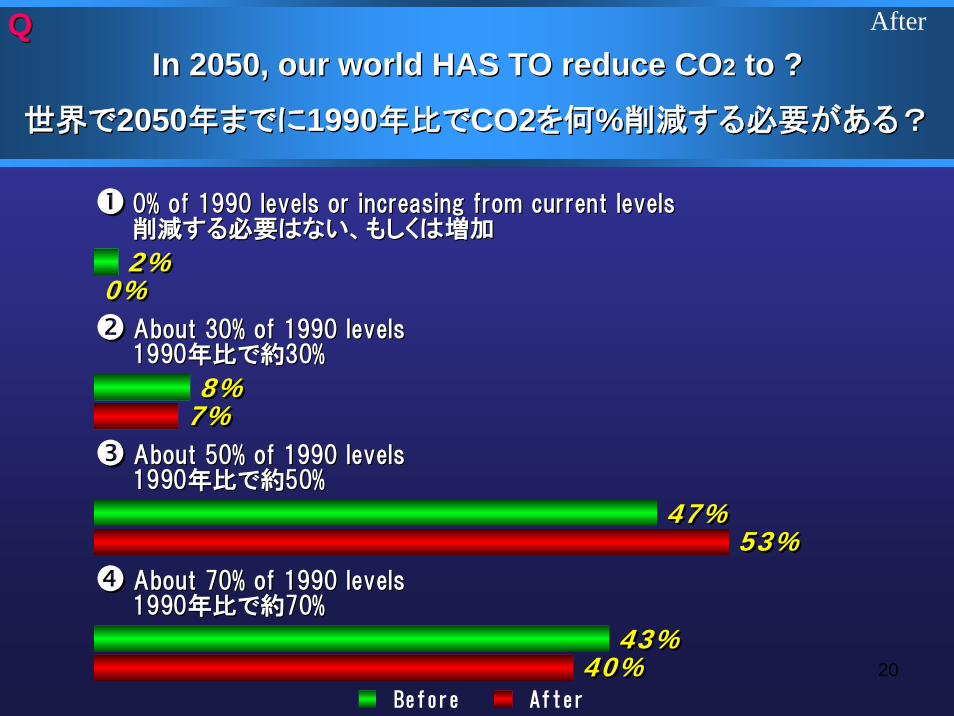
2%2%0%0%
8%8%7%7%
47%47%53%53%
43%43%40%40%
0% of 1990 levels or increasing from current levels 0% of 1990 levels or increasing from current levels 削減する必要はない、もしくは増加 削減する必要はない、もしくは増加
About 30% of 1990 levels About 30% of 1990 levels 1990年比で約30% 1990年比で約30%
About 50% of 1990 levels About 50% of 1990 levels 1990年比で約50% 1990年比で約50%
About 70% of 1990 levels About 70% of 1990 levels 1990年比で約70% 1990年比で約70%
Before After
In 2050, our world HAS TO reduce COIn 2050, our world HAS TO reduce CO22 to ?to ?QQ
世界で世界で20502050年までに年までに19901990年比で年比でCO2CO2を何を何%%削減する必要がある?削減する必要がある?
After
21
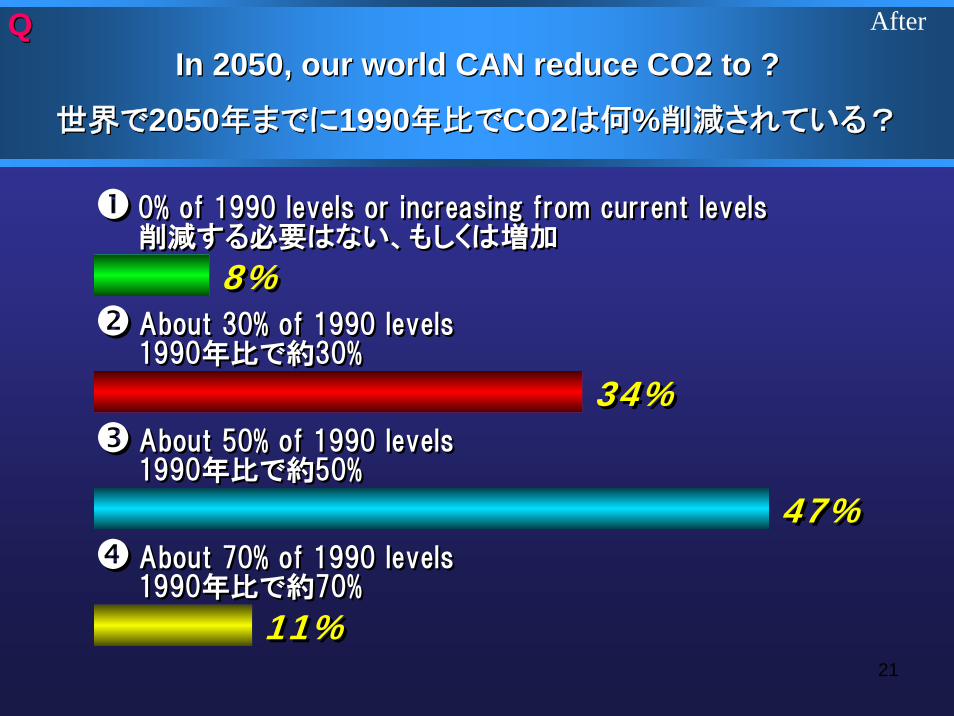
8%8%
34%34%
47%47%
11%11%
0% of 1990 levels or increasing from current levels 0% of 1990 levels or increasing from current levels 削減する必要はない、もしくは増加 削減する必要はない、もしくは増加
About 30% of 1990 levels About 30% of 1990 levels 1990年比で約30% 1990年比で約30%
About 50% of 1990 levels About 50% of 1990 levels 1990年比で約50% 1990年比で約50%
About 70% of 1990 levels About 70% of 1990 levels 1990年比で約70% 1990年比で約70%
In 2050, our world CAN reduce CO2 to ?In 2050, our world CAN reduce CO2 to ?QQ
世界で世界で20502050年までに年までに19901990年比で年比でCO2CO2は何は何%%削減されている削減されている??
After

22
15%15%8%8%
45%45%34%34%
32%32%47%47%
8%8%11%11%
0% of 1990 levels or increasing from current levels 0% of 1990 levels or increasing from current levels 削減する必要はない、もしくは増加 削減する必要はない、もしくは増加
About 30% of 1990 levels About 30% of 1990 levels 1990年比で約30% 1990年比で約30%
About 50% of 1990 levels About 50% of 1990 levels 1990年比で約50% 1990年比で約50%
About 70% of 1990 levels About 70% of 1990 levels 1990年比で約70% 1990年比で約70%
Before After
In 2050, our world CAN reduce CO2 to ?In 2050, our world CAN reduce CO2 to ?QQ
世界で世界で20502050年までに年までに19901990年比で年比でCO2CO2は何は何%%削減されている削減されている??
After
23
0%0%
7%7%
53%53%
40%40%
0% of 1990 levels or increasing from current levels 0% of 1990 levels or increasing from current levels 削減する必要はない、もしくは増加 削減する必要はない、もしくは増加
About 30% of 1990 levels About 30% of 1990 levels 1990年比で約30% 1990年比で約30%
About 50% of 1990 levels About 50% of 1990 levels 1990年比で約50% 1990年比で約50%
About 70% of 1990 levels About 70% of 1990 levels 1990年比で約70% 1990年比で約70%
In 2050, our world HAS TO reduce COIn 2050, our world HAS TO reduce CO22 to ?to ?QQ
世界で世界で20502050年までに年までに19901990年比で年比でCO2CO2を何を何%%削減する必要がある?削減する必要がある?
After
8%8%
34%34%
47%47%
11%11%
CANCANHAS TOHAS TO
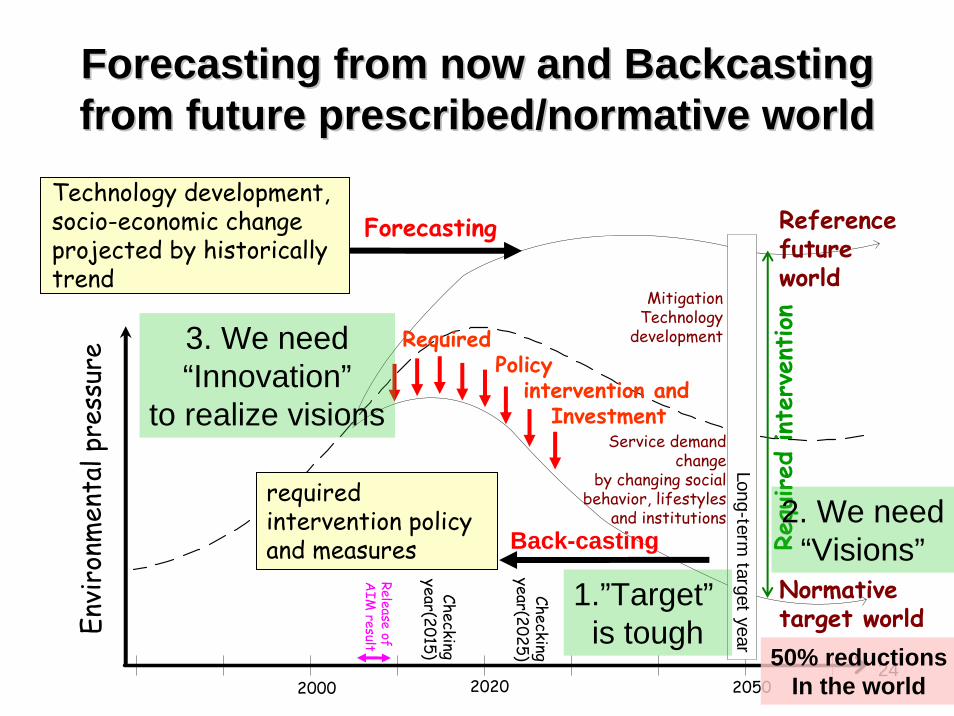
242020 20502000
Long-term target year
Release of A
IM result
Technology development,socio-economic change projected by historically trend
Forecasting
Back-casting
Normative target world
Reference future world
Service demand change
by changing social behavior, lifestyles
and institutions
Mitigation Technology
developmentRequiredPolicy
intervention and Investment
required intervention policy and measures
Envi
ronm
enta
l pre
ssur
e
Checkingyear(2015)
Checkingyear(2025)
Requ
ired
int
erve
ntion
3. We need“Innovation”
to realize visions
2. We need“Visions”
1.”Target”is tough
50% reductionsIn the world
Forecasting from now and Backcasting Forecasting from now and Backcasting from future prescribed/normative worldfrom future prescribed/normative world
25
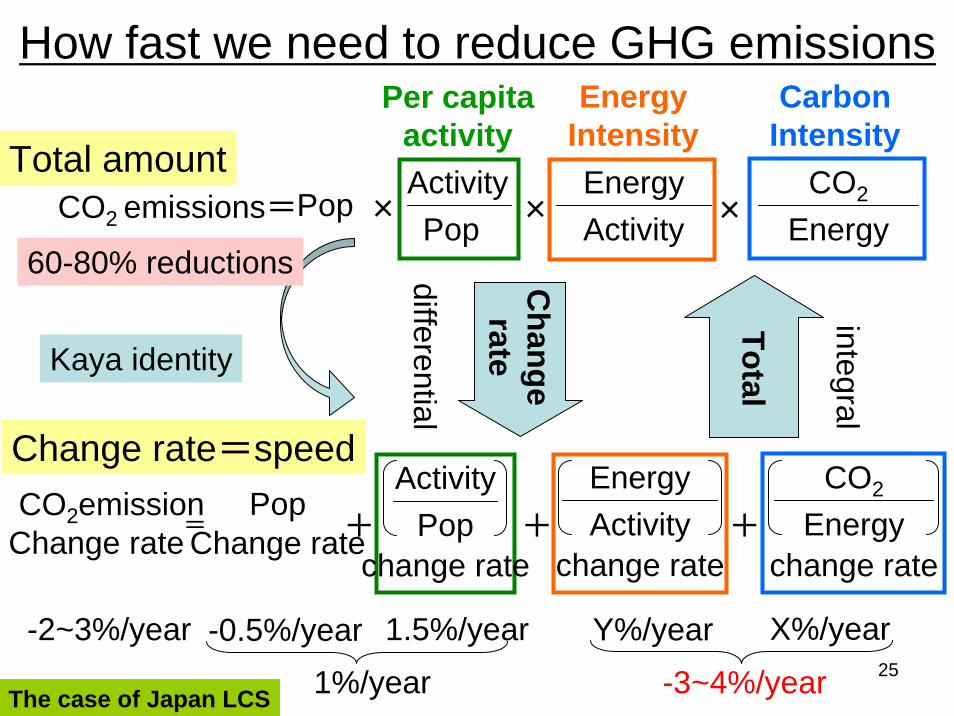
CO2 emissions=PopActivity Energy CO2
× Pop Activity Energy× ×
+ + +
Changerate
CO2emissionChange rate
PopChange rate
ActivityPop
change rate
EnergyActivity
change rate
CO2
Energychange rate
=
integral
differential
Total
Change rate=speed
Total amount
Per capitaactivity
EnergyIntensity
CarbonIntensity
How fast we need to reduce GHG emissions
-0.5%/year 1.5%/year-2~3%/year1%/year
Y%/year X%/year
-3~4%/year
60-80% reductions
Kaya identity
The case of Japan LCS
26
Hurry up!
Our time is limited towards a LCS.
Brussels Midi Station
27
What do you want to do now What do you want to do now for our future?for our future?
Christmas Concert of Yoko Fujino’sPiano Class on Dec 23, 2005

28
What gift you can provide What gift you can provide for our future?for our future?
Christmas Concert of Yoko Fujino’sPiano Class on Dec 23, 2005