japanese equity quantitative strategy - nomura … summary three negative correlations of equity...
TRANSCRIPT

Connecting Markets East & West
© Nomura
Global Quantitative Investment Strategies Conference
June, 2016
Japanese equity quantitative strategy
Akihiro MURAKAMI
Chief Quantitative Strategist, Japan
Nomura Securities Co., Ltd
+81 (0)3 6703 1746

1
Summary
Three negative correlations of equity factors with macro variables
・Oil prices, credit risk and interest rates have an impact on major Japanese equity factors,
and this is significant and increases the correlation with global equity factors
・ Low interest rates and a fall in “bond risk premium” have continued to support "bond-like stocks"
Text analysis of FOMC minutes using a machine-learning approach
・The tone of minutes is likely to have a predictive power for future “bond risk premium” and
return of “bond-like stocks”
・ Our analysis of the latest minutes suggests a fall of “bond risk premium” and outperformance of
“bond-like stocks”
Strategies to avoid herding by “global bond funds”, “smart beta funds” and “active funds”
・ Hold “bond-like stocks” the only alternative
・ Concentrated positions warrant concern

Correlation between factor returns on Japanese and global equities
Continuing high correlation
between global and Japanese equities
2
Note: Figure shows time series data for the average rank correlation between returns on the main factors for Japanese equities and factor returns in developed and emerging economies in the Americas, developed and emerging EMEA
economies, and developed and emerging Asia Pacific economies.
Source: Nomura
-0.6
-0.4
-0.2
0.0
0.2
0.4
0.6
0.8
1.0
20
02-1
Q
20
03-1
Q
20
04-1
Q
20
05-1
Q
20
06-1
Q
20
07-1
Q
20
08-1
Q
20
09-1
Q
20
10-1
Q
20
11-1
Q
20
12-1
Q
20
13-1
Q
20
14-1
Q
20
15-J
an
20
15-M
ay
20
15-S
ep
20
15-D
ec
20
16-M
ar
Correlation of factors
(High)
(Low)
Historical average
end-Feb
(1) Lehman shock
(2) First bailout for Greece
(3) Expansion of European debt crisis
end-Jan
9 Oct 7 Mar
25 May
High correlation since 2014

-140
-120
-100
-80
-60
-40
-20
0
20
201
3/1
2
201
4/0
3
201
4/0
6
201
4/0
9
201
4/1
2
201
5/0
3
201
5/0
6
201
5/0
9
201
5/1
2
201
6/0
3Cumulative return (WTI)(End-2013/12 = 0%)
17.Mar-30.Apr
(yyyy/mm)
11.Feb-14.Mar
-20
-10
0
10
20
30
40
50
2013/1
2
2014/3
2014/6
2014/9
2014/1
2
2015/3
2015/6
2015/9
2015/1
2
2016/3
End-2013/12 = 0% Cumulative return - MOM12
(yyyy/m)
- JAPAN- North America- EMEA- AsiaexJ
2014Q1 Q2 Q3 Q4 2015Q1 Q2 Q3
17.Mar-30.Apr
2016Q1Q4
11.Feb-14.Mar
1.Mar
Q2
Negative correlation between crude oil prices and momentum continues: return reversals (negative share price momentum) when crude oil prices rise
3
Note: (a) Universe is MSCI World Index constituent stocks. We divided our universe into five groups based on factor
values at the beginning of the month. We then formed a portfolio comprising long positions in the top quintile
and short positions in the bottom quintile and measured its return (US dollar basis). We did not take trading
costs into account. Analysis is based on historical share prices and does not guarantee future performance. (b)
Crude oil price trend = cumulative return for West Texas Intermediate (WTI) and Cushing Crude Oil Spot Price.
Sample period was Jan 2014 through 31 May 2016.
Source: Nomura
(a) Share price momentum (historical 12-month return)
(b) WTI (cumulative %)
(1) Negative correlation
between crude oil prices and momentum factor
Momentum factors were negative
during oil prices rebound
Oil prices rebound

-400
-300
-200
-100
0
100
200
300
400
201
012
201
103
201
106
201
109
201
112
201
203
201
206
201
209
201
212
201
303
201
306
201
309
201
312
201
403
201
406
201
409
201
412
201
503
201
506
201
509
201
512
201
603
(bp) Difference in CDS spreads for #5 (low-P/B) and #1 (high-P/B)
2011
Q1 Q2 Q3 Q4
2012
Q1 Q2 Q3 Q4
2013
Q1 Q2 Q3 Q4
2014
Q1 Q2 Q3 Q4
2015
Q1 Q2 Q3 Q4 Q1 Q2
2016
- Japan- North America- Europe/Middle East
Credit risk for low P/B stocks
(Low)
(High)Receding of credit risk
15 Feb-28 Apr
Difference in CDS spreads for low-P/B stocks and high-P/B stocks, and performance of the P/B factor
(2) Negative correlation
between credit risk and value factors
Note: Our universe was Japanese, North American, and EMEA stocks
in the MSCI World Index, and for each region we divided the
universe into five groups on the basis of the P/B factor. In the top
figure, we show the difference between the medians of the 5-
year CDS spreads for Group #5 (low-P/B) and Group #1 (high-
P/B). In the bottom figure, we show cumulative daily returns for
the long/short strategy in which we go long on the equally
weighted portfolio of stocks in Group #5 (low-P/B) and short on
that of stocks in Group #1 (high-P/Bs). Returns are all converted
to dollars. Transaction costs are not included. Analysis is based
on past share price performance and does not guarantee future
performance. The analysis period is Jan 2011–31 May 2016.
Source: Nomura
4
Convergence of the CDS spread since 15 Feb
Revival of value
-70
-60
-50
-40
-30
-20
-10
0
10
20
201
012
201
103
201
106
201
109
201
112
201
203
201
206
201
209
201
212
201
303
201
306
201
309
201
312
201
403
201
406
201
409
201
412
201
503
201
506
201
509
201
512
201
603
(end-Dec 2010 = 0%) Cumulative return (P/B factor)
2011
Q1 Q2 Q3 Q4
2012
Q1 Q2 Q3 Q4
2013
Q1 Q2 Q3 Q4
2014
Q1 Q2 Q3 Q4
2015
Q1 Q2 Q3 Q4 Q1 Q2
2016
- Japan- North America- Europe/Middle East
Returns for low P/B stocks
(Low)
(High)
"Value + Junk" rally
Performance of the P/B factor
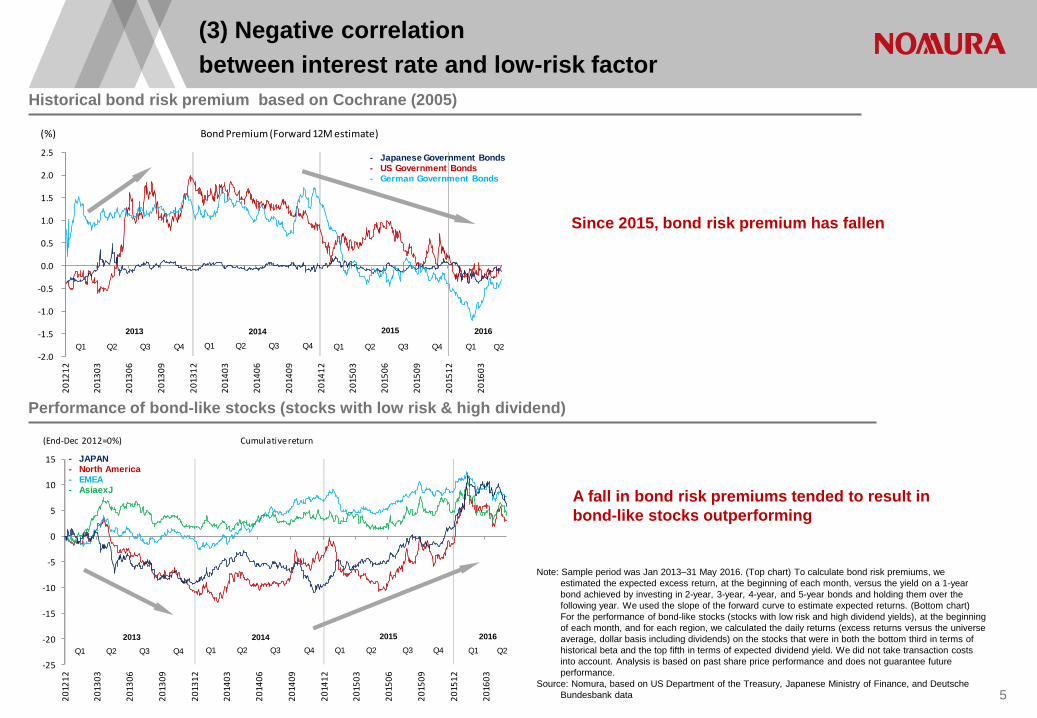
Historical bond risk premium based on Cochrane (2005)
(3) Negative correlation
between interest rate and low-risk factor
5
Note: Sample period was Jan 2013–31 May 2016. (Top chart) To calculate bond risk premiums, we
estimated the expected excess return, at the beginning of each month, versus the yield on a 1-year
bond achieved by investing in 2-year, 3-year, 4-year, and 5-year bonds and holding them over the
following year. We used the slope of the forward curve to estimate expected returns. (Bottom chart)
For the performance of bond-like stocks (stocks with low risk and high dividend yields), at the beginning
of each month, and for each region, we calculated the daily returns (excess returns versus the universe
average, dollar basis including dividends) on the stocks that were in both the bottom third in terms of
historical beta and the top fifth in terms of expected dividend yield. We did not take transaction costs
into account. Analysis is based on past share price performance and does not guarantee future
performance.
Source: Nomura, based on US Department of the Treasury, Japanese Ministry of Finance, and Deutsche
Bundesbank data
Performance of bond-like stocks (stocks with low risk & high dividend)
-2.0
-1.5
-1.0
-0.5
0.0
0.5
1.0
1.5
2.0
2.5
20
121
2
20
130
3
20
130
6
20
130
9
20
131
2
20
140
3
20
140
6
20
140
9
20
141
2
20
150
3
20
150
6
20
150
9
20
151
2
20
160
3
(%) Bond Premium (Forward 12M estimate)
Q1 Q2 Q3 Q4
2014 20152013
Q1 Q2 Q3 Q4 Q1 Q2 Q3 Q4
- Japanese Government Bonds- US Government Bonds- German Government Bonds
Q1
2016
Q2
-25
-20
-15
-10
-5
0
5
10
15
20
121
2
20
130
3
20
130
6
20
130
9
20
131
2
20
140
3
20
140
6
20
140
9
20
141
2
20
150
3
20
150
6
20
150
9
20
151
2
20
160
3
(End-Dec 2012=0%) Cumulative return
Q1 Q2 Q3 Q4
2014 20152013
Q1 Q2 Q3 Q4 Q1 Q2 Q3 Q4
- JAPAN- North America- EMEA- AsiaexJ
Q1
2016
Q2
Since 2015, bond risk premium has fallen
A fall in bond risk premiums tended to result in
bond-like stocks outperforming

0.0
0.5
1.0
1.5
2.0
2.5
3.0
3.5
4.0
4.5
5.0
1 2 3 4 5 6 7 8 9 10 15 20 25 30
(%) Spot rate curve of US government bonds
Dec 2013
Dec 2015
31 May 2016
Maturi ty
1.86
3.16
Spot rate curve of US government bonds
Steepening of curve is necessary for a change in trends
6
Spot rate curve of BUNDS - German government bonds
Source: Nomura, based on Department of the Treasury , Bundesbank, Ministry of Finance and other data
-1.0
-0.5
0.0
0.5
1.0
1.5
2.0
2.5
3.0
3.5
1 2 3 4 5 6 7 8 9 10 15 20 25 30
(%) Spot rate curve of German government bonds
Dec 2013
Dec 2015
31 May 2016
Maturi ty
0.17
2.11
Spot rate curve of JGB
-0.5
0.0
0.5
1.0
1.5
2.0
1 2 3 4 5 6 7 8 9 10 15 20 25 30
(%) Spot rate curve of JGB
Dec 2013
Dec 2015
31 May 2016
Maturi ty
-0.09
0.75

Japan
China
India
Five major Asian countries
US
Canada
BrazilChili
Mexico
Australia
South Africa
Europe
97.0
97.5
98.0
98.5
99.0
99.5
100.0
100.5
101.0
-0.60 -0.40 -0.20 0.00 0.20 0.40 0.60
Phase of economic cycle (November 2015)
Expansion減速局面
後退局面 回復局面
CLI level
Change in CLI (1st diff)(Down) (Up)
(Low)
(High) Downturn
Slowdown Recovery
Japan
China
India
Five major Asian countries
US
Canada
Brazil
Chili
Mexico
Australia
South Africa
Europe
97.0
97.5
98.0
98.5
99.0
99.5
100.0
100.5
101.0
-0.60 -0.40 -0.20 0.00 0.20 0.40 0.60
Phase of economic cycle (May 2016)
ExpansionDownturn
Slowdown Recovery
CLI level
Change in CLI (1st diff)(Down) (Up)
(Low)
(High)
After all, boil down to global low growth
7
Phase of economic cycle (data released in Nov 2015)
Note: Shows phase of economic cycle based on the OECD’s amplitude-adjusted CLIs for Japan, China, India, five major Asian countries (Indonesia, Korea, Malaysia, the Philippines, and Thailand), the US, Canada, Brazil, Chile, Mexico,
Australia, New Zealand, South Africa, and Europe (European OECD member countries). Based on the latest CLI data, released in May 2016 and data released in Nov 2015.
Source: OECD, Nomura
Phase of economic cycle (data released in May 2016)
・ Phases of US, Europe, and Asia have not changed compared with 6 month ago
・ There are changes in resource-supplying countries and emerging countries

Calculation methodology of topic nuance in FOMC minutes
based on Jegadeesh and Wu (2015)
8
Calculation methodology of topic tone in FOMC minutes
Source: Nomura
(c) Step3: Text mining
Calculate topic nuance on document level (b) Step2: Machine learning
Topic mixture for each paragraphs
Paragraph 1(p=1)
Paragraph 2(p=2)
Paragraph 3(p=3)
Paragraph P(p=P)
・
・
・
Growth
Inflation
Growth
Policy
Inflation
Financial markets
Policy
Financial markets
4. Score for "policy" topic
3. Score for "growth" topic
2. Score for "inflation" topic
1. Score for "financial markets" topic
(a) Lists of FOMC meeting participants' names
(b) Briefings on specific open market operations
(c) FRB Staff review of the financial/economic situation and outlook
(d) FOMC participants' views on current conditions and the economic outlook
(e) Committee Policy Action
(a) Step1: Web-crawling & scraping
Break FOMC minutes into paragraphs

Time series of the proportion of each topic in FOMC meeting minutes
Proportion of “inflation” is increasing recently and
proportion of “financial markets” is decreasing
9
Note: We used FOMC meeting minutes between 1991 and April 2016 (total 202 meeting minutes). We calculated topic proportions based on posterior topic mixture ( ) for each paragraph estimated by LDA and plotted time series.
Horizontal axis is announcement date of FOMC meeting minutes (not an event date of FOMC meeting) and vertical axis is the proportion of each topic in FOMC meeting minutes. Shaded bars indicate timeframes when MSCI
World index was in down phase.
Source: Nomura
0.0
10.0
20.0
30.0
40.0
50.0
60.0
70.0
80.0
19
91
19
92
19
93
19
94
19
95
19
96
19
97
19
98
19
99
20
00
20
01
20
02
20
03
20
04
20
05
20
06
20
07
20
08
20
09
20
10
20
11
20
12
20
13
20
14
20
15
(%) FOMC topic proportions over time
Financial markets
Inflation
Growth
Policy
Shaded bars indicate timeframes when MSCI World index was in down phase

Time series of nuance for each topic in FOMC minutes (positive - negative)
In fact, many topics were toned-down
in the latest FOMC minutes (released on 18 May 2016)
Note: We used FOMC meeting minutes between 1991 and April 2016 (total 202 meeting minutes). We calculated nuance for each topic t(t=1,2,…,4) on document level (Score: Pp ), and showed time
series of difference between a frequency of positive words and negative words. Horizontal axis is announcement date of FOMC meeting minutes (not an event date of FOMC meeting) and vertical axis is the nuance for each
topic in FOMC minutes (positive - negative). Shaded bars indicate timeframes when MSCI World index was in down phase.
Source: Nomura 10
-4.0
-3.0
-2.0
-1.0
0.0
1.0
2.0
3.0
19
911
2
19
921
2
19
931
2
19
941
2
19
951
2
19
961
2
19
971
2
19
981
2
19
991
2
20
001
2
20
011
2
20
021
2
20
031
2
20
041
2
20
051
2
20
061
2
20
071
2
20
081
2
20
091
2
20
101
2
20
111
2
20
121
2
20
131
2
20
141
2
20
151
2
(σ) Time series of sentiment (1) by FOMC topics
financial markets
Inflation
Growth
Policy
Shaded bars indicate timeframes when MSCI World index was in down phase
Only tone on
policy is flat

-4.0
-3.0
-2.0
-1.0
0.0
1.0
2.0
3.0
4.0
19
911
2
19
921
2
19
931
2
19
941
2
19
951
2
19
961
2
19
971
2
19
981
2
19
991
2
20
001
2
20
011
2
20
021
2
20
031
2
20
041
2
20
051
2
20
061
2
20
071
2
20
081
2
20
091
2
20
101
2
20
111
2
20
121
2
20
131
2
20
141
2
20
151
2
(σ) Time series of sentiment (2) by FOMC topics
Financial markets
Inflation
Growth
Policy
Shaded bars indicate timeframes when MSCI World index was in down phase
Time series of frequency of uncertainty-related words
In fact, uncertainty level is increasing in many topics
in the latest FOMC minutes (released on 18 May 2016)
Note: We used FOMC meeting minutes between 1991 and April 2016 (total 202 meeting minutes). We calculated nuance for each topic t(t=1,2,…,4) on document level (Score: Pp ), and showed time
series a frequency of uncertainty-related words. Horizontal axis is announcement date of FOMC meeting minutes (not an event date of FOMC meeting) and vertical axis is the frequency of uncertainty-related words in FOMC
meeting minutes. Shaded bars indicate timeframes when MSCI World index was in down phase.
Source: Nomura 11

Example of paragraphs categorized into “policy” topic in FOMC minutes of April 2016
Example of paragraphs categorized into “policy” topic
in the latest FOMC minutes (released on 18 May 2016)
12 Source: FOMC, Nomura
No
"Policy" topic
proportion in each
paragraph
Score
(Contribution for score of
"policy" topic)
Paragraphs
1 57.30% 0.71%
Some participants saw limited costs to maintaining a patient posture at this meeting but noted the risks--including potential
risks to financial stability--of waiting too long to resume the process of removing policy accommodation, especially given
the lags with which monetary policy affects the economy. A couple of partic ipants were concerned that further
postponement of action to raise the federal funds rate might confuse the public about the economic
considerations that influence the Committees policy decisions and potentially erode the Committees
credibility .
2 20.32% 0.58%
Consistent with its statutory mandate, the Committee seeks to foster maximum employment and price stability. The
Committee currently expects that, with gradual adjustments in the stance of monetary policy, economic
activ ity will expand at a moderate pace and labor market indicators will continue to strengthen. Inflation is
expected to remain low in the near term, in part because of earlier declines in energy prices, but to rise to 2 percent over
the medium term as the transitory effects of declines in energy and import prices dissipate and the labor market
strengthens further. The Committee continues to c losely monitor inflation indicators and global economic and
financial developments.
3 49.32% 0.22%
Participants agreed that their ongoing assessments of the data and other incoming information, as well as the implications
for the outlook, would determine the timing and pace of future adjustments to the stance of monetary policy. Most
participants judged that if incoming data were consistent with economic growth picking up in the second quarter, labor
market conditions continuing to strengthen, and inflation making progress toward the Committees 2 percent objective,
then it likely would be appropriate for the Committee to increase the target range for the federal funds rate
in June. Participants expressed a range of views about the likelihood that incoming information would make it appropriate
to adjust the stance of policy at the time of the next meeting. Several partic ipants were concerned that the
incoming information might not provide suffic iently c lear s ignals to determine by mid-June whether an
increase in the target range for the federal funds rate would be warranted . Some partic ipants expressed
more confidence that incoming data would prove broadly consistent with economic conditions that would
make an increase in the target range in June appropriate. Some participants were concerned that market
participants may not have properly assessed the likelihood of an increase in the target range at the June meeting, and
they emphasized the importance of communicating clearly over the intermeeting period how the Committee intends to
respond to economic and financial developments.

Predictive power of FOMC minutes for bond risk premium
Tones by topics in the latest minutes suggest a fall of bond
risk premium - “bond-like stocks” outperforming
13
Note: Explained variable is a change in bond risk premium in following month and explanation variable is
a change in score for each document (𝑡 2 ) (comparison
between the most recent meeting minutes and previous meeting minutes). For explained variable,
we use (a) US government bond risk premium and (b) average of bond risk premiums (US
government bond, German government bonds and JGB). Sample period was from January 2013
through 13 May 2016.
Source: Nomura
(a) A dependent variable: US government bond risk premium
(b) A dependent variable: average of bond risk premium
No Independent variables Coefficient t-value
1 Financial markets 7.22 1.40
2 Inflation 15.06 2.05
3 Growth
Investment 23.80 2.02
Foreign trade 0.30 0.04
Consumption/employment 21.31 2.55
4 Policy -10.92 -0.46
No Independent variables Coefficient t-value
1 Financial markets 11.19 1.41
2 Inflation 15.24 1.32
3 Growth
Investment 13.88 0.74
Foreign trade 1.87 0.16
Consumption/employment 27.71 2.12
4 Policy 2.24 0.06
・ No improvement in tones of topics about “inflation” and “growth” will be positive for
“bond-like stocks”
Improvement in tones of topics about “inflation” and
“growth” contributes for increase in future bond risk
premium
There is little relationship between bond risk premium
and improvement in tones of topic about “policy”

Government bonds, 12.8%
Corporate bonds, 20.4%
Local bonds, 0.5%
Mortgage, 3.6%
Equities, 49.2%
Prifered equities,
0.6% Cash and others, 12.8%
Average allocation ratios of balanced funds focused on income gain
(As of Nov 2015)
0
500,000
1,000,000
1,500,000
2,000,000
2,500,000
3,000,000
3,500,000
4,000,000
4,500,000
20
090
9
20
091
2
20
100
3
20
100
6
20
100
9
20
101
2
20
110
3
20
110
6
20
110
9
20
111
2
20
120
3
20
120
6
20
120
9
20
121
2
20
130
3
20
130
6
20
130
9
20
131
2
20
140
3
20
140
6
20
140
9
20
141
2
20
150
3
20
150
6
20
150
9
20
151
2
20
160
3
(mn units) Adjusted no. of units in global bond funds which are able to invest in equities
Q1 Q2 Q3 Q4
2014 201520132012
Q1 Q2 Q3 Q4Q1 Q2 Q3 Q4Q1 Q2 Q3 Q4Q1 Q2 Q3 Q4Q1 Q2 Q3 Q4Q4
20112010
20 May 2016AUM: $2.1trnUnits: 4.2trn
20 May 2016AUM: $2.9trnUnits: 2.7trn
(b) Balanced funds focused on income gain
(a) Global income & credit funds
Q1 Q2
2016
Adjusted no. of units in global income and credit funds
Global bond funds continue to support “bond-like stocks”
Note: We looked at the adjusted number of units (standardized by equalizing initial net assets per unit at each fund) in global income and credit funds and in balanced funds that focus on income. For global income and credit
funds and balanced funds that focus on income, we used funds coming under the Bloomberg asset class categories of fixed income and mixed allocation respectively and that also had equity weightings of more than 0%
and AUM of at least $500,000 as of October 2015. Data are for end-Sep 2009 through 20 May 2016. Allocation ratio is based on average of whole sample (excluding leveraged funds).
Source: Nomura 14
Average allocation ratio
(b) Balanced funds focused on income gains
Government bonds, 21.1%
Corporate bonds, 51.8%
Local bonds, 1.1%
Mortgage, 6.6%
Equities, 7.1%
Prifered equities,
1.2% Cash and others, 11.2%
Average allocation ratios of global income and credit funds
(As of Nov 2015)
(a) Global income & credit funds
8.7% (As of May 2016)
50.0% (As of May 2016)
(As of Nov 2015)

Stocks overcrowded by smart beta funds have risk characteristics that are similar to bond-like stocks
In Japan, smart beta funds are focusing
their investment on “bond-like stocks”
Note: Shows factor exposure for the Japanese stocks held by balanced funds that focus on
income (the 14 funds for which we were able to confirm that they come under this
category of fund, according to Bloomberg, and have holdings in Japanese equities) and a
composite smart beta portfolio made up of the five types of smart beta indices calculated
by index providers. We calculated the average exposure to each factor on a weighted-
average basis, based on active weights relative to the TOPIX for each portfolio. We
normalized exposure to each factor so that the market cap-weighted average was 0 and
the standard deviation was 1 at the beginning of each month (with maximum and
minimum of ±3σ). Data as of end-October 2015.
Source: Nomura 15
-0.6 -0.4 -0.2 0 0.2 0.4 0.6
Est E/P
B/P
TS-normalized E/P
TS-normalized B/P
EstDvdYield
ROE stability
Est ROE
Est net margin
Recurring profit growth rate
Total accrual
default prob
Barra fundamental beta
60-day volatility
1-Mo ret
3-Mo ret
6-Mo ret
12-Mo ret
Factor exposures
Stocks held by balanced funds focused on income gain Average factor index
→ (high)(low) ←
0.68
Over valued
High quality
Low-risk
High yield

Stocks with high degree of herding by smart beta portfolio
and “bond-like stocks”
16
Note: Our universe was TOPIX 500 constituent stocks. We defined stocks overcrowded by smart beta funds (1) as the stocks in the top 10% of the universe in terms of their average active weight in the replicating smart beta portfolios
used by domestic public pension funds. We defined stocks overcrowded by smart beta funds (2) as the stocks in the top 10% of the universe in terms of their average active weight in multiple smart beta indices calculated by index
providers. We defined bond-like stocks as the stocks with the lowest risk and the highest dividends in the universe. Figure shows cumulative daily returns on equally weighted portfolios for each group. We did not take transaction
costs into account. Analysis is based on past share price performance and does not guarantee future performance. Sample period was Jan 2013 through 31 May 2016.
Source: Nomura
In Japan, performance of stocks with high degree of herding by smart beta portfolio is correlated with that of
bond-like stocks
Performance of stocks with high degree of herding by smart beta portfolio and bond-like stocks
-20
-15
-10
-5
0
5
10
15
20
25
20
121
2
20
130
3
20
130
6
20
130
9
20
131
2
20
140
3
20
140
6
20
140
9
20
141
2
20
150
3
20
150
6
20
150
9
20
151
2
20
160
3
(End-Dec 2012=0%) Cumulative return
Bond-like stocks
Q1 Q2 Q3 Q4
2014 20152013
Q1 Q2 Q3 Q4 Q1 Q2 Q3 Q4 Q1
Stocks overcrowded by smart beta funds (1)
(Replicating smart beta portfolios used by public pension funds)
Stocks overcrowded by smart beta funds (2)
(Smart beta indices calculated by index providers)
2016
Q2

Change in style of stocks with bullish bias on the part of fund managers (overweight and little dispersion of their views)
Style of Japanese active funds is also close to
“bond-like stocks”
17
-0.08 -0.06 -0.04 -0.02 0 0.02 0.04 0.06 0.08
Est E/P
B/P
TS-normalized E/P
TS-normalized B/P
EstDvdYield
ROE stability
Est ROE
Est net margin
Recurring profit growth rate
Total accrual
default prob
Barra fundamental beta
60-day volatility
1-Mo ret
3-Mo ret
6-Mo ret
12-Mo ret
Change in factor exposures
Change in factor exposure (May 2016 ← Nov 2015)
→ (Higher)(lower) ←
Shift to high quality
Shift to low-risk
Exposures on expensive stocksincreased
Note: We divided our universe of TSE-1 stocks into five groups based on our active fund bias factor at the beginning of each month. We then calculated the factor exposure for the group of stocks with the highest factor values (the
bullish bias group). We calculated average exposure to each factor on a weighted-average basis, based on TOPIX weightings. We normalized exposure to each factor so that the market cap-weighted average was 0 and the
standard deviation was 1 at the beginning of each month (with maximum and minimum of ±3σ). Shows difference between data as of the beginning of May 2016 and the beginning of November 2015.
Source: Nomura

1.5
2.0
2.5
3.0
3.5
4.0
4.5
-25
-20
-15
-10
-5
0
5
10
15
20
020
1
20
030
1
20
040
1
20
050
1
20
060
1
20
070
1
20
080
1
20
090
1
20
100
1
20
110
1
20
120
1
20
130
1
20
140
1
20
150
1
20
160
1
Performance based on active weight in active funds (lhs)
Dispersion: average for both overweight and underweight stocks (rhs)
(%) (%)
?
Relationship between portfolio dispersion and fund performance
Revival of Japanese active funds without clear
environmental improvement… Just like a game of chicken
Note: The universe is TSE-1 stocks and the sample period is Jan 2002 through 31 May 2016. We divided the universe into five groups based on each stock’s average active weight in active funds at the beginning of each
month. We then calculated cumulative monthly returns on a strategy of combining equally weighted long positions in the group of stocks with the highest average active weights (overweight stocks) and equally weighted
short positions on the group of stocks with the lowest average active weights (underweight stocks). We did not take trading costs into account. Analysis is based on historical share prices and does not guarantee future
performance. To calculate portfolio dispersion, we selected from our universe of TSE-1 stocks the top 20% and bottom 20% of stocks in terms of average active weight in active funds (ie, the stocks in which active funds
were most overweight and underweight respectively). We then calculated the standard deviation of the active weights for each stock in each group and the average for all stocks. We define portfolio dispersion as the
average of the values for the two groups.
Source: Nomura 18

Strategies to avoid herding by “smart beta” and
“active funds” in Japan equities
19
Note: Our universe is TOPIX 500 constituents. Performance of smart beta (average replicated portfolios) is calculated using average weight in each replicated portfolio as weighting. Performance of smart beta avoiding stocks with high
degree of herding by smart beta and active funds is also using average weight in replicated portfolios, but we put weight of 0% for stocks with high average active weight in replicated smart beta portfolios and stocks with high active
funds ownership ratios. Figure shows cumulative return relative to TOPIX. We did not take transaction costs into account. Analysis is based on historical share prices and does not guarantee future performance. Sample period was
Jan 2006 through 31 May 2016.
Source: Nomura
Smart beta avoiding overcrowded stocks might be effective when concentrated positions unwind
Performance of smart beta including and avoiding stocks with high degree of herding by smart beta and active funds
0
5
10
15
20
25
30
20
051
2
20
061
2
20
071
2
20
081
2
20
091
2
20
101
2
20
111
2
20
121
2
20
131
2
20
141
2
20
151
2
(End-Dec 2005=0%) Cumulative return (relative to TOPIX)
Smart beta(average of replicated
portfolios)
Smart beta avoiding stocks with high degree of herding by smart beta and active funds

• Cochrane J. H., and M. Piazzesi, 2005, Bond Risk Premia, American Economic Review, 95(1): 138-160.
• Jegadeesh, N., and D. Wu, 2015, Deciphering Fedspeak: The Information Content of FOMC Meetings, AFA 2016 San Francisco
Meeting Paper
• Loughran, T., and B. McDonald, 2011, When is a liability not a liability? textual analysis, dictionaries, and 10-ks, The Journal of
Finance, 66(1):35–65
• Zhiyuan Liu, Yuzhou Zhang, Edward Y. Chang, Maosong Sun, 2011, PLDA+: Parallel Latent Dirichlet Allocation with Data
Placement and Pipeline Processing. ACM Transactions on Intelligent Systems and Technology, special issue on Large Scale
Machine Learning
• “Japanese equity quantitative strategy: 2016 factor outlook for Japanese equities”, 7 December 2015
Appendix : Reference materials
20

Appendix A-1
Analyst Certification
I, Akihiro MURAKAMI, hereby certify (1) that the views expressed in this Research report accurately reflect my personal views about any or all of the subject securities or issuers referred to in this Research
report, (2) no part of my compensation was, is or will be directly or indirectly related to the specific recommendations or views expressed in this Research report and (3) no part of my compensation is tied to
any specific investment banking transactions performed by Nomura Securities International, Inc., Nomura International plc or any other Nomura Group company.
Important Disclosures The lists of issuers that are affiliates or subsidiaries of Nomura Holdings Inc., the parent company of Nomura Securities Co., Ltd., issuers that have officers who concurrently serve as officers of Nomura
Securities Co., Ltd., issuers in which the Nomura Group holds 1% or more of any class of common equity securities and issuers for which Nomura Securities Co., Ltd. has lead managed a public offering of
equity or equity linked securities in the past 12 months are available at http://www.nomuraholdings.com/jp/report/. Please contact the Research Product Management Dept. of Nomura Securities Co., Ltd. for
additional information.
Online availability of research and conflict-of-interest disclosures Nomura research is available on www.nomuranow.com/research, Bloomberg, Capital IQ, Factset, MarkitHub, Reuters and ThomsonOne.
Important disclosures may be read at http://go.nomuranow.com/research/globalresearchportal/pages/disclosures/disclosures.aspx or requested from Nomura Securities International, Inc., on 1-877-865-5752.
If you have any difficulties with the website, please email [email protected] for help.
The analysts responsible for preparing this report have received compensation based upon various factors including the firm's total revenues, a portion of which is generated by Investment Banking activities.
Unless otherwise noted, the non-US analysts listed at the front of this report are not registered/qualified as research analysts under FINRA rules, may not be associated persons of NSI, and may not be
subject to FINRA Rule 2241 restrictions on communications with covered companies, public appearances, and trading securities held by a research analyst account.
Nomura Global Financial Products Inc. (“NGFP”) Nomura Derivative Products Inc. (“NDPI”) and Nomura International plc. (“NIplc”) are registered with the Commodities Futures Trading Commission and the
National Futures Association (NFA) as swap dealers. NGFP, NDPI, and NIplc are generally engaged in the trading of swaps and other derivative products, any of which may be the subject of this report.
Any authors named in this report are research analysts unless otherwise indicated. Industry Specialists identified in some Nomura International plc research reports are employees within the Firm who are
responsible for the sales and trading effort in the sector for which they have coverage. Industry Specialists do not contribute in any manner to the content of research reports in which their names appear.
Distribution of ratings (Global) The distribution of all ratings published by Nomura Global Equity Research is as follows:
49% have been assigned a Buy rating which, for purposes of mandatory disclosures, are classified as a Buy rating; 38% of companies with this rating are investment banking clients of the Nomura Group*.
42% have been assigned a Neutral rating which, for purposes of mandatory disclosures, is classified as a Hold rating; 53% of companies with this rating are investment banking clients of the Nomura Group*.
9% have been assigned a Reduce rating which, for purposes of mandatory disclosures, are classified as a Sell rating; 17% of companies with this rating are investment banking clients of the Nomura Group*.
As at 31 March 2016. *The Nomura Group as defined in the Disclaimer section at the end of this report.
Explanation of Nomura's equity research rating system in Europe, Middle East and Africa, US and Latin America, and Japan and Asia ex-Japan from 21 October 2013 The rating system is a relative system, indicating expected performance against a specific benchmark identified for each individual stock, subject to limited management discretion. An analyst’s target price is
an assessment of the current intrinsic fair value of the stock based on an appropriate valuation methodology determined by the analyst. Valuation methodologies include, but are not limited to, discounted cash
flow analysis, expected return on equity and multiple analysis. Analysts may also indicate expected absolute upside/downside relative to the stated target price, defined as (target price - current price)/current
price.

STOCKS A rating of 'Buy', indicates that the analyst expects the stock to outperform the Benchmark over the next 12 months. A rating of 'Neutral', indicates that the analyst expects the stock to perform in line with the
Benchmark over the next 12 months. A rating of 'Reduce', indicates that the analyst expects the stock to underperform the Benchmark over the next 12 months. A rating of 'Suspended', indicates that the
rating, target price and estimates have been suspended temporarily to comply with applicable regulations and/or firm policies. Securities and/or companies that are labelled as 'Not rated' or shown as 'No
rating' are not in regular research coverage. Investors should not expect continuing or additional information from Nomura relating to such securities and/or companies. Benchmarks are as follows: United
States/Europe/Asia ex-Japan: please see valuation methodologies for explanations of relevant benchmarks for stocks, which can be accessed at:
http://go.nomuranow.com/research/globalresearchportal/pages/disclosures/disclosures.aspx; Global Emerging Markets (ex-Asia): MSCI Emerging Markets ex-Asia, unless otherwise stated in the valuation
methodology; Japan: Russell/Nomura Large Cap.
SECTORS A 'Bullish' stance, indicates that the analyst expects the sector to outperform the Benchmark during the next 12 months. A 'Neutral' stance, indicates that the analyst expects the sector to perform in line with
the Benchmark during the next 12 months. A 'Bearish' stance, indicates that the analyst expects the sector to underperform the Benchmark during the next 12 months. Sectors that are labelled as 'Not rated'
or shown as 'N/A' are not assigned ratings. Benchmarks are as follows: United States: S&P 500; Europe: Dow Jones STOXX 600; Global Emerging Markets (ex-Asia): MSCI Emerging Markets ex-Asia.
Japan/Asia ex-Japan: Sector ratings are not assigned.
Explanation of Nomura's equity research rating system in Japan and Asia ex-Japan prior to 21 October 2013
STOCKS Stock recommendations are based on absolute valuation upside (downside), which is defined as (Target Price - Current Price) / Current Price, subject to limited management discretion. In most cases, the
Target Price will equal the analyst's 12-month intrinsic valuation of the stock, based on an appropriate valuation methodology such as discounted cash flow, multiple analysis, etc. A 'Buy' recommendation
indicates that potential upside is 15% or more. A 'Neutral' recommendation indicates that potential upside is less than 15% or downside is less than 5%. A 'Reduce' recommendation indicates that potential
downside is 5% or more. A rating of 'Suspended' indicates that the rating and target price have been suspended temporarily to comply with applicable regulations and/or firm policies in certain circumstances
including when Nomura is acting in an advisory capacity in a merger or strategic transaction involving the subject company. Securities and/or companies that are labelled as 'Not rated' or shown as 'No rating'
are not in regular research coverage of the Nomura entity identified in the top banner. Investors should not expect continuing or additional information from Nomura relating to such securities and/or
companies.
SECTORS A 'Bullish' rating means most stocks in the sector have (or the weighted average recommendation of the stocks under coverage is) a positive absolute recommendation. A 'Neutral' rating means most stocks
in the sector have (or the weighted average recommendation of the stocks under coverage is) a neutral absolute recommendation. A 'Bearish' rating means most stocks in the sector have (or the weighted
average recommendation of the stocks under coverage is) a negative absolute recommendation.
Target Price A Target Price, if discussed, reflect in part the analyst's estimates for the company's earnings. The achievement of any target price may be impeded by general market and macroeconomic trends, and by
other risks related to the company or the market, and may not occur if the company's earnings differ from estimates.

Disclaimers This document contains material that has been prepared by the Nomura entity identified on page 1 and/or with the sole or joint contributions of one or more Nomura entities whose employees and their
respective affiliations are also specified on page 1 or identified elsewhere in the document. The term "Nomura Group" used herein refers to Nomura Holdings, Inc. or any of its affiliates or subsidiaries and may
refer to one or more Nomura Group companies including: Nomura Securities Co., Ltd. ('NSC') Tokyo, Japan; Nomura International plc ('NIplc'), UK; Nomura Securities International, Inc. ('NSI'), New York, US;
Nomura International (Hong Kong) Ltd. (‘NIHK’), Hong Kong; Nomura Financial Investment (Korea) Co., Ltd. (‘NFIK’), Korea (Information on Nomura analysts registered with the Korea Financial Investment
Association ('KOFIA') can be found on the KOFIA Intranet at http://dis.kofia.or.kr); Nomura Singapore Ltd. (‘NSL’), Singapore (Registration number 197201440E, regulated by the Monetary Authority of
Singapore); Nomura Australia Ltd. (‘NAL’), Australia (ABN 48 003 032 513), regulated by the Australian Securities and Investment Commission ('ASIC') and holder of an Australian financial services licence
number 246412; P.T. Nomura Indonesia (‘PTNI’), Indonesia; Nomura Securities Malaysia Sdn. Bhd. (‘NSM’), Malaysia; NIHK, Taipei Branch (‘NITB’), Taiwan; Nomura Financial Advisory and Securities (India)
Private Limited (‘NFASL’), Mumbai, India (Registered Address: Ceejay House, Level 11, Plot F, Shivsagar Estate, Dr. Annie Besant Road, Worli, Mumbai- 400 018, India; Tel: +91 22 4037 4037, Fax: +91 22
4037 4111; CIN No: U74140MH2007PTC169116, SEBI Registration No. for Stock Broking activities : BSE INB011299030, NSE INB231299034, INF231299034, INE 231299034, MCX: INE261299034; SEBI
Registration No. for Merchant Banking : INM000011419; SEBI Registration No. for Research: INH000001014 and NIplc, Madrid Branch (‘NIplc, Madrid’). ‘CNS Thailand’ next to an analyst’s name on the front
page of a research report indicates that the analyst is employed by Capital Nomura Securities Public Company Limited (‘CNS’) to provide research assistance services to NSL under a Research Assistance
Agreement. ‘NSFSPL’ next to an employee’s name on the front page of a research report indicates that the individual is employed by Nomura Structured Finance Services Private Limited to provide assistance
to certain Nomura entities under inter-company agreements.
THIS MATERIAL IS: (I) FOR YOUR PRIVATE INFORMATION, AND WE ARE NOT SOLICITING ANY ACTION BASED UPON IT; (II) NOT TO BE CONSTRUED AS AN OFFER TO SELL OR A
SOLICITATION OF AN OFFER TO BUY ANY SECURITY IN ANY JURISDICTION WHERE SUCH OFFER OR SOLICITATION WOULD BE ILLEGAL; AND (III) BASED UPON INFORMATION FROM
SOURCES THAT WE CONSIDER RELIABLE, BUT HAS NOT BEEN INDEPENDENTLY VERIFIED BY NOMURA GROUP.
Nomura Group does not warrant or represent that the document is accurate, complete, reliable, fit for any particular purpose or merchantable and does not accept liability for any act (or decision not to act)
resulting from use of this document and related data. To the maximum extent permissible all warranties and other assurances by Nomura group are hereby excluded and Nomura Group shall have no liability
for the use, misuse, or distribution of this information.
Opinions or estimates expressed are current opinions as of the original publication date appearing on this material and the information, including the opinions and estimates contained herein, are subject to
change without notice. Nomura Group is under no duty to update this document. Any comments or statements made herein are those of the author(s) and may differ from views held by other parties within
Nomura Group. Clients should consider whether any advice or recommendation in this report is suitable for their particular circumstances and, if appropriate, seek professional advice, including tax advice.
Nomura Group does not provide tax advice.
Nomura Group, and/or its officers, directors and employees, may, to the extent permitted by applicable law and/or regulation, deal as principal, agent, or otherwise, or have long or short positions in, or buy or
sell, the securities, commodities or instruments, or options or other derivative instruments based thereon, of issuers or securities mentioned herein. Nomura Group companies may also act as market maker or
liquidity provider (within the meaning of applicable regulations in the UK) in the financial instruments of the issuer. Where the activity of market maker is carried out in accordance with the definition given to it
by specific laws and regulations of the US or other jurisdictions, this will be separately disclosed within the specific issuer disclosures.
This document may contain information obtained from third parties, including ratings from credit ratings agencies such as Standard & Poor’s. Reproduction and distribution of third-party content in any form is
prohibited except with the prior written permission of the related third-party. Third-party content providers do not guarantee the accuracy, completeness, timeliness or availability of any information, including
ratings, and are not responsible for any errors or omissions (negligent or otherwise), regardless of the cause, or for the results obtained from the use of such content. Third-party content providers give no
express or implied warranties, including, but not limited to, any warranties of merchantability or fitness for a particular purpose or use. Third-party content providers shall not be liable for any direct, indirect,
incidental, exemplary, compensatory, punitive, special or consequential damages, costs, expenses, legal fees, or losses (including lost income or profits and opportunity costs) in connection with any use of
their content, including ratings. Credit ratings are statements of opinions and are not statements of fact or recommendations to purchase hold or sell securities. They do not address the suitability of securities
or the suitability of securities for investment purposes, and should not be relied on as investment advice.
Any MSCI sourced information in this document is the exclusive property of MSCI Inc. (‘MSCI’). Without prior written permission of MSCI, this information and any other MSCI intellectual property may not be
reproduced, re-disseminated or used to create any financial products, including any indices. This information is provided on an "as is" basis. The user assumes the entire risk of any use made of this
information. MSCI, its affiliates and any third party involved in, or related to, computing or compiling the information hereby expressly disclaim all warranties of originality, accuracy, completeness,
merchantability or fitness for a particular purpose with respect to any of this information. Without limiting any of the foregoing, in no event shall MSCI, any of its affiliates or any third party involved in, or related
to, computing or compiling the information have any liability for any damages of any kind. MSCI and the MSCI indexes are services marks of MSCI and its affiliates.

The intellectual property right and any other rights, in Russell/Nomura Japan Equity Index belong to Nomura Securities Co., Ltd. ("Nomura") and Frank Russell Company ("Russell"). Nomura and Russell do
not guarantee accuracy, completeness, reliability, usefulness, marketability, merchantability or fitness of the Index, and do not account for business activities or services that any index user and/or its affiliates
undertakes with the use of the Index.
Investors should consider this document as only a single factor in making their investment decision and, as such, the report should not be viewed as identifying or suggesting all risks, direct or indirect, that
may be associated with any investment decision. Nomura Group produces a number of different types of research product including, among others, fundamental analysis and quantitative analysis;
recommendations contained in one type of research product may differ from recommendations contained in other types of research product, whether as a result of differing time horizons, methodologies or
otherwise. Nomura Group publishes research product in a number of different ways including the posting of product on Nomura Group portals and/or distribution directly to clients. Different groups of clients
may receive different products and services from the research department depending on their individual requirements.
Figures presented herein may refer to past performance or simulations based on past performance which are not reliable indicators of future performance. Where the information contains an indication of
future performance, such forecasts may not be a reliable indicator of future performance. Moreover, simulations are based on models and simplifying assumptions which may oversimplify and not reflect the
future distribution of returns.
Certain securities are subject to fluctuations in exchange rates that could have an adverse effect on the value or price of, or income derived from, the investment.
The securities described herein may not have been registered under the US Securities Act of 1933 (the ‘1933 Act’), and, in such case, may not be offered or sold in the US or to US persons unless they have
been registered under the 1933 Act, or except in compliance with an exemption from the registration requirements of the 1933 Act. Unless governing law permits otherwise, any transaction should be executed
via a Nomura entity in your home jurisdiction.
This document has been approved for distribution in the UK and European Economic Area as investment research by NIplc. NIplc is authorised by the Prudential Regulation Authority and regulated by the
Financial Conduct Authority and the Prudential Regulation Authority. NIplc is a member of the London Stock Exchange. This document does not constitute a personal recommendation within the meaning of
applicable regulations in the UK, or take into account the particular investment objectives, financial situations, or needs of individual investors. This document is intended only for investors who are 'eligible
counterparties' or 'professional clients' for the purposes of applicable regulations in the UK, and may not, therefore, be redistributed to persons who are 'retail clients' for such purposes. This document has
been approved by NIHK, which is regulated by the Hong Kong Securities and Futures Commission, for distribution in Hong Kong by NIHK. This document has been approved for distribution in Australia by
NAL, which is authorized and regulated in Australia by the ASIC. This document has also been approved for distribution in Malaysia by NSM. In Singapore, this document has been distributed by NSL. NSL
accepts legal responsibility for the content of this document, where it concerns securities, futures and foreign exchange, issued by their foreign affiliates in respect of recipients who are not accredited, expert
or institutional investors as defined by the Securities and Futures Act (Chapter 289). Recipients of this document in Singapore should contact NSL in respect of matters arising from, or in connection with, this
document. Unless prohibited by the provisions of Regulation S of the 1933 Act, this material is distributed in the US, by NSI, a US-registered broker-dealer, which accepts responsibility for its contents in
accordance with the provisions of Rule 15a-6, under the US Securities Exchange Act of 1934. The entity that prepared this document permits its separately operated affiliates within the Nomura Group to
make copies of such documents available to their clients.
This document has not been approved for distribution to persons other than ‘Authorised Persons’, ‘Exempt Persons’ or ‘Institutions’ (as defined by the Capital Markets Authority) in the Kingdom of Saudi Arabia
(‘Saudi Arabia’) or 'professional clients' (as defined by the Dubai Financial Services Authority) in the United Arab Emirates (‘UAE’) or a ‘Market Counterparty’ or ‘Business Customers’ (as defined by the Qatar
Financial Centre Regulatory Authority) in the State of Qatar (‘Qatar’) by Nomura Saudi Arabia, NIplc or any other member of Nomura Group, as the case may be. Neither this document nor any copy thereof
may be taken or transmitted or distributed, directly or indirectly, by any person other than those authorised to do so into Saudi Arabia or in the UAE or in Qatar or to any person other than ‘Authorised Persons’,
‘Exempt Persons’ or ‘Institutions’ located in Saudi Arabia or 'professional clients' in the UAE or a ‘Market Counterparty’ or ‘Business Customers’ in Qatar . By accepting to receive this document, you represent
that you are not located in Saudi Arabia or that you are an ‘Authorised Person’, an ‘Exempt Person’ or an ‘Institution’ in Saudi Arabia or that you are a 'professional client' in the UAE or a ‘Market Counterparty’
or ‘Business Customers’ in Qatar and agree to comply with these restrictions. Any failure to comply with these restrictions may constitute a violation of the laws of the UAE or Saudi Arabia or Qatar.
NO PART OF THIS MATERIAL MAY BE (I) COPIED, PHOTOCOPIED, OR DUPLICATED IN ANY FORM, BY ANY MEANS; OR (II) REDISTRIBUTED WITHOUT THE PRIOR WRITTEN CONSENT OF A
MEMBER OF NOMURA GROUP. If this document has been distributed by electronic transmission, such as e-mail, then such transmission cannot be guaranteed to be secure or error-free as information could
be intercepted, corrupted, lost, destroyed, arrive late or incomplete, or contain viruses. The sender therefore does not accept liability for any errors or omissions in the contents of this document, which may
arise as a result of electronic transmission. If verification is required, please request a hard-copy version.
------

Disclaimers required in Japan Credit ratings in the text that are marked with an asterisk (*) are issued by a rating agency not registered under Japan’s Financial Instruments and Exchange Act (“Unregistered Ratings”). For details on
Unregistered Ratings, please contact the Research Product Management Dept. of Nomura Securities Co., Ltd.
Investors in the financial products offered by Nomura Securities may incur fees and commissions specific to those products (for example, transactions involving Japanese equities are subject to a sales
commission of up to 1.404% on a tax-inclusive basis of the transaction amount or a commission of ¥2,808 for transactions of ¥200,000 or less, while transactions involving investment trusts are subject to
various fees, such as commissions at the time of purchase and asset management fees (trust fees), specific to each investment trust). In addition, all products carry the risk of losses owing to price fluctuations
or other factors. Fees and risks vary by product. Please thoroughly read the written materials provided, such as documents delivered before making a contract, listed securities documents, or prospectuses.
------
Transactions involving Japanese equities (including Japanese REITs, Japanese ETFs, and Japanese ETNs) are subject to a sales commission of up to 1.404% of the transaction amount (or a commission of
¥2,808 for transactions of ¥200,000 or less). When Japanese equities are purchased via OTC transactions (including offerings), only the purchase price shall be paid, with no sales commission charged.
However, Nomura Securities may charge a separate fee for OTC transactions, as agreed with the customer. Japanese equities carry the risk of losses owing to price fluctuations. Japanese REITs carry the
risk of losses owing to fluctuations in price and/or earnings of underlying real estate. Japanese ETFs carry the risk of losses owing to fluctuations in the underlying indexes or other benchmarks.
Transactions involving foreign equities are subject to a domestic sales commission of up to 1.026% of the transaction amount (which equals the local transaction amount plus local fees and taxes in the case
of a purchase or the local transaction amount minus local fees and taxes in the case of a sale) (for transaction amounts of ¥750,000 and below, maximum domestic sales commission is ¥7,668). Local fees
and taxes in foreign financial instruments markets vary by country/territory. When foreign equities are purchased via OTC transactions (including offerings), only the purchase price shall be paid, with no sales
commission charged. However, Nomura Securities may charge a separate fee for OTC transactions, as agreed with the customer. Foreign equities carry the risk of losses owing to factors such as price
fluctuations and foreign exchange rate fluctuations.
Margin transactions are subject to a sales commission of up to 1.404% of the transaction amount (or a commission of ¥2,808 for transactions of ¥200,000 or less), as well as management fees and rights
handling fees. In addition, long margin transactions are subject to interest on the purchase amount, while short margin transactions are subject to fees for the lending of the shares borrowed. A margin equal to
at least 30% of the transaction amount and at least ¥300,000 is required. With margin transactions, an amount up to roughly 3.3x the margin may be traded. Margin transactions therefore carry the risk of
losses in excess of the margin owing to share price fluctuations. For details, please thoroughly read the written materials provided, such as listed securities documents or documents delivered before making a
contract.
Transactions involving convertible bonds are subject to a sales commission of up to 1.08% of the transaction amount (or a commission of ¥4,320 if this would be less than ¥4,320). When convertible bonds are
purchased via OTC transactions (including offerings), only the purchase price shall be paid, with no sales commission charged. However, Nomura Securities may charge a separate fee for OTC transactions,
as agreed with the customer. Convertible bonds carry the risk of losses owing to factors such as interest rate fluctuations and price fluctuations in the underlying stock. In addition, convertible bonds
denominated in foreign currencies also carry the risk of losses owing to factors such as foreign exchange rate fluctuations.
When bonds are purchased via public offerings, secondary distributions, or other OTC transactions with Nomura Securities, only the purchase price shall be paid, with no sales commission charged. Bonds
carry the risk of losses, as prices fluctuate in line with changes in market interest rates. Bond prices may also fall below the invested principal as a result of such factors as changes in the management and
financial circumstances of the issuer, or changes in third-party valuations of the bond in question. In addition, foreign currency-denominated bonds also carry the risk of losses owing to factors such as foreign
exchange rate fluctuations.
When Japanese government bonds (JGBs) for individual investors are purchased via public offerings, only the purchase price shall be paid, with no sales commission charged. As a rule, JGBs for individual
investors may not be sold in the first 12 months after issuance. When JGBs for individual investors are sold before maturity, an amount calculated via the following formula will be subtracted from the par value
of the bond plus accrued interest: (1) for 10-year variable rate bonds, an amount equal to the two preceding coupon payments (before tax) x 0.79685 will be used, (2) for 5-year and 3-year fixed rate bonds, an
amount equal to the two preceding coupon payments (before tax) x 0.79685 will be used.
When inflation-indexed JGBs are purchased via public offerings, secondary distributions (uridashi deals), or other OTC transactions with Nomura Securities, only the purchase price shall be paid, with no sales
commission charged. Inflation-indexed JGBs carry the risk of losses, as prices fluctuate in line with changes in market interest rates and fluctuations in the nationwide consumer price index.The notional
principal of inflation-indexed JGBs changes in line with the rate of change in nationwide CPI inflation from the time of its issuance. The amount of the coupon payment is calculated by multiplying the coupon
rate by the notional principal at the time of payment. The maturity value is the amount of the notional principal when the issue becomes due. For JI17 and subsequent issues, the maturity value shall not
undercut the face amount.
Purchases of investment trusts (and sales of some investment trusts) are subject to a purchase or sales fee of up to 5.4% of the transaction amount. Also, a direct cost that may be incurred when selling
investment trusts is a fee of up to 2.0% of the unit price at the time of redemption. Indirect costs that may be incurred during the course of holding investment trusts include, for domestic investment trusts, an
asset management fee (trust fee) of up to 5.4% (annualized basis) of the net assets in trust, as well as fees based on investment performance. Other indirect costs may also be incurred. For foreign
investment trusts, indirect fees may be incurred during the course of holding such as investment company compensation.

Investment trusts invest mainly in securities such as Japanese and foreign equities and bonds, whose prices fluctuate. Investment trust unit prices fluctuate owing to price fluctuations in the underlying assets
and to foreign exchange rate fluctuations. As such, investment trusts carry the risk of losses. Fees and risks vary by investment trust. Maximum applicable fees are subject to change; please thoroughly read
the written materials provided, such as prospectuses or documents delivered before making a contract.
In interest rate swap transactions and USD/JPY basis swap transactions (“interest rate swap transactions, etc.”), only the agreed transaction payments shall be made on the settlement dates. Some interest
rate swap transactions, etc. may require pledging of margin collateral. In some of these cases, transaction payments may exceed the amount of collateral. There shall be no advance notification of required
collateral value or collateral ratios as they vary depending on the transaction. Interest rate swap transactions, etc. carry the risk of losses owing to fluctuations in market prices in the interest rate, currency and
other markets, as well as reference indices. Losses incurred as such may exceed the value of margin collateral, in which case margin calls may be triggered. In the event that both parties agree to enter a
replacement (or termination) transaction, the interest rates received (paid) under the new arrangement may differ from those in the original arrangement, even if terms other than the interest rates are identical
to those in the original transaction. Risks vary by transaction. Please thoroughly read the written materials provided, such as documents delivered before making a contract and disclosure statements.
In OTC transactions of credit default swaps (CDS), no sales commission will be charged. When entering into CDS transactions, the protection buyer will be required to pledge or entrust an agreed amount of
margin collateral. In some of these cases, the transaction payments may exceed the amount of margin collateral. There shall be no advance notification of required collateral value or collateral ratios as they
vary depending on the financial position of the protection buyer. CDS transactions carry the risk of losses owing to changes in the credit position of some or all of the referenced entities, and/or fluctuations of
the interest rate market. The amount the protection buyer receives in the event that the CDS is triggered by a credit event may undercut the total amount of premiums that he/she has paid in the course of the
transaction. Similarly, the amount the protection seller pays in the event of a credit event may exceed the total amount of premiums that he/she has received in the transaction. All other conditions being equal,
the amount of premiums that the protection buyer pays and that received by the protection seller shall differ. In principle, CDS transactions will be limited to financial instruments business operators and
qualified institutional investors.
No account fee will be charged for marketable securities or monies deposited. Transfers of equities to another securities company via the Japan Securities Depository Center are subject to a transfer fee of up
to ¥10,800 per issue transferred depending on volume.
Nomura Securities Co., Ltd. Financial instruments firm registered with the Kanto Local Finance Bureau (registration No. 142)
Member associations: Japan Securities Dealers Association; Japan Investment Advisers Association; The Financial Futures Association of Japan; and Type II Financial Instruments Firms Association.
Nomura Group manages conflicts with respect to the production of research through its compliance policies and procedures (including, but not limited to, Conflicts of Interest, Chinese Wall and Confidentiality
policies) as well as through the maintenance of Chinese walls and employee training.
Additional information is available upon request and disclosure information is available at the Nomura Disclosure web page:
http://go.nomuranow.com/research/globalresearchportal/pages/disclosures/disclosures.aspx
Copyright © 2016 Nomura Securities Co., Ltd. All rights reserved.
Disclosures as of 06-Apr-2016.