jbs s.a financial statements and independent auditors...
TRANSCRIPT

JBS S.AFinancial Statements and Independent auditors´review reportITR - Quarterly InformationAs of March 31, 2009 and 2008
1

INDEPENDENT AUDITORS’ REVIEW REPORT
1.
2.
3.
4.
5.
6. The accompanying financial statements have been translated into English for the convenience of readers outside Brazil.
Ribeirão Preto, May 8th, 2009.
Estefan George HaddadBDO Trevisan Auditores Independentes Partner AccountantCRC 2SP013439/O-5 CRC 1DF008320/O-5 "S" SP
Our review was performed in accordance with specific standards established by IBRACON (Brazilian Institute of IndependentAuditors) together with the Federal Accounting Council, which consisted principally of: a) inquiry of and discussion with themanagers responsible for the accounting, financial and operating areas as to the main criteria adopted in preparing the QuarterlyInformation and b) review of the information and subsequent events that have or may have material effects on the financialsituation and operations of the Company and its controlled companies.
Based on our review, we are not aware of any material changes which should be made to the Quarterly Information referred to inparagraph 1 for it to be in conformity with the standards issued by CVM - Brazilian Securities and Exchange Commissionapplicable to the preparation of Quarterly Information, including CVM Instruction No. 469/08.
To the Board of Directors and Shareholders of JBS S.A.:
We have performed a review of the accompanying individual and consolidated Quarterly Information (ITR) of JBS S.A. (the“Company”) and its controlled companies consisting of the balance sheets as of March 31, 2009, and the related statements ofoperations, cash flows and changes in shareholders’ equity, notes and performance report for the quarter then ended, allexpressed in Brazilian reais and prepared under the responsibility of the Company’s management. The financial statements ofInalca JBS S.p.A , directly controlled company, were reviewed by other independent auditors. Our opinion, insofar as it relates tothe carrying value of the investment in this company and the equity in its earnings, is based on the report of those auditors.
As mentioned in note 2, Brazilian accounting practices were changed during 2008, and the effects of their initial adoption wereonly accounted for by the Company and its controlled companies in the fourth quarter of 2008, and disclosed in the financialstatements as of December 31, 2008. The statements of operations, cash flows, and changes in shareholders’ equity for thequarter ended March 31, 2008, presented along with the current quarter information, were not adjusted for comparative purposespursuant to CVM/SNC/SEP Circular Letter No. 02/2009.
Our review was conducted in order to form an opinion with respect to the financial statements cited in paragraph 1, taken as awhole. The individual (Company) and consolidated value added statements represent information complementary to the financialstatements; they are not required by the accounting practices adopted in Brazil and are provided to enable additional analysis.This complementary information was submitted to the same auditing procedures described in paragraph 2 and, in our opinion, areadequately stated, in all material aspects, in relation to the financial statements for the quarter ended March 31, 2009.
2
JBS S.A.
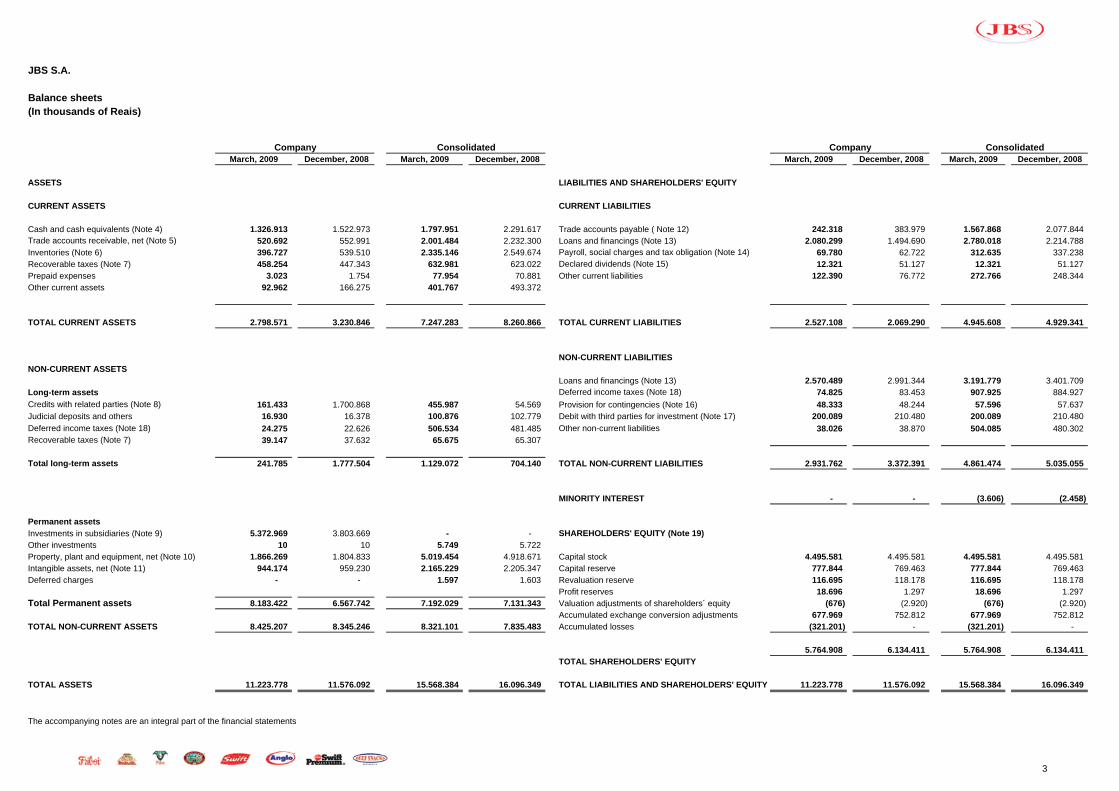
Balance sheets(In thousands of Reais)
March, 2009 December, 2008 March, 2009 December, 2008 March, 2009 December, 2008 March, 2009 December, 2008
ASSETS LIABILITIES AND SHAREHOLDERS' EQUITY
CURRENT ASSETS CURRENT LIABILITIES
Cash and cash equivalents (Note 4) 1.326.913 1.522.973 1.797.951 2.291.617 Trade accounts payable ( Note 12) 242.318 383.979 1.567.868 2.077.844 Trade accounts receivable, net (Note 5) 520.692 552.991 2.001.484 2.232.300 Loans and financings (Note 13) 2.080.299 1.494.690 2.780.018 2.214.788 Inventories (Note 6) 396.727 539.510 2.335.146 2.549.674 Payroll, social charges and tax obligation (Note 14) 69.780 62.722 312.635 337.238 Recoverable taxes (Note 7) 458.254 447.343 632.981 623.022 Declared dividends (Note 15) 12.321 51.127 12.321 51.127 Prepaid expenses 3.023 1.754 77.954 70.881 Other current liabilities 122.390 76.772 272.766 248.344 Other current assets 92.962 166.275 401.767 493.372
TOTAL CURRENT ASSETS 2.798.571 3.230.846 7.247.283 8.260.866 TOTAL CURRENT LIABILITIES 2.527.108 2.069.290 4.945.608 4.929.341
NON-CURRENT LIABILITIESNON-CURRENT ASSETS
Loans and financings (Note 13) 2.570.489 2.991.344 3.191.779 3.401.709 Long-term assets Deferred income taxes (Note 18) 74.825 83.453 907.925 884.927
Credits with related parties (Note 8) 161.433 1.700.868 455.987 54.569 Provision for contingencies (Note 16) 48.333 48.244 57.596 57.637 Judicial deposits and others 16.930 16.378 100.876 102.779 Debit with third parties for investment (Note 17) 200.089 210.480 200.089 210.480
Deferred income taxes (Note 18) 24.275 22.626 506.534 481.485 Other non-current liabilities 38.026 38.870 504.085 480.302 Recoverable taxes (Note 7) 39.147 37.632 65.675 65.307
Total long-term assets 241.785 1.777.504 1.129.072 704.140 TOTAL NON-CURRENT LIABILITIES 2.931.762 3.372.391 4.861.474 5.035.055
MINORITY INTEREST - - (3.606) (2.458)
Permanent assets
Investments in subsidiaries (Note 9) 5.372.969 3.803.669 - - SHAREHOLDERS' EQUITY (Note 19)
Other investments 10 10 5.749 5.722 Property, plant and equipment, net (Note 10) 1.866.269 1.804.833 5.019.454 4.918.671 Capital stock 4.495.581 4.495.581 4.495.581 4.495.581 Intangible assets, net (Note 11) 944.174 959.230 2.165.229 2.205.347 Capital reserve 777.844 769.463 777.844 769.463 Deferred charges - - 1.597 1.603 Revaluation reserve 116.695 118.178 116.695 118.178
Profit reserves 18.696 1.297 18.696 1.297 Total Permanent assets 8.183.422 6.567.742 7.192.029 7.131.343 Valuation adjustments of shareholders´ equity (676) (2.920) (676) (2.920)
Accumulated exchange conversion adjustments 677.969 752.812 677.969 752.812 TOTAL NON-CURRENT ASSETS 8.425.207 8.345.246 8.321.101 7.835.483 Accumulated losses (321.201) - (321.201) -
5.764.908 6.134.411 5.764.908 6.134.411 TOTAL SHAREHOLDERS' EQUITY
TOTAL ASSETS 11.223.778 11.576.092 15.568.384 16.096.349 TOTAL LIABILITIES AND SHAREHOLDERS' EQUITY 11.223.778 11.576.092 15.568.384 16.096.349
The accompanying notes are an integral part of the financial statements
Company CompanyConsolidated Consolidated
3

JBS S.A.
Statements of income for the three months period ended March 31, 2009 and 2008(In thousands of Reais)
2009 2008 2009 2008
GROSS OPERATING REVENUESales of products:Domestic Sales 871.471 523.540 7.398.403 3.949.104 Foreign Sales 417.719 581.131 2.106.170 2.056.417
1.289.190 1.104.671 9.504.573 6.005.521
SALES DEDUCTIONS
Returns and discounts (68.179) (33.450) (117.702) (72.100) Sales taxes (96.608) (62.184) (118.944) (74.356)
(164.787) (95.634) (236.646) (146.456)
NET SALE REVENUE 1.124.403 1.009.037 9.267.927 5.859.065
Cost of goods sold (911.199) (764.336) (8.509.805) (5.348.839)
GROSS INCOME 213.204 244.701 758.122 510.226
OPERATING INCOME (EXPENSE)
General and administrative expenses (40.651) (20.602) (215.275) (79.822) Selling expenses (114.355) (100.159) (414.463) (305.146) Financial income (expense), net (Note 20) (407.606) (4.600) (446.582) (76.802) Equity in subsidiaries (Note 9) 16.015 (78.218) - - Goodwill amortization (Note 11) - (44.313) - (44.313) Other (expense) income, net 432 438 (618) (524)
(546.165) (247.454) (1.076.938) (506.607)
LOSS BEFORE TAXES (332.961) (2.753) (318.816) 3.619
Current income taxes 764 (4.141) (3.129) (15.590) Deferred income taxes 9.513 278 (1.674) 4.949
10.277 (3.863) (4.803) (10.641)
LOSS BEFORE MINORITY INTEREST (322.684) (6.616) (323.619) (7.022)
Minority interest (expense) income - - 935 406
LOSS OF THE PERIOD (322.684) (6.616) (322.684) (6.616)
LOSS PER THOUSAND SHARES (230,33) (5,07)
Statement of EBITDA (Earnings before income taxes,interest, depreciation and amortization)
Income (loss) before taxes (332.961) (2.753) (318.816) 3.619 Financial income (expense), net (Note 20) 407.606 4.600 446.582 76.802 Depreciation and amortization 21.871 15.391 83.776 51.007 Equity in subsidiaries (Note 9) (16.015) 78.218 - - Goodwill Amortization (Note 11) - 44.313 - 44.313
AMOUNT OF EBITDA 80.501 139.769 211.542 175.741
The accompanying notes are an integral part of the financial statements
Company Consolidated
4

JBS S.A.
Statement of changes in shareholders´ equity for the three months period ended March 31, 2009(In thousands of Reais)
Capital reserve
Valuation adjustments of
Accumulated exchange
Capital Revaluation For
stock goodwill reserve Legal expansion Total
BALANCE AS OF DECEMBER 31, 2008 4.495.581 769.463 118.178 1.297 - (2.920) 752.812 - 6.134.411
Adjustment of net income destination from previous year (note 15) - 21.407 - - 17.399 - - - 38.806 Realization of revaluation reserve - - (1.483) - - - - 1.483 - Shares acquisition - (13.026) - - - - - - (13.026) Valuation adjustments in subsidiaries shareholders´ equity - - - - - 2.244 - - 2.244 Accumulated exchange conversion adjustments in subsidiaries shareholders´ equity - - - - - - (39.402) - (39.402) Foreign investiments exchange rate variations - - - - - - (35.441) - (35.441) Loss of the period - - - - - - - (322.684) (322.684)
BALANCE AS OF MARCH 31, 2009 4.495.581 777.844 116.695 1.297 17.399 (676) 677.969 (321.201) 5.764.908
conversion adjustments
Accumulated losses
Profit Reservesshareholders´
equity
5

JBS S.A.
Statements of cash flows for the three months period ended March 31, 2009 and 2008(In thousands of Reais)
2009 2008 2009 2008Cash flow from operating activities. Loss of the period (322.684) (6.616) (322.684) (6.616) Adjustments to reconcile net income (loss) to cash provided. Depreciation and amortization 21.871 15.391 83.776 51.007 . Allowance for doubtful accounts 751 818 3.696 1.232 . Goodwill amortization - 44.313 - 44.313 . Minority interest - - (935) (406) . Equity in subsidiaries (16.015) 78.218 - - . Write-off of fixed assets 498 505 1.060 505 . Deferred income taxes (9.513) (278) 1.674 (4.949) . Current and non-current financial charges 140.365 24.242 376.897 89.111 . Provision for contingencies 89 - 203 - . Adjustment to present value of assets and liabilities 310 - 310 -
(184.328) 156.593 143.997 174.197 Variation in operating assets and liabilities. Decrease (increase) in trade accounts receivable 10.618 (136.658) 170.598 (219.575) . Decrease (increase) in inventories 142.783 (48.679) 169.009 (411.235) . Decrease (increase) in recoverable taxes (12.132) (10.600) (16.719) (30.286) . Decrease (increase) in other current and non-current assets 71.492 16.649 36.034 (20.444) . Decrease (increase) in credits with related parties (34.680) 43.258 (417.624) (66) . Increase (decrease) in trade accounts payable (144.962) (139.123) (479.891) (103.986) . Increase (decrease) in other current and non-current liabilities 50.784 214.200 81.048 366.019 . Valuation adjustments of shareholders´ equity - - (82.990) -
Net cash provided by (used in) operating activities (100.425) 95.640 (396.538) (245.376)
Cash flow used in investing activities. Additions to property, plant and equipment and intangible assets (118.805) (115.566) (260.790) (747.421) . Increase in investments (25.121) (1.423.158) (309) (301.520)
Net cash used in investing activities (143.926) (1.538.724) (261.099) (1.048.941)
Cash flow from financing activities. Loans and financings 981.113 1.597.672 1.320.342 1.997.511 . Payments of loans and financings (919.796) (244.805) (1.130.736) (1.028.972) . Increase in capital stock - 1.730.551 - 1.730.551 . Shares acquisition of own emission (13.026) (102.254) (13.026) (102.254)
Net cash provided by financing activities 48.291 2.981.164 176.580 2.596.836
Effect of exchange rates on Cash and cash equivalents - - (12.609) -
Net increase (decrease) in cash (196.060) 1.538.080 (493.666) 1.302.519 Cash and cash equivalents at the beginning of the period 1.522.973 869.784 2.291.617 1.381.703
Cash and cash equivalents at the end of the period 1.326.913 2.407.864 1.797.951 2.684.222
The accompanying notes are an integral part of the financial statements
ConsolidatedCompany
6
JBS S.A.Notes to the financial statements for the three months period ended March 31, 2009 and 2008(Expressed in thousands of reais)
1
a) Activities in Brazil
b) Activities abroad
SB Holdings, Inc. (SB Holdings) and its subsidiaries, Tupman Thurlow Co., Inc. (Tupman) and Astro Sales International, Inc. (Astro)located in the United States of America sale processed beef products in the North-American market.
Global Beef Trading Sociedade Unipessoal Lda (Global Beef Trading), an indirect wholly-owned subsidiary of the Company, located inIlha da Madeira, Portugal, sells bovine meat, birds and porks products. Global Beef Trading imports the products from Latin America andexports to several countries, in Europe, Africa and Asia.
Jerky Snacks Brands, Inc (Jerky Snacks), an indirect wholly-owned subsidiary of the Company, located in the United States of America,produces and sells meat snacks (Beef Jerky, Smoked Meat Sticks, Kippered Beef Steak, Meat&Cheese, Turkey Jerky and HunterSausage). Jerky Snacks purchases meat from Brazil and in the local market and its sales are mainly in the United States of America.
JBS USA Holdings Inc. (JBS USA) has feedlots and processes, packaging and delivery of fresh, further processed and value-added beefand pork “in natura” products for sale to customers in the United States and international markets. The fresh meat products prepared byJBS USA include refrigerated beef and pork processed to standard industry specifications.
Operating activities
The Company owns and operates slaughterhouses, cold storage and meat processing operations for the production of beef, cannedgoods, fat, animal rations and beef by-products, which are produced in the plants located in the States of São Paulo, Goiás, MatoGrosso, Mato Grosso do Sul, Rondônia, Minas Gerais, Acre and Rio de Janeiro. The Company distributes its products throughdistribution centers located in the State of São Paulo, and a container terminal for export in the city of Santos.
In order to minimize transportation costs, the Company transports cattle to its slaughterhouses and the transportation of its exportproducts.
JBS Argentina S.A. (JBS Argentina), an indirect wholly-owned subsidiary of the Company, operates slaughterhouses and cold storagefacilities for the production of beef, canned goods, fat, animal food and beef by-products, in plants located in the provinces of BuenosAires, Entre Rios, Santa Fé and Córdoba.
JBS Argentina has three subsidiaries: One meat-packing slaughterhouse in Berezategui (Consignaciones Rurales), other can factorylocated in Zavate (Argenvases), both located in the province of Buenos Aires, and one meat-packing slaughterhouse in Cordoba (Col-car).
Mouran Alimentos Ltda.. (Mouran) is a subsidiary which conducts slaughterhouse and cold storage business operations for theproduction of beef, canned goods, fat, animal rations and beef by-products in its facilities located in the State of São Paulo.
The Company has indirect subsidiaries located in England and Egypt, which are responsible for the sales and distribution of theCompany’s products in Europe, Asia, and Africa.
Beef Snacks do Brasil Indústria e Comércio de Alimentos Ltda (Beef Snacks), an indirect subsidiary of the Company is located in SantoAntônio da Posse, State of São Paulo, in operation since August 2007 produces Beef Jerky. Beef Snacks purchases fresh meat in thedomestic market and exports to the United States of America.
JBS Embalagens Metálicas Ltda. (JBS Embalagens) produces metallic cans in its plant located in the State of São Paulo, which arepurchased by the Company.
JBS S.A (the Company) is a listed company in the Novo Mercado segment, which requires the highest level of corporate governance inthe Brazilian market and its shares are traded on the BM&F Bovespa S.A - Stock Exchange, Commodity and Forward. The operations of the Company and its subsidiaries consists of:
The subsidiary JBS Confinamento Ltda. (JBS Confinamento) is located in Castilho, State of São Paulo, renders fattening service ofbovine for slaughter.
7

JBS S.A.Notes to the financial statements for the three months period ended March 31, 2009 and 2008(Expressed in thousands of reais)
2
Company Consolidated Company Consolidated
Loss of the period (6.616) (6.616) 4.676.269 4.676.269
(46.186) 39.004 - - 7.182 - - -
44.313 44.313 44.313 44.313
Net income (loss) as per accounting principles in 2009 (1.307) 76.701 4.720.582 4.720.582
Equity in subsidiaries
In the United States, JBS USA operates eight beef processing facilities, three pork processing facilities, one lamb slaughter facility, onevalue-added facility for pork and eleven feedlot. In Australia, JBS USA operates ten beef and small animals processing facilities and JBSUSA in Australia operates five feedlots that provide grain-fed cattle for its processing operations.
The individual and consolidated financial statements as of the three months period ended March 31, 2009 have been prepared inaccordance with the generally accepted accounting principles in Brazil, that embraces the corporate Brazilian legislation, thePronouncements, Orientations and Interpretations issued by the Brazilian Accounting Pronouncements Committee - CPC and approvedby the Brazilian Securities and Exchange Commission (Comissão de Valores Mobiliários – CVM).
The Company owns 50% of Inalca JBS S.p.A, (Inalca JBS), that is Italy´s leading beef company and one of the main operators in theEuropean processing beef sector. It produces and markets a complete range of fresh and frozen meat, packed under vacuum orportioned in a protective atmosphere, canned meat, ready-to-eat meals, fresh and frozen hamburger, minced meats and, pre-cookedproducts. Inalca JBS owns six facilities in Italy, specialized by production line, and nine foreign facilities in Europe and Africa.
Elaboration and Presentation of financial information
Effects at the profit & loss of the three months period and in the shareholders´ equity as of March 31, 2008
Net income of the year Shareholders´ equity
Exchange variation on foreign investments, net
JBS USA completed in October of 2008 the acquisition of the cattle meat unit of Smithfield group and also the fattening feedlotoperations known as Five Rivers.
The statements of income and cash flows referring to the three months period ended March 31, 2008, presented together with thestatements of the current quarter, were not adjusted for comparison purposes, according to the option of the publishment CVM/SNC/SEPn. 02/2009.
Below are presented the relevant effects in the income statements and shareholder´s equity of the three months period ended on March31, 2008, that would be obtained if were adjusted by the accounting principles in place in the current quarter.
The accounting principles in Brazil were changed during 2008, according to the Law n° 11.638 approved on December 28, 2007, with therespective modifications introduced by the Executive Act n° 449, of December 3, 2008, and the effects of of the initial adoption were onlyrecognized by the Company and its subsidiaries during the fourth quarter of 2008, and published in the financial statements of December31, 2008.
JBS USA divides its business into two segments: Beef, through which it conducts its beef processing business; and pork, through which itconducts its pork processing business.
The integral subsidiary Montana Alimentari S.p.A. (Montana) is one of the leading Italian companies in the production, marketing anddistribution of cured meats, snacks and ready-to-eat meals with over 230 products. Montana owns the well-known brands “Montana” and“IBIS”, and Montana owns four facilities, specialized by type of production and located in the area distinguished by the ProtectedDenomination of Origin (P.D.O.) and Protected Geographic Indication (P.G.I.) brands. Montana is also one of the main operators in theItalian canned meat market and pre-sliced products.
Smithfield, currently known as JBS Packerland, owns four cattle units and one feedlot cattle unit, and Five Rivers, known as JBS FiveRivers, own ten cattle feedlot units.
Investments goodwill amortization
8

JBS S.A.Notes to the financial statements for the three months period ended March 31, 2009 and 2008(Expressed in thousands of reais)
3 Significant accounting policies
a) Profit and loss calculation
The operations results is in conformity with the accounting regime of competence.
b) Accounting estimates
The preparation of financial statements in accordance with generally accepted accounting principles in Brazil requires the Company’smanagement to (i) make estimates and assumptions that affect the reported amounts of assets and liabilities and (ii) disclose (a)contingent assets and liabilities as of the date of the financial statements and (b) the reported amounts of revenue and expenses duringthe reporting period. Actual results could differ from those estimates.
c) Financial instruments
Financial instruments are recognized in the moment that the Company becomes part of the contractual dispositions of the instrument.When a financial asset or liability is initially recognized, it is registered by the fair value, plus transaction costs that are directly attributableto the acquisition or issuance of the financial asset or liability.
In case of financial assets and liabilities classified in the category of fair value through the result, the transaction costs are directlyaccounted in the profit and loss of the year.
Subsequent measurement of the financial instruments happens in each date of the financial statements according to the rulesestablished for each classification of financial assets and liabilities in: (i) assets and liabilities measured to the fair value through theresult, (ii) maintained until the expiration date, (iii) loans and receivables (iv) available for sale.
d) Allowance for doubtful accounts
Allowance for doubtful accounts is computed based on the probable loss, the profile of the customers, overall economic and financialcondition and specific risks relating to the relevant customers. The Company’s management believes that the allowance for doubtfulaccounts is sufficient to cover the exposure to possible losses.
e) Inventories
Inventories are valued based on their cost of acquisition, creation or production, which cost is lower than the market or net realizablevalue.
f) Investments
Investments in subsidiaries are accounted according to the equity method.
Current and long-term assets are accounted for at their realization value including, if applicable, the related income, charges andmonetary variations.
Depreciation is computed pursuant to the straight-line method, using rates described in Note 10, which take into account the useful andeconomic lives of the assets.
h) Intangible assets
The intangible assets are demostrated by the acquisition or formation cost, deducted by the amortization. The intangible assets withindefinite useful life are not amortized.
i) Reduction to recovery amount (Impairment)
The goodwill based on future profitability expectation is not been amortized starting from 2009 according to orientation OCPC 02endorsed by CVM through the publication CVM/SNC/SEP 01/2009.
g) Property, plant and equipment, net
Property, plant and equipment are stated at an amount equivalent to their historical acquisition cost plus the amount resulting from theincrease in the value of these assets as determined by revaluations performed by independent appraisal firms until December 31, 2007.
The items of property, plant and equipment, intangible assets and deferred charges are tested by its recoverability amounts, at leastannually, in case there are indications of loss of value. The goodwill and the intangible assets with indefinite useful life are testedannually independently of whether there is (or not) indication of loss of value.
j) Other Current and Long-term Assets
9

JBS S.A.Notes to the financial statements for the three months period ended March 31, 2009 and 2008(Expressed in thousands of reais)
m) Income Tax and Social Contribution
Current taxes
Deferred taxes
n) Result by share
In order to provide a better understanding of its financial statements the Company has presented, as complemental information, itsconsolidated statements Economic Value Added (EVA) report for the three months period ended March 31, 2009. The objective of thisreport is to demonstrate the wealth generated by the Company, and the distribution of this wealth among the elements that contributed toits generation, such as employees, lenders, shareholders, government and others, as well as the wealth portion not distributed.
p) Adjustments of assets and liabilities to present value.
The financial long term assets and liabilities are adjusted by its present value, and the short term, when the effect is considered relevantin the financial statements. The adjustment to present value is calculated considerating the contractual cash flows and the marketinterest rate.
q) Complemental information
o) Consolidation
l) Contingent assets and liabilities
k) Current Liabilities and non-current Liabilities
Current and non-current liabilities are accounted for at their known or computed amounts, including, if applicable, the related income,charges and monetary variations.
Contingent liabilities are provisioned when the losses are appraised as probable and the involved amounts are measurable with enoughcertainty. The contingent liabilities appraised as possible losses are only published in accompanying notes and the contingent liabilitiesappraised as remote losses are neither acrrued nor discloded.
The subsidiaries companies included in the consolidation are mentioned in the Note 9.
Provisions for income tax and social contribution are based on rates and laws and regulations in force.
The Company records deferred income tax assets and liabilities based on temporary differences between the carrying amounts on theCompany's financial statements and the tax basis of assets and liabilities.
The result by share is calculated based on the outstanding shares on the date of the financial statements.
Contingent assets are recognized only when there are final judments or favorable judicial decisions rendered. Contingent assets withprobable gain are only published in accompanying notes.
With respect to the Company’s investment in JBS Argentina and its subsidiaries and Inalca JBS and its subsidiaries, we have comparedthe generally accepted accounting principles in Argentina and Italy with the corresponding principles in Brazil applied by the Company,and we have noted that there were no material differences.
The accounting practices adopted by Tupman and Astro, both subsidiaries of SB Holdings, located in the United States of America, donot differ significantly from those adopted in Brazil.
All assets and liabilities of JBS S.A. and its subsidiaries and revenues and expenses from transactions between JBS S.A. and itssubsidiaries were eliminated. No inter-company profits were recorded on the consolidated balance sheet of the Company. Accordingly,the shareholders’ equity of JBS S.A. individually is equal to its consolidated shareholders’ equity.
The financial statements of the subsidiaries of JBS S.A. located outside of Brazil were originally prepared using the local currency of thecountry in which they are located. Subsequently, these amounts were converted into Reais using the applicable commercial exchangerates reported by the Central Bank of Brazil on the date of the consolidated balance sheet for assets and liabilities, and the averageexchange rate of the period to revenues and expenses. The gains and losses due to the conversion are recognized directly in theshareholders´ equity in the account of accumulated exchange conversion adjustments.
The accounting practices adopted in the United States of America by JBS USA (US GAAP) are adjusted to Brazilian GAAP, according tothe following differences:
- Finished goods inventories: valued using market price, and are adjusted to production average cost method;- Permanent assets: includes R$ 753,304 related to intangible assets and fixed assets goodwill, calculated according to applicablepurchasing accounting, and it was adjusted reducing the shareholder´s equity.
10
JBS S.A.Notes to the financial statements for the three months period ended March 31, 2009 and 2008(Expressed in thousands of reais)
4
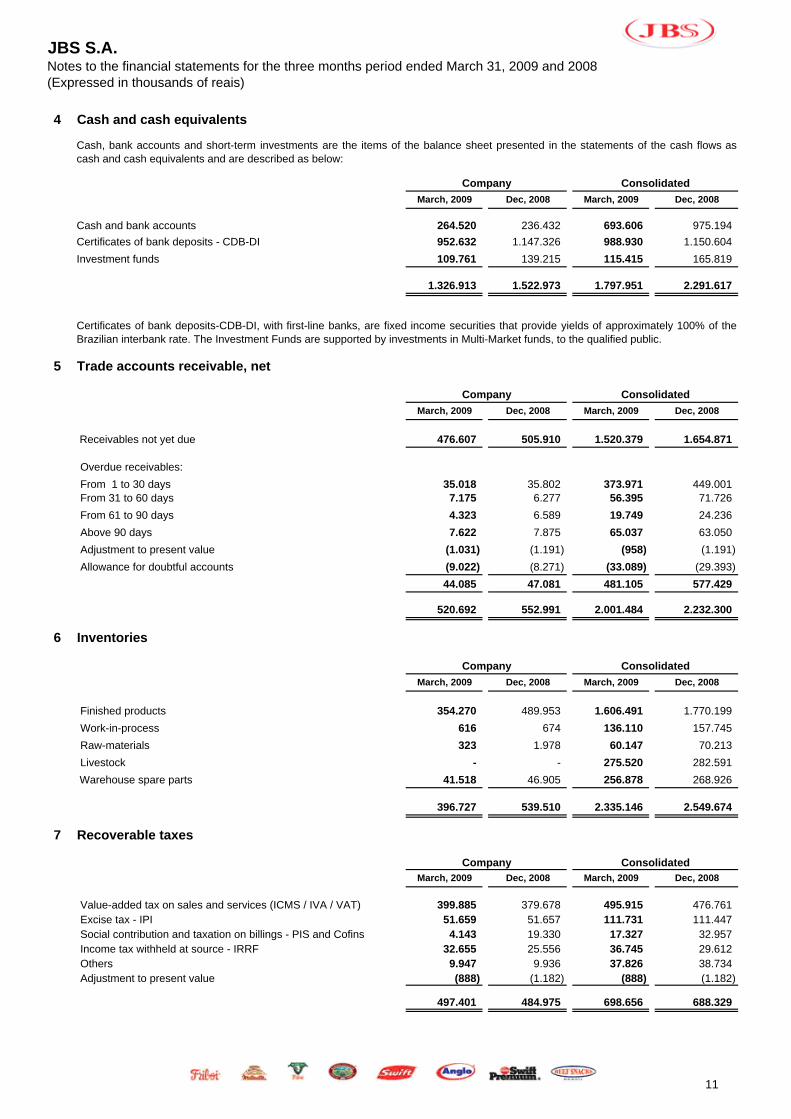
March, 2009 Dec, 2008 March, 2009 Dec, 2008
Cash and bank accounts 264.520 236.432 693.606 975.194
Certificates of bank deposits - CDB-DI 952.632 1.147.326 988.930 1.150.604
Investment funds 109.761 139.215 115.415 165.819
1.326.913 1.522.973 1.797.951 2.291.617
5 Trade accounts receivable, net
March, 2009 Dec, 2008 March, 2009 Dec, 2008
Receivables not yet due 476.607 505.910 1.520.379 1.654.871
Overdue receivables:
From 1 to 30 days 35.018 35.802 373.971 449.001 From 31 to 60 days 7.175 6.277 56.395 71.726
From 61 to 90 days 4.323 6.589 19.749 24.236
Above 90 days 7.622 7.875 65.037 63.050
Adjustment to present value (1.031) (1.191) (958) (1.191)
Allowance for doubtful accounts (9.022) (8.271) (33.089) (29.393)
44.085 47.081 481.105 577.429
520.692 552.991 2.001.484 2.232.300
6 Inventories
March, 2009 Dec, 2008 March, 2009 Dec, 2008
Finished products 354.270 489.953 1.606.491 1.770.199
Work-in-process 616 674 136.110 157.745
Raw-materials 323 1.978 60.147 70.213
Livestock - - 275.520 282.591
Warehouse spare parts 41.518 46.905 256.878 268.926
396.727 539.510 2.335.146 2.549.674
7 Recoverable taxes
March, 2009 Dec, 2008 March, 2009 Dec, 2008
Value-added tax on sales and services (ICMS / IVA / VAT) 399.885 379.678 495.915 476.761 Excise tax - IPI 51.659 51.657 111.731 111.447 Social contribution and taxation on billings - PIS and Cofins 4.143 19.330 17.327 32.957 Income tax withheld at source - IRRF 32.655 25.556 36.745 29.612 Others 9.947 9.936 37.826 38.734 Adjustment to present value (888) (1.182) (888) (1.182)
497.401 484.975 698.656 688.329
Cash, bank accounts and short-term investments are the items of the balance sheet presented in the statements of the cash flows ascash and cash equivalents and are described as below:
Company Consolidated
Company Consolidated
Cash and cash equivalents
Company
Consolidated
Certificates of bank deposits-CDB-DI, with first-line banks, are fixed income securities that provide yields of approximately 100% of theBrazilian interbank rate. The Investment Funds are supported by investments in Multi-Market funds, to the qualified public.
Consolidated
Company
11

JBS S.A.Notes to the financial statements for the three months period ended March 31, 2009 and 2008(Expressed in thousands of reais)
Current and Long-term:Current 458.254 447.343 632.981 623.022 Non-current 39.147 37.632 65.675 65.307
497.401 484.975 698.656 688.329
Value-added tax on sales and services (ICMS / IVA / VAT)
PIS and COFINS (social contribution on net income)
IRRF (withholding income tax)
Based upon final administrative decisions by the Câmara Superior do Conselho de Contribuintes and on the opinion of its legal counsels, the Company and JBS Embalagens has performed a monetary adjustment of its tax credits of PIS, COFINS and IPI based on the SELICrate (which is the reference rate published by the Central Bank of Brazil). After such monetary adjustments, the total PIS, COFINS andIPI tax credits totaled R$ 134,753. From the total amount the Company received an amount of R$ 17,045, and will receive and additionalamount of R$ 117,708.
IRFF corresponds to withholding income tax levied upon the redemption of marketable securities by the Company. The Companyexpects to set off such withholding income taxes against income taxes on net income paid for the applicable period.
PIS and COFINS tax credits are generated as a result of PIS/COFINS taxes paid by the Company upon its purchase of raw-materials,packaging and other materials used in the manufacturing of its products against the PIS/COFINS taxes paid by Company upon the saleof its finished products. Similarly to ICMS and IPI, as exports of the Company's products are exempt from such taxes, a tax credit iscreated.
General comments
Brazilian law authorizes manufacturers of goods to set off the ICMS tax paid upon the purchase of raw materials against the taxescharged upon the sale of the finished goods manufactured with such raw materials. Recoverable ICMS derives from tax credits receivedby the Company in connection with ICMS taxes paid upon its purchase of raw-materials, packaging materials and other goods, which areoffset against ICMS taxes resulting from the sale of the Company’s products. As export sales are exempt from ICMS and a relevantportion of the Company’s sales are export sales, a tax credit is generated.
The Tax Authority of the State of São Paulo (Secretaria da Fazenda do Estado de São Paulo ) filed administrative proceedings againstthe Company challenging the amount of the Company’s ICMS tax credits arising from the purchase of cattle by the Company in otherBrazilian states. The Tax Authority of the State of São Paulo claims that the tax incentives granted by such other states were not basedupon an agreement with the State of São Paulo, and accordingly, the Tax Authority of the State of São Paulo only recognizes theCompany’s ICMS tax credits up to the amount of the ICMS tax paid in such other states.The Company’s management believes that itsaccounting of the ICMS tax credit is in accordance with Brazilian law, and expects to be reimbursed of such credits.
12

JBS S.A.Notes to the financial statements for the three months period ended March 31, 2009 and 2008(Expressed in thousands of reais)
8 Related parties transactions
Trade accounts receivable
Trade accounts payable
Credits
(Debits)
Trade accounts receivable
Trade accounts payable
Credits
(Debits) Directly subsidiaries
Mouran Alimentos Ltda. - - 8.343 - - 5.719 JBS Confinamento Ltda. 112 23 27.545 215 8 14.959 JBS Embalagens Metálicas Ltda. - 1.454 58.331 - 2.735 57.282 JBS Global A/S (Denmark) - - (500) - - (531)JBS USA, Inc - - - - - 1.580.340 Inalca JBS S.p.A 2.028 - - 6.798 - - JBS Holding Internacional S/A - - 32.656 - - -
Indirectly subsidiaries
JBS Global Beef Company Lda. 48 - (54.407) - - (54.920)JBS Global (UK) Limited 16.734 - - 24.625 - - JBS Argentina S.A - 638 - - 677 - The Tupman Thurlow Co. 43.281 447 17.829 34.258 715 18.488 Global Beef Trading SU Lda. 11.399 - - - - - Beef Snacks Brasil Ind.Com. Ltda 64 2 67.089 5 - 72.135 Beef Snacks International BV - - 4.501 - - 4.463 Marr Russia L.L.C 8.914 - 46 - - 2.933
Other related parties
JBS Agropecuária Ltda. 15 9 - 143 7.540 - Flora Produtos de Hig. Limp. S.A. 5.693 231 - 1.813 83 -
88.288 2.804 161.433 67.857 11.758 1.700.868
PurchasesSales of products
PurchasesSales of products
Directly subsidiaries
JBS Confinamento Ltda. 471 106 - - JBS Embalagens Metálicas Ltda. 9.148 - 9.881 - JBS USA, Inc - 712 - - Inalca JBS S.p.A - 7.804 - 6.178
Indirectly subsidiaries
JBS Global (UK) Limited - 16.414 - 106.402 JBS Argentina S.A 36.208 - 2.523 - The Tupman Thurlow Co. - 26.805 - 16.953 Global Beef Trading SU Lda. - 13.363 - 8.781 Beef Snacks Brasil Ind.Com. Ltda - 149 7 3.953 Marr Russia L.L.C - 29.611 - -
Other related parties
JBS Agropecuária Ltda. 6.317 57 - - Flora Produtos de Hig. Limp. S.A. 685 20.220 - -
52.829 115.241 12.411 142.267
Main transactions between related parties in the balance sheet and income statement are the following:
March 31, 2009
The Company and its subsidiaries conduct commercial transactions between them, mainly sales operations, realized wtith normal priceand market conditions, when existing.
The credits and debits are presented, mainly, by mutual contracts which are calculated interests and exchange rate variation.
The parent company J&F Participações S.A guarantees Eurobonds operation of the Company in the amount of US$ 275 million thatbecome due in 2011.
December 31, 2009
Three months period ended March 31, 2009
Three months period ended March 31, 2008
13

JBS S.A.Notes to the financial statements for the three months period ended March 31, 2009 and 2008(Expressed in thousands of reais)
9 Investments in subsidiaries
a) Relevant information about subsidiaries
Company's share quantity
(Thousand) Participation Capital stock Shareholders'
equity Net income
(loss)
JBS Embalagens Metálicas Ltda. 10.002 99,00% 2 36.202 (2.746) JBS Global Investments S.A. 93.000 100,00% 215.314 114.988 6.577 JBS Holding Internacional. S. A. 679.153 100,00% 679.153 506.942 (28.622) JBS Global A/S 2.252 100,00% 123.510 146.007 (3.713) Mouran Alimentos Ltda. 120 70,00% 120 (22.105) (406) JBS USA, Inc. 0,1 100,00% 2.192.298 2.337.687 46.929 SB Holdings, Inc 20 100,00% 23 3.760 (1.375) JBS Confinamento Ltda. 65.001 100,00% 65.001 62.464 (1.956) Inalca JBS S.p.A 280.000 50,00% 861.922 1.125.604 (188) JBS Slovakia Holdings, S.R.O 0,001 100,00% 1.588.884 1.602.479 1.272
Dec 31, 2008 Addition (disposal)
Exchange rate variation
Shareholders´ Equity
Income Statements March 31, 2009
JBS Embalagens Metálicas Ltda. 38.559 - - - (2.719) 35.840
JBS Global Investments S.A. 109.421 - (1.021) 11 6.577 114.988
JBS Holding Internacional. S. A. 582.180 - - (46.616) (28.622) 506.942
JBS Global A/S 137.865 25.104 (6.668) (6.581) (3.713) 146.007
Mouran Alimentos Ltda. (15.189) - - - (284) (15.473)
JBS USA, Inc. 2.301.887 - (21.472) 10.343 46.929 2.337.687
SB Holdings, Inc 4.170 - (39) 1.004 (1.375) 3.760
JBS Confinamento Ltda. 29.420 35.000 - - (1.956) 62.464
Inalca JBS S.p.A 600.167 - (29.629) (7.642) (94) 562.802
JBS Slovakia Holdings, S.R.O - 1.560.831 28.053 12.323 1.272 1.602.479
15.189 15.473
Total 3.803.669 1.620.935 (30.776) (37.158) 16.015 5.372.969
10
Company
Annual Depreciation
Rates Cost RevaluationAccumulated Depreciation
March, 2009 Dec, 2008
Buildings 4% 413.056 116.742 (41.400) 488.398 486.669 Land - 107.469 9.352 - 116.821 116.821 Machinery & equipment 10% 404.761 45.846 (77.722) 372.885 285.314 Installations 10% 93.551 21.815 (24.434) 90.932 93.020 Computer equipment 20% 14.982 758 (8.219) 7.521 7.963 Vehicles and aircraft 20% 84.587 215 (47.317) 37.485 41.374 Construction in progress - 737.808 - - 737.808 759.028 Others 10 to 20% 19.908 4.580 (10.069) 14.419 14.644
1.876.122 199.308 (209.161) 1.866.269 1.804.833
March 31, 2009
Equity in subsidiaries
Net amount
Property, plant and equipment, net
b) Investments movement
Transfer to Other current liabilities
(Negative equity Mouran)
14

JBS S.A.Notes to the financial statements for the three months period ended March 31, 2009 and 2008(Expressed in thousands of reais)
Consolidated
Annual Depreciation
Rates Cost RevaluationAccumulated Depreciation
March, 2009 Dec, 2008
Buildings 3 to 20% 1.647.469 116.742 (186.787) 1.577.424 1.572.864 Land - 654.812 9.352 (18.920) 645.244 632.130 Machinery & equipment 8 to 10% 2.074.553 45.846 (696.898) 1.423.501 1.334.566 Installations 10% 99.276 21.815 (25.407) 95.684 97.289 Computer equipment 20 to 100% 72.481 758 (37.880) 35.359 37.046 Vehicles and aircraft 14 to 50% 139.315 215 (62.267) 77.263 80.101 Construction in progress - 1.100.998 - (47.030) 1.053.968 1.090.190 Others 10 to 100% 106.431 4.580 - 111.011 74.485
5.895.335 199.308 (1.075.189) 5.019.454 4.918.671
11 Intangible assets, net
March, 2009 Dec, 2008 March, 2009 Dec, 2008
Goodwill 934.559 949.615 1.310.156 1.331.283
Other intangible assets 9.615 9.615 855.073 874.064
944.174 959.230 2.165.229 2.205.347
a) Goodwill
In the Company
In subsidiary
b) Other intangible assets
Represented, mainly, by customers' list, trademarks and patents, commercialization rights, and others, of the subsidiary JBS USA.
In July 2007 the Company acquired 100% of the capital stock of Swift Foods Company, currently known as JBS USA Holdings, Inc., andpaid a goodwill of R$ 877,609, based on the expectation of future profitability. The goodwill was been amortized as long as such profitsare earned, during a period of five years. The accumulated goodwill amortization until December 31, 2008 is R$ 248,656.
In January 2007 the Company acquired 100% of the capital stock of SB Holdings, Inc., and paid a goodwill of R$ 21,725 based on theexpectation of future profitability of the subsidiary. The goodwill was been amortized as long as such profits are earned, during a periodnot exceeding ten years. The accumulated goodwill amortization until December 31, 2008 is R$ 6,035.
In March of 2008 the Company acquired 50% of the capital stock of Inalca S.p.A., currently known as Inalca JBS, and paid a goodwill ofEUR 94,181, which correspond as of March 31, 2009 to R$ 289,916, based on the expectation of future profitability.
As of March 31 2009, the balance of the Company’s revaluation of fixed assets account was R$ 199,308, the balance of the Companyrevaluation reserve account was R$ 116,695, and the balance of the Company income tax and social contribution account was R$55,542. The Company recorded accrued depreciation of R$ 27,071 with respect to the Company’s revaluation of fixed assets as ofMarch 31, 2009.
Net amount
JBS USA has a goodwill in the amount of US$ 147,855 thousand, corresponding as of March 31, 2008 to R$ 342,314 represented,mainly, by the acquisition in 2008 of Smithfield, Tasman and Five Rivers, preliminary calculated and subject to adjustments. The goodwillis represented by the excess of the aggregate purchase price over the fair value of the net identifiable assets acquired in the purchasebusiness combination.
Company Consolidated
In 2007, JBS Holding International S.A., through its subsidiaries JBS Argentina S.A. and JBS Mendoza S.A., acquired 100% of thecapital stock of Consignaciones Rurales S.A. and Argenvases S.A.I.C. and in 2008, through the same subsidiaries, acquired 100% of thecapital stock of Colcar S.A., with a total goodwill in these acquisition of $53,341 thousand Argentinean pesos, that corresponds as ofMarch 31, 2009 to R$ 33,283. These goodwill are based on the expectation of future profitability.
Until December 2007, supported by appraisal reports from SETAPE- Serviços Técnicos de Avaliações do Patrimônio e Engenharia S/CLtda., the Company made an appraisal of its facilities, resulting in an increase in the value of these assets, and the creation of therevaluation reserve and the related deferred income tax and social contribution provisions.
15
JBS S.A.Notes to the financial statements for the three months period ended March 31, 2009 and 2008(Expressed in thousands of reais)
12 Trade accounts payable
March, 2009 Dec, 2008 March, 2009 Dec, 2008
Commodities 168.450 313.316 740.142 1.044.142
Materials and services 72.808 70.586 674.673 916.293
Finished products 2.243 2.024 154.236 119.356
Adjustment to present value (1.183) (1.947) (1.183) (1.947)
242.318 383.979 1.567.868 2.077.844
13 Loans and financings
a) Company
Modality March, 2009 Dec, 2009
Financing for purchase of fixed assets
FINAME / FINEM - Enterprise financing 221.896 231.700 221.896 231.700
Loans for working capital purposes
ACC - Exchange advance contracts 1.297.469 591.990
EXIM - BNDES export credit facility 112.194 177.407
645.468 651.713
Working Capital - 51.113
Export prepayment 353.275 516.838
706.107 731.569 NCE / COMPROR 1.314.379 1.533.704
4.428.892 4.254.334
Total Loans and Financings 4.650.788 4.486.034
Current and Non-CurrentCurrent 2.080.299 1.494.690 Non-current 2.570.489 2.991.344
4.650.788 4.486.034
Long-term installments have the following maturities:
2010 230.125 636.327 2011 1.116.091 1.122.953 2012 297.496 298.308 2013 232.217 232.656 2016 694.560 701.100
2.570.489 2.991.344
Exchange rate variation and interest rate of 9.375%
Exchange rate variation and interest rate LIBOR + 2.00%
Annual average rate ofinterest and commissions
TJLP-UMBNDES index rate and interest rate of 3.0%
Consolidated
Exchange rate variation and Interest rate of 10.5%
CDI and interest rate of 2.0%
CDI and interest rate of 6.0%
Company
Fixed Rate Notes with final maturity in February 2016 (144-A)
Exchange rate variation and interest rate of Libor + 1.0%
TJLP and interest rate of 3.0%
Fixed Rate Notes with final maturity in February 2011 (Eurobonds)
16
JBS S.A.Notes to the financial statements for the three months period ended March 31, 2009 and 2008(Expressed in thousands of reais)
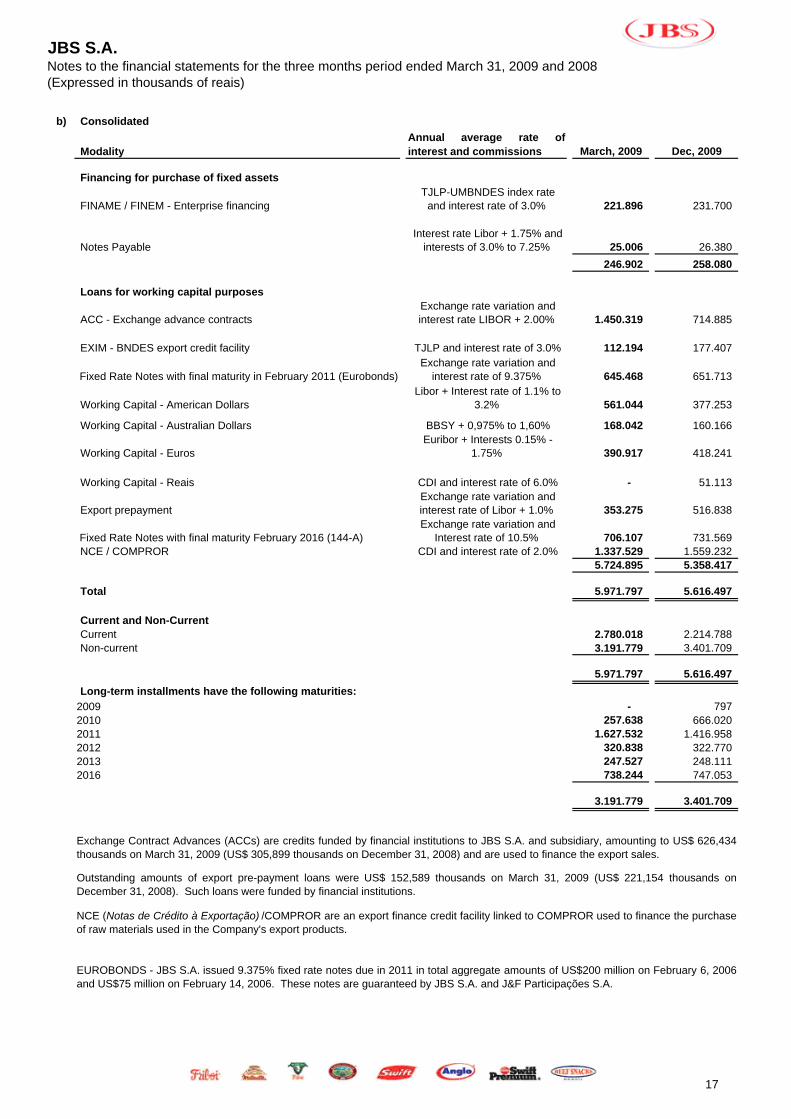
b) Consolidated
Modality March, 2009 Dec, 2009
Financing for purchase of fixed assets
FINAME / FINEM - Enterprise financing 221.896 231.700
25.006 26.380
246.902 258.080
Loans for working capital purposes
ACC - Exchange advance contracts 1.450.319 714.885
EXIM - BNDES export credit facility 112.194 177.407
645.468 651.713
Working Capital - American Dollars 561.044 377.253
Working Capital - Australian Dollars 168.042 160.166
Working Capital - Euros 390.917 418.241
Working Capital - Reais - 51.113
Export prepayment 353.275 516.838
706.107 731.569 NCE / COMPROR 1.337.529 1.559.232
5.724.895 5.358.417
Total 5.971.797 5.616.497
Current and Non-CurrentCurrent 2.780.018 2.214.788 Non-current 3.191.779 3.401.709
5.971.797 5.616.497
Long-term installments have the following maturities:
2009 - 797 2010 257.638 666.020 2011 1.627.532 1.416.958 2012 320.838 322.770 2013 247.527 248.111 2016 738.244 747.053
3.191.779 3.401.709
Notes Payable
Libor + Interest rate of 1.1% to 3.2%
Fixed Rate Notes with final maturity February 2016 (144-A)
NCE (Notas de Crédito à Exportação) /COMPROR are an export finance credit facility linked to COMPROR used to finance the purchaseof raw materials used in the Company's export products.
CDI and interest rate of 2.0%
Exchange Contract Advances (ACCs) are credits funded by financial institutions to JBS S.A. and subsidiary, amounting to US$ 626,434thousands on March 31, 2009 (US$ 305,899 thousands on December 31, 2008) and are used to finance the export sales.
Annual average rate ofinterest and commissions
EUROBONDS - JBS S.A. issued 9.375% fixed rate notes due in 2011 in total aggregate amounts of US$200 million on February 6, 2006and US$75 million on February 14, 2006. These notes are guaranteed by JBS S.A. and J&F Participações S.A.
BBSY + 0,975% to 1,60%
CDI and interest rate of 6.0%
TJLP and interest rate of 3.0% Exchange rate variation and
interest rate of 9.375%
Interest rate Libor + 1.75% and interests of 3.0% to 7.25%
Exchange rate variation and interest rate of Libor + 1.0% Exchange rate variation and
Interest rate of 10.5%
Euribor + Interests 0.15% - 1.75%
Fixed Rate Notes with final maturity in February 2011 (Eurobonds)
TJLP-UMBNDES index rate and interest rate of 3.0%
Exchange rate variation and interest rate LIBOR + 2.00%
Outstanding amounts of export pre-payment loans were US$ 152,589 thousands on March 31, 2009 (US$ 221,154 thousands onDecember 31, 2008). Such loans were funded by financial institutions.
17

JBS S.A.Notes to the financial statements for the three months period ended March 31, 2009 and 2008(Expressed in thousands of reais)
14 Payroll, social charges and tax obligation
March, 2009 Dec, 2008 March, 2009 Dec, 2008
Payroll and related social charges 22.094 23.240 86.595 86.293 Accrual for labor liabilities 34.732 28.590 165.783 182.478 Income tax - - 15.855 15.986 ICMS / VAT taxes payable 5.811 3.088 5.929 3.095 Others 7.143 7.804 38.473 49.386
69.780 62.722 312.635 337.238
15 Declared dividends
March, 2009 Dec, 2008 March, 2009 Dec, 2008
Declared dividends 12.321 51.127 12.321 51.127
12.321 51.127 12.321 51.127
16 Provision for contingencies
Consolidated
Labor 1.357 19.445 22.758 Civil 159 2.208 7.728 Tax 171 26.680 27.110
Total 1.687 48.333 57.596
Company
The value of the dividends approved which is less than that had initially been proposed by the Administration of the Company of R$51,127 was reached by the Shareholders present at the Shareholders General Ordinary and Extraordinary meeting who decided that theamortization of goodwill should not be excluded in order to calculate dividend payments. Consequently, they preferred distributing 50% ofthe net profit of the period ending December 31, 2008 after discounting the legal reserve.
Consolidated
Type of Proceedings
Company
The shareholders approved at the Ordinary and Extraordinary General Shareholders’ Meeting held on April 29, 2009 the payment ofdividends to the shareholders of JBS in the amount of R$ 12,321.
144-A - JBS S.A. also issued the 10.5% fixed rate notes due on 2016 in the total aggregate amount of US$300 million onJuly 28, 2006. These notes are also guaranteed by the Company.
Company
Provision
Number of lawsuits /
administrative proceedings
The Company and its subsidiaries are parties in several legal and administrative proceedings arising from the ordinary course of theirrespective businesses, including labor proceedings, civil proceedings and tax proceedings based on the estimate of its legal advisors.The Company has established provisions in its financial statements for the contingencies arising from these proceedings based on theestimates provided by its legal advisors. The table below sets forth the main information about the legal and administrative proceedingsas of March 31, 2009:
Provision
Consolidated
18

JBS S.A.Notes to the financial statements for the three months period ended March 31, 2009 and 2008(Expressed in thousands of reais)
Tax Proceedings
b) PIS (Programa de Integração Social) and COFINS (Contribuição para Financiamento da Seguridade Social)
c) Social contributions — Rural Workers’ Assistance Fund (FUNRURAL)
The Company has filed administrative proceedings challenging the calculation method used in the assessment of PIS and COFINS bythe Federal Tax Authority (Secretaria da Receita Federal). The Company’s management estimates that the contingencies arising fromthese legal proceedings amount to R$6,969 in the aggregate. Based on the opinion of the Company’s legal counsels and recentdecisions granted by the Brazilian Federal Supreme Court (Supremo Tribunal Federal), the Company’s management has recorded aprovision for losses arising from such legal proceedings in the amount of R$3,793.
In September 2002, the INSS filed two administrative proceedings (autos de infração) against the Company, seeking to collect certainsocial security contributions (which are referred to as contributions to the Rural Workers’ Assistance Fund (NOVO FUNRURAL) referringthe period from January 1999 to December 2003, in the amount of R$ 69,200, and from 2003 until 2006, in the amount of R$ 198,800,with the aggregate amount of R$ 268,000 million, that the Company should have allegedly withheld in connection with purchases of cattlefrom individual ranchers. As a result of a decision by a lower court in a proceeding to adjudicate a writ of mandamus action filed by theCompany in order to challenge the constitutionality of such social security contributions, the administrative proceedings have beenstayed and the INSS has been enjoined from collecting these social security contributions from the Company.
The Tax Authority of the State of São Paulo (Secretaria da Fazenda do Estado de São Paulo ) filed several administrative proceedingsagainst the Company, under which the Tax Authority challenges the amount of the Company’s ICMS tax credits arising from thepurchase of cattle and meat transfer by the Company in other Brazilian states. The Tax Authority of the State of São Paulo claims thatthe tax incentives should be approved by Confaz , and are known as a "Tax War". The Tax Authority of the State of São Paulo do notrecognizes the Company’s ICMS tax credits up to the amount of the ICMS tax paid in such other states. The Company estimates thatthe claims under these administrative proceedings amount to R$ 118,000 in the aggregate. In addition to presenting its defense in suchadministrative proceedings, the Company has filed legal proceedings seeking the payment of damages from such other states if the TaxAuthority of the State of São Paulo prevails in these administrative proceedings. The legal proceedings filed by the Company suspendedthe requirements of the State of São Paulo.
a) ICMS - Value Added Tax (Imposto sobre Operações Relativas à Circulação de Mercadorias e sobre a Prestação de Serviçosde Transporte Interestadual e Intermunicipal e de Comunicação)
Based on the opinion of the Company’s legal counsels, the Company’s management established a provision for losses arising from suchadministrative and legal proceedings in the amount of R$ 826.
The Tax Authority of the State of Goiás filed other administrative proceedings against the Company, due to interpretation divergences ofthe Law concerning the export VAT credits. Based on the opinion of the Company’s external legal counsel, the management of theCompany believes the Company will prevail in most of these proceedings. The Company’s management has recorded a provision forlosses arising from such administrative proceedings in the amount of R$ 4,185.
In order to preserve its claims under the administrative proceeding and to avoid the lapse of the applicable statute of limitations periodrelating to these claims, the INSS sent the Company tax default notices (notificações fiscais de lançamento de débito ) with respect to thecontributions allegedly owed by the Company for the period from January 2009 to December 2003, in the amount of R$ 69,200, and from2003 until 2006, in the amount of R$ 198,800, with the aggregate amount of R$ 268,000. In its defense to these default notices, theCompany argued that it did not pay the contributions with respect to the period described in such notices in light of the favorable decisionissued by the trial court reviewing the writ of mandamus action, which ordered the stay of the administrative proceedings and enjoinedthe INSS from collecting the contributions from the Company until a final decision is reached under such action.
The INSS has not timely appealed from this decision and, accordingly, the proceeding has been submitted to the review of the Regional
Federal Court of the 3rd Region as a matter of law. Currently, the proceedings await a ruling by such appellate court. Based on theopinion of the Company´s legal counsel supported by precedents of the Federal Supreme Court in a similar case, the Company’smanagement believes that the Company will prevail in these proceedings. Accordingly, the Company has not established any provisionfor contingencies arising from these proceedings.
19

JBS S.A.Notes to the financial statements for the three months period ended March 31, 2009 and 2008(Expressed in thousands of reais)
d) Other Tax Proceedings
Labor Proceedings
Civil Proceedings
a) Slaughterhouse at Araputanga
The Company actually cannot assure that the INSS will not file other legal proceedings or issue default notices as a result of its failure topay these social contributions for other fiscal years not covered by the administrative proceedings and default notices filed against theCompany. In addition, the Company is granted an unfavorable decision under these administrative and legal proceedings, and INSS willnot just be able to demand the withdrawal from the values of the debit notifications, estimate effect of R$ 38,000, as well as the valuesthat have not been discounted, estimate effect of R$ 43,600, that will result in a total estimate exposure of R$ 81,600.
In the lawsuit, Frigorífico Araputanga claimed that the sale of the slaughterhouse should be nullified as the Company did not obtain theconsent of SUDAM in order to register the public deed with the applicable real estate notary. In January 2005, the court of appeals(Tribunal de Justiça do Mato Grosso ) held that the Company had complied with all material terms of the purchase agreement. Thelawsuit was subsequently submitted to the review of the Federal Court of Cáceres, under No. 2005.36.01.001618-8, in light of theinclusion of the Federal Government as a party to the lawsuit. The Company obtained the consent of Unidade de Gerenciamento dos
Fundos de Investimento - UGFIN, the successor of SUDAM, according to the Federal Regional Court of the 1st Region (Tribunal Federal da 1ª Região ) decision, under Proceedings No. 2006.01.00.024584-7.
As of March 31, 2009 the Company was party to 1,169 labor and accident proceedings, 186 tax proceedings filed by the work regionalpolice stations and 2 proceedings established by the work public prosecution service, involving total value of R$ 106,606. Based on theopinion of the Company’s external legal counsel, the Company’s management recorded a provision in the amount of R$19,445 for losses arising from such proceedings.
In 2001, the Company (formerly known as Friboi Ltda.), entered into a purchase agreement for the acquisition of one slaughterhouselocated in the City of Araputanga, State of Mato Grosso, from Frigorífico Araputanga S.A. (“Frigorífico Araputanga”). As a result of thepayment of the purchase price by the Company and the acknowledgement by Frigorífico Araputanga of compliance by the Company withits obligations under the purchase agreement, a public deed reflecting the transfer of title of the slaughterhouse from FrigoríficoAraputanga to the Company was registered with the applicable real estate notary.
The Company is also party to 100 other tax lawsuits and administrative proceedings. Contingencies arising from these proceedings arenot material to the Company if considered on an individual basis. We highlight the proceedings with probable risk of loss, which havebeen provisioned for in the aggregate amount of R$ 17,876.
An ongoing legal proceeding arguing as to the unconstitutionality of the contribution to the Rural Workers’ Assistance Fund, with issuesand factual circumstances similar to the writ of mandamus action is currently under review by the Brazilian Federal Supreme Court(Supremo Tribunal Federal ). Up to the present moment, five of the ten judges opining on this proceeding have voted to declare thiscontribution unconstitutional and no judge has issued a dissenting opinion on this matter.
As (i) Frigorífico Araputanga was a beneficiary of certain tax benefits granted by the Federal Government through an agency responsiblefor fostering the development of the northern region of Brazil (Superintendência de Desenvolvimento da Amazônia – SUDAM) and (ii)the slaughterhouse sold to the Company was granted by Frigorífico Araputanga to SUDAM as collateral for these tax benefits theconsent of SUDAM was required for the registration of the public deed with the applicable real estate notary. In June 2004, FrigoríficoAraputanga S.A. filed a lawsuit against the Company in a state court located in the City of Araputanga, State of Mato Grosso, allegingthat the Company breached the purchase agreement and seeking an injunction to prevent the Company from finalizing the transfer of theslaughterhouse and a declaratory judgment that the purchase agreement and the public deed registered with the real estate notary werenull and void.
Based on this and other precedents and on the opinions of its external legal counsel, the Company’s management believes theCompany will prevail in these proceedings. Accordingly, the Company’s management has not established any provision forcontingencies arising from these proceedings. Currently, the Company is not forced to apply any discount, or pay the amount. In caseany discount is made, due to commercial negotiation, the Company apply the discount and deposits it in Judgement, accomplishing thejudicial decision.
Most of these lawsuits were filed by former employees of the Company seeking overtime payments and payments relating to theirexposure to health hazards.
In the three months period ended on March 31, 2009 the Company reviewed its criterion for contingencies allocation according to thelegal natures, impacting in a considerable increase in the labor contingencies, in the involved and accrued amount, referring the newallocation of the proceedings of disease and labor accidents, that previously were allocated as civil nature contingencies, being nowconsidered as labor contingencies.
20
JBS S.A.Notes to the financial statements for the three months period ended March 31, 2009 and 2008(Expressed in thousands of reais)
b) Trademark Infringement
c) Others
17 Debit with third parties for investment
The Company presented its defense against this lawsuit alleging that (i) the lawsuit should be analyzed and reviewed together with thelawsuit relating to the purchase of the slaughterhouse from Frigorífico Araputanga by the Company, (ii) the trademark “Frigoara” wasused by the Company for a limited period of time, with the written consent and upon the request of Frigorífico Araputanga (the use of thetrademark by the Company was a requirement of SUDAM to consent to the registration of the public deed contemplating the transfer ofthe slaughterhouse from Frigorífico Araputanga to the Company) and (iii) the amount of any damages under the lawsuit should be limitedto a percentage of products sold by the Company under the trademark “Frigoara,” pursuant to article 208 of the Intellectual Property Law.Almost all of the products manufactured by the Company were marketed under the trademark “Friboi.” The only product marketed by theCompany under the trademark “Frigoara” was minced meat, in limited amounts.
In light of the foregoing, the Company’s management established a provision for losses arising from this lawsuit in the amount of R$600.Following a determination of the judge of the trial court, the lawsuit was submitted to the review of the Federal Court of Cáceres onJanuary 17, 2007. The judge of the Federal Court of Cárceres determined that this lawsuit be joined with the lawsuit relating to thepurchase of the slaughterhouse by the Company from Frigorífico Araputanga. The Federal Government will be notified to issue anopinion on the matter under discussion in this lawsuit.
The parties are waiting for ruling following a judicial expert appraisal favorable to the company, that after evaluating the payments madeby Agropecuária Friboi, the appraisal concluded that the debit was already paid. The judicial appeal number 2006.01.00.024584-7 wasjudged favorably to the Company, when the "TRF" Regional Federal Court declared valid the purchase title deeds of the property, objectof discussion. Based on the Company´s legal advisers' opinion and based on Brazilian jurisprudence management of the Companybelieves that their arguments will prevail and no provision was registered.
In July 2005, Frigorífico Araputanga filed a lawsuit against the Company seeking damages in the amount of R$26,938 and punitivedamages in the amount of R$100,000 for the use by the Company of the trademark “Frigoara” without Frigorífico Araputanga’s consent.The amounts of the claim were based upon a report presented by Frigorífico Araputanga to the trial court, which appraised the value ofthe trademark “Frigoara” at R$315,000.
The Company is also party in other civil proceedings that in the evaluation of the Administration and its legal advisers, the lossexpectation on March 31, 2009 is of R$ 1,608.
Based on the Company’s legal counsel opinion supported by precedents of the Federal Brazilian Supreme Court (Supremo TribunalFederal ) and the Brazilian Superior Court of Justice (Superior Tribunal de Justiça ), the Company’s management believes that theCompany will prevail in these proceedings.
Refers to the amount of 65 million Euros that will be increased in Inalca´s purchase price in case the Company achieves at least one ofthe following economic targets: EBITDA average over business year 2008, 2009 and 2010 equal or greater than Euro 75 million, oralternatively, EBITDA over business year 2010 equal or greater than Euro 90 million. In case none of these financial metrics is reached,the debit will be reverted against the goodwill of the acquisition.
21

JBS S.A.Notes to the financial statements for the three months period ended March 31, 2009 and 2008(Expressed in thousands of reais)
18 Income taxes
a) Reconciliation of income tax and social contribution of the Company
2009 2008
(332.961) (2.753)
Addition (exclusion), NET:(14.830) 14.874 27.979 818
(319.812) 12.939
- (4.141)
- (4.141)
(27.979) (818)
Deferred income tax and social contribution 9.513 278
b) Deferred income tax and social contribution
March, 2009 Dec, 2008 March, 2009 Dec, 2008
Assets:. On tax losses and temporary differences 24.275 22.626 506.534 481.485
24.275 22.626 506.534 481.485
Liabilities:. On revaluation reserve and temporary differences 74.825 83.453 907.925 884.927
74.825 83.453 907.925 884.927
19
a) Capital Stock
b) Profit reserves
Legal reserve
Reserve for expansion
c) Revaluation reserve
Temporary differencesPermanent differences (substantially equity in subsidiaries)
Income (loss) before income tax and social contribution
Consists of the remaining balance of the net income after the computation of legal reserve and dividend distribution. The purpose of thisreserve is to provide funds to investment in assets.
Computed based on 5% of the net income of the year.
Revaluation reserve reflects the appraisal effected by the Company, net of tax effects that are progressively offset against retainedearnings to the same extent that the increase in value of the revalued property is realized through depreciation, disposal or retirement.
Income tax and social contribution are recorded based on taxable net income pursuant to the rates set forth in theapplicable laws. Deferred income tax and social contribution are recorded based on the temporary differences between thecarrying amounts on the Company’s financial statements and the tax basis of assets and liabilities, as well as on the taxloss carry forward credits.
Calculation basis for income tax and social contribution
Temporary differences
Three month period ended on March 31,
The Capital Stock on March 31, 2009 and December 31, 2008 is represented by 1,438,078,926 ordinary shares, without nominal value.From the total shares, as described in letter e) below, 37,140,300 shares are maintained in treasury (34,226,200 on December 31,2008).
The Company is authorized to increase its capital by an additional 22,600,000 ordinary nominative shares.
Shareholders’ equity
Company
Income tax and CSLL
The Company and its subsidiaries have a track record of future taxable net income. The Company expects to recover the tax creditsarising there from within eight years due to the termination of the causes of their contingencies.
Consolidated
22
JBS S.A.Notes to the financial statements for the three months period ended March 31, 2009 and 2008(Expressed in thousands of reais)
d) Dividends
e) Treasury shares
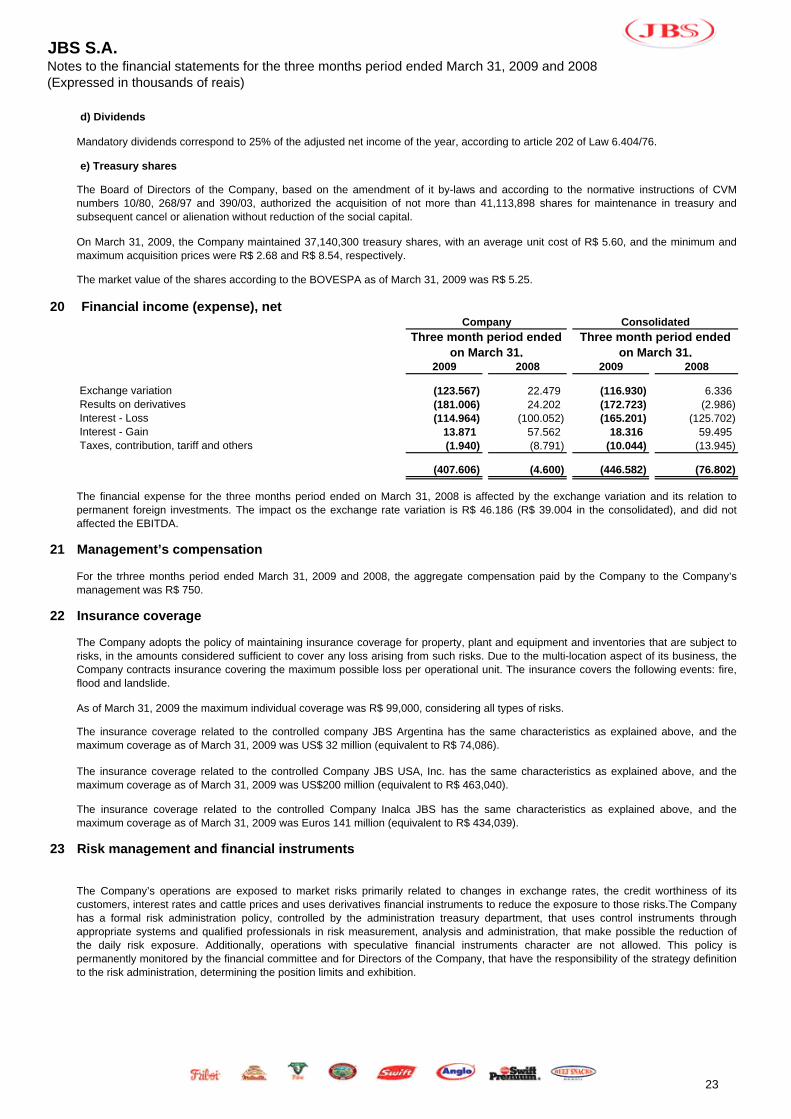
20 Financial income (expense), net
2009 2008 2009 2008
(123.567) 22.479 (116.930) 6.336 (181.006) 24.202 (172.723) (2.986) (114.964) (100.052) (165.201) (125.702)
13.871 57.562 18.316 59.495 (1.940) (8.791) (10.044) (13.945)
(407.606) (4.600) (446.582) (76.802)
21 Management’s compensation
22 Insurance coverage
23 Risk management and financial instruments
Taxes, contribution, tariff and others
Three month period ended on March 31,
Interest - Loss
Consolidated
Exchange variation Results on derivatives
Three month period ended on March 31,
Company
Interest - Gain
The market value of the shares according to the BOVESPA as of March 31, 2009 was R$ 5.25.
On March 31, 2009, the Company maintained 37,140,300 treasury shares, with an average unit cost of R$ 5.60, and the minimum andmaximum acquisition prices were R$ 2.68 and R$ 8.54, respectively.
The financial expense for the three months period ended on March 31, 2008 is affected by the exchange variation and its relation topermanent foreign investments. The impact os the exchange rate variation is R$ 46.186 (R$ 39.004 in the consolidated), and did notaffected the EBITDA.
For the trhree months period ended March 31, 2009 and 2008, the aggregate compensation paid by the Company to the Company’smanagement was R$ 750.
The insurance coverage related to the controlled Company Inalca JBS has the same characteristics as explained above, and themaximum coverage as of March 31, 2009 was Euros 141 million (equivalent to R$ 434,039).
The insurance coverage related to the controlled Company JBS USA, Inc. has the same characteristics as explained above, and themaximum coverage as of March 31, 2009 was US$200 million (equivalent to R$ 463,040).
The Company adopts the policy of maintaining insurance coverage for property, plant and equipment and inventories that are subject torisks, in the amounts considered sufficient to cover any loss arising from such risks. Due to the multi-location aspect of its business, theCompany contracts insurance covering the maximum possible loss per operational unit. The insurance covers the following events: fire,flood and landslide.
As of March 31, 2009 the maximum individual coverage was R$ 99,000, considering all types of risks.
The Company’s operations are exposed to market risks primarily related to changes in exchange rates, the credit worthiness of itscustomers, interest rates and cattle prices and uses derivatives financial instruments to reduce the exposure to those risks.The Companyhas a formal risk administration policy, controlled by the administration treasury department, that uses control instruments throughappropriate systems and qualified professionals in risk measurement, analysis and administration, that make possible the reduction ofthe daily risk exposure. Additionally, operations with speculative financial instruments character are not allowed. This policy ispermanently monitored by the financial committee and for Directors of the Company, that have the responsibility of the strategy definitionto the risk administration, determining the position limits and exhibition.
The insurance coverage related to the controlled company JBS Argentina has the same characteristics as explained above, and themaximum coverage as of March 31, 2009 was US$ 32 million (equivalent to R$ 74,086).
The Board of Directors of the Company, based on the amendment of it by-laws and according to the normative instructions of CVMnumbers 10/80, 268/97 and 390/03, authorized the acquisition of not more than 41,113,898 shares for maintenance in treasury andsubsequent cancel or alienation without reduction of the social capital.
Mandatory dividends correspond to 25% of the adjusted net income of the year, according to article 202 of Law 6.404/76.
23
JBS S.A.Notes to the financial statements for the three months period ended March 31, 2009 and 2008(Expressed in thousands of reais)
a) Foreing exchange and Interest Rate Risk
b) Credit risks
c) Purchase Price of Cattle
d) Fair value estimate
e) Financial instruments information
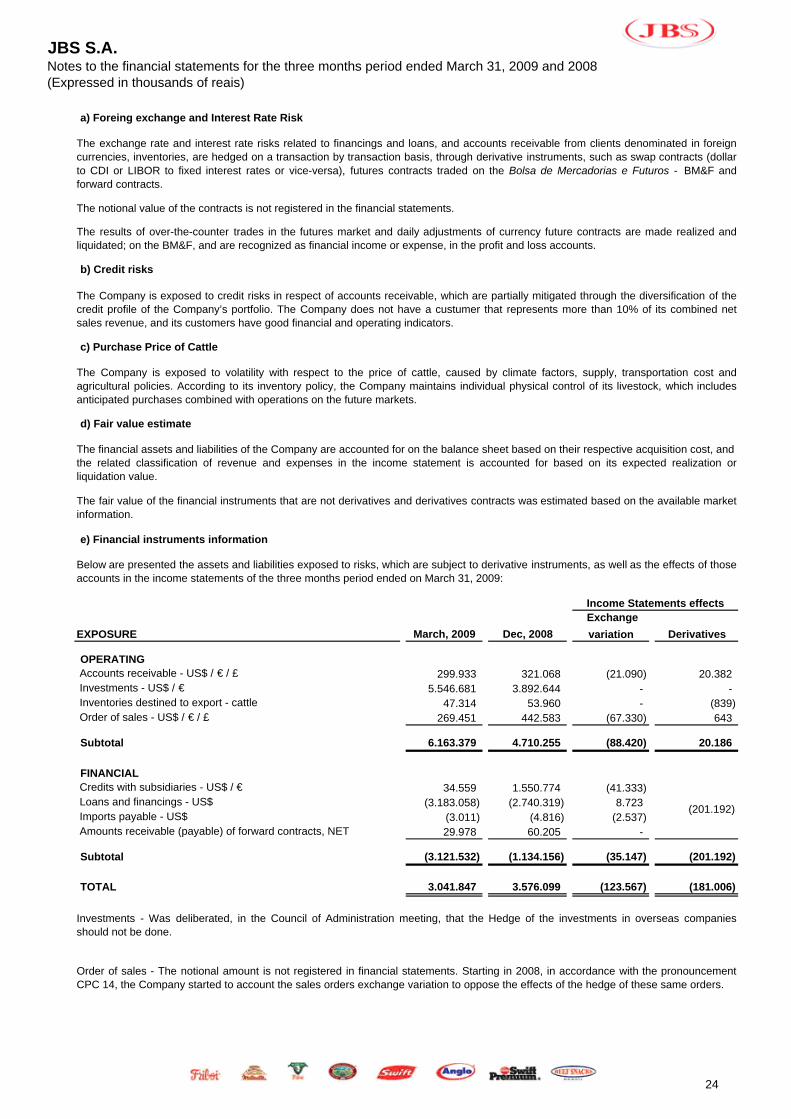
March, 2009 Dec, 2008
Exchange
variation Derivatives
OPERATING299.933 321.068 (21.090) 20.382
5.546.681 3.892.644 - - 47.314 53.960 - (839)
269.451 442.583 (67.330) 643
Subtotal 6.163.379 4.710.255 (88.420) 20.186
FINANCIAL34.559 1.550.774 (41.333)
(3.183.058) (2.740.319) 8.723 (3.011) (4.816) (2.537) 29.978 60.205 -
Subtotal (3.121.532) (1.134.156) (35.147) (201.192)
TOTAL 3.041.847 3.576.099 (123.567) (181.006)
Investments - Was deliberated, in the Council of Administration meeting, that the Hedge of the investments in overseas companiesshould not be done.
Imports payable - US$ Amounts receivable (payable) of forward contracts, NET
EXPOSURE
(201.192)
Order of sales - US$ / € / £
Credits with subsidiaries - US$ / € Loans and financings - US$
Accounts receivable - US$ / € / £
Inventories destined to export - cattle
Order of sales - The notional amount is not registered in financial statements. Starting in 2008, in accordance with the pronouncementCPC 14, the Company started to account the sales orders exchange variation to oppose the effects of the hedge of these same orders.
Investments - US$ / €
Below are presented the assets and liabilities exposed to risks, which are subject to derivative instruments, as well as the effects of thoseaccounts in the income statements of the three months period ended on March 31, 2009:
The notional value of the contracts is not registered in the financial statements.
The fair value of the financial instruments that are not derivatives and derivatives contracts was estimated based on the available marketinformation.
Income Statements effects
The financial assets and liabilities of the Company are accounted for on the balance sheet based on their respective acquisition cost, and the related classification of revenue and expenses in the income statement is accounted for based on its expected realization orliquidation value.
The exchange rate and interest rate risks related to financings and loans, and accounts receivable from clients denominated in foreigncurrencies, inventories, are hedged on a transaction by transaction basis, through derivative instruments, such as swap contracts (dollarto CDI or LIBOR to fixed interest rates or vice-versa), futures contracts traded on the Bolsa de Mercadorias e Futuros - BM&F andforward contracts.
The Company is exposed to volatility with respect to the price of cattle, caused by climate factors, supply, transportation cost andagricultural policies. According to its inventory policy, the Company maintains individual physical control of its livestock, which includesanticipated purchases combined with operations on the future markets.
The Company is exposed to credit risks in respect of accounts receivable, which are partially mitigated through the diversification of thecredit profile of the Company’s portfolio. The Company does not have a custumer that represents more than 10% of its combined netsales revenue, and its customers have good financial and operating indicators.
The results of over-the-counter trades in the futures market and daily adjustments of currency future contracts are made realized andliquidated; on the BM&F, and are recognized as financial income or expense, in the profit and loss accounts.
24
JBS S.A.Notes to the financial statements for the three months period ended March 31, 2009 and 2008(Expressed in thousands of reais)
f) Sensitivity analysis
24 Termination of purchase agreement
National Beef
25
Considering that the Company is exposed, mainly, to the exchange rates and interests risks on its assets and liabilities in foreigncurrency, and uses derivative instruments for protection of these referred assets and liabilities, the variations scenarios are followed bythe respective protection objects, generating almost zero effects.
On February 20th, 2009 the Company disclosure to its shareholders and the market in general that it has terminated the acquisitionprocess of National Beef, and all related litigation with the Department of Justice will also be terminated. The Company announced theacquisition of National Beef on March 4th, 2008, and the Department of Justice of the United States Government filed a suit to block thedeal on October 20th 2008 on competition grounds. The Company endeavored to encounter a solution with the parts involved but in theabsence of satisfactory conditions decided not to follow on with the acquisition.
On April 23, 2009 the Company announced the decision to increase the aggregate principal amount to US$ 700 million, with a coupon of11.625%, due in 2014. The transaction will be effective on April 27, 2009.
The Company intends to use the proceeds to balance debt with revenue geographically and improve its short term liquidity, as well asincreasing its cash position.
The notes have not been registered under the Securities Act of 1933 or any state securities laws and may not be offered or sold in theUnited States absent registration or an applicable exemption from the registration requirements of the Securities Act of 1933 andapplicable state laws.
Subsequent events
Caption of Senior Unsecured Notes (Bonds) through the subsidiary JBS USA, LLC, and the indirect subsidiary JBS USAFinance, Inc.
On April 14, 2009 the Company and its subsidiary JBS USA, LLC, toguether with the indirect subsidiary JBS USA Finance, Inc.announced the offering, subject to market conditions, of Senior Unsecured Notes (Bonds) for an aggregate principal amount of US$ 400million due 2014.
25

JBS S.A.Notes to the financial statements for the three months period ended March 31, 2009 and 2008(Expressed in thousands of reais)
26
Controladora Consolidado
RevenueSales of goods and services 1.220.852 9.388.697 Other income 436 488 Own assets building income (751) (2.105)
1.220.537 9.387.080 GoodsCost of services and goods sold (775.797) (6.690.146) Materials, energy, services from third parties and others (180.500) (1.349.747) Losses/Recovery of amounts - (144.827) Other costs (310) (310)
(956.607) (8.185.030)
Gross added value 263.930 1.202.050
Depreciation and Amortization (21.871) (83.341)
Net added value generated by the Company 242.059 1.118.709
Net added value by transferEquity in subsidiaries 16.015 - Financial income 97.610 161.663 Others 781 1.135
Net added value to distribution 356.465 1.281.507
Distribution of added value
LaborSalaries 109.090 739.701 Benefits 8.926 161.178 F.G.T.S. (Brazilian Social Charge) 5.179 5.234
123.195 906.113
Taxes and contributionFederal 25.903 57.540 State 21.307 26.528 Municipal 56 374
47.266 84.442
Capital Remuneration from third partiesInterests 503.524 599.231 Rents 3.611 8.377 Others 1.553 6.963
508.688 614.571
Owned capital remunerationLoss of the period (322.684) (322.684) Minorit interests participation on retained income - (935)
(322.684) (323.619)
Added value distributed 356.465 1.281.507
* * * * *
Complemental information - Economic value added for the three months period ended March 31, 2009
26
1st Quarter 2009 Results
JBS S.A. May 14th,2009
1Q09 Conference Call Date: Friday, May 15th, 2009
Portuguese: 10h30 (Brazil time)
09h30 (New York time) Phone: +55 (11) 4688 - 8128
No code required
English: 12h00 (Brazil time) 11h00 (horário de Nova Iorque)
Phone: +1 (973) 935- 8893 Password: JBS
“In God We Trust”
Investor Relations Contact Jeremiah O’Callaghan: IR Director Rodrigo Gagliardi: IR Manager E-mail: [email protected] Phone: +55 (11) 3144-4055 Website: www.jbs.com.br
1
1st Quarter 2009 Results
São Paulo, May 14th, 2009 – JBS S.A. (“JBS”) (Bovespa: JBSS3), the world’s largest producer and exporter of beef and beef products announces today its first quarter results for 2009 (1Q09). For the purpose of analysis, this report considers the results for the quarter ended December 31, 2008 (4Q08) and March 31, 2008 (1Q08). The consolidated results of JBS are presented in Brazilian reais (R$) and when separately analyzed each business unit reports its results in the currency of the country in which it operates. The operations of JBS Australia are an integral part of the subsidiary JBS USA and both results refer to the period of 13 weeks ending March 29, 2009 (1Q09). HIGHLIGHTS
Net revenue increased 58.2% from R$5,859.1 million in 1Q08 to R$9,267.9 million in 1Q09.
Consolidated EBITDA increased 20.4% when compared with the same period last year from
R$175.7 to R$211.5 million.
The conclusion of financial and structural adjustments required with a view towards the ongoing growth of the Company as defined in its strategy.
70.0% of the level reached in relation to cost reductions and efficiency increase.
Sustained EBITDA margin maintenance in the Beef operation in the US (2.2%) bearing in mind the
seasonality.
The improvement of the Brazilian market where an EBITDA margin of 7.2% was reached in 1Q09 indicating a positive trend in this market.
The consolidation of a Global Production Platform.
The consolidation of the strategy to build a sustainable, direct and efficient global distribution
platform of meat and meat products both chilled and frozen.

2
1st Quarter 2009 Results
HIGHLIGHTS
R$ million 1Q09 4Q08 ∆% 1Q08 ∆%Net Revenue 9,267.9 9,633.2 -3.8% 5,859.1 58.2%Cost of Goods Sold -8,509.8 -8,781.8 -3.1% -5,348.8 59.1%EBITDA
JBS USA Beef (US$) 59.7 60.4 -1.2% -13.5 -JBS USA Pork (US$) 7.5 25.6 -70.8% 15.6 -52.1%INALCA JBS (Euro) 5.6 8.3 -32.4% 7.3 -24.0%JBS Brasil (R$) 80.5 77.9 3.3% 139.8 -42.4%JBS Argentina ($ Pesos) -32.7 -20.4 60.5% -13.4 145.0%
Consolidated EBITDA 211.5 265.9 -20.4% 175.7 20.4%EBITDA margin 2.3% 2.8% - 3.0% -
Net financial income (expense)* -446.6 -238.8 87.0% -76.8 481.5%Net Income (Loss) -322.7 -53.5 502.7% -6.6 -Net Debt/EBITDA 2.52x 1.95x - 2.9x -Earnings per Share -0.23 -0.04 504.0% 0.01 -
*Financial expense in 1Q08 were positively affected by the exchange variation on foreign currency investments in the amount of R$39.0 million. Exchange variations do not have a cash effect on the Company, and as such do not impact the EBITDA.

3
1st Quarter 2009 Results
MESSAGE FROM THE PRESIDENT
Last year we consolidated our global production platform which involved a variety of challenges in implanting our culture in each of the production units acquired as well as the revision of our cost structure all of which resulted in improvements and considerable efficiency gains. We feel we have reached at least 70% of what we set out to do in implanting these improvements and we continue to work on the challenges ahead to finalize this process. It is good to see that Brazil has initiated a process of progressively improving margins. Part of the excess slaughter capacity which was responsible for the imbalance has been shut down, the exchange rate is more favorable for the exporting companies, more credit has become available for our clients that are importing our products in a wide variety of countries, new markets are opening up and the Brazilian herd is being rebuilt. During this first quarter of 2009, we still had to deal with the issues that spilled over from the latter half of last year and our focus has been on turning the page on a unique and stressful market situation. We have adjusted our commercial relations to reflect a new global credit reality. In a demonstration of how we can learn from past errors, we have implemented a rigid risk classification structure in our commercial relations both domestically and internationally with a view towards avoiding future losses. We have gone back to using a healthier commercial policy which includes pre-payments on exports and Letters of Credit confirmed by first class banks. Over and above, during this period we have made the necessary financial and structural adjustments required before following the next growth steps defined by the strategy of our company. Besides the issues mentioned above, our first quarter results were impacted by negative margins in our Argentine business unit and by a decline in our pork business unit in the US (you will see details in relation to this in each related chapter). There are challenges which we are facing and resolving in Argentina and our pork business in the US is already showing signs of recovery as we enter the second quarter. More importantly, the results of this first quarter demonstrate the continuity of good margins in our US and Australian beef operation resulting from the implementation of improvements. Add to that a tendency towards improved margins in Brazil and you can understand why we are motivated and confident that 2009 will be a good year. Due to the tightening of the global credit market and the reduced availability of credit lines in the international financial markets, we refocused concentrating on the financial health of our company instead of following a continued growth strategy. For a year now, we have not looked at acquisitions and in the meantime, we have rapidly deleveraged our company leading us to a strong cash position in a protein market which is demonstrating promising improvements. We are ready to grow again. In order to analyze the future, let us have a look at the past. During 2005 and 2006, we restructured our debt profile in order to grow as we felt fit. We financed our working capital through debt and we used equity to support the growth of our operations. In 2007 and 2008 we built our global production platform and we continue to grow organically in South America and in the other countries where we are installed. The next years will be marked by the expansion and integration of a JBS global distribution
4
1st Quarter 2009 Results
network which will further consolidate our strategy of creating the leading and most efficient global distribution Company for meats and meat derivatives both chilled and frozen. My thoughts are based on the confidence shared with the Administration and on the belief in the capacity which I have in our team to continue growing, improving results and building a better Company. Without the support of the financial community, analysts and all our stockholders, our efforts would have been in vain. I thank you all for the confidence you have shown in our Company and in our Administration. I would like to finish by thanking the whole team of collaborators. Running our Company during the last quarters of a turbulent global financial market has been a challenge. However, I am satisfied in knowing that I can count on leaders who are dynamic and agile and who have not measured their time in protecting JBS and in making our Company strong and protected against future external negative market factors beyond our control. Congratulations to you all for your efforts and dedication. Joesley Mendonça Batista President

5
1st Quarter 2009 Results
STOCK PERFORMANCE (JBSS3)
Stock Performance of JBSS3 vs. IBovespa
80
90
100
110
120
Jan-09 Feb-09 Mar-09
JBSS3 Ibovespa Index Source: Bloomberg (100 = 01/02/03)
JBS shares accompanied the Bovespa Index during the period of the 1Q09 returning to value levels similar to those seen prior to the financial crisis which peaked during the second half of last year. The average daily volume traded in the period was R$12.5 million. JBS share price increased in the period by 5.8% while the Bovespa Index showed a 1.7% increase. The performance of the share price is a reflection of the confidence of stockholders in the Company strategy to reach all markets through it’s global production and distribution platform as well the adequate financial structure of the Company. JBS shares represented by the ticker JBSS3 make up part of a number of the indexes of the BM&F as well as Bovespa, such as Ibovespa, IBrX-50, Corporate Governance Index (IGC) as well as The Consumer Index (ICON). Besides, the Company’s stock is traded in the US through an OTC ADR (American Depositary Receipt) program under the ticker JBSAY.
Stock Performance of JBSS3 (US$) vs S&P 500
70
80
90
100
110
120
130
Jan-09 Feb-09 Mar-09
JBSS3 S&P Source: Bloomberg (100 = 01/02/03)
When compared with the S&P 500, JBS stock increased in value by 5.6% against a decrease in the S&P 500 of 14.4% in the period.

6
1st Quarter 2009 Results
CORPORATE GOVERNANCE
JBS has embraced a Corporate Governance model with a view to implementing the best practices in the Company. The view is that the model demonstrates transparency and confidence to the public, guaranteeing the best products and services for customers, solidity for suppliers, satisfactory return for shareholders and the certainty of a better future for all JBS collaborators. The commitment of the Company towards an effective Corporate Governance is reflected in the fact that JBS is listed on the Novo Mercado of the Sao Paulo Stock Exchange (Bovespa). This carries the rigorous commitment to good Corporate Governance practices. At present, besides the Board of Directors and the Supervisory Board, JBS also has Audit, Finance, People Management and Business Strategy Committees. To formalize the Company’s protection against the risk of relevant losses in the Options Market, JBS’s Shareholders approved in the Annual and Extraordinary General Meeting held on April 29, 2009 the inclusion of a new article in JBS’s bylaws expressly prohibiting the Company and any of its subsidiaries, whether direct or indirect, to sign any contracts of sales of Options if the Company and any of its subsidiaries in question has no such activity in its corporate purpose. In the same Shareholders Meeting, the election of the members of the Board and Fiscal Council were approved.
Directors Position Date of election End of office termJoesley Mendonça Batista President 29/4/2009 2011 ASMWesley Mendonça Batista Member 29/4/2009 2011 ASMJosé Batista Sobrinho Member 29/4/2009 2011 ASMJosé Batista Jr. Member 29/4/2009 2011 ASMMarcus Vinicius Pratini de Moraes(1) Member 29/4/2009 2011 ASMWagner Pinheiro de Oliveira(1) Member 29/4/2009 2011 ASM
(1) Independent Member
Member Name Position Date of election End of office termDivino Aparecido dos Santos President 29/4/2009 2011 ASMFlorisvaldo Caetano de Oliveira Member 29/4/2009 2011 ASMJohn Shojiro Suzuki Member 29/4/2009 2011 ASMHélio Ricardo Teixeira de Moura Member 29/4/2009 2011 ASMSérgio Longo Member 29/4/2009 2011 ASM

7
1st Quarter 2009 Results
ANALYSIS OF THE CONSOLIDATED RESULTS Consolidated analysis of the principal operational indicators of JBS R$ million 1Q09 4Q08 ∆% 1Q08 ∆%Net Revenue 9,267.9 9,633.2 -3.8% 5,859.1 58.2%Cost of Goods Sold -8,509.8 -8,781.8 -3.1% -5,348.8 59.1%Gross Income 758.1 851.4 -11.0% 510.2 48.6%Selling Expenses -414.5 -448.3 -7.6% -305.1 35.8%General and Adm. Expenses -215.3 -227.5 -5.4% -79.8 169.8%Net Financial Income (expense)* -446.6 -238.8 87.0% -76.8 481.2%Goodwill Amortization 0.0 -45.7 - -44.3 -Non-recurring Expenses -0.6 -0.4 59.2% -0.5 -Operating Income -318.8 -109.4 191.5% 3.6 -Income and social contribution taxes -4.8 53.4 - -10.6 -54.7%Minority Interest 0.9 2.5 -62.1% 0.4 133.8%Net Income (Loss) -322.7 -53.5 - -6.6 -EBITDA 211.5 265.9 -20.4% 175.7 20.4%EBITDA margin 2.3% 2.8% - 3.0% -
*Financial expense in 1Q08 were positively affected by the exchange variation on foreign currency investments in the amount of R$39.0 million. Exchange variations do not have a cash effect on the Company, and as such do not impact the EBITDA.
Number of Head Slaughtered and Sales Volume
1Q09 4Q08 ∆% 1Q08 ∆%Heads slaughtered (thousand)Cattle 3,047.5 2,828.0 7.8% 2,200.6 38.5%Pork 2,977.0 3,337.4 -10.8% 3,168.8 -6.1%Smalls 683.4 712.7 -4.1% 145.8 368.6%Volume Sold (thousand tons)Domestic Market 1,373.5 1,349.9 1.7% 994.8 38.1%Fresh and Chilled Beef 1,244.9 1,226.6 1.5% 885.5 40.6%Processed Beef 31.2 31.6 -1.4% 27.9 11.8%Others 97.4 91.7 6.2% 81.4 19.7%Exports 422.4 418.4 1.0% 378.5 11.6%Fresh and Chilled Beef 396.8 389.0 2.0% 349.8 13.4%Processed Beef 20.9 25.8 -19.1% 26.2 -20.3%Others 4.8 3.7 29.6% 2.5 87.2%TOTAL 1,795.9 1,768.3 1.6% 1,373.3 30.8% JBS ends 1Q09 with 58.2% net revenue growth when comparing to 1Q08, due to the conclusion of the acquisitions of Smithfield Beef and Tasman during 2008. EBITDA increased 20.0% from R$175.7 million in 1Q08 to R$211.5 in 1Q09.
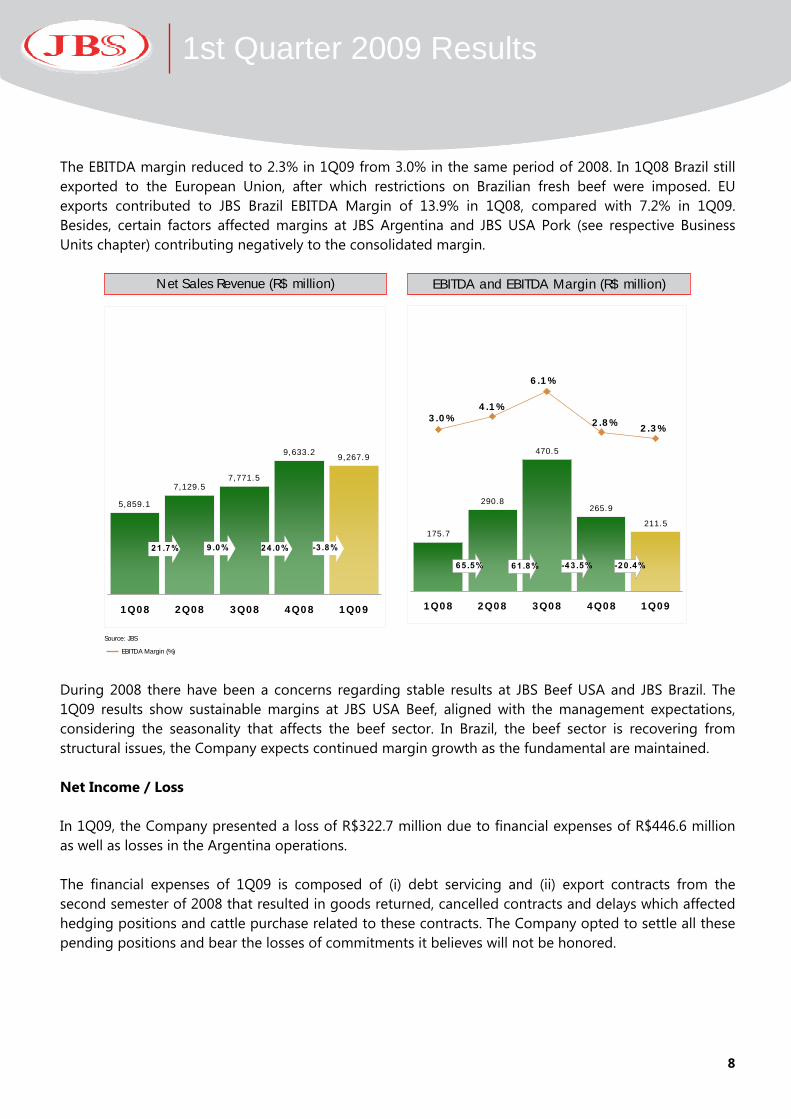
8
1st Quarter 2009 Results
The EBITDA margin reduced to 2.3% in 1Q09 from 3.0% in the same period of 2008. In 1Q08 Brazil still exported to the European Union, after which restrictions on Brazilian fresh beef were imposed. EU exports contributed to JBS Brazil EBITDA Margin of 13.9% in 1Q08, compared with 7.2% in 1Q09. Besides, certain factors affected margins at JBS Argentina and JBS USA Pork (see respective Business Units chapter) contributing negatively to the consolidated margin.
Net Sales Revenue (R$ million)Net Sales Revenue (R$ million) EBITDA and EBITDA Margin (R$ million)EBITDA and EBITDA Margin (R$ million)
Source: JBS
EBITDA Margin (%)
175.7
290.8
470.5
265.9
211.5
3.0%4.1%
2.8%
6.1%
2.3%
1Q08 2Q08 3Q08 4Q08 1Q09
5,859.1
7,129.57,771.5
9,633.2 9,267.9
1Q08 2Q08 3Q08 4Q08 1Q09
21 .7%
65 .5%
9.0%
61 .8%
24 .0%
-43 .5%
-3 .8%
-20 .4%
During 2008 there have been a concerns regarding stable results at JBS Beef USA and JBS Brazil. The 1Q09 results show sustainable margins at JBS USA Beef, aligned with the management expectations, considering the seasonality that affects the beef sector. In Brazil, the beef sector is recovering from structural issues, the Company expects continued margin growth as the fundamental are maintained. Net Income / Loss In 1Q09, the Company presented a loss of R$322.7 million due to financial expenses of R$446.6 million as well as losses in the Argentina operations. The financial expenses of 1Q09 is composed of (i) debt servicing and (ii) export contracts from the second semester of 2008 that resulted in goods returned, cancelled contracts and delays which affected hedging positions and cattle purchase related to these contracts. The Company opted to settle all these pending positions and bear the losses of commitments it believes will not be honored.
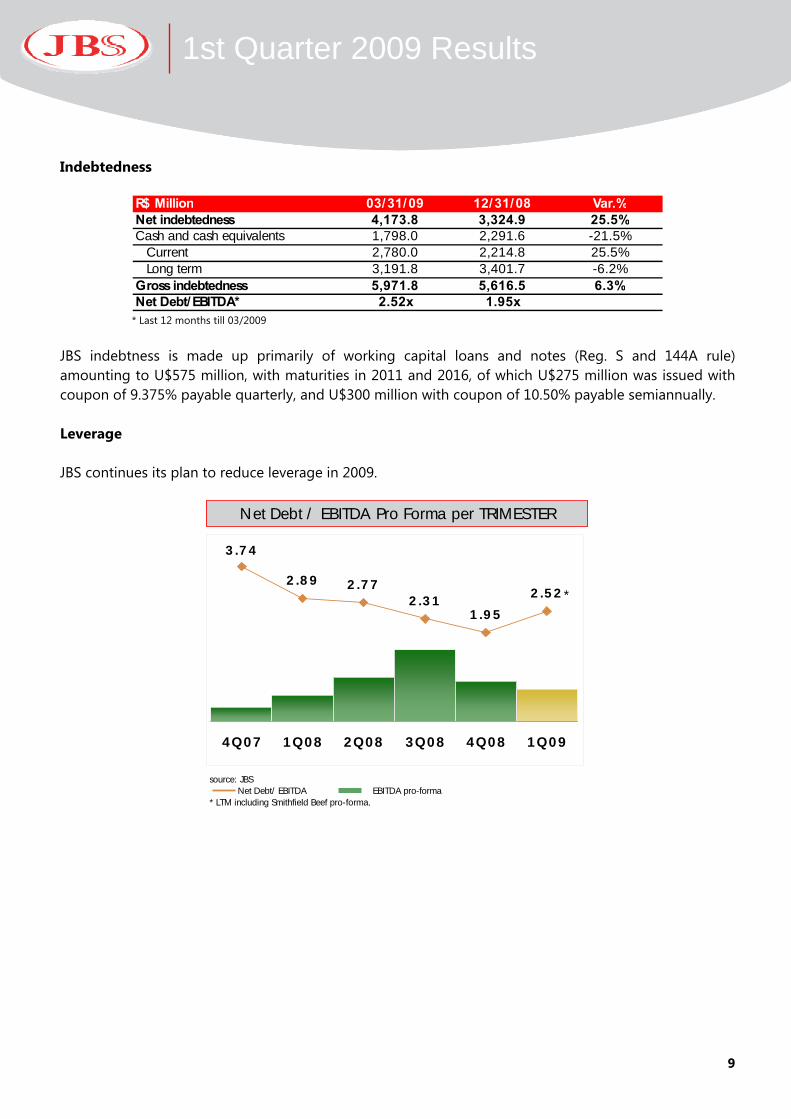
9
1st Quarter 2009 Results
Indebtedness
R$ Million 03/31/09 12/31/08 Var.%Net indebtedness 4,173.8 3,324.9 25.5%Cash and cash equivalents 1,798.0 2,291.6 -21.5%
Current 2,780.0 2,214.8 25.5%Long term 3,191.8 3,401.7 -6.2%
Gross indebtedness 5,971.8 5,616.5 6.3%Net Debt/EBITDA* 2.52x 1.95x
* Last 12 months till 03/2009
JBS indebtness is made up primarily of working capital loans and notes (Reg. S and 144A rule) amounting to U$575 million, with maturities in 2011 and 2016, of which U$275 million was issued with coupon of 9.375% payable quarterly, and U$300 million with coupon of 10.50% payable semiannually. Leverage JBS continues its plan to reduce leverage in 2009.
3.74
2.89 2.772.31
1.95
2.52
4Q07 1Q08 2Q08 3Q08 4Q08 1Q09
Net Debt / EBITDA Pro Forma per TRIMESTER
*
source: JBSNet Debt/ EBITDA EBITDA pro-forma
* LTM including Smithfield Beef pro-forma.
10
1st Quarter 2009 Results
Capital Expenditure The total amount of JBS capital expenditure for property, plant and equipment, not including acquisitions, was R$ 260.8 million in 1Q09. Below are the relevant investments made by the Company in 1Q09 among which are acquisitions of new equipment and maintenance of manufacturing facilities. JBS USA – Beef Business Unit Investments were made in the Grand Island, Dumas and Greeley plants, to improve the processing of by-products, refrigeration structure and equipment to gain efficiency in the deboning activity. JBS USA – Pork Business Unit In the USA Pork Business Unit the Company made investments in the Marshalltown, Louisville and Worthington plants, in pork slaughtering systems that use carbon gas, casing plants, improvements to generate production efficiency gains and equipment for packaging of customized products. JBS Australia In Australia investments were made in the Dinmore, Beef City and Rockhampton plants’ refrigeration systems, offal processing and maintenance areas.
INALCA JBS
INALCA JBS made investments in the Odinzovo (Moscow, Russia), Ospedaletto, Gazoldo Degli Ippoliti and Busseto Italy units, to improve food service activities and increase the slicing and production capacity for ham, cured meats, hamburgers and sausages. There were also investments in the distribution centers in Angola (Luanda) and Democratic Republic of the Congo (Kinshasa) to increase their portioned product and storage capacity. JBS Brazil In Brazil investments were made in the plants at Barra do Garças (MT), Campo Grande (MS), Iturama and Teófilo Otoni (MG), Vilhena (RO), and Anápolis in Goiás, to increase refrigeration, freezing, slaughtering and storage capacity . JBS Argentina The freezing capacity of the distribution center of Pilar, and the sausage and hamburger production capacity of Rosario and Ponte Vedra plants were expanded.
11
1st Quarter 2009 Results
Breakdown of Stockholders
Shareholders Number of Shares %
J & F Participações S.A. 632,781,603 44.0%
ZMF Fundo de Investimentos em Participações 87,903,348 6.1%
Treasury Shares 37,140,300 2.6%
Shares outstanding
BNDES Participações S.A. - BNDESPAR 186,891,800 13.0%
PROT - FIP 205,365,101 14.3%
Minority shareholders 287,996,774 20.0%
Total shares outstanding 680,253,675 47.3%
TOTAL 1,438,078,926 100.0% Position in 03/31/2009.

12
1st Quarter 2009 Results
ANALYSIS OF RESULTS BY BUSINESS UNIT
The Beef Business Unit of JBS USA (66% of gross revenue, including JBS Australia) JBS USA beef business was responsible for 66.0% of the Company’s total net revenue in 1Q09. In relation to the 1Q08 the net revenue increased 38.5% from US$1,935.1 million to US$2,680.2 million in 1Q09, basically reflecting an increase in volume driven by the recent acquisitions. Due to heavy rains occurred in the far north of Australia, the reopening in Townsville plant which usually occurs after the year-end festive season was only possible at the beginning of March. In the same period the EBITDA margin increase went from -0.7% in 1Q08 to 2.2% in 1Q09 and includes cost reductions due to remodeling supply contracts, elimination of certain third party service providers and improved margins by superior sales mix and carcass yield enhancements. Examples are the sale of short ribs to Korea, picanha to Brazil and the introduction of Australian meat to new South American markets. Comparing 1Q09 to 4Q08 the slight decrease of 3.9% in the net sales reflect a drop in volumes due to the annual seasonal closure for maintenance of the Australian plants in January, as well as a reduction in the average price. The EBITDA margin maintained at 2.2% in 1Q09. The margin increments in the past quarters confirm the sectors recovery reaching sustainable levels with balanced market capacity and supply availability. Financial Highlights US$ million 1Q09 4Q08 ∆% 1Q08 ∆%Heads slaughtered (thousand) 1,979.3 1,922.5 3.0% 1,355.3 46.0%Net Revenue 2,680.2 2,789.6 -3.9% 1,935.1 38.5%EBITDA 59.7 60.4 -1.2% -13.5 -EBITDA margin % 2.2% 2.2% - -0.7% - Breakdown of Net Revenue Domestic Market 1Q09 4Q08 ∆% 1Q08 ∆%Net Revenue (US$ million) 2,150.0 2,113.1 1.7% 1,401.7 53.4%Volume (thousand tons) 816.2 783.4 4.2% 511.4 59.6%Average Price (US$/Kg) 2.63 2.70 -2.3% 2.74 -3.9%
Exports 1Q09 4Q08 ∆% 1Q08 ∆%Net Revenue (US$ million) 530.2 676.5 -21.6% 533.4 -0.6%Volume (thousand tons) 283.3 293.8 -3.6% 228.0 24.3%Average Price (US$/Kg) 1.87 2.30 -18.7% 2.34 -20.0%

13
1st Quarter 2009 Results
The Pork Business Unit of JBS USA (12% of gross revenue) JBS pork business unit net revenue decrease of 1.7% from US$535.5 million in 1Q08 to US$526.3 million in 1Q09 primarily reflects a reduction in volume due to a lower availability of hogs in the market, partially offset by an increase in sales prices. Compared with the previous quarter, the net revenue went from US$600.5 million in 4Q08 to US$526.3 million in 1Q09 decreasing 12.4%. That movement reflects a reduction in pork volumes attributable to a weakening of the meat margin spread as hog price increases were not able to be passed through with higher sale prices. The EBITDA margin decline to 1.4% in 1Q09 was driven by a decrease in Pork slaughter volumes and an increase in hog prices which could not be passed through in terms of higher sale prices, especially for rendered products that include fats which accompany worldwide lower petroleum prices. On the other hand on per head basis, storage, freight and utilities costs were reduced. Financial Highlights US$ million 1Q09 4Q08 ∆% 1Q08 ∆%Animals slaughtered (thousand) 2,977.0 3,337.4 -10.8% 3,168.8 -6.1%Net Revenue 526.3 600.5 -12.4% 535.5 -1.7%EBITDA 7.5 25.6 -70.8% 15.6 -52.1%EBITDA margin % 1.4% 4.3% - 2.9% - Breakdown of Net Revenue Domestic Market 1Q09 4Q08 ∆% 1Q08 ∆%Net Revenue (US$ million) 444.5 507.9 -12.5% 449.9 -1.2%Volume (thousand tons) 269.7 294.1 -8.3% 275.4 -2.1%Average Price (US$/Kg) 1.65 1.73 -4.6% 1.63 0.9%
Exports 1Q09 4Q08 ∆% 1Q08 ∆%Net Revenue (US$ million) 81.8 92.6 -11.6% 85.6 -4.4%Volume (thousand tons) 46.2 40.1 15.3% 46.8 -1.3%Average Price (US$/Kg) 1.77 2.31 -23.4% 1.83 -3.2%

14
1st Quarter 2009 Results
The INALCA JBS Business Unit (5% of gross revenue) Revenues in 1Q09 compared with the 4Q08 decreased 11.3%. Inalca JBS’s Italian beef segment had lower performance comparing to the previous quarter, as well as the Inalca JBS’s foreign operations, mainly in Russia, Angola and Congo. The reductions on sales are linked to the year-end seasonality and the financial crisis that affected European and African markets at the beginning of this year. There is an overall increase of 9.1% in 1Q09 compared with 1Q08, from €131.9 million to €144.0 million. The EBITDA margin reduction from 5.1% in 4Q08 to 3.9% in 1Q09 was caused by lower sales performance. There was a change in the mix of products sold caused by the migration of costumers to lower value added cuts. Financial Highlights € million 1Q09 4Q08 ∆% 1Q08 ∆%Heads slaughtered (thousand) 94.5 118.8 -20.5% 82.1 15.1%Net Revenue 144.0 162.3 -11.3% 131.9 9.1%EBITDA 5.6 8.3 -32.4% 7.3 -24.0%EBITDA margin % 3.9% 5.1% - 5.6% -
Note: The above numbers represent 50% of Inalca JBS owned by JBS S.A.
Breakdown of Net Revenue Domestic Market 1Q09 4Q08 ∆% 1Q08 ∆%Net Revenue (€ million) 98.2 108.5 -9.5% 98.2 0.0%Volume (thousand tons) 36.2 37.6 -3.7% 27.5 31.9%Average Price (€/Kg) 2.71 2.89 -6.0% 3.58 -24.2%
Exports 1Q09 4Q08 ∆% 1Q08 ∆%Net Revenue (€ million) 45.8 53.8 -14.9% 33.7 35.9%Volume (thousand tons) 7.2 8.9 -19.1% 6.7 7.5%Average Price (€/Kg) 6.36 6.04 5.2% 5.03 26.5%
15
1st Quarter 2009 Results
JBS Brazil Business Unit (15% of gross revenue) In Brazil, the suspension of some relevant industry competitors provided an opportunity of market-share improvement for Company, sustained by a solid financial structure and available capacity. The investments made to increase capacity that JBS made in the past few years allowed the Company to boost its revenue 11.4% in 1Q09 compared with the same period in 2008. The net revenue went from R$1,009.0 million in 1Q08 to R$1,124.4 million in 1Q09. When compared with 4Q08 there is a 9.5% drop on the net revenues. This is a seasonal movement caused by higher consumption of beef in the period due to the holidays of the end of the year. Besides, in the months prior to Easter the demand for beef is reduced. The EBITDA margin reduction observed between 1Q08 and 1Q09 from 13.9% to 7.2% is justified by the exports volume drop to the European Union, a premium cuts market. In the beginning of 2008 cattle traceability restrictions that were imposed on Brazil drastically reduced the exports to the E.U.. The EBITDA had an increase from 6.3% in 4Q08 to 7.2% in 1Q09, reflecting export volumes recovering, a favorable exchange rate, better domestic market and lower costs of raw-material. Financial Highlights R$ million 1Q09 4Q08 ∆% 1Q08 ∆%Heads slaughtered (thousand) 777.8 631.5 23.2% 650.2 19.6%Net Revenue 1,124.4 1,242.8 -9.5% 1,009.0 11.4%EBITDA 80.5 77.9 3.3% 139.8 -42.4%EBITDA margin % 7.2% 6.3% - 13.9% -

16
1st Quarter 2009 Results
Breakdown of Net Revenue Domestic Market 1Q09 4Q08 ∆% 1Q08 ∆%Net Revenue (R$ million)Fresh and Chilled Beef 557.8 565.0 -1.3% 282.6 97.4%Processed Beef 54.0 54.5 -0.9% 44.9 20.3%Others 99.7 107.1 -6.9% 118.0 -15.5%TOTAL 711.5 726.6 -2.1% 445.5 59.7%
Volume (thousand tons)Fresh and Chilled Beef 114.3 100.1 14.1% 65.9 73.5%Processed Beef 23.7 23.9 -1.1% 21.4 10.9%Others 77.4 70.7 9.5% 66.7 16.1%TOTAL 215.3 194.7 10.6% 153.9 40.0%
Average Price (R$/Kg)Fresh and Chilled Beef 4.9 5.6 -13.5% 4.3 13.8%Processed Beef 2.3 2.3 0.2% 2.1 8.4%Others 1.3 1.5 -15.0% 1.8 -27.2% Exports 1Q09 4Q08 ∆% 1Q08 ∆%Net Revenue (R$ million)Fresh and Chilled Beef 304.5 364.4 -16.4% 450.8 -32.5%Processed Beef 108.4 151.8 -28.6% 112.7 -3.8%TOTAL 412.9 516.2 -20.0% 563.5 -26.7%
Volume (thousand tons)Fresh and Chilled Beef 51.2 43.4 18.0% 64.7 -20.9%Processed Beef 14.1 16.8 -16.1% 22.0 -36.0%TOTAL 65.3 60.2 8.5% 86.7 -24.7%
Average Price (R$/Kg)Fresh and Chilled Beef 5.9 8.4 -29.2% 7.0 -14.6%Processed Beef 7.7 9.0 -14.9% 5.1 50.2%

17
1st Quarter 2009 Results
JBS Argentina Business Unit (2% of gross revenue) Net revenue of JBS Argentina had a decrease of 7.8% in 1Q09 when compared with the previous quarter due to a reduction in the volume sold in the domestic market and lower average sales price in exports. The net revenue increased 43.0% in the 1T09 when compared to 1Q08, as a result of lifting quotas restrictions that limited export volumes of industrialized products, industrial action by producers, price controls imposed by the government that negatively impacted the Company's operations 1Q08. The EBITDA margin was adversely impacted by the reduction in export volume caused by the credit crunch that affected customers, a reduction in average prices and a low volume of sales of industrialized/further processed products. Financial Highlights $ Argentinean Pesos million 1Q09 4Q08 ∆% 1Q08 ∆%Heads slaughtered (thousand) 195.9 155.2 26.2% 113.0 73.3%Net Revenue 314.6 341.2 -7.8% 220.1 43.0%EBITDA -32.7 -20.4 60.5% -13.4 145.0%EBITDA margin % -10.4% -6.0% - -6.1% - Breakdown of Net Revenue Domestic Market 1Q09 4Q08 ∆% 1Q08 ∆%Net Revenue (million Argentinean Pesos)Fresh and Chilled Beef 52.5 65.8 -20.2% 39.6 32.5%Processed Beef 51.9 48.9 6.3% 40.3 28.8%Others 5.8 14.3 -59.4% 20.4 -71.6%TOTAL 110.3 129.0 -14.5% 100.4 9.8%
Volume (thousand tons)Fresh and Chilled Beef 8.6 11.4 -24.5% 5.4 57.4%Processed Beef 7.5 7.7 -2.3% 6.5 14.9%Others 20.1 21.0 -4.7% 14.7 36.3%TOTAL 36.1 40.1 -9.9% 26.7 35.4%
Average Price (Pesos/Kg)Fresh and Chilled Beef 6.1 5.8 5.7% 7.3 -15.8%Processed Beef 7.0 6.4 8.9% 6.2 12.1%Others 0.3 0.7 -57.4% 1.4 -79.2%
18
1st Quarter 2009 Results
Breakdown of Net Revenue (JBS Argentina) Exports 1Q09 4Q08 ∆% 1Q08 ∆%Net Revenue (million Argentinean Pesos)Fresh and Chilled Beef 100.5 59.4 69.4% 56.0 79.6%Processed Beef 81.9 130.6 -37.3% 51.7 58.4%Others 21.9 22.2 -1.3% 12.0 82.9%TOTAL 204.3 212.2 -3.7% 119.7 70.8%
Volume (thousand tons)Fresh and Chilled Beef 8.8 2.7 221.8% 3.6 146.6%Processed Beef 6.8 9.0 -24.5% 4.2 61.6%Others 4.8 3.7 29.6% 2.5 87.2%TOTAL 20.4 15.4 32.3% 10.3 97.4%
Average Price (Pesos/Kg)Fresh and Chilled Beef 11.4 21.6 -47.4% 15.6 -27.2%Processed Beef 12.1 14.5 -17.0% 12.3 -2.0%Others 4.6 6.1 -23.9% 4.7 -2.3%

19
1st Quarter 2009 Results
Recent Events Senior Notes JBS USA, LLC and JBS USA Finance, Inc. (subsidiries of JBS S.A.) concluded in April 2009 the issuance of a Senior Notes Offering in the principal amount of US$700 million, with a coupon of 11.625%, due in 2014. JBS intends to use the proceeds to balance debt with revenue geographically and improve its short term liquidity, as well as increasing its cash position. Company comments: Given the fact that JBS is operating in the US for under two years and in the present financial environment, we feel that the strong demand for these Notes is a measure of how far we have progressed. This is our first issuance by our US subsidiary, and we are pleased to see the confidence that the financial community has demonstrated in our work. We plan to continue to operate efficiently in our global production platform, and the funds raised will help us reach that goal. H1N1 Influenza (North American Influenza) The Company believes that there is no health hazard related to the consumption of pork products. Although the recent outbreak of influenza has been miss-titled as Swine Influenza instead of North American Influenza (as communicated by the World Health Organization – WHO), there is no evidence that this virus is related to swine production or that the consumption of pork meat represents a health risk. Company comments: JBS is primarily a beef Company with an extensive production platform in the major producing countries and has a pork operation which represents 14.0% of the Company’s revenue. JBS does not raise hogs and is not vertically integrated. We buy and process hogs so any eventual demand reduction would be immediately reflected in the hog prices. In this scenario, we believe we can maintain our margins in the pork business. Although the Company reiterates that there is no evidence to suggest that pork products represent a risk to consumers, any eventual reduction in pork demand would represent a corresponding increase in beef demand, a sector where the Company is a global leader.

20
1st Quarter 2009 Results
TABLES AND CHARTS
Graph I – JBS Consolidated Gross Revenue Distribution 1Q09
Domestic Market78%
Exports22%
Revenue Distribution by Market 1Q09
Beef Italy5% Beef Argentina
2%
Beef Brazil15%
Beef USA57%
Pork USA12%
Beef Australia9%
Revenue Distribution by Business Units 1Q09
Source: JBS
Graph II – JBS Consolidated Exports Distribution 1Q09
Japan16%
E.U.16%
USA11%Mexico
9%Russia
8%
South Korea6%
China5%Hong Kong
5%
Canada4%
Middle East4%
Taiwan2%
O thers14%
JBS Exports1Q09US$ 901.4 Million
Source: JBS
Graph III – Breakdown of Production Costs by Business Units (%)
1Q09 (%) Consolidated JBS Brasil Argentina USA Beef USA Pork Inalca JBSRaw material (Cattle) 85.2% 86.2% 85.6% 85.4% 78.4% 90.0%
Processing (including ingredients and packaging)
6.1% 7.9% 8.1% 6.0% 8.1% 2.2%
Labor Cost 8.8% 5.9% 6.3% 8.6% 13.4% 7.9% Source: JBS
21
1st Quarter 2009 Results
CONTACTS
Head Office Avenida Marginal Direita do Tietê, 500
CEP: 05118-100 – São Paulo – SP Brazil
Phone: (55 11) 3144-4000 Fax: (55 11) 3144-4279
www.jbs.com.br
Investor Relations Phone: (55 11) 3144-4055
E-mail: [email protected] www.jbs.com.br/ir

22
1st Quarter 2009 Results
CONSOLIDATED FINANCIAL STATEMENT – JBS S.A.
(In thousands of Reais)
March, 2009 December, 2008 March, 2009 December, 2008
ASSETS
CURRENT ASSETS
Cash and cash equivalents 1,326,913 1,522,973 1,797,951 2,291,617 Trade accounts receivable, net 520,692 552,991 2,001,484 2,232,300 Inventories 396,727 539,510 2,335,146 2,549,674 Recoverable taxes 458,254 447,343 632,981 623,022 Prepaid expenses 3,023 1,754 77,954 70,881 Other current assets 92,962 166,275 401,767 493,372
TOTAL CURRENT ASSETS 2,798,571 3,230,846 7,247,283 8,260,866
NON-CURRENT ASSETS
Long-term assetsCredits with related parties 161,433 1,700,868 455,987 54,569 Judicial deposits and others 16,930 16,378 100,876 102,779 Deferred income taxes 24,275 22,626 506,534 481,485 Recoverable taxes 39,147 37,632 65,675 65,307
Total long-term assets 241,785 1,777,504 1,129,072 704,140
Permanent assetsInvestments in subsidiaries 5,372,969 3,803,669 - - Other investments 10 10 5,749 5,722 Property, plant and equipment, net 1,866,269 1,804,833 5,019,454 4,918,671 Intangible assets, net 944,174 959,230 2,165,229 2,205,347 Deferred charges - - 1,597 1,603
Total Permanent assets 8,183,422 6,567,742 7,192,029 7,131,343
TOTAL NON-CURRENT ASSETS 8,425,207 8,345,246 8,321,101 7,835,483
TOTAL ASSETS 11,223,778 11,576,092 15,568,384 16,096,349
JBS S.A.
Balance sheets
Company Consolidated

23
1st Quarter 2009 Results
(In thousands of Reais)
March, 2009 December, 2008 March, 2009 December,
2008
LIABILITIES AND SHAREHOLDERS' EQUITY
CURRENT LIABILITIES
Trade accounts payable 242,318 383,979 1,567,868 2,077,844 Loans and financings 2,080,299 1,494,690 2,780,018 2,214,788 Payroll, social charges and tax obligation 69,780 62,722 312,635 337,238 Declared dividends 12,321 51,127 12,321 51,127 Other current liabilities 122,390 76,772 272,766 248,344
TOTAL CURRENT LIABILITIES 2,527,108 2,069,290 4,945,608 4,929,341
NON-CURRENT LIABILITIES
Loans and financings 2,570,489 2,991,344 3,191,779 3,401,709 Deferred income taxes 74,825 83,453 907,925 884,927 Provision for contingencies 48,333 48,244 57,596 57,637 Debit with third parties for investment 200,089 210,480 200,089 210,480 Other non-current liabilities 38,026 38,870 504,085 480,302
TOTAL NON-CURRENT LIABILITIES 2,931,762 3,372,391 4,861,474 5,035,055
MINORITY INTEREST - - (3,606) (2,458)
SHAREHOLDERS' EQUITY
Capital stock 4,495,581 4,495,581 4,495,581 4,495,581 Capital reserve 777,844 769,463 777,844 769,463 Revaluation reserve 116,695 118,178 116,695 118,178 Profit reserves 18,696 1,297 18,696 1,297 Valuation adjustments of shareholders equity (676) (2,920) (676) (2,920) Accumulated exchange conversion adjustments 677,969 752,812 677,969 752,812 Accumulated losses (321,201) - (321,201) -
5,764,908 6,134,411 5,764,908 6,134,411 TOTAL SHAREHOLDERS' EQUITY
TOTAL LIABILITIES AND SHAREHOLDERS' EQUITY 11,223,778 11,576,092 15,568,384 16,096,349
JBS S.A.
Balance sheets
Company Consolidated

24
1st Quarter 2009 Results
(In thousands of Reais)
2009 2008 2009 2008
GROSS OPERATING REVENUESales of products:Domestic Sales 871,471 523,540 7,398,403 3,949,104 Foreign Sales 417,719 581,131 2,106,170 2,056,417
1,289,190 1,104,671 9,504,573 6,005,521
SALES DEDUCTIONS
Returns and discounts (68,179) (33,450) (117,702) (72,100) Sales taxes (96,608) (62,184) (118,944) (74,356)
(164,787) (95,634) (236,646) (146,456)
NET SALE REVENUE 1,124,403 1,009,037 9,267,927 5,859,065
Cost of goods sold (911,199) (764,336) (8,509,805) (5,348,839)
GROSS INCOME 213,204 244,701 758,122 510,226
OPERATING INCOME (EXPENSE)
General and administrative expenses (40,651) (20,602) (215,275) (79,822) Selling expenses (114,355) (100,159) (414,463) (305,146) Financial income (expense), net (407,606) (4,600) (446,582) (76,802) Equity in subsidiaries 16,015 (78,218) - - Goodwill amortization - (44,313) - (44,313) Other (expense) income, net 432 438 (618) (524)
(546,165) (247,454) (1,076,938) (506,607)
LOSS BEFORE TAXES (332,961) (2,753) (318,816) 3,619
Current income taxes 764 (4,141) (3,129) (15,590)Deferred income taxes 9,513 278 (1,674) 4,949
10,277 (3,863) (4,803) (10,641)
LOSS BEFORE MINORITY INTEREST (322,684) (6,616) (323,619) (7,022)
Minority interest (expense) income - - 935 406
LOSS OF THE PERIOD (322,684) (6,616) (322,684) (6,616)
LOSS PER THOUSAND SHARES (230) (5)
Statement of EBITDA (Earnings before income taxes, interest, depreciation and amortization)
Income (loss) before taxes (332,961) (2,753) (318,816) 3,619Financial income (expense), net 407,606 4,600 446,582 76,802 Depreciation and amortization 21,871 15,391 83,776 51,007 Equity in subsidiaries (16,015) 78,218 - - Goodwill Amortization - 44,313 - 44,313
AMOUNT OF EBITDA 80,501 139,769 211,542 175,741
Company Consolidated
JBS S.A.
Statements of income for the three months period ended March 31, 2009 and 2008
25
1st Quarter 2009 Results
This release contains forward-looking statements relating to the prospects of the business, estimates for operating and financial results, and those related to growth prospects of JBS. These are merely projections and, as such, are based

26
1st Quarter 2009 Results
exclusively on the expectations of JBS’ management concerning the future of the business and its continued access to capital to fund the Company’s business plan. Such forward-looking statements depend, substantially, on changes in market conditions, government regulations, competitive pressures, the performance of the Brazilian economy and the industry, among other factors and risks disclosed in JBS’ filed disclosure documents and are, therefore, subject to change without prior notice.