jce 64 2012_8_3_1036_en
TRANSCRIPT

Građevinar 8/2012
647GRAĐEVINAR 64 (2012) 8, 647-654
UDK: 69.003.12.001.8
Prof. Nives Ostojić-Škomrlj, PhD. CEUniversity of SplitFaculty of Civil Engineering, Arch. and [email protected]
Prof. Mladen Radujković, PhD. CE University of ZagrebFaculty of Civil [email protected]
Preliminary noteNives Ostojić-Škomrlj, Mladen Radujković
S-curve modelling in early phases of construction projects
The methodological procedure for forecasting cost distribution over time is given for the project realization phase using cost s-curves for three different types of structures: building, tunnel, and motorway. Three different approaches are used, and their results are correlated and presented in form of mathematical regression expressions and appropriate diagrams. The proposed methodology can be used for cash flow forecasting during all phases of construction projects, specially in the earliest phase in which detailed information about the project is scarce.
Key words:
Prethodno priopćenjeNives Ostojić-Škomrlj, Mladen Radujković
Model prognoziranja S-krivulja u ranim fazama građevinskih projekata
U radu je prikazan metodološki postupak kojim se definira način prognoziranja raspodjele troškova u vremenu za fazu izvršenja projekta pomoću troškovne S-krivulje za tri različita tipa građevina: visokogradnja, tuneli i autocesta. Primjenjena su tri različita pristupa, a rezultati sva tri pristupa i njihove integracije prikazani su u obliku regresijskih matematičkih izraza i odgovarajućih dijagrama. Predložena metodologija može se koristiti za prognoziranje troškovne dinamike građevinskih projekata u svim njihovim fazama, uključivo i najraniju fazu kada ne postoji dovoljno detaljnih podataka.
Ključne riječi:planiranje izgradnje, visokogradnja, tuneli, autoceste, S-krivulja, regresijski modeli, prognoza dinamike troškova
Vorherige MitteilungNives Ostojić-Škomrlj, Mladen Radujković
Prognosierungsmodell von S-kurven in der Frühphase von Bauprojekten
In der Arbeit ist die methodologische Vorgehensweise dargestellt, mit welcher die Art der Prognose der Kostenverteilung in dem Zeitraum der Projektbeendigung mit Hilfe der S-Kostenkurve für drei verschiedene Bautypen definiert wird: Hochbau, Tunnels und Autobahn. Es wurden drei verschiedene Vorgangsweisen verwendet, deren Resultate untereinander integriert und in Form von regressiven mathematischen Ausdrücken sowie entsprechenden Diagrammen dargestellt wurden. Die vorgeschlagene Methodologie kann für die Prognose der Kostendynamik von Bauprojekten in all ihren Phasen, einschließlich ihrer Anfangsphase, in welcher es ungenügend detaillierte Angaben gibt, verwendet werden.
Schlüsselwörter:Bauplanung, Hochbau, Tunnels, Autobahnen, S-Kurve, Regressionsmodelle, Prognose der Kostendynamik
S-curve modelling in early phases of construction projects
Primljen / Received: 22.5.2012.
Ispravljen / Corrected: 2.9.2012.
Prihvaćen / Accepted: 4.9.2012.
Dostupno online / Available online: 15.9.2012.
Authors:
construction planning, building engineering, tunnels, motorways, S-curve, regression models, cost scheduling
Građevinar 8/2012
648 GRAĐEVINAR 64 (2012) 8, 647-654
Nives Ostojić-Škomrlj, Mladen Radujković
1. Introduction
On construction projects, the study of cost distribution over time is a topic of high significance for clients and contractors alike. The information about costs gains its full significance when it is complemented with information about the time period in which the costs are incurred. The cost scheduling, arising from harmonized plans and cost estimates approved by client and contractor, is agreed upon on many construction projects. This is an information of great importance for all participants in construction projects, and has therefore been the subject of many studies. Some of these studies focus on the principles regulating these variables in various phases of the project, i.e on specific types of construction projects and, at that, the objective is to determine the theoretical cumulative S-curve that will best represent the standard distribution of costs over time. S-curves represent a cumulative flow of money over a time period. In these curves, the time "t" is presented on the abscissa, and the costs "v" are given on the ordinate. Possibilities for modelling cumulative costs over time at the project realization phase, based on three different approaches, are presented in full detail in this paper. Influence parameters and distribution principles must be defined for selected types of construction projects, under conditions of different organisation scenarios, specific realization requirements, client’s decision, external and internal risks, and project structure influences. It is known that all these parameters greatly vary from project to project, which results in an extremely complex combination of cases that can not be analyzed individually. This is why a basis providing results in conditions without extreme influences, i.e. in standard project realization conditions, has been developed by random selection of projects. Cost scheduling in special and extreme cases of realization can be defined in scope of a new study based on specific situations and, at that, the results obtained n the course of the present study can be used as a fundamental basis for such new research.
2. Methodological procedure, methods and research plan
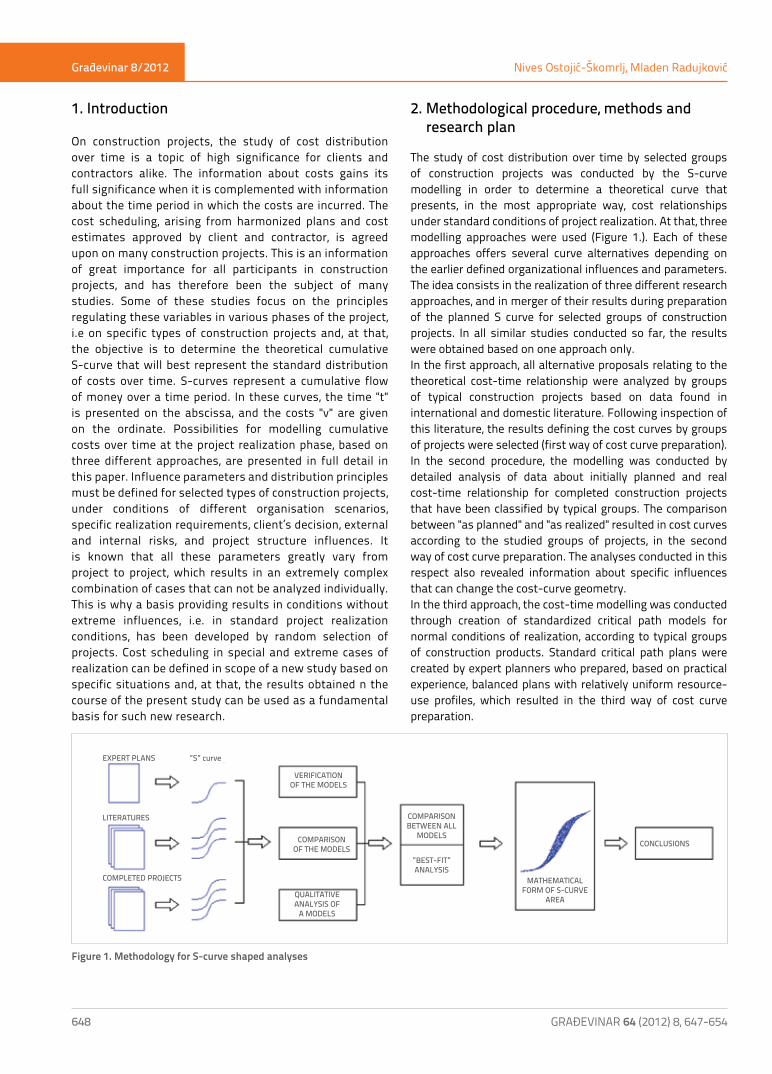
The study of cost distribution over time by selected groups of construction projects was conducted by the S-curve modelling in order to determine a theoretical curve that presents, in the most appropriate way, cost relationships under standard conditions of project realization. At that, three modelling approaches were used (Figure 1.). Each of these approaches offers several curve alternatives depending on the earlier defined organizational influences and parameters. The idea consists in the realization of three different research approaches, and in merger of their results during preparation of the planned S curve for selected groups of construction projects. In all similar studies conducted so far, the results were obtained based on one approach only.In the first approach, all alternative proposals relating to the theoretical cost-time relationship were analyzed by groups of typical construction projects based on data found in international and domestic literature. Following inspection of this literature, the results defining the cost curves by groups of projects were selected (first way of cost curve preparation).In the second procedure, the modelling was conducted by detailed analysis of data about initially planned and real cost-time relationship for completed construction projects that have been classified by typical groups. The comparison between "as planned" and "as realized" resulted in cost curves according to the studied groups of projects, in the second way of cost curve preparation. The analyses conducted in this respect also revealed information about specific influences that can change the cost-curve geometry.In the third approach, the cost-time modelling was conducted through creation of standardized critical path models for normal conditions of realization, according to typical groups of construction products. Standard critical path plans were created by expert planners who prepared, based on practical experience, balanced plans with relatively uniform resource-use profiles, which resulted in the third way of cost curve preparation.
EXPERT PLANS
VERIFICATION OF THE MODELS
CONCLUSIONS
QUALITATIVE ANALYSIS OF
A MODELS
COMPARISON BETWEEN ALL
MODELS
MATHEMATICAL FORM OF S-CURVE
AREA
”BEST-FIT”ANALYSIS
COMPARISON OF THE MODELS
”S” curve
LITERATURES
COMPLETED PROJECTS
Figure 1. Methodology for S-curve shaped analyses
Građevinar 8/2012
649GRAĐEVINAR 64 (2012) 8, 647-654
S-curve modelling in early phases of construction projects
Results of each approach are presented through mathematical expressions of cumulative cost distribution, and via an appropriate diagram. In the final part of the study, the results of three separate approaches were integrated by groups of typical construction projects, which resulted in final S-curves that show principles of cost dynamics (cost scheduling) over time under standard conditions of project organisation. The modelling has resulted in cost dynamics that can be used in early phases of preparation, when detailed information about the project is scarce.The S-curve prognosis is a part of a long-standing study conducted in the scope of the research project of the Ministry of Science, Education and Sports at the Faculty of Civil engineering, University of Zagreb [1]. Since 1996, the following data about completed construction projects are continuously collected for purposes of this research: type of structure, technical properties, location, organisational conditions of realization, type of contract, plans, cost estimates, and risk effects. The overall database of the research project contains data about more than one thousand completed construction projects. The data from 78 projects – buildings GF+4, motorway sections without structures, and tunnels – built over the past fifteen years, have been selected for this part of the study. Out of these 78 projects 63 were analyzed for purposes of dissertation [2] prepared in the scope of the research project. The data were analyzed using s standard computer program for statistical treatment of data, and the "best fit" procedure. Appropriate project and construction management methods and planning procedures were used in the modelling and analysis of data.
2.1. Theoretical S-curve models from literature
Over the past decade, several authors have recognized the significance of studying cost-related S-curves for construction projects. It can generally be stated that these studies were directed in two basic directions, and consequently the models developed were classified in two categories. The first category
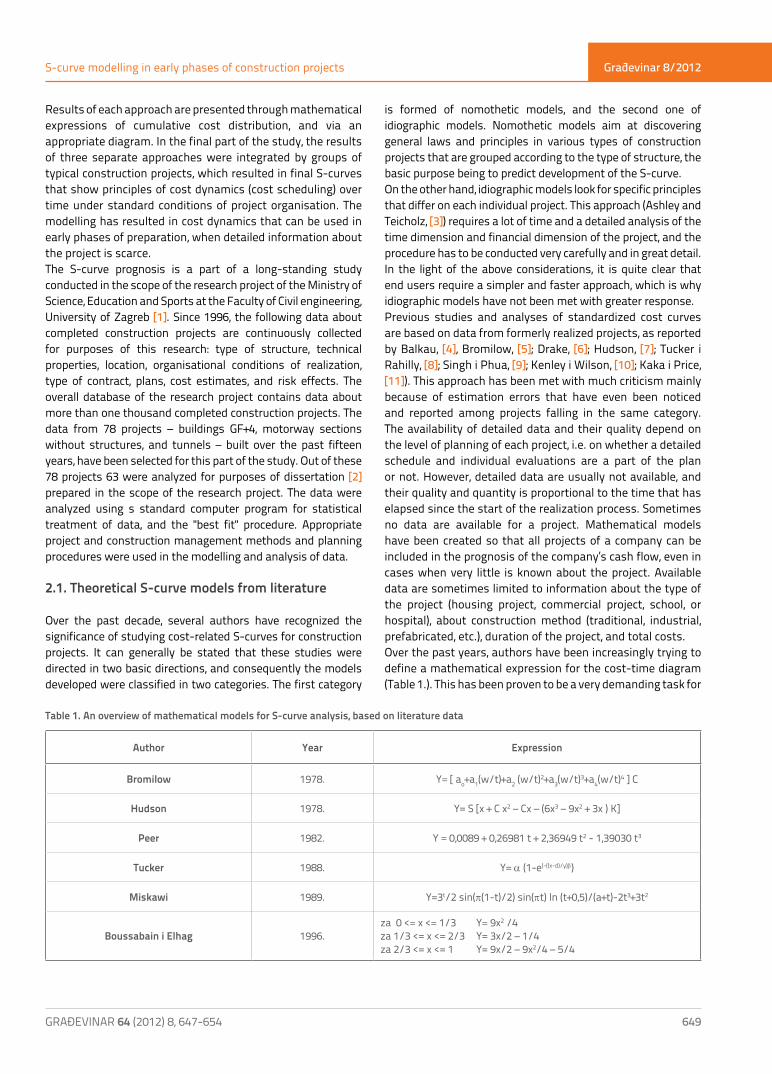
is formed of nomothetic models, and the second one of idiographic models. Nomothetic models aim at discovering general laws and principles in various types of construction projects that are grouped according to the type of structure, the basic purpose being to predict development of the S-curve.On the other hand, idiographic models look for specific principles that differ on each individual project. This approach (Ashley and Teicholz, [3]) requires a lot of time and a detailed analysis of the time dimension and financial dimension of the project, and the procedure has to be conducted very carefully and in great detail. In the light of the above considerations, it is quite clear that end users require a simpler and faster approach, which is why idiographic models have not been met with greater response.Previous studies and analyses of standardized cost curves are based on data from formerly realized projects, as reported by Balkau, [4], Bromilow, [5]; Drake, [6]; Hudson, [7]; Tucker i Rahilly, [8]; Singh i Phua, [9]; Kenley i Wilson, [10]; Kaka i Price, [11]). This approach has been met with much criticism mainly because of estimation errors that have even been noticed and reported among projects falling in the same category. The availability of detailed data and their quality depend on the level of planning of each project, i.e. on whether a detailed schedule and individual evaluations are a part of the plan or not. However, detailed data are usually not available, and their quality and quantity is proportional to the time that has elapsed since the start of the realization process. Sometimes no data are available for a project. Mathematical models have been created so that all projects of a company can be included in the prognosis of the company’s cash flow, even in cases when very little is known about the project. Available data are sometimes limited to information about the type of the project (housing project, commercial project, school, or hospital), about construction method (traditional, industrial, prefabricated, etc.), duration of the project, and total costs.Over the past years, authors have been increasingly trying to define a mathematical expression for the cost-time diagram (Table 1.). This has been proven to be a very demanding task for
Author Year Expression
Bromilow 1978. Y= [ ao+a1(w/t)+a2 (w/t)2+a3(w/t)3+a4(w/t)4 ] C
Hudson 1978. Y= S [x + C x2 – Cx – (6x3 – 9x2 + 3x ) K]
Peer 1982. Y = 0,0089 + 0,26981 t + 2,36949 t2 - 1,39030 t3
Tucker 1988. Y= a (1-e(-((x-d)/y)b)
Miskawi 1989. Y=3t/2 sin(p(1-t)/2) sin(pt) ln (t+0,5)/(a+t)-2t3+3t2
Boussabain i Elhag 1996.za 0 <= x <= 1/3 Y= 9x2 /4za 1/3 <= x <= 2/3 Y= 3x/2 – 1/4za 2/3 <= x <= 1 Y= 9x/2 – 9x2/4 – 5/4
Table 1. An overview of mathematical models for S-curve analysis, based on literature data
Građevinar 8/2012
650 GRAĐEVINAR 64 (2012) 8, 647-654
Nives Ostojić-Škomrlj, Mladen Radujković
a number of reasons, and so the "quest" for a universal solution is still under way. A typical diagram showing a cumulative cost/time analysis of a construction project is here reduced to the relationship of v = 100 % and t = 100 %. It is shaped as a letter S and has for that reason been named the S-curve. The Y variable represents the cumulative percentage of funds invested in construction, while the X variable represents the cumulative percentage of time needed for completion of the construction process. At the beginning of the project, when mobilization is in progress and when production resources are being organized, the costs are accumulating at a slow rate. Later on, when most resources have been engaged, the cost accumulates rapidly at a nearly constant rate (relatively flat line in the centre of the presentation). As the end of the project approaches, when builders complete their work, the cost accumulation decreases. Most mathematical models are based on this formulation. Three groups of construction projects have been adopted int his study: - buildings - tunnels - motorway sections
The basic conclusion that was reached during consultation of literature, and analysis of mathematical models proposed in literature, is that the models proposed by Tucker, Miskawia, Boussabain, and Elhaga, and partly the Huson DHSS model developed in British Department of Health and Social Security, are favourable for forecasting the cost dynamics for building, tunnelling and motorway construction projects. In case literature curves are considered in the coordinate system 100%/100%, the focus is on curve geometry, and so the results obtained can be used as proper basis even outside of the environment in which they were obtained.If all favourable curves, classified by groups, are taken from literature, and if their best approximation is made using the least-square method, then this results in curves that describe the first principle of distribution for each group of structures. Depending on the type of construction project, mathematical expressions for each of the literature-based S-curves are [2]:
Y i buildings = 0,00308724 + 0,29833094 xi + 0,01298652 xi2
+ 0,00012448 xi3 – 0,00000260 xi
4 + 0,00000001 xi5
Y i tunnels = 0,0022540801 + 0,3013256588 xi + 0,0190451810 xi2
+ 0,0000154346 xi3 – 0,0000022972 xi
4 + 0,0000000093 xi5
Y i motorway = 0,0022540801 + 0,3013256588 xi + 0,0190451810 xi2
+ 0,0000154346 xi3 – 0,0000022972 xi
4 + 0,0000000093 xi5
2.2. S-curve models based on projects in Croatia
Data from 78 projects realized in the Republic of Croatia [1], classified into one of three categories mentioned in Section 2.1, were adopted for purposes of this study. The first
category contains information about building construction projects, number of storeys: GF+4 (29 buildings). The second category is formed of data from tunnel construction projects (22 structures), while the third category contains data from civil engineering projects, namely motorway sections – only the route not including structures (27 sections). The projects included in this study were built over the past fifteen years, until 2010, and the main part of the study was realized during preparation of a doctoral thesis [2].The data on construction projects were compiled through surveys and by interviewing participants in construction work: contractors, supervising engineers, and clients. During compilation of data, the key elements were: - plan and parts of cost estimate (bill of quantities) - initial construction price - construction time defined in contract - real construction price - real construction time - reasons for non-respect of construction price - reasons for non-respect of construction time - monthly payment of completed work
In addition to basic information about the structures – type of structure, time of construction, contract-based and real construction costs, contract-based and real construction time – the survey also included collection of data about monthly (invoiced) construction costs, which served as basis for preparation of realistic cost-time curves for each of the completed projects. As expected, it came out that in most cases there is a discrepancy between the planned and real construction time, and between the contract-based and real construction costs. This is why the information about the influence of risk and changes was also collected in the course of the survey. The approach from previous studies [12, 13, 14] was applied in risk classification and analysis. The information about the source of risk, initiators, influences, and effects, was collected. Cost curves by project were defined by comparing initial plans and actual realization, and by analyzing deviations and action of individual risks over time. The alternative in which risk action is included depicts the real situation, although it should be noted that the analysis of actual cases has shown that the effects of some risks can be alleviated by better project management. This is why an additional analysis, with an assumed alternative project management that would alleviate risks, was conducted for each example. Thus, alternative cost curves, including subjective evaluations of the author of the paper, were obtained.Based on regression analysis of the sample (as in Section 2.1), mathematical expressions for S-curves of completed structures (including the risk action) can be presented as follows:
- for completed buildings/houses, GF+4
Y i P+4 = -0,0337623726 + 0,4038721032 xi - 0,0073410793 xi2
+ 0,0011063571 xi3 - 0,0000169230 xi
4 + 0,0000000719 xi5
(1)
(2)
(3)
(4)

Građevinar 8/2012
651GRAĐEVINAR 64 (2012) 8, 647-654
S-curve modelling in early phases of construction projects
- for completed tunnels
Y i tunnels = -0,1374996879 + 0,7939777374 xi - 0,0251265572 xi2
+ 0,0013158131 xi3 - 0,0000176112 xi
4 + 0,0000000717 xi5
- for completed motorway sections
Y i motorway = -0,1162250238 + 0,3217680288 xi +0,0653865104 xi2
- 0,0033289281 xi3 + 0,0000703337 xi
4 – 0,0000006271 xi5
+ 0,000000002 x6i
Mathematical expressions for S-curves of completed structures (with alleviated risk action) can be presented as follows:
- for completed buildings, GF+4
Y i P+4 = -0,0208063363 + 0,3755043598 xi - 0,0045063985 xi2
+ 0,0008679441 xi3 - 0,0000126806 xi
4 + 0,0000000506 xi5
- for completed tunnels
Y i tunnels = -0,1628419754 + 0,7232842752 xi - 0,0179868217 xi2
+ 0,006969348 xi3 - 0,0000073496 xi
4 + 0,0000000236 xi5
- for completed motorway sections, route without structures
Y i motorway =-0,1480284072 + 0,4323857594 xi - 0,0728915853 xi2
- 0,0037707534 xi3 + 0,00000790817 xi
4 - 0,0000000329 xi5
2.3. Standardized plan models prepared by experts
The need for preparing a standardized theoretical S-curve model is expressed in the introductory part of the paper. In this case the planner prepares a construction time schedule and a corresponding S curve based on some previously defined parameters (size of structure, cost estimate, technological realization of works). The procedure for preparing the time schedule of activities and financial schedule is the same for all three cases (building, tunnel, motorway section). Based on known data about work standards and work quantities for each of the three types of construction projects under study, a standard construction time schedule, presented via a Gantt chart, was prepared. Cost estimates were prepared for the said projects, and average prices of work were defined based on five bids. By integrating the progress schedule and cost estimate prices, we obtain cost plans, i.e. theoretical "S" curves for all three types of structures (absolute values of "t" and "v" are reduced to the scale of 100/100 for simplicity of calculation and to enable comparison). The standardized plans assume competent project management during realization, which also implies minimum expected negative risk action ranging from 0 to 5 % for time, and amounting to 0 % for costs.
The following time and cost scheduling values were obtained:
Building (GF+4) - total duration of works: 455 days, - total costs: HRK 10 million (1 EUR = 7.4 HRK), - quartile value: 1st quartile (14.95%), 2nd quartile (48.16%), and
3rd quartile (82.28%).
Tunnel - total duration of works: 304 days, - total costs: HRK 67 million, - quartile value: 1st quartile (18.43 %), 2nd quartile (64.38 %),
and 3rd quartile (90.33 %).
Motorway section (route, without structures) - total duration of works: 456 days, - total costs: HRK 172 million, - quartile value: 1st quartile (11.36 %), 2nd quartile (29.94 %),
and 3rd quartile (71.75 %).
According to analyses [2], mathematical expressions for S-curves of completed structures can be presented as follows:
- the following logistic curve (S-curve) proved to be the most favourable for the standardized model of a building (GF+4):
Yx
iP
x
+ =+
4 11101
0 612158 0 919930( , ( , ) )
- the best results were provided by the fifth degree regression polynomial for the standardized tunnel construction model:
Y i tunnels = 0,4336861615 -0,7431149611 xi + 0,0854180739 xi2
- 0,0012087464 xi3 + 0,0000064128 xi
4 – 0,0000000113 xi5
- the best results were provided by the sixth degree regression polynomial for the standardized construction model of a motorway section (route without structures):
Y i motorway = 0,2397713305 -0,7117306856 xi + 0,1250470242 xi2
- 0,0049603919 xi3 + 0,0000905844 xi
4 – 0,0000007270 xi5
+ 0,0000000021 xi6
3. Integrated procedure for defining prognostic S-curves of cost-time relationships
Mathematical expressions for the definition of cost-time relationships can be used in the modelling of prognostic S-curves for various types of structures (buildings, tunnels, motorway sections). In this study, the results were obtained by integration of three different approaches: - in the first approach, models were defined based on
proposals for presentation of theoretical cost-time relationships, as given in available literature,
(5)
(6)
(7)
(8)
(9)(10)
(11)
(12)
Građevinar 8/2012
652 GRAĐEVINAR 64 (2012) 8, 647-654
Nives Ostojić-Škomrlj, Mladen Radujković
- in the second approach, the modelling was conducted by detailed analysis of the planned and realized cost-time relationships, for a number of completed construction projects,
- in the third approach, the modelling was conducted by preparation of standardized models for project groups, which resulted in standardized curves showing cost-time relationships.
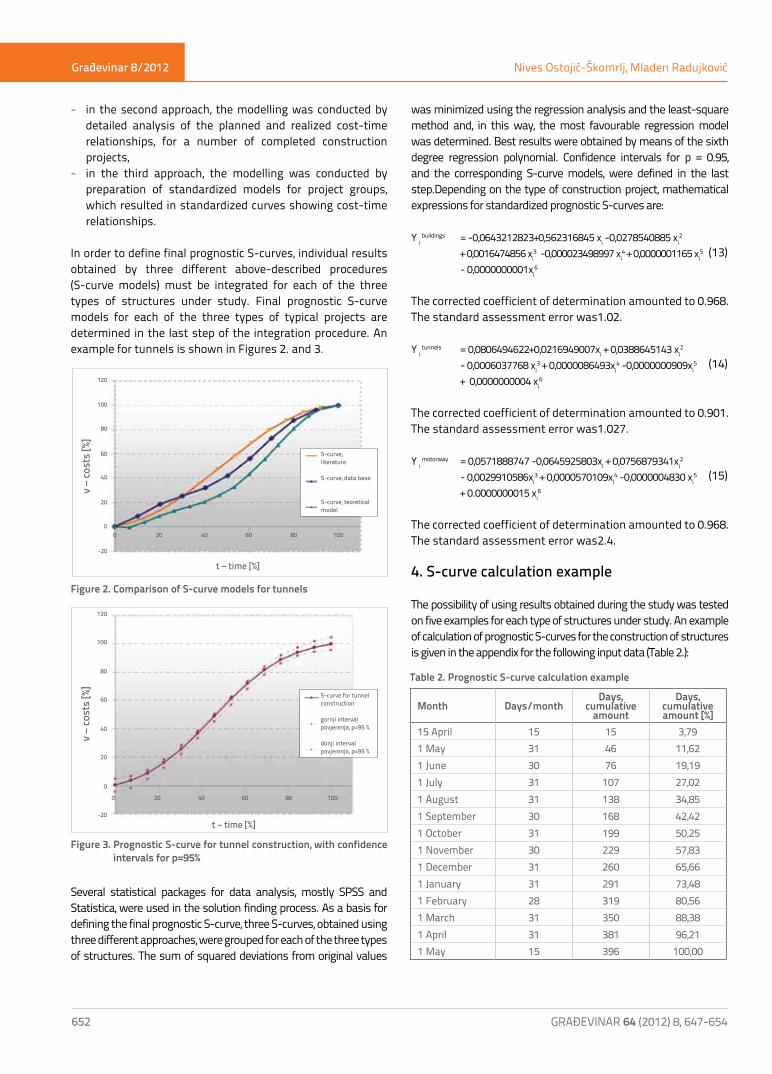
In order to define final prognostic S-curves, individual results obtained by three different above-described procedures (S-curve models) must be integrated for each of the three types of structures under study. Final prognostic S-curve models for each of the three types of typical projects are determined in the last step of the integration procedure. An example for tunnels is shown in Figures 2. and 3.
Figure 2. Comparison of S-curve models for tunnels
Figure 3. Prognostic S-curve for tunnel construction, with confidence intervals for p=95%
Several statistical packages for data analysis, mostly SPSS and Statistica, were used in the solution finding process. As a basis for defining the final prognostic S-curve, three S-curves, obtained using three different approaches, were grouped for each of the three types of structures. The sum of squared deviations from original values
was minimized using the regression analysis and the least-square method and, in this way, the most favourable regression model was determined. Best results were obtained by means of the sixth degree regression polynomial. Confidence intervals for p = 0.95, and the corresponding S-curve models, were defined in the last step.Depending on the type of construction project, mathematical expressions for standardized prognostic S-curves are:
Y i buildings = -0,0643212823+0,562316845 xi -0,0278540885 xi2
+ 0,0016474856 xi3 -0,000023498997 xi
4 + 0,0000001165 xi5
- 0,0000000001xi6
The corrected coefficient of determination amounted to 0.968. The standard assessment error was1.02.
Y i tunnels = 0,0806494622+0,0216949007xi + 0,0388645143 xi2
- 0,0006037768 xi3 + 0,0000086493xi
4 -0,0000000909xi5
+ 0,0000000004 xi6
The corrected coefficient of determination amounted to 0.901. The standard assessment error was1.027.
Y i motorway = 0,0571888747 -0,0645925803xi + 0,0756879341xi2
- 0,0029910586xi3 + 0,0000570109xi
4 -0,0000004830 xi5
+ 0.0000000015 xi6
The corrected coefficient of determination amounted to 0.968. The standard assessment error was2.4.
4. S-curve calculation example
The possibility of using results obtained during the study was tested on five examples for each type of structures under study. An example of calculation of prognostic S-curves for the construction of structures is given in the appendix for the following input data (Table 2.):
t – time [%]
v –
cost
s [%
]
-20
0
20
40
60
80
100
120
0 20 40 60 80 100
S-curve, literature
S-curve, data base
S-curve, teoretical model
t – time [%]
v –
cost
s [%
]
-20
0
20
40
60
80
100
120
0 20 40 60 80 100
S-curve for tunnel construction
gornji interval povjerenja, p=95 %
donji interval povjerenja, p=95 %
Month Days/monthDays,
cumulative amount
Days, cumulative amount [%]
15 April 15 15 3,791 May 31 46 11,621 June 30 76 19,191 July 31 107 27,021 August 31 138 34,851 September 30 168 42,421 October 31 199 50,251 November 30 229 57,831 December 31 260 65,661 January 31 291 73,481 February 28 319 80,561 March 31 350 88,381 April 31 381 96,211 May 15 396 100,00
Table 2. Prognostic S-curve calculation example
(13)
(14)
(15)
Građevinar 8/2012
653GRAĐEVINAR 64 (2012) 8, 647-654
S-curve modelling in early phases of construction projects
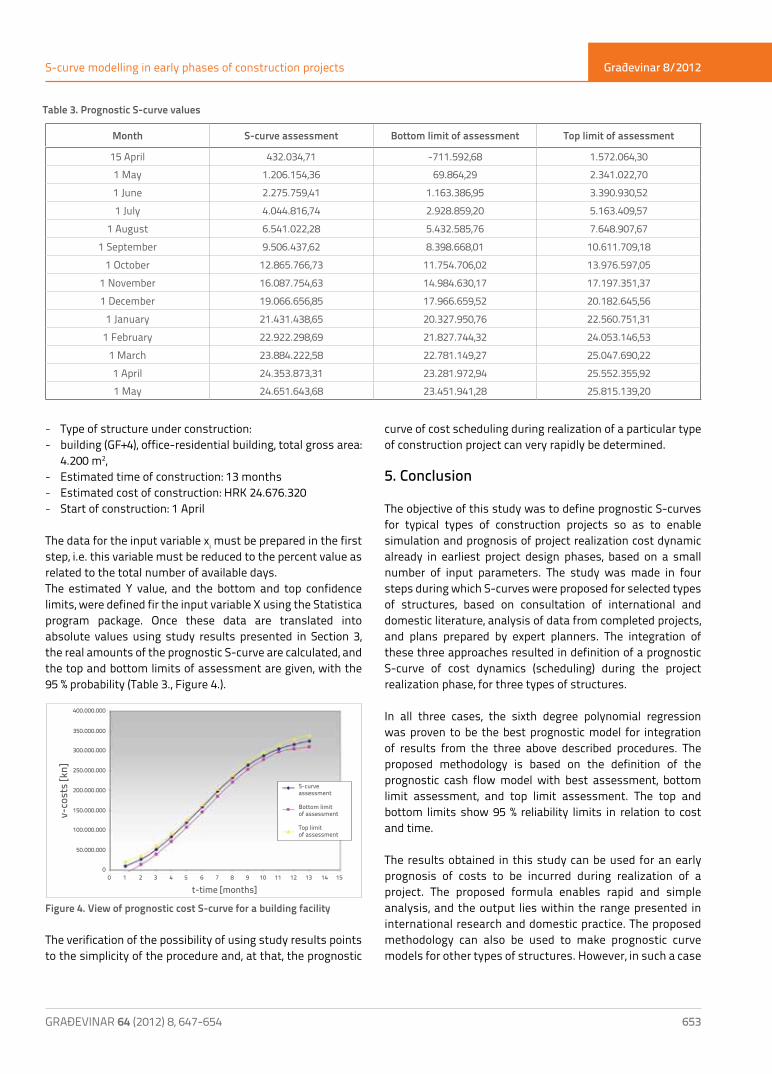
- Type of structure under construction: - building (GF+4), office-residential building, total gross area:
4.200 m2, - Estimated time of construction: 13 months - Estimated cost of construction: HRK 24.676.320 - Start of construction: 1 April
The data for the input variable xi must be prepared in the first step, i.e. this variable must be reduced to the percent value as related to the total number of available days.The estimated Y value, and the bottom and top confidence limits, were defined fir the input variable X using the Statistica program package. Once these data are translated into absolute values using study results presented in Section 3, the real amounts of the prognostic S-curve are calculated, and the top and bottom limits of assessment are given, with the 95 % probability (Table 3., Figure 4.).
Figure 4. View of prognostic cost S-curve for a building facility
The verification of the possibility of using study results points to the simplicity of the procedure and, at that, the prognostic
curve of cost scheduling during realization of a particular type of construction project can very rapidly be determined.
5. Conclusion
The objective of this study was to define prognostic S-curves for typical types of construction projects so as to enable simulation and prognosis of project realization cost dynamic already in earliest project design phases, based on a small number of input parameters. The study was made in four steps during which S-curves were proposed for selected types of structures, based on consultation of international and domestic literature, analysis of data from completed projects, and plans prepared by expert planners. The integration of these three approaches resulted in definition of a prognostic S-curve of cost dynamics (scheduling) during the project realization phase, for three types of structures.
In all three cases, the sixth degree polynomial regression was proven to be the best prognostic model for integration of results from the three above described procedures. The proposed methodology is based on the definition of the prognostic cash flow model with best assessment, bottom limit assessment, and top limit assessment. The top and bottom limits show 95 % reliability limits in relation to cost and time.
The results obtained in this study can be used for an early prognosis of costs to be incurred during realization of a project. The proposed formula enables rapid and simple analysis, and the output lies within the range presented in international research and domestic practice. The proposed methodology can also be used to make prognostic curve models for other types of structures. However, in such a case
Month S-curve assessment Bottom limit of assessment Top limit of assessment
15 April 432.034,71 -711.592,68 1.572.064,301 May 1.206.154,36 69.864,29 2.341.022,701 June 2.275.759,41 1.163.386,95 3.390.930,521 July 4.044.816,74 2.928.859,20 5.163.409,57
1 August 6.541.022,28 5.432.585,76 7.648.907,671 September 9.506.437,62 8.398.668,01 10.611.709,18
1 October 12.865.766,73 11.754.706,02 13.976.597,051 November 16.087.754,63 14.984.630,17 17.197.351,371 December 19.066.656,85 17.966.659,52 20.182.645,56
1 January 21.431.438,65 20.327.950,76 22.560.751,311 February 22.922.298,69 21.827.744,32 24.053.146,53
1 March 23.884.222,58 22.781.149,27 25.047.690,221 April 24.353.873,31 23.281.972,94 25.552.355,921 May 24.651.643,68 23.451.941,28 25.815.139,20
Table 3. Prognostic S-curve values
t-time [months]
v-co
sts
[kn]
400.000.000
350.000.000
300.000.000
250.000.000
200.000.000
150.000.000
100.000.000
50.000.000
00 1 2 3 4 5 6 7 8 9 10 11 12 13 14 15
S-curve assessment
Bottom limit of assessment
Top limit of assessment

Građevinar 8/2012
654 GRAĐEVINAR 64 (2012) 8, 647-654
Nives Ostojić-Škomrlj, Mladen Radujković
the potential user has to repeat a part of the procedure, use his own input data about completed structures, and engage experts for creation of standardized curves. The proposed methodology depicts a prognostic cost curve for good to average project realization conditions. It is obvious that
breakdowns or stoppages, influences of considerable risks, poor organization of work, frequent changes, etc., will greatly modify the form of a prognostic curve, in which case each project get a specific dynamics, represented by an irregularly shaped S-curve [14].
REFERENCES[1] Upravljanje rizikom i promjenama u projektno usmjerenom
građevinskom poduzeću, Znanstveni projekt, Ministarstvo znanosti , obrazovanja i športa RH, 2007-2012.
[2] Ostojić Škomrlj, N.: Modeliranje S-krivulje troškova u fazi koncipiranja građevinskog projekta, Disertacija, Sveučilište u Zagrebu, Građevinski fakultet, Zagreb, 2005.
[3] Ashley, D. B., Teicholz, P. M.: Pre-Estimate Cash Flow Analysis, Journal of the Constr. Div., Proceedings of the American Society of Civil Engineers, 102 (1977) 3, pp. 369-379.
[4] Balkau, R.: Cost control, International Journal of Project Management, 2 (1979), pp. 34-42.
[5] Bromilow, F. I., Davies, V. F.: Financial Planning and Control of Large Programs of Public Works, Proceedings of the CIB W65 Second Symposium on Organisation and Management of Construction. Haifa, Israel,(1978), pp. 119–134.
[6] Drake, B. E.: A Mathematical Model for Expenditure Forecasting Post Contract, Proceedings of the CIB W65 Second Symposium on Organisation and Management of Construction. Haifa, Israel, (1978), pp. 163–184.
[7] Hudson, K. W.: DHSS expenditure forecasting method, Chartered Surveyor – Building and Quantity Srweying Quarterly, 5 (1978), pp. 42-55.
[8] Tucker, S. N., Rahilly, M.: A Construction Cash Flow Model, Australian Institute of Building Papers, 3 (1988), pp. 87–99.
[9] Singh, S., Pua, W. W.: Cash Flow Trends for High Rise Building Projects, Proceedings of the 4th International Syposium on Organisation and Management of Contruction, Waterloo (Canada), (1984), pp. 841–854.
[10] Kenley, R., Wilson, O.: A Construction Project Cash Flow Model – An Ideograhic Approach, Construction Management and Economics, 4 (1986), pp. 213-232
[11] Kaka, A. P., Price, A. D. F.: Net Cashflow Models: Are They Reliable?, Construction Management and Economics, 9 (1991), pp. 291-308
[12] Radujković, M.: Upravljanje rizikom kod građevinskih projekata, Građevinar. 49 (1997), 5; pp. 247-255.
[13] Radujković, M., Burcar, I., Nahod, M. M.: Effective Project Risk Knowledge Management, Transformation through Construction - Joint 2008 CIB W065/W055 Commissions Symposium Proceedings, Dubai, 2008. pp. 156-157.
[14] Radujković, M. i suradnici: Planiranje i kontrola projekata, Sveučilište u Zagrebu, Građevinski fakultet, Zagreb, 2012.