jcu cyclone research - phase 2 report
TRANSCRIPT

The Cyclone Testing Station was established in 1977 and is an independently funded organisation focusing on sustainable and economical building practices to minimize loss and suffering as a result of high wind events.
CTS Report: TS1018
Version: 21 July, 2015
Suncorp Group Limited
Cyclone Resilience Research – Phase II
Report prepared by:
Daniel Smith and David Henderson
Cyclone Testing Station, JCU
Report reviewed by:
John Ginger
Cyclone Testing Station, JCU
Report prepared for:
Suncorp Group Limited
Cyclone Testing Station
College of Science, Technology and Engineering
James Cook University
Townsville Qld 4811 Australia
Telephone (07) 4781 4340
Email: [email protected]
www.jcu.edu.au/cts

2 of 56
Executive Summary
Housing vulnerability is a large contributor towards high claims costs for Suncorp, and the
subsequent premium affordability issues for consumers. Reducing this vulnerability will
decrease the risk associated with severe wind events, which can then be reflected in pricing for
consumers.
In 2014, Suncorp commissioned the Cyclone Testing Station (CTS) at James Cook University to
conduct a comprehensive study to enhance Suncorp’s understanding of the vulnerability of
houses in North Queensland to natural hazards, particularly tropical cyclones and thunderstorms.
The study involved the analysis of insurance claims for residential homes in North Queensland
(NQ) after Cyclone Yasi. Key drivers of cyclone-induced losses were identified in the Phase I
analysis. As a recent extension of that work, the current study (Phase II) builds on the Phase 1 by
estimating the reduction in losses based on retrofit and mitigation solutions for the typical loss
drivers.
The cost-benefit analysis was conducted through collaboration between Suncorp, CTS and
economic consultant Urbis. The primary objectives for the CTS Phase II report included the
following:
Identify a sample-set of mitigation solutions
Estimate the benefits of each solution (i.e. reduced loss) for a range of wind speeds
Estimate the cost of each solution
As Urbis conducted the economic modelling aspect of cost-benefit analysis, those results are not
discussed herein. Instead, the methodologies used to develop the basis of the cost-benefit model
are presented.
In addition, a literature review of mitigation programs used internationally is presented from a
consumer engagement perspective. The success/failures of these programs are identified (where
possible) and applicability to Northern Australia is emphasized.
Finally, conceptual frameworks for a mitigation program are presented, illustrating how the
process of inspections, reporting, mitigation and interaction with insurers may work.
Key Outcomes
Three mitigation solutions are presented based on the Phase I report
The report shows that there is scope for further development of these options and others (e.g.,
more aesthetic alternative to overbattens)
Based on a review of the literature and discussions with building industry, Northern Australia
is well poised to become a leader in resilience and mitigation
There is much that can be learned from other work abroad but regional aspects must be
considered
Estimation of Vulnerability
To estimate the benefits of the selected mitigation solutions, vulnerability of North Queensland
homes to cyclone-induced damages was estimated (before and after mitigation upgrade) based on
year of construction. Three groups were established (pre-1960s, 1960-80s, post-1980s) based on
typical construction trends in each era. Three mitigation solutions were analysed:
3 of 56
1. Structural roof upgrading (i.e. connection upgrades, etc.) (pre-1960s and 1960-80s only)
2. Opening protection (i.e. window shutters, roller door bracing, etc.)
3. Community preparedness (i.e. unblocking roof-gutters, removing shade coverings, etc.)
The cost of implementing mitigation solutions was estimated via component costs, claims data,
and scenario based estimates by selected builders and assessors.
Existing Mitigation Programs
Research found that the presence of coordinated, planned and implemented programs in
Australia with the aim of increasing homeowner engagement in mitigation strategies to
strengthen their home is lacking. Also a “one size fits all” approach to mitigation programs is not
appropriate as individuals are motivated by different incentives.
Programs must be appropriately marketed to individuals and communities based on identified
key motivators for engaging in mitigation strategies. These motivators will differ between
individuals and communities based on their level of experience with extreme weather events,
perceptions of risk and responsibility, connectedness and trust towards others and the availability
of assistance and resources. Research is needed to characterize key motivators for Northern
Australia communities so that a future mitigation program is efficient and optimized for
community engagement. A scope for this research is discussed.
Proposed Mitigation Programs
Based on the literature review and CTS experience as a long-term proponent for cyclone
mitigation practices, two conceptual frameworks for a mitigation program are outlined. The first
includes a more traditional approach where inspections are completed by a qualified inspector,
while the second makes use of smart-phone technologies allowing consumers to “self-assess”
with periodic “spot checks” for quality assurance and continued improvement to the process. An
effective mitigation program may also require a combination of the options considered.
Community Engagement Considerations
There is an opportunity for the whole community to benefit from an increased focus on
mitigation:
Homeowner – increased security during storm, promoted increase in house market value if
retrofits undertaken, reduction in insurance premiums
Government – reduction in drain on community services during and after severe event, more
resilient community
Industry – niche market for retrofitting and upgrading products as well as the building trades
to professionally undertake retrofitting

4 of 56
Table of Contents 1. Introduction ................................................................................................................................. 6
2. Background Information (Vulnerability Modeling) ................................................................... 7
2.1. Empirically-Based Vulnerability Relationships .................................................................. 8
2.2. Engineering-Based Vulnerability Relationships .................................................................. 9
2.3. Water Ingress ..................................................................................................................... 12
2.4. Method of Analysis for Current Study............................................................................... 14
3. Fragility Analysis based on Suncorp Data ................................................................................ 15
3.1. Overview ............................................................................................................................ 15
3.2. Mitigation Action #1 - Structural Roof Upgrades ............................................................. 16
3.2.1. Basic Structural Analysis Modeling ........................................................................... 16
3.2.2. Fragility Estimation .................................................................................................... 19
3.3. Mitigation Action #2 - Opening Protection ....................................................................... 20
3.3.1. Roller Doors ................................................................................................................ 20
3.3.2. Windows ..................................................................................................................... 21
3.4. Mitigation Action #3 – Community Preparedness ............................................................. 22
4. Damage Repair Cost Estimation ............................................................................................... 24
4.1. Category 2 (125-165 km/h) ................................................................................................ 24
4.1.1. Fence Damage ............................................................................................................. 24
4.1.2. Shade-Cloth Damage .................................................................................................. 24
4.1.3. Garage Door Damage ................................................................................................. 24
4.1.4. Wind Driven Rain Damage to Modern House ............................................................ 24
4.1.5. Gutter Loss to High-Set 1970s Home ......................................................................... 24
4.1.6. Roofing Damage to High-Set 1920s Home ................................................................ 25
4.2. Category 3 (165-224 km/h) ................................................................................................ 25
4.2.1. Garage Door Damage ................................................................................................. 25
4.2.2. Wind Driven Rain Damage to Modern House ............................................................ 26
4.2.3. Roofing Damage to Low-Set 1930s Home ................................................................. 26
4.2.4. Roofing Damage to High-Set 1970s Home ................................................................ 27
4.3. Category 4 (225-279 km/h) ................................................................................................ 28
4.3.1. Garage Door Damage ................................................................................................. 28
4.3.2. Wind Driven Debris Damage to Modern Home ......................................................... 28

5 of 56
4.3.3. Roofing and Wall Damage to Low-Set 1930s Home ................................................. 29
4.3.4. Roofing and Wall Damage to High-Set 1970s Home ................................................. 30
5. Retrofit Upgrade Cost Estimation ............................................................................................. 31
5.1. Cladding Replacement and Strapping of Roof Members .................................................. 31
5.2. Over-batten Installation (HB132.2) ................................................................................... 33
5.3. Opening Protection: Roller Door Upgrade ........................................................................ 35
5.4. Opening Protection: Window Protection ........................................................................... 35
6. Literature Review: Drivers of Community Engagement in Mitigation .................................... 36
6.1. Introduction ........................................................................................................................ 36
6.2. Facilitators of Preparedness Behaviour ............................................................................. 37
6.3. Existing Programs and Strategies for Increasing Preparedness ......................................... 40
6.3.1. Legislated Building Codes .......................................................................................... 40
6.3.2. Funding Opportunities for Homeowners .................................................................... 41
6.3.3. Insurance Premium Reductions .................................................................................. 42
6.3.4. Two Example Programs in USA................................................................................. 43
6.4. Communication with Target Communities ........................................................................ 44
6.5. Summary ............................................................................................................................ 45
6.6. Recommendations and Suggested Research ...................................................................... 45
7. Proposed Mitigation Program Framework................................................................................ 47
7.1. Option A: Formal Inspections ............................................................................................ 47
7.2. Option B: Self-Assessment ................................................................................................ 48
7.2.1. The Self-Assessment Form ......................................................................................... 48
7.2.2. A Mobile Application Tool for Self-Assessment ....................................................... 49
8. Summary and Recommendations ............................................................................................. 51
References ..................................................................................................................................... 53
Limitations
The Cyclone Testing Station (CTS) has taken reasonable steps and due care to ensure that the
information contained herein is correct at the time of publication. CTS expressly exclude all
liability for loss, damage or other consequences that may result from the application of this
report. This report may not be published except in full unless publication of an abstract includes
a statement directing the reader to the full report.

6 of 56
1. Introduction
The current mitigation-focused work builds on the Phase I study conducted by CTS and Suncorp
which analysed insurance claims from Cyclone Yasi to determine typical drivers of insured loss
(i.e. roofing failures, etc.) for residential housing. The scope of the current project (Phase II)
includes cost-benefit analysis of mitigation solutions selected as a result of loss drivers identified
in the Phase I work.
The CTS role in the cost-benefit analysis included engineering analysis to estimate the benefits
of selected mitigation options. Typical methods of vulnerability modelling are discussed in detail
to provide context for the empirical methodology selected for this study. The overall strategy
was to use the Suncorp Cyclone Yasi claims data (Phase I) to estimate the vulnerability of non-
mitigated structures. Then, using a structural engineering software package (SPACE GASS),
simplified roof systems were analysed with and without upgrading to estimate the relative
change in load at critical connections. This information was combined with survey results from
builders and assessors to estimate the reduced vulnerability of the same set of properties with
mitigation. The results were used to estimate the intensity and frequency of damage before and
after mitigation for a range of wind speeds. This information was provided to Urbis for economic
modelling.
A literature review of mitigation programs used internationally is also discussed with emphasis
on a consumer engagement perspective. Programs in Australia are discussed where possible,
however the majority of works originate from the cyclone-prone southeastern coast of the United
States. The applicability of these programs to a Northern Queensland context is emphasized.
Based on the literature review, a research schema is proposed to identify drivers of mitigation
action in Northern Queensland homeowners in order to optimize the effectiveness of a future
mitigation program.
Finally, conceptual frameworks for a mitigation program in Northern Queensland are discussed.
A more traditional approach is presented, utilizing qualified personnel to perform inspections.
Alternatively, a more contemporary approach is discussed, making use of smart-phone
technologies to educate homeowners about mitigation and efficiently transfer information back
to insurers and researchers.

7 of 56
2. Background Information (Vulnerability Modeling)
Performance modeling of buildings during extreme natural hazards has become an essential part
of modern catastrophe insurance analysis, and is largely related to the development of
performance based design in structural engineering. Modern insurance catastrophe models are
typically comprised of a series of sub-models that produce probabilistic estimations for: (1) the
occurrence of an event, (2) the associated hazards, (3) the properties of interest in terms of
characteristics deemed to affect their vulnerability to damage, and (4) the vulnerability of
particular sets of building characteristics in terms of predicted insured loss (i.e. vulnerability
model) as a function of the associated hazards of the event (Walker 2011).
Most commercial catastrophe models used in the insurance industry utilize vulnerability models
based primarily on an empirical approach originally developed by Friedman (1975). He
developed a procedure for estimating probable maximum insurance losses from hurricanes in
which the vulnerability curves were developed from superimposing the estimated contours of
maximum wind speeds from actual events on maps of the portfolio of the insurance company
which had been exposed to the event. The vulnerability curves were derived by analyzing the
ratio of an individual property’s loss to its insured value. This ratio was termed the damage loss
ratio, and was computed as a function of the estimated maximum wind speed which the
individual properties had experienced.
Insurance vulnerability models for wind are meant to simulate the pattern of wind damage
arising from a separately defined wind field. The most common method of expressing damage is
by the cost of repairing or replacing the damaged building. Vulnerability models do not generally
provide accurate simulation of damages to individual properties but rather they are expected to
simulate the overall pattern of damage to the entire population of properties exposed to the wind
event in terms of major statistical characteristics. Typically this pattern may be represented for a
particular building classification by a plot of the observed damage loss ratio of individual
properties versus the maximum wind speed experienced by them, where the damage loss ratio is
the ratio of damage repair costs to the replacement cost of the property.
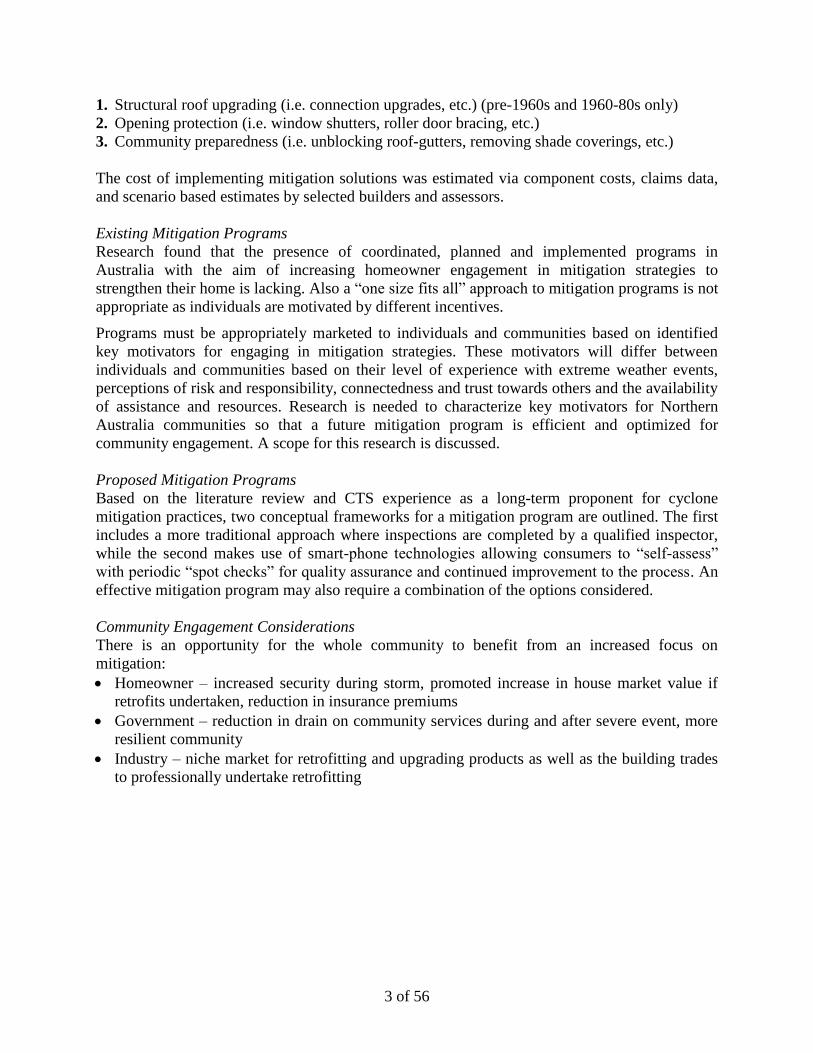
Figure 1 gives an example of loss ratio versus increasing wind speed for a fully engineered steel
structure building and a residential house. The broader foot of the residential curve (Walker)
indicates a greater variability in performance than that of the steeper engineered curve.
8 of 56
Figure 1. Example of “vulnerability” curves: An increasing damage ratio with increasing wind
speed (Holmes 2007)
2.1. Empirically-Based Vulnerability Relationships
Vulnerability models used by the insurance industry are primarily empirical models based on
fitting curves to damage data at individual building level, generally as a damage loss ratio, as a
function of wind speed estimates for the given location. This approach relies on large amounts of
loss data. Separate models are developed for various building classifications (i.e. single family
dwelling, multi-story reinforced concrete, timber frame, etc.). Often there is sufficient data on all
buildings to establish a general curve but insufficient data to produce individual curves based on
data for individual building types alone. In these cases empirical models are derived for a few
broad building classifications, with allowance for modification for differences within the broad
classification that have been observed to result in increases or decreases in damages, based on
both expert opinion and statistical analysis. Khanduri and Morrow (2003) present a good
example of this approach.
The most extensive development of empirical vulnerability models utilizes the relatively large
amount of data for hurricane losses in the US. Development of models for other countries has
been more difficult due to relatively smaller amounts of data on losses from severe weather
events. Further, direct application of US models in other countries is difficult due to differing
forms of construction, building regulations, construction quality, etc. Adding to the complexity,
standards of building construction often change in response to observed damage trends after a
severe event which ties loss data to the set of standards used in a that time period.
An approach used commonly outside the US has been to assume the shape of US based
vulnerability curves for building types that are considered to be similar, with adjustment to fit
available data on losses or by utilizing engineering judgment and expert opinion. A similar
approach was used in Northern Australia in the 1990s by modifying the Sparks and Bhindarwala

9 of 56
(1993) model for Hurricane Andrew to produce estimates of loss from Cyclones Tracy and
Althea that were similar to recorded values for losses from these events.
The advantage of empirical models is that they inherently incorporate many of the uncertainties
in the relationship between damage loss ratio and wind speed, especially if based on data from
several different events for a similar type of building construction. For example, in the US where
hurricane damage is relatively frequent in the same areas, or in areas of similar forms and
standards of building construction and where hundreds of thousands of individual records of
insurance loss data have been accumulated in recent years, it is expected that modelers with
access to this data would be able to produce relatively reliable empirical models for estimating
insurance losses for this area. The weakness of these models lies in their lack of applicability to
other regions due to differences in construction standards.
Another typical issue with empirical models is the accuracy at higher wind speeds as the data is
generally sparse at the high end of the scale because high-wind events are relatively uncommon.
Consequently empirical models are generally more accurate at lower wind speeds. This has
implications to estimating losses for extreme winds. Varying construction costs also introduce
further uncertainty.
Outside of the limited areas where large loss information data sets are available, empirical
vulnerability models are relatively unreliable, making them the most unreliable component of the
overall catastrophe loss model. However, being based directly on insurance loss data they can
still provide very useful information for computing insurance risk provided they are primarily
used for aggregating risk as opposed to calculating the specific risk at a local level.
2.2. Engineering-Based Vulnerability Relationships
Engineering based vulnerability relationships rely on estimations of damage level for different
hazards based on scientific engineering knowledge of the structural and material behaviors of
building components and then estimations for cost of repairing that damage. This methodology
relies on a high level of understanding of the mechanics of wind flow around a structure and the
resultant forces on different building components including time dependent effects (e.g., fatigue
loading) and redistribution of forces after local building element failures. Vickery, Lin, et al.
(2006) and Vickery, Skerlj, et al. (2006) review the basic elements that should be included for
the development of fully engineering based vulnerability relationships.
Even if the objective is a deterministic vulnerability model, its development should be
undertaken in a probabilistic manner because of the non-linearity of the relationships between
wind speed and wind loads, and between wind loads and damage (Walker 2011). The
consequence of these non-linear relationships is that actual mean damage loss can be much
greater than that estimated based solely on the estimated mean wind speed and mean building
response.
There is also considerable uncertainty associated with the estimation of actual wind loads on a
structure based on a given wind speed and angle of incidence. These loads vary based on housing
construction, surrounding terrain, cladding elements, building height, etc. Partial damages (i.e.
failure of door/window) and wind borne debris can also have dramatic effects on load magnitude

10 of 56
and damages, and can only be modelled in a probabilistic sense. Because of these uncertainties,
the development of fully engineered vulnerability models is a very difficult task that requires
large amounts of research on wind load interactions with buildings and the associated structural
responses. There has been quite a bit of research completed to date but the focus has been more
so on improving design parameters rather than estimated building losses (Walker 2011).
Several approaches to developing engineering based vulnerability relationships have been
explored over the last four decades (Hart 1976; Stubbs and Boissonnade 1993; Chiu 1994),
however, Sciaudone et al. (1997) and Unanwa et al. (2000) are considered landmark papers in
this field. While earlier papers were deterministic, both Sciaudone et al. (1997) and Unanwa et al.
(2000) incorporated the probabilistic nature of the problem. These models still incorporated a
large amount of expert engineering judgment where statistical knowledge of the components was
not available; however, they represented a great step forward and set the framework for
subsequent research in this field.
Pinelli et al. (2004) developed a vulnerability model in Florida for the Florida Public Hurricane
Loss Model (FPHLM) based on the work of Unanwa et al. (2000). A follow-up paper (Pinelli et
al. 2008) describes how the model was calibrated against recorded loss data from Hurricane
Andrew and then the three damaging hurricanes that crossed Florida in 2004. This paper also
provides insight into the model including allowances for contents losses and different building
standards.
Vickery et al (2006a, 2006b) describe the methods used in development of the HAZUS hurricane
model for the US Federal Emergency Management Agency (FEMA). These papers provide a
comprehensive overview of what is likely the most well developed engineering based
vulnerability model to date. Included is the modelling of debris damage, internal pressurization
due to building envelop failure, contents loss as a result primarily of water damage, and
modelling of associated rainfall.
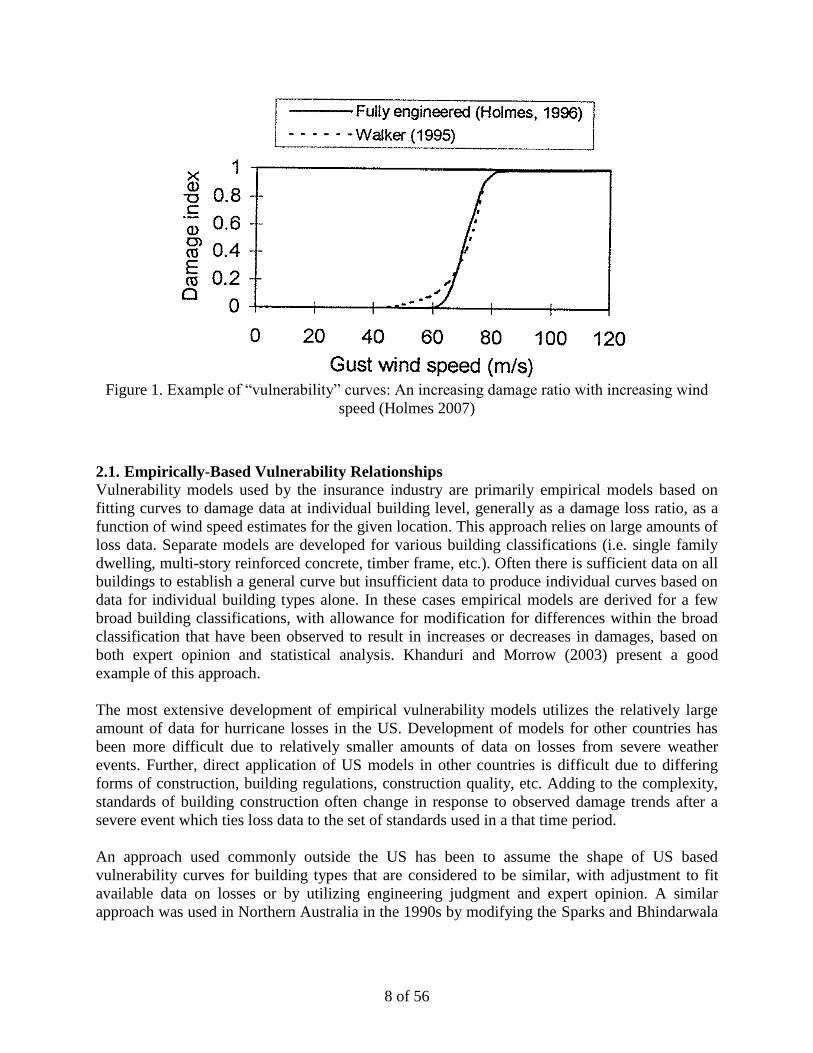
Henderson and Ginger (2007) provide an example of this approach applied to the development of
a vulnerability model for a typical Australian house built prior to current building standards and
included consideration of progressive failure and the effects of windborne debris and internal
pressurization. For example (Figure 2), analysis was conducted for a structure that began in an
undamaged state and depending on the probability of failure of the difference building
components damage and ultimately failure could progress via roof or wall structure of pier
(stump) failure. Reasonable agreement was found when comparing recorded information from
damage surveys undertaken following major tropical cyclones that have impacted northern
Australia.
11 of 56
Figure 2. Possible damage propagation paths for Pre-1980s high-set house model (Henderson
and Ginger 2007)
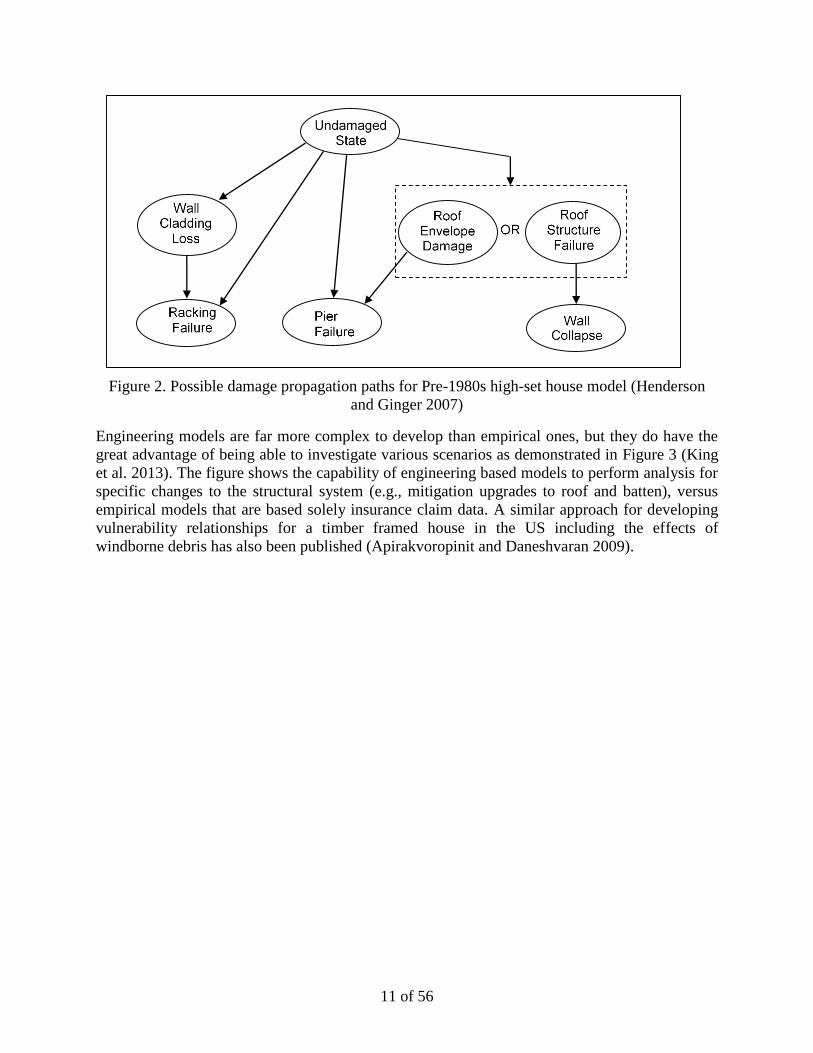
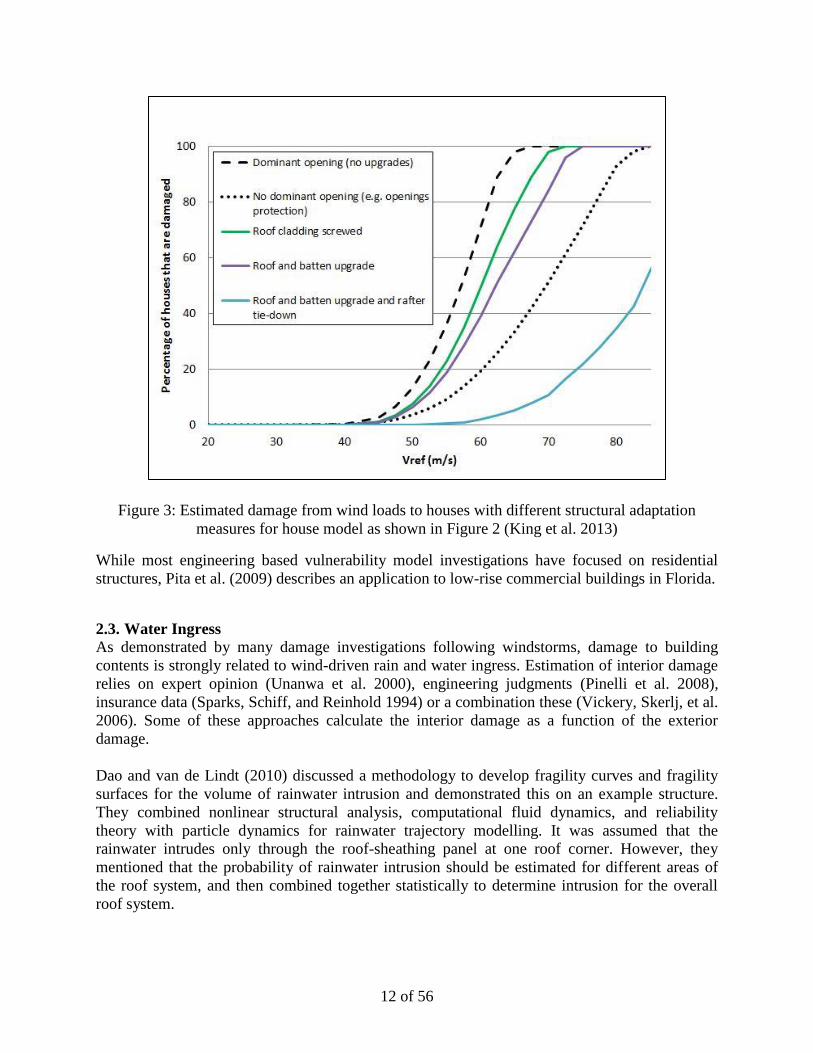
Engineering models are far more complex to develop than empirical ones, but they do have the
great advantage of being able to investigate various scenarios as demonstrated in Figure 3 (King
et al. 2013). The figure shows the capability of engineering based models to perform analysis for
specific changes to the structural system (e.g., mitigation upgrades to roof and batten), versus
empirical models that are based solely insurance claim data. A similar approach for developing
vulnerability relationships for a timber framed house in the US including the effects of
windborne debris has also been published (Apirakvoropinit and Daneshvaran 2009).
12 of 56
Figure 3: Estimated damage from wind loads to houses with different structural adaptation
measures for house model as shown in Figure 2 (King et al. 2013)
While most engineering based vulnerability model investigations have focused on residential
structures, Pita et al. (2009) describes an application to low-rise commercial buildings in Florida.
2.3. Water Ingress
As demonstrated by many damage investigations following windstorms, damage to building
contents is strongly related to wind-driven rain and water ingress. Estimation of interior damage
relies on expert opinion (Unanwa et al. 2000), engineering judgments (Pinelli et al. 2008),
insurance data (Sparks, Schiff, and Reinhold 1994) or a combination these (Vickery, Skerlj, et al.
2006). Some of these approaches calculate the interior damage as a function of the exterior
damage.
Dao and van de Lindt (2010) discussed a methodology to develop fragility curves and fragility
surfaces for the volume of rainwater intrusion and demonstrated this on an example structure.
They combined nonlinear structural analysis, computational fluid dynamics, and reliability
theory with particle dynamics for rainwater trajectory modelling. It was assumed that the
rainwater intrudes only through the roof-sheathing panel at one roof corner. However, they
mentioned that the probability of rainwater intrusion should be estimated for different areas of
the roof system, and then combined together statistically to determine intrusion for the overall
roof system.

13 of 56
Pita et al. (2012) proposed a new approach based on an estimation of rain entering through
envelope breaches and building deficiencies. Their approach consists of three steps: (1)
estimation of the rain impinging on the building, (2) computation of wind-driven rain inside the
building, and (3) conversion of the water ingress to interior damage. A flowchart of their detailed
model is shown in Figure 4 with an example of model output shown in Figure 5. This approach
has also been implemented in the Florida Public Hurricane Loss Model (FPHLM) (Hamid et al.
2010). However, these models have not yet been validated due to limited availability of full scale
studies and insurance claim data.
Figure 4. Flowchart of interior damage probabilistic model by Pita et al. (2012)

14 of 56
Figure 5. Relative contribution of each envelope component to “amount” of water ingress for
increasing wind speeds by Pita et al. (2012)
2.4. Method of Analysis for Current Study
An empirical based analysis has been employed for the derivation of loss for increasing wind
speeds for selected “generic” house types. The analysis uses the Suncorp policy and claims data
from TC Yasi period (both policies with claims and without claims). The use of such data for
modelling does not take into account ongoing incremental improvements to new buildings (i.e.
changes to the garage door standard and roof tile Australian Standards should result in reduced
damage to new housing with these components).
15 of 56
3. Fragility Analysis based on Suncorp Data
3.1. Overview
A computer algorithm program was developed to perform fragility analysis for the Phase II work.
Using Suncorp policy data from TC Yasi as a proxy for future performance of the greater
Queensland cyclone region coastal population, proportions of homes expected to incur varying
levels of loss for a given wind speed were estimated for four mitigation actions:
1. No mitigation upgrading
2. Structural roof upgrading (applies to pre-60s and 1960-80s housing)
3. Opening protection for windows and roller doors (applies to all housing ages)
4. Community preparedness upgrades (applies to all housing ages)
The effect of combinations of each mitigation upgrade (items 2-4 above) were also estimated.
The program was written based on five variables from the Suncorp data including:
Age of construction (in three bins: pre-1960, 1960-80s, post-1980)
Estimated wind speed during TC Yasi (km/h)
Sum insured value ($)
Claim value ($, includes null claims)
Loss ratio (computed as Claim value / Sum insured value)
From the unaltered Suncorp data, a baseline performance case for non-mitigated structures (item
1 above) was generated by assuming that policies had not been upgraded (by the methods above)
prior to TC Yasi. At each of six wind speed ranges (60-100, 100-120, 120-150, 150-180, 180-
210, 210-240 km/h), the proportion of homes within four loss ratio groups (0, 0-0.1, 0.1-0.5,
>0.5) were determined for each of the three housing age groups.
The effects of mitigation were simulated by modifying claim values in the original data set, and
re-evaluating proportions of homes falling into the various loss ratio groups. The criteria for
modifying claim values were dependent on the type of mitigation action, age of construction,
estimated wind speed, and loss ratio (as an indication of more/less extreme damage modes). The
criteria and assumptions used for applying modifications are detailed in the following sections.
Statistical assumptions (see Table 2, Table 3, Table 4) for “Proportions of claims affected” (e.g.,
the proportions of policies with avoided damage, i.e. mitigated loss) are estimated based on
damage modes extracted from assessor’s reports from Cyclones Yasi and Larry (Table 1).
Format and content were non-uniform across the selected reports (e.g., if a report didn’t mention
roofing damage, it does not mean that roofing damage did not occur).
The number of available reports on claims with high loss ratios was limited (see Table 1), with
care therefore being needed in the extrapolation of statistics from these samples to larger claims
sets in the fragility analysis. However, these values provide a baseline from which higher a
fidelity analysis could be built.
16 of 56
Table 1. Damage modes (by word mention) from claim assessor’s reports for Cyclones Yasi and
Larry grouped by loss ratio and analysis region
Loss
Ratio
Cyclone/
Region
# of
Claims Tree Roof Window Ceiling
Roller
Door
Water
Damage
0-.09 TC Yasi/
Townsville 157 21% 31% 15% 17% 2% 30%
0.1-.49 TC Yasi/
Townsville 9 22% 89% 33% 67% 0% 78%
0.1-.49 TC Larry/
Innisfail 43 14% 91% 67% 56% 16% 88%
>= 0.5 TC Larry/
Innisfail 13 15% 100% 77% 69% 31% 92%
>= 0.5 TC Yasi/
N. QLD 13 31% 100% 85% 100% 8% 100%
3.2. Mitigation Action #1 - Structural Roof Upgrades
Damage to the roofing structure is a well-known driver of loss during cyclones and other high-
wind events. In addition to direct loss, roofing damage often leads to water ingress and additional
wind-borne debris. The basic engineering design principles for wind loads on roofing structures
require that each element of the system (i.e. cladding, battens, and rafters) be connected to each
other and to the foundation of the structure through supports in the wall system. This design
configuration is meant to ensure that wind loads on cladding elements are transferred to the
supporting members below (i.e. battens, rafters) and on to the stronger foundation region of the
house.
Roofing failures generally occur when one or more of the connections in the system fails.
Contemporary housing is generally constructed with stronger connections than legacy housing
(pre-1980s) due to enhanced building standards. Therefore, Mitigation Action #1 is focused on
the following roofing connection upgrades in pre-1960s and 1960-80s housing:
1. Strapping at batten/rafter and ridge connections (pre-1960s and 1960-80s)
2. Collar ties between rafters (pre-1960s)
3. Vertical tension members between rafters and ceiling joists (1960-80s)
3.2.1. Basic Structural Analysis Modeling
In order to quantify basic estimates for the performance increase achieved by structural roof
upgrading, simple structural analysis models were generated for Pre-1960s and 1960-80s typical
roofing shapes using a structural engineering software package (SPACE GASS). Using SPACE
GASS, before -and after- upgrade versions of a simple two-dimensional roof systems were
subjected to wind uplift loads based on approximations from AS/NZS 1170.2. As severe roofing
failures typically occur due to failed connections (e.g., batten/rafter, ridge, etc.), the mitigation

17 of 56
upgrades are designed to disperse loading throughout the roofing structure and down to the
foundation supports, thus reducing the concentrated loads at critical connections.
The upgrades also strengthen the load capacity of critical connections (via strapping). The
combination of these effects creates a situation where the strength of connections are increased
AND the load they are required to resist is decreased.
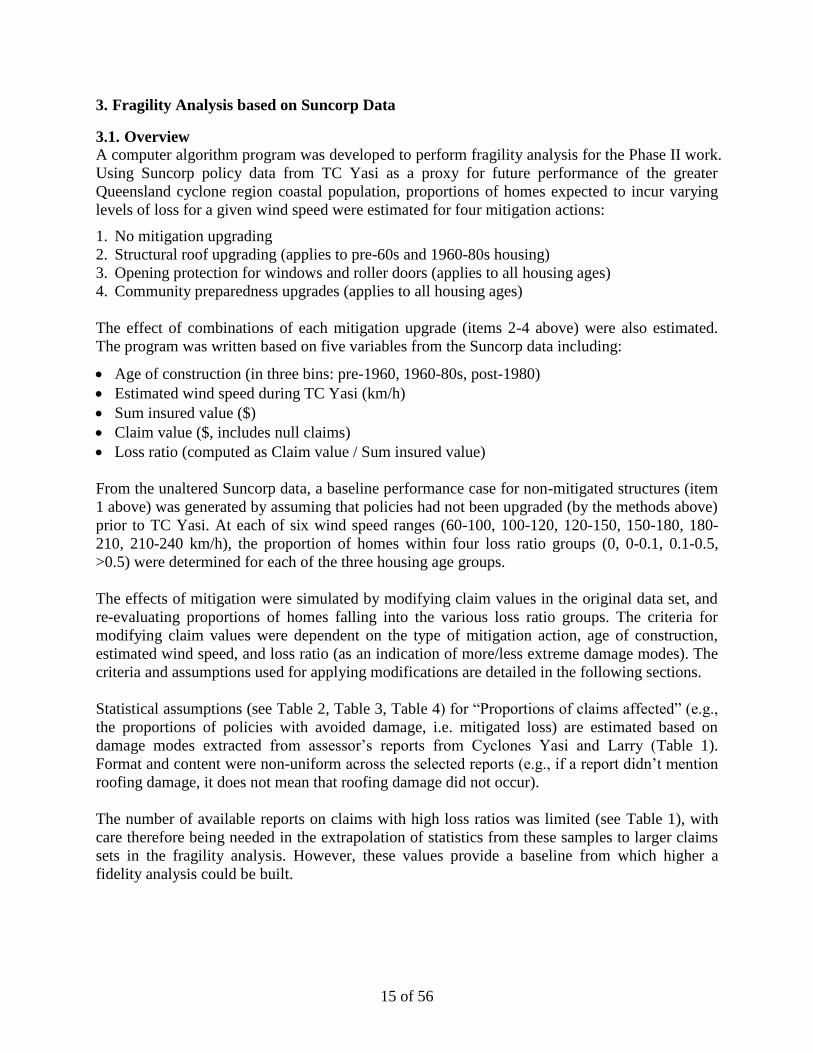
Pre-1960s roofing structures (Figure 6 and Figure 7) generally consist of high-slope, pitched
frame hip construction (see Phase I report). The mitigation upgrades selected for this roofing
type include additional strapping at batten/rafter and ridge connections as well as collar ties to
join rafters (where not already installed).
Figure 6. Arrangement for typical pitch frame construction (Source: AS1684.3)
18 of 56
Figure 7. Example of typical pitch frame construction (pre-1960s)
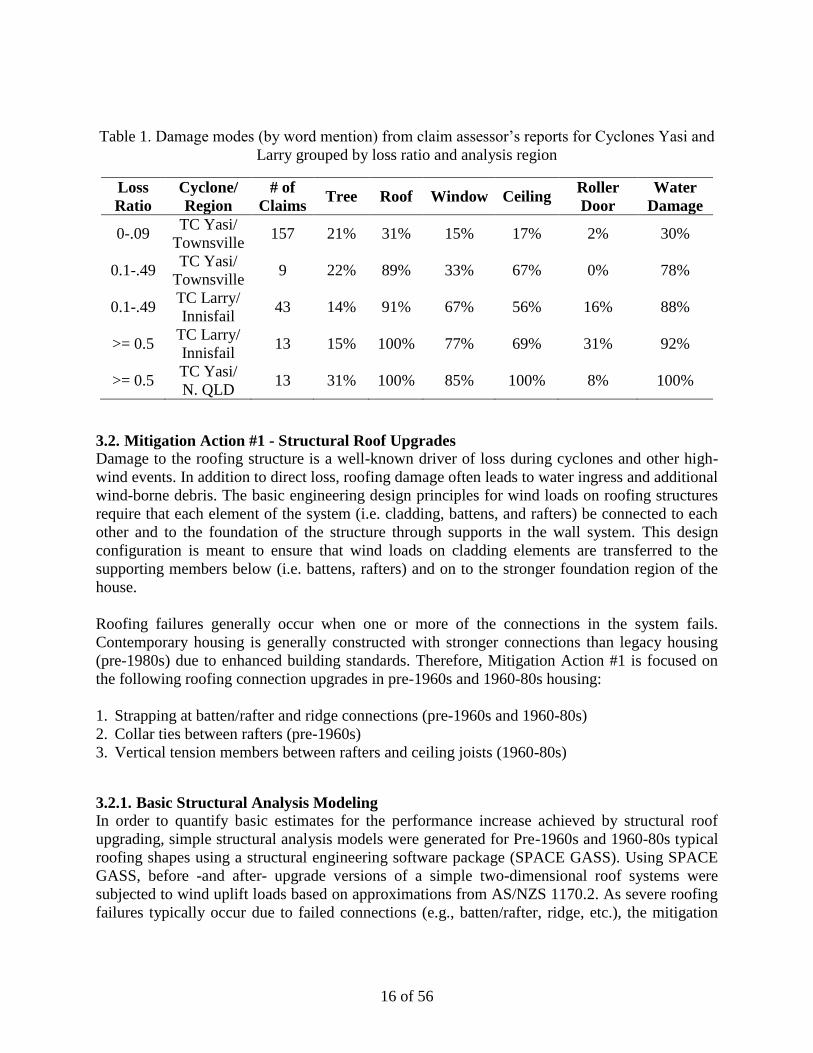
Roofing structures from the 1960-80s (Figure 8) generally consist of low-slope, pitched frame
gable construction (see Phase I report). The mitigation upgrades selected for this roofing type
include additional strapping at batten/rafter and ridge connections as well as tension members to
join rafters down to ceiling joists.
Figure 8. Basic structural analysis modeling of before (top) and after (bottom) upgrading a
typical 1960-80s roofing structure

19 of 56
To estimate the performance benefits of upgrading, the loads at the rafter/batten interface (a
critical connection for wind uplift) were estimated for a range of wind speeds (10 m height,
suburban terrain) both before and after the upgrades. The performance trends are shown in
Figure 9.
Figure 9. Estimated uplift load trends at batten/rafter connections for Pre-1960s and 1960-80s
housing before and after structural roofing upgrades
3.2.2. Fragility Estimation
In order to simulate the effects of these upgrades during Cyclone Yasi, educated assumptions
were made about the likelihood of roofing failure and severity of loss, based on the wind speed
and loss ratio of any given policy in the Suncorp data set. These assumptions were used to form
criteria for modifying policy claim values based on the estimated loss mitigation resulting from
the upgrade. From the Phase I report (see Table 1) on Suncorp claims data from Cyclone Yasi,
the following statistical assumptions were made for claims with pre-1960s and 1960-80s
housing:
• 30% in the lowest wind band (80-145 km/h) and in the lowest loss ratio band (0-0.1) had
minor roofing damage
• 40% in the medium wind band (145-170 km/h) and in the lowest loss ratio band (0-0.1) had
minor roofing damage
• 50% in the highest wind band (>170 km/h) and in the lowest loss ratio band (0-0.1) had minor
roofing damage
• 90% in the low/medium wind speed bands and the medium loss ratio band (0.1-0.5) had
moderate roofing damage
• 100% in large loss ratio band (>=0.5) had severe roofing damage
From these assumptions, and correspondence with claims assessors in Queensland, the criteria
for reducing claim values (i.e. simulating loss mitigation) in the Suncorp data set were
established. Specifically, the mitigated loss value (claim reduction value in $) and the proportion

20 of 56
of policies it applies to were estimated for various combinations of wind speed and loss ratio
(Table 2).
Table 2. Applied criteria for reducing claim values based on structural roofing mitigation
upgrades (applies to pre-1960s and 1960-80s housing)
Wind Speed
(km/h) Loss Ratio (%)
Proportion of
Claims Affected Mitigated Loss ($)
80-145
<10 30% 2,000
10-50 90% 25,000
>50 100% 70,000
145-170
<10 40% 2,000
10-50 90% 30,000
>50 100% 100,000
>170
<10 50% 2,000
10-50 90% 70,000
>50 100% 150,000
3.3. Mitigation Action #2 - Opening Protection
Damage to openings in the external shell of a building (e.g., windows, roller doors, etc.) during
cyclonic or severe storm events often exposes the interior of the home to both wind and water
ingress. Wind flow into the building can create positive internal pressure, adding to the overall
loads on cladding elements (i.e. roofing, etc.) and increasing the likelihood of roofing or other
failures.
Water ingress into the building can cause extensive damage to building contents and is well-
known to dramatically increase insurance losses. Mitigation Action #2 is focused on reducing the
likelihood of these damages by protecting vulnerable openings (i.e. windows, roller doors) from
wind-borne debris impact and pressurized water ingress. The types of mitigation upgrades that
can be used to protect windows differ from those of roller doors and thus the two upgrades are
discussed in separate sections below.
3.3.1. Roller Doors
Roller door failures generally occur due to loads generated by wind-induced pressures. At lower
wind speeds, damage is typically limited to buckling failure. However, at higher wind speeds
buckled doors can become dislodged from tracks, causing additional damage to the surrounding
structure and becoming wind-borne debris in some cases. To mitigate these damages, the
upgrade model for roller doors includes aftermarket bracing to retrain the door from buckling in
either the inward or outward direction.
Based on construction experience in Queensland, the CTS estimates that approximately ~20% of
Pre-1960s and 1960-80s housing is equipped with a roller door. Alternatively, ~90% of Post-
1980s housing are equipped with a roller door. Therefore, the mitigation benefits of roller door
upgrades were applied to these proportions of claims for each age group. For example, of all the

21 of 56
Suncorp claims for Post-1980s housing, a random subset including 90% of those claims was
selected, to which the mitigation criteria in Table 3 were applied. From the Phase I report (see
Table 15) on Suncorp claims data, the following statistical assumptions were made to form the
mitigated loss criteria:
• 2% in the low loss ratio band (0-10%) had roller door damage
• 15% in the medium loss ratio band (10-50%) had roller door damage
• 30% in the high loss ratio band (>50%) had roller door damage
Table 3. Applied criteria for reducing claim values based on roller door mitigation upgrade
(applies to all housing ages)
Wind Speed
(km/h)
Loss Ratio
(%)
Proportion of
Claims Affected
Mitigated Loss
($)
80-145
<10 2% 1500
10-50 15% 1500
>50 30% 1500
145-170
<10 2% 3000
10-50 15% 5000
>50 30% 5000
>170
<10 2% 3000
10-50 15% 8000
>50 30% 10000
3.3.2. Windows
Window-related damage modes may include direct damage from wind-borne debris, which can
also increase the likelihood of roofing failure from internal pressure increases, and water ingress
damage to the building walls and contents from poor window casing or sealing performance. The
primary damage mode varies by wind speed, the amount of wind-borne debris or rain, etc.
For modeling, the window mitigation upgrade was assumed to effectively reduce the loss
associated with each of these damage modes, the positive benefits of which increase with wind
speed. The upgrades include plywood covering (installed DIY) and commercially available
shuttering systems. From the Phase I report (see Table 15) on Suncorp claims data, the following
statistical assumptions were made to form the mitigated loss criteria:
• 15% in the low loss ratio band (0-10%) had window related damage
• 50% in the medium loss ratio band (10-50%) had window related damage
• 80% in the high loss ratio band (>50%) had window related damage

22 of 56
Table 4. Applied criteria for reducing claim values based on structural roofing mitigation
upgrades (pre-1960s and 1960-80s housing)
Wind
Speed
(km/h)
Loss Ratio
(%)
Proportion of
Claims Affected Mitigated Loss ($)
75-145
<10 15% 1,000
10-50 50% 2,000
>50 80% 5,000
145-170
<10 15% 2,000
10-50 50% 5,000
>50 80% 10,000
>170
<10 15% 5,000
10-50 50% 10,000
>50 80% 15,000
3.4. Mitigation Action #3 – Community Preparedness
From the Phase I report, minor claims represent 86% of the total number of filed claims for
Cyclone Yasi in the North Queensland Coastal Region. These minor claims typically include
damage shade sails, minor water ingress, minor debris damage, etc.
Community education/awareness campaigns, with emphasis on cyclone preparation (e.g.,
removing shade sails, pruning trees, removing debris and unsecured items from the yard, etc.),
may be an effective method of reducing the frequency of claims of this size. Past experience
suggests that 100% implementation of these “preparation upgrades” is unlikely, and actual
implementation rates will be much lower, depending on the method of dissemination adopted by
the community outreach campaign. Therefore, for modeling purposes, it was assumed that the
positive benefits of these upgrades were realized in only 30% of claims. The magnitude of these
benefits were assumed to increase with wind speed as shown in Table 5.
Table 5. Applied rules for modifying claim values based on community awareness upgrades (all
housing ages)
Wind
Speed
Loss
Ratio
(%)
Proportion
of Claims
Affected
Mitigated
Loss ($)
All
<10
30%
2000
10-50 3000
>50 5000
The costing associated with a community awareness campaign for cyclone preparedness
upgrades is outside the CTS scope of work and will be undertaken by Urbis during cost-benefit
analysis.
23 of 56
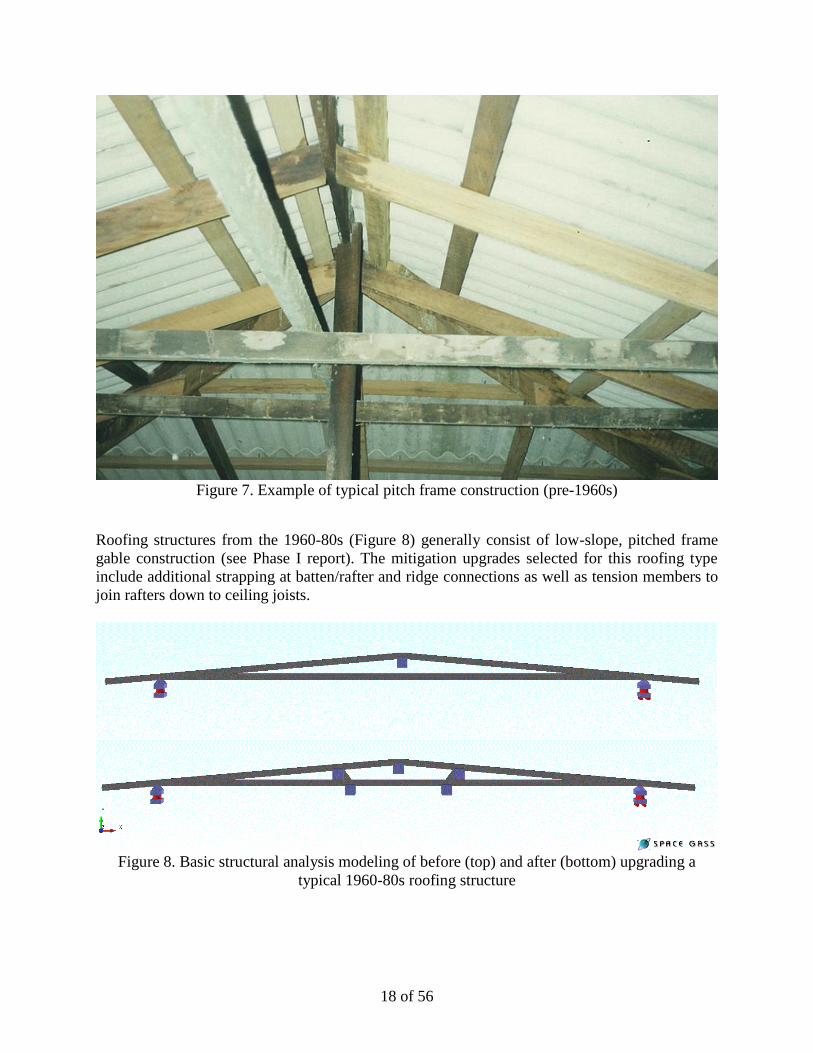
Additional Assumptions for Fragility Analysis
All policies were assumed to be without any mitigation upgrades at the time of TC Yasi
Future wind and rain conditions are similar to the those generating loss during TC Yasi
All adjustments that result in claim values below zero were assumed equal to zero
Storm tide damaged properties not considered

24 of 56
4. Damage Repair Cost Estimation
The following damage scenarios were presented to assessors, builders and engineers to provide
estimates of cost of repair based on their experience. The estimates were used for the modelling
of mitigated loss (i.e. claim reduction) for each upgrade solution in the fragility analysis. For
each of the four 3 sec gust wind speed scenarios discussed (Australian Bureau of Meteorology
Cyclone Categories 2-4), damage modes are based on typical damages noted during post-event
field survey by the CTS and the Suncorp claims data for Cyclone Yasi. Items covered under a
contents policy (e.g. furniture, white goods, etc.) were not included in the estimations.
4.1. Category 2 (125-165 km/h)
4.1.1. Fence Damage
Removal and replacement of a treated timber (pine) paling fence (15 m length x 1.8 m tall) that
has been blown over.
Cost: $1,500 (~$100.00 per m) to $2,250
4.1.2. Shade-Cloth Damage
A shade-cloth (5 m x 3 m) is attached to two poles and at two locations on the side of single
storey masonry block house. The cloth breaks loose from pole attachments and “flaps”, causing
paint damage to blockwork wall and guttering on that side of house. Repair includes shade-cloth
replacement, guttering (7 m length assuming Colorbond match exists), and wall repaint.
Cost: $3,650 to $4,000
4.1.3. Garage Door Damage
A double width (4.8 m) roller door is buckled/creased from wind pressure on a 1990s single
storey block work house. Interior water or impact damage doesn’t occur as a result of the
buckled door.
Cost: $1,500 to $3,200
4.1.4. Wind Driven Rain Damage to Modern House
Wind driven rain enters under a sliding glass window in the bedroom and another door in the
living room of a contemporary single storey masonry block house. Walls and ceiling are
internally lined with plasterboard. Floors are tiled in the living room but carpeted in the bedroom.
Skirting boards are damaged (separating/bowing from wall linings) 2 metres either side of the
door and under the window. Wall lining painting is blistered under window. Water has soaked
the carpet to 2 metres out from the window. Water runs down over the electrical power point in
the bedroom wall near the window. No water damage is observed in the ceiling. Electrical
wiring must be checked.
Cost: $3,000 to $4,400
4.1.5. Gutter Loss to High-Set 1970s Home
Replacement for missing quad-guttering from one side (12 m) and both down-pipes of a high-set
(elevated) 1970’s house.
Cost: $1,500 to $2,500 (high-set) and $600 to $750 (low-set)

25 of 56
4.1.6. Roofing Damage to High-Set 1920s Home
Loss of roof cladding and battens along one side including the gutter. Rain has damaged the
kitchen cupboards and electrics. No damage to floor coverings. No damage below the house.
(refer Figure 10)
Cost:
$15,000 (if not required to upgrade, repair battens and replace affected roof sheeting)
$35,000 to $50,000 (if upgrade required, full roof replacement, roof structure upgrade and tie
down with certification)
Note: Responses commented that about 20% of the roof area is affected which is potential
trigger point for minor (no upgrade work) or major work (upgrade work with full roof
replacement). One respondent noted that it appears more than 20% of the roof area is affected
but not 20% of the roof structure so it could be major/minor depending on the certifier and
assessor. This contrasts current advice from the QBCC which states that roof cladding is a
structural component and that with 20% of cladding damaged, a certified upgrade is required.
Figure 10. Wind-induced roofing damage to high-set 1920s home as presented to builders,
assessors, and engineers for experience based estimates of repair cost
4.2. Category 3 (165-224 km/h)
4.2.1. Garage Door Damage
Replacement of a torn and buckled double width (4.8 m) roller door on a 1990s single storey
masonry block house. As the door is failing it scratches the paint on the block work wall
supporting the tracks. There is also damage to the internal fibre cement ceiling with gouges and
marks. Paint on the ceiling and the rear FC timber framed wall has water marks and blistering.
Cost: $3,000 to $5,000 (includes a cyclone rated door per latest building standard)

26 of 56
4.2.2. Wind Driven Rain Damage to Modern House
Wind driven rain enters underneath the sliding glass door in the living room of a 2000s single
storey L-shaped masonry block house. The dimensions of living room are 4 metres x 6 metres
with 2.7 metre wall height. Walls and ceiling are internally lined with plasterboard and the floor
is tiled. Wind driven rain is “pushed” up the valley gutter, overflowing the pans (no sarking) and
entering into the roof space causing ceiling damage (refer Figure 11 for an example). Ceiling
damage extends in roughly a 2 metre radius from the centre of the room with partial collapse in
this area. A light fixture is in the affected area. Skirting boards and the lower 200 mm of wall
lining are damaged to 2 metres on either side of the door. There is access to roof space via
manhole.
Cost: $4,500 to $8,000
Figure 11. Wind driven rain damage to a modern (2000s) masonry block home as presented to
builders, assessors, and engineers for experience based estimates of repair cost
4.2.3. Roofing Damage to Low-Set 1930s Home
Replacement for loss of roofing and battens on a low-set timber clad 1930s house (assuming
central area 8 m x 8 m with 3 m wide “enclosed sleep outs”). Refer to Figure 12 as an example.
AC ceilings have been damaged in the living room. The floors are polished timber in most rooms
with linoleum in the kitchen and bathroom. The kitchen and bathroom cabinets are water
damaged (chipboard). The walls are lined with masonite.
Cost: $55,000 to $75,000 (average of approx. $70,000)

27 of 56
Figure 12. Wind-induced roofing damage to a low-set 1930s home as presented to builders,
assessors, and engineers for experience based estimates of repair cost
4.2.4. Roofing Damage to High-Set 1970s Home
Loss of roofing and battens from a fibro clad elevated 1970s house (assume 12 m long x 8 m
wide) with low pitch gable roof. AC ceilings have been holed in living room. The floors are
polished timber in most rooms with linoleum in the kitchen and bathroom. Kitchen and
bathroom cabinets are water damaged (chipboard). Walls lined with Masonite. Assume no
damage to under the house.
Cost: $65,000 to $87,500 (full wrap scaffolding needed, assumption of extra $15,000 above low-
set in previous scenario)

28 of 56
Figure 13. Wind-induced roofing damage to a high-set 1970s home as presented to builders,
assessors, and engineers for experience based estimates of repair cost
4.3. Category 4 (225-279 km/h)
4.3.1. Garage Door Damage
Replacement for a torn and buckled double width (4.8 m) roller door on a 1990s single storey
masonry block house. As the door is failing it completely tears loose and in doing so punches
holes in the fibre cement ceiling, dents the guttering and roof cladding and marks the block work
wall adjacent to where the tracks are fixed. There is water damage to the fibre cement lining, the
ceiling and the back wall.
Cost: $6,800 to $10,000
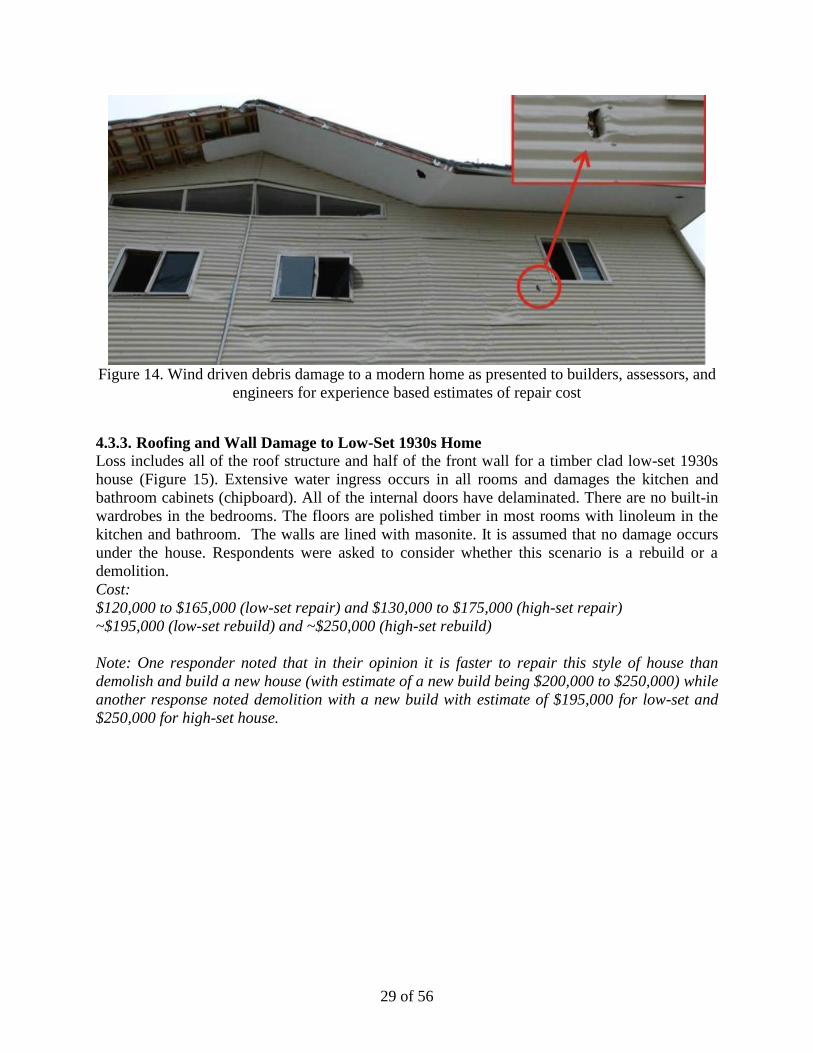
4.3.2. Wind Driven Debris Damage to Modern Home
A neighbouring legacy home loses part of its roof and generates debris. Repair is needed for the
12 m long wall of an elevated steel framed house (assume rectangular wall and not the “gable” as
shown in Figure 14). The wall cladding has been damaged, causing marks across the building
wall. Guttering and downpipes have been removed. The eave lining needs replacement (assume
900 mm wide). The steel frame of the home is undamaged and internal water damage has not
occurred.
Cost: $23,200 to $55,000
29 of 56
Figure 14. Wind driven debris damage to a modern home as presented to builders, assessors, and
engineers for experience based estimates of repair cost
4.3.3. Roofing and Wall Damage to Low-Set 1930s Home
Loss includes all of the roof structure and half of the front wall for a timber clad low-set 1930s
house (Figure 15). Extensive water ingress occurs in all rooms and damages the kitchen and
bathroom cabinets (chipboard). All of the internal doors have delaminated. There are no built-in
wardrobes in the bedrooms. The floors are polished timber in most rooms with linoleum in the
kitchen and bathroom. The walls are lined with masonite. It is assumed that no damage occurs
under the house. Respondents were asked to consider whether this scenario is a rebuild or a
demolition.
Cost:
$120,000 to $165,000 (low-set repair) and $130,000 to $175,000 (high-set repair)
~$195,000 (low-set rebuild) and ~$250,000 (high-set rebuild)
Note: One responder noted that in their opinion it is faster to repair this style of house than
demolish and build a new house (with estimate of a new build being $200,000 to $250,000) while
another response noted demolition with a new build with estimate of $195,000 for low-set and
$250,000 for high-set house.

30 of 56
Figure 15. Roofing and wall damage to a low-set 1930s home as presented to builders, assessors,
and engineers for experience based estimates of repair cost (high-set costs were also evaluated)
4.3.4. Roofing and Wall Damage to High-Set 1970s Home
Loss of roofing, part of the roof structure and half of the front wall from a fibro clad elevated
1970s house (assume 12 m long x 8 m wide) with a low pitch gable roof (e.g. Figure 16).
Extensive water ingress occurs in all rooms, damaging the kitchen and bathroom cabinets
(chipboard). All internal doors have delaminated. There are no built-in wardrobes in the
bedrooms. The floors are polished timber in most rooms with linoleum in the kitchen and
bathroom. The walls are lined with masonite. It was assumed that no damage occurred
underneath the house.
Cost: $155,000 to $200,000
Note: Responses included comment “should be able to be repaired and brought up to code
without demolition, depending on the lower wall structure construction type”
Figure 16. Roofing and wall damage to a high-set 1970s home as presented to builders, assessors,
and engineers for experience based estimates of repair cost
31 of 56
5. Retrofit Upgrade Cost Estimation
The selected mitigation solutions (roofing upgrades and opening protection only) were presented
in “scenario” format to assessors, builders and engineers to provide cost estimates for
implementing each solution in an undamaged structure (i.e. prior to a severe wind event). The
roofing upgrades were applied only to pre-1960s and 1960-80s housing while the opening
protection upgrades were applied to all housing ages. The first roof upgrade scenario includes
replacement of the metal cladding and then strapping of the rafter to top plates. The second roof
upgrade method is per HB132.2: Structural Upgrading of Older Housing and includes an external
over-batten (steel angle 100 x 50 x 5mm or steel pipe 55mm OD) and threaded rod running down
the exterior of the wall.
5.1. Cladding Replacement and Strapping of Roof Members
Replacement of the roof cladding (assume existing 75 x 50 mm hardwood battens are in good
condition and correct spacing) and upgrade to roof structure connections via strapping. A
rectangular housing plan of 12 m x 8 m was assumed with a hip roof 22.5 degree slope.
Specifically the costing scenario included the following:
Battens to be strapped or batten-screwed to rafters (Figure 17 and Figure 18)
Collar ties installed for each rafter pair
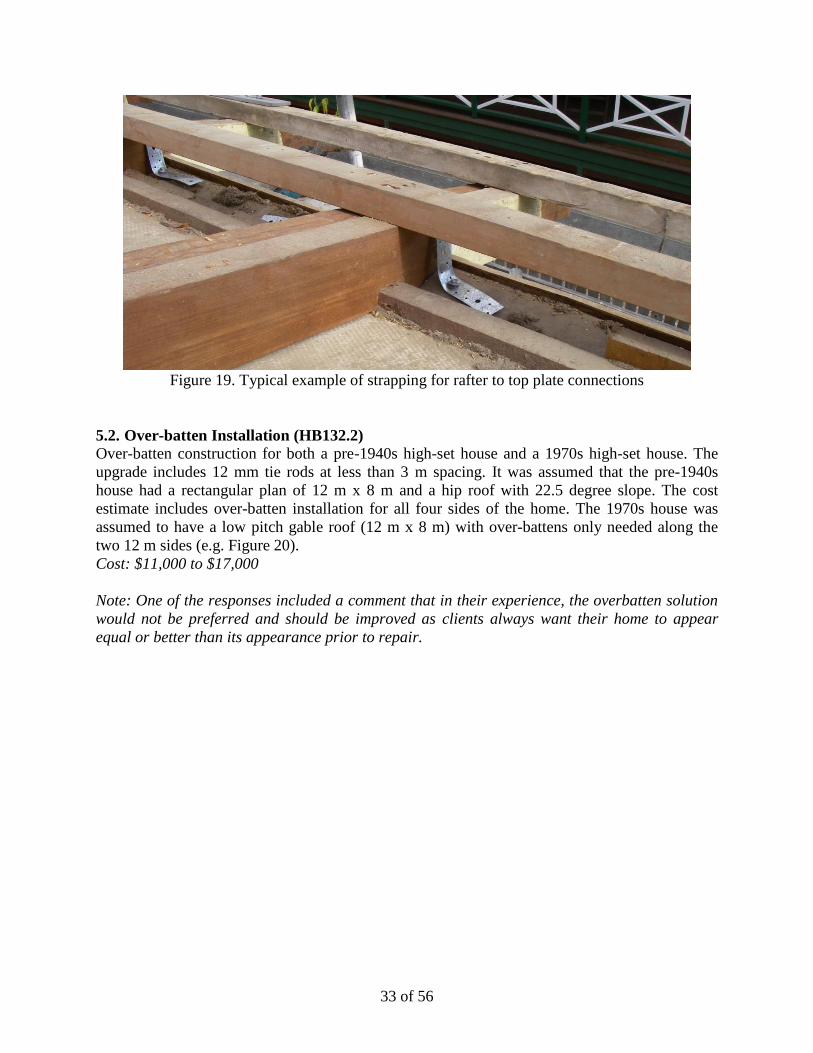
Strapping at rafter to top plate connections (Figure 19)
Strap struts at ridge to hip beams down to ceiling joists
Cost: $30,000 to $53,200
Based on the costing feedback, the following values were provided to Urbis for economic cost-
benefit modelling:
Pre60s housing
Scenario 1 - $30,000 for complete roof replacement and strapping upgrades
Scenario 2 - $3,000 for strapping upgrades (assuming upgrade when owner is replacing roof
for other reasons)
1960-80s housing
Scenario 1 - $27,000 for complete roof replacement and strapping upgrades
Scenario 2 - $3,000 for strapping upgrades (assuming upgrade when owner is replacing roof
for other reasons)

32 of 56
Figure 17. Batten screw from battens to rafters (pre drill before installing batten screws)
Figure 18. Example of nailed strapping for batten to rafter connection
33 of 56
Figure 19. Typical example of strapping for rafter to top plate connections
5.2. Over-batten Installation (HB132.2)
Over-batten construction for both a pre-1940s high-set house and a 1970s high-set house. The
upgrade includes 12 mm tie rods at less than 3 m spacing. It was assumed that the pre-1940s
house had a rectangular plan of 12 m x 8 m and a hip roof with 22.5 degree slope. The cost
estimate includes over-batten installation for all four sides of the home. The 1970s house was
assumed to have a low pitch gable roof (12 m x 8 m) with over-battens only needed along the
two 12 m sides (e.g. Figure 20).
Cost: $11,000 to $17,000
Note: One of the responses included a comment that in their experience, the overbatten solution
would not be preferred and should be improved as clients always want their home to appear
equal or better than its appearance prior to repair.

34 of 56
Figure 20. Drawing from Australian Standard’s Handbook HB132.2 and Typical over-batten
installation per HB132.2 Structural Upgrading of Older Houses
35 of 56
5.3. Opening Protection: Roller Door Upgrade
The costs associated with roller door upgrading were estimated at $300 for aftermarket supports
(on a per house basis) from discussions with product manufacturers.
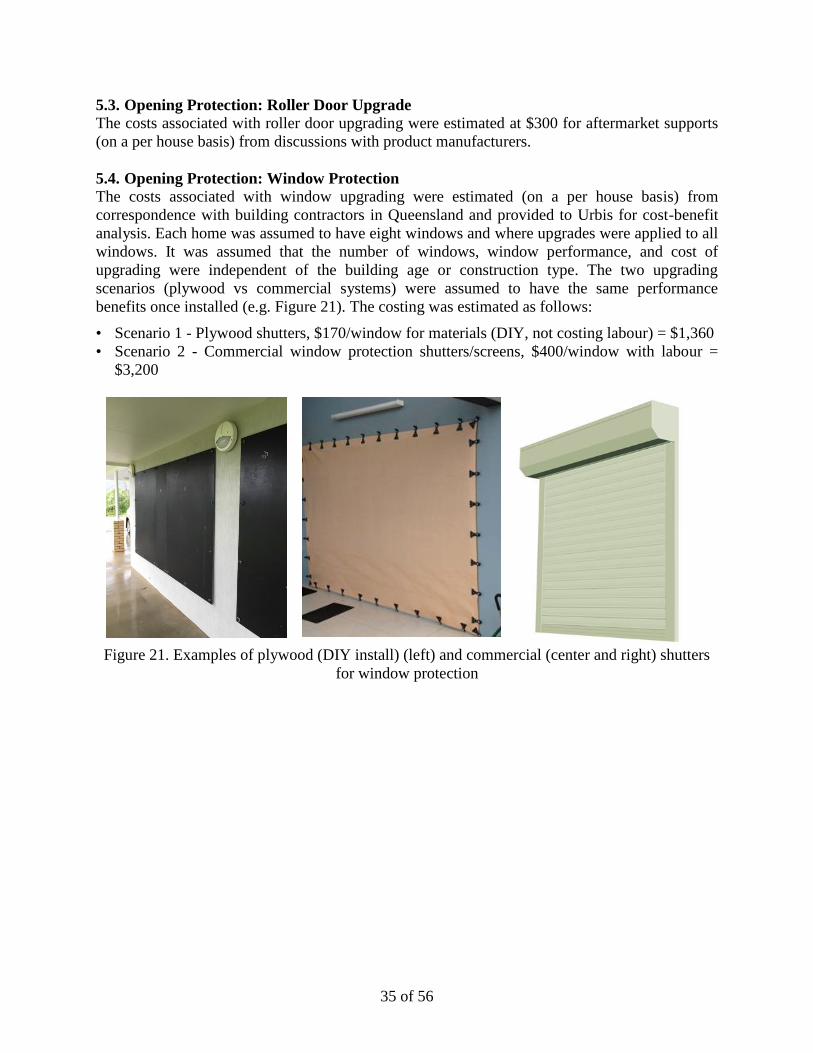
5.4. Opening Protection: Window Protection
The costs associated with window upgrading were estimated (on a per house basis) from
correspondence with building contractors in Queensland and provided to Urbis for cost-benefit
analysis. Each home was assumed to have eight windows and where upgrades were applied to all
windows. It was assumed that the number of windows, window performance, and cost of
upgrading were independent of the building age or construction type. The two upgrading
scenarios (plywood vs commercial systems) were assumed to have the same performance
benefits once installed (e.g. Figure 21). The costing was estimated as follows:
• Scenario 1 - Plywood shutters, $170/window for materials (DIY, not costing labour) = $1,360
• Scenario 2 - Commercial window protection shutters/screens, $400/window with labour =
$3,200
Figure 21. Examples of plywood (DIY install) (left) and commercial (center and right) shutters
for window protection

36 of 56
6. Literature Review: Drivers of Community Engagement in Mitigation
Chapter 6 Authors: Connar McShane (JCU), Daniel Smith (JCU) and Anne Swinbourne (JCU)
In addition engineering analysis for mitigation solutions, a literature review of mitigation
programs used internationally was conducted to inform the implementation of a Northern
Australia program. The review emphasizes the consumer engagement perspective. Programs in
Australia are discussed where possible, however the majority of works originate from the
cyclone-prone southeastern coast of the United States. The applicability of these programs to
Northern Queensland are discussed. The following are provided:
A critical summary of the key facilitators of behavioural preparedness or mitigation action
A summary of existing programs (emphasizing parallel work in Florida, USA)
Recommendations for enhancing the effectiveness of mitigation programs in Queensland
6.1. Introduction
In Australia, extreme weather events have brought to focus the need to ensure that the
communities in these vulnerable regions are appropriately prepared (Boon et al. 2012). Between
November 2014 and May 2015 there have been eight natural disasters declared in Queensland
(e.g., Tropical Cyclone Marcia, Brisbane floods, etc.), resulting in government funding
assistance activations for people and communities adversely affected (Queensland Government
2015). These regions in Queensland are therefore increasingly vulnerable not only due to high
frequency and intensity of extreme weather events but also due to increasing population density
particularly near exposed coastal regions. This increased population density has resulted in a
larger proportion of people, built environments and infrastructure at risk of negative physical,
mental, social and economic outcomes (Middelmann 2007).
Increased vulnerability of built environments and infrastructure yields larger post-event financial
costs in repair and recovery. Cyclone Yasi in Queensland was estimated to have cost $800
million in rebuilding assets and providing community support (The Queensland Cabinet and
Ministerial Directory 2011). Research has suggested that the extent of damage experienced and
the costs of repair and recovery can be minimised if appropriate mitigating actions are taken
(Pinelli et al. 2009). Appropriate and effective mitigating actions include strengthening the house
structure (Leatherman, Chowdhury, and Robertson 2007; Lavelle and Vickery 2013). It is
therefore imperative that communities and individuals in these vulnerable regions are aware of
the risks and are engaging in appropriate mitigation strategies to effectively prepare for an event.
In terms of human factors, preparedness is a building block of psychological resilience which in
turn contributes to the mitigation of harm to mental, physical, social and economic wellbeing
post-event (Ramirez, Antrobus, and Williamson 2013; Poussin, Botzen, and Aerts 2014; Boon et
al. 2012). Building psychological resilience is particularly important due to the
interconnectedness of these wellbeing outcomes. For example, poor emotional wellbeing has
been associated with delayed recovery from economic loss potentially due to associated stressors
of being financially restricted and as such inhibiting individual capacity to recover, rebuild and
move on.
37 of 56
There are some suggestions that Queenslanders are relatively well prepared for the impacts of
seasonal cyclonic events such as cleaning up yards, preparing food, water and medical provisions
and securing furniture and belongings (King, Goudie, and Dominey-Howes 2006; The Office of
the Inspector-General Emergency Management 2014). Yet this preparedness is limited in the
context of structural mitigation actions (Poussin, Botzen, and Aerts 2014; The Office of the
Inspector-General Emergency Management 2014).
A challenge to identifying facilitators of different preparedness behaviours is that these
facilitators are typically situationally and contextually specific. Factors affecting the success of
a mitigation strategy differ by region, event type and targeted behaviour. This review is
specifically aimed at identifying facilitators to increasing homeowner engagement in
strengthening or retrofitting homes vulnerable to tropical cyclones in Queensland. From the
literature, the situational and contextual factors that influence the level of preparedness (Sattler,
Kaiser, and Hittner 2000; Terpstra 2011; Pennings and Grossman 2008; Poussin, Botzen, and
Aerts 2014; Norris et al. 2002; Bonanno et al. 2007) in this region include:
1. Existing community experience with event
2. Defined roles of responsibility for preparedness
3. Existing strategies
4. Policies and legislation that provides standards for preparedness
5. Quality of existing horizontal and vertical social and community relationships that influence
responses to communicated preparedness messages
6.2. Facilitators of Preparedness Behaviour
Research investigating behavioural responses to threat suggests that adaptive responses are
influenced by an individual’s perceptions of vulnerability to and severity of the impact of the
threat as well as their assessment of their perceived capacity to mitigate the negative impact of
the threat event (Witte 1992; Grothmann and Reusswig 2006; Poussin, Botzen, and Aerts 2014;
Maloney, Lapinski, and Witte 2011).
Research suggests that if an individual’s appraises the likelihood of a threat as very low, then
they will tend not respond to the threat (Maloney, Lapinski, and Witte 2011; Witte 1992).
Similarly, if the individual’s appraises the likelihood of the threat as high yet the perception of
their ability to cope with these impacts is low, their response will tend to be one of fear and
disengagement (Witte 1992; Maloney, Lapinski, and Witte 2011). Therefore, though it is
important that a person perceives personal vulnerability to a threat, their perceived capacity to
mitigate the negative outcomes of the threat must be higher than that of their perceived
vulnerability in order for effective actions to be initiated. This process of risk assessment can
be conceptualised as a cost-benefit analysis. However it needs to be noted that not all people
assess risk similarly, particularly when taking into account specific contextual and situational
factors.
Residents of Queensland face extreme weather event threats, such as cyclones and flooding, on
an annual seasonal basis (Middelmann 2007). The events often have distinct warning periods,
suggesting that people are aware of the likelihood of a future event and the regional vulnerability
to an immediate event. However, not all warnings eventuate into actual events due to, for
example, the size of the watch and warning zones and the directional changes of the cyclone

38 of 56
path. This ratio of warning to event differs for different regions within Queensland, with some
areas experiencing a high number of warnings and very low numbers of events. These contextual
and situational factors result in a particular profile for residents of this region, (e.g., residents of
Queensland have a high level of experience with disaster or potential disaster events).
Research has demonstrated that those who have had prior experiences with disaster events are
more likely to respond adaptively to an event threat (Boon et al. 2012; Paton, Smith, and Violanti
2000). As a result of these past experiences and the seasonality of the potential events, residents
are likely to expect future actual or potential events to occur and expect that they may be
personally affected by this. However, residents differ in terms of their analysis of the risk
involved and the cost-benefit of preparing for a potential event. This difference in analysis can be
a result of multiple factors (e.g., complacency due to high warning/low event experience and low
damage/high event experience). For example, research by Terpstra (2011) found that within
communities who had experienced extensive flooding, those who had higher trust in public flood
protection strategies reported lower personal preparedness intentions. These past experiences of
few events or low levels of damage following a threat warning reinforces the perceptions of low
personal vulnerability to an event (Pennings and Grossman 2008; Usher et al. 2013), even though
perceptions of the probability of a severe event occurring may be high.
In a recent survey of household preparedness in Queensland it was found that though
Queenslanders undertook basic preparedness activities, they also tended to overestimate their
level of preparedness and, for some Queenslander’s, their complacency was a major barrier in
adequately preparing for an event (The Office of the Inspector-General Emergency Management
2014). Therefore, the challenge lies in increasing preparation behaviour in a population
that is highly vulnerable to an event but has great individual differences in the manner in
which risk is perceived and the way the costs and benefits of preparations is evaluated.
Research suggests that evaluation of risks and benefits of potential actions is influenced by the
source of the message, the type of action being requested and the associated outcomes of that
action. For instance, an individual’s relationship with others in the community may influence the
perceived quality and importance of the message being delivered (Ramirez, Antrobus, and
Williamson 2013; Pennings and Grossman 2008). This relationship to community, sometimes
called social capital, encompasses a person’s sense of shared experience, reciprocity and trust
towards others within their community (Cocklin and Alston 2002; Malecki 2011).
Social capital can include bonds between familiar in-groups such as family, peers and neighbours
as well as horizontal connections towards unfamiliar out-groups such as the broader residential
homeowner community or other regional residential communities vulnerable to the threat event
(Woodhouse 2006; Woolcock and Narayan 2000; Pretty 2003). Further, social capital can
include the vertical connections with unfamiliar out-groups such as an individual’s trust and
perceived connection to local government or state and national organisations (Szreter and
Woolcock 2004; Pretty 2003). For example, if there was low vertical social capital between
homeowners within a Queensland community and the State government, then homeowners may
not attend to the government’s message requesting homeowners to access services to assess the
structural integrity of their homes to minimise risk of damage from cyclonic winds.
Establishing trust and connectedness between the target population and the source of the
message influences attention and adherence to preparation advice (Ramirez, Antrobus, and

39 of 56
Williamson 2013). Yet attending to messages is only the beginning. Research has also clearly
established that though the target audience may attend to a message of behaviour change
and acknowledge the adverse outcomes of not adapting, such attention does not necessarily
translate into action (Witte 1992; Maloney, Lapinski, and Witte 2011).
As mentioned previously, the second stage of threat appraisal is that of assessing levels of
personal skills, resources and capacity to engage in the target behaviour (Maloney, Lapinski, and
Witte 2011; Witte 1992; Poussin, Botzen, and Aerts 2014). It is therefore important to identify
the factors that facilitate the acquisition of such skills, resources and capacity. These facilitators
may include the acquisition of knowledge that increases confidence and capability of performing
the behaviour or it may be receiving necessary support to complete the requested action. For
instance, research by Mishra and Suar (2012) on flood and heatwave preparedness in India found
that those who had greater preparedness education and greater access to resources, such as
income, education and social resources, were more likely to be adequately prepared than those
who had lower preparedness education and access to resources. Further, preparedness education
and access to resources was found to mediate the relationship between anxiety and preparedness
behaviour, with higher education and resources related to lower levels of anxiety.
As discussed previously, lowering anxiety or fear responses to potential threats are important in
facilitating a positive assessment of a person’s capacity to cope with the threat and consequently
increases the likelihood of responding adaptively to a threat (Witte 1992; Maloney, Lapinski, and
Witte 2011).
As stated, access to resources can help increase the uptake of preparedness actions. Yet access to
resources seems particularly important if the intended mitigating behaviour is costly. For
instance, research has suggested that the provision of financial subsidies is an important
facilitator for engaging in structural mitigation behaviours (Poussin, Botzen, and Aerts 2014).
Further, the personal time required for the mitigating behaviour also comes into the decision
process. However, the decision to engage in the mitigating action is not only influenced by the
cost of engaging but also the perceived beneficial outcomes (Poussin, Botzen, and Aerts 2014).
Such beneficial outcomes can include the degree to which the behaviour is perceived to be
effective in increasing resilience to negative outcomes.
Perceived effectiveness of outcomes can be influenced by, as previously discussed, the level of
existing community connectedness and cohesion as well as the trust in those communicating the
preparedness message (Ramirez, Antrobus, and Williamson 2013). Other beneficial outcomes for
engage in preparedness behaviours may be the perceived usefulness of increased skills or
knowledge that enhances the individual’s ability to respond to a disaster or the beneficial
financial outcomes of the preparedness action, such as a reduction in insurance costs (Poussin,
Botzen, and Aerts 2014). For instance, research by Botzen, Aerts, and van den Bergh (2009)
found that a majority of respondents from flood prone regions in the Netherlands were willing to
undertake structural mitigation measures in exchange for reduction on insurance premiums.
These findings emphasize that although factors that facilitate mitigation action may be
complex, targeted strategies that communicate the multiple benefits of undertaking action
can be successful in changing behaviour.
40 of 56
6.3. Existing Programs and Strategies for Increasing Preparedness
The review of programs and incentives for homeowners to retrofit or strengthen their homes
against extreme weather events is limited to storms and flooding since the process of risk
assessment and cost-benefit analysis differs for different types of disaster events. Programs,
policy and legislation for mitigation strategies that have been developed for increasing the
resilience of residential structures against extreme wind conditions (and flooding) are discussed.
Clear themes emerged for the types of strategies employed internationally including legislated
building codes, funding opportunities for homeowners, financial incentives and community
workshops.
6.3.1. Legislated Building Codes
Minimum building standard legislation and policy was the most common strategy employed by
governments to decrease the vulnerability of communities to the adverse impacts of an extreme
weather event (e.g. Office of Disaster Preparedness and Emergency Management, Jamaica,
2015; Department of Environment and Heritage Protection, Queensland, 2012; Florida Division
of Emergency Management, US, 2011) (Department of Environment and Heritage Protection
(Queensland) 2012; Florida Division of Emergency Management (USA) 2013; Office of Disaster
Preparedness and Emergency Management (Jamaica) 2008).
This strategy predominantly involved outlining a minimum building standard with which new
structures needed to comply. Failure to comply meant owners would be subjected to
infringement fines and possibly prosecution. However, while these initiatives were often based
within state-level government legislation, enforcement of the standards was a local-level
government responsibility, as in the case of Queensland (Middelmann 2007). This suggests a
potential for discrepancy of the operationalization of building standards between regional council
communities due to differences in resource availability and therefore enforcement of the
standards.
Additionally, in many cases where building standards are used as a mitigation strategy, the
standards applied to only new building structures and are not retroactive. For example, residents
of houses built prior to the standards implemented in 2002 in Florida, are not legally required to
retrofit their homes to meet the post-legislative standards. Therefore, if this type of legislation
and policy is the only residential building mitigation strategy in place in a vulnerable region,
owners of older houses within these regions do not necessarily have adequate incentive to
upgrade their homes. Further, if homeowners trust current mitigation strategies for associated
extreme weather event impacts (e.g. flood management, warning systems, emergency relief and
evacuation) to be adequate to protect them against substantial impacts, this may also reduce their
willingness to undertake additional preparedness action (Terpstra 2011).
The level of action required to strengthen a home may require substantial costs and as such clear
benefits, adequate perceived personal risk and adequate knowledge on how to respond must be
communicated to homeowners (Witte 1992; Maloney, Lapinski, and Witte 2011; Poussin,
Botzen, and Aerts 2014). Legislation- and policy-based mitigation on its own is probably not
sufficient to engage homeowners in strengthening their homes against potential extreme weather
events. This could be partially addressed by amending legislation to require homeowners of older
homes to upgrade the building structure if the homeowner had, for example, replaced the roof of
the house. However, this still requires homeowners to see the value in investing in a new roof,

41 of 56
which may be further impeded by the additional costs that the amended legislation would
require.
6.3.2. Funding Opportunities for Homeowners
Most mitigation programs and strategies identified originated from the USA, particularly Florida
where there has been an increasing focus on mitigation strategies to protect against the adverse
human and financial impacts of natural disasters (e.g., cyclones, thunderstorm, etc.). Funding
opportunities varied with some opportunities originating from private companies/organisations in
the form of long-term loans to strengthen and retrofit homes, while others were offered by
government as a small grant.
For example, the PACE (Property Assessed Clean Energy) funding program was developed and
delivered by a private company who offers loans to homeowners to make improvements on their
homes (Florida PACE Funding Agency 2015). Originally developed in California for earthquake
mitigation, the PACE program operates in conjunction with local governments in Florida to
provide loans to eligible residents to undertake home improvements through state-approved
contractors. The loans are available to commercial or residential buildings as long as there is
existing insurance for the building. The government also provides financial security for mortgage
lenders to reduce financial risks associated with defaults on mortgages. The length of the loan is
approximately 15-20 years and is attached to the building, not the owner, and has repayment
priority over the mortgage. These conditions have generated concern about the financial risk
involved for an individual undertaking the loan and thus may make the program unattractive in
the long term (Federal Housing Finance Agency 2010; Moody's Investors Service 2014). The
conditions also present barriers to those who have limited financial security and therefore cannot
undertake the additional financial burden.
Though a review of the effectiveness of the PACE program in Florida cannot be identified, past
evaluations in other states in the USA have reported success in the uptake of the program by
residents as well as considerable economic benefits for the immediate community and broader
population (Goldberg, Cliburn, and Coughlin 2011; Saha 2012). For example, in the Boulder
County, Colorado, the PACE-funded program funded $US9.8 million in residential retrofit
projects in the first phase of the program’s delivery (Goldberg, Cliburn, and Coughlin 2011). It
was estimated that delivery of this program contributed to $US14 million in economic activity in
the county. Therefore, despite the concerns raised regarding the financial risk for homeowners,
the PACE program can be considerably beneficial for regional communities not only through
reducing structural vulnerability but enhancing the economic wellbeing of the region.
The ‘My Safe Florida Home’ project by the Florida Department of Financial Services offered
Floridian homeowners the opportunity to apply for a $US5000 grant to retrofit their homes (Sink
2013). This program also offered a free house assessment for structural vulnerabilities to wind,
with the findings provided to the homeowner in a report. The report outlined the appropriate
structural improvements that could be undertaken, the cost of these improvements and the
associated discount in insurance premiums if improvements were undertaken. This program
targeted residents who were owners of a single-family, site-built home, living in a high risk
region for wind damage who had had an older home and were of a lower-socio economic status.
The targeting of residents of lower financial security who lived in older homes in a high risk area
would help to reduce the impact of adverse outcomes to one of a region’s most vulnerable
populations.

42 of 56
As highlighted previously, financial limitations can be a major barrier to undertaking
recommended actions to effectively prepare for a potential event (Poussin, Botzen, and Aerts
2014; Mishra and Suar 2012). Therefore, this type of targeted provision of assistance is a more
equitable approach to enhancing the strength of homes to those who would otherwise be unable
to afford to do so. As of 2008 there were 179,390 inspection applications submitted from across
Florida, with 109,000 of these applicants eligible for funding (Sink 2008). It was estimated that
on average homeowners saved $US224 in insurance costs, with a potential state-wide insurance
savings of $US24.5 million (Sink 2008). A study by Chatterjee and Mozumder (2014) found that
residents who were more likely to seek home inspection as a part of the My Safe Florida Home
program had home insurance, prior experience with damages and a higher sense of vulnerability.
However, these strategies of providing funds to homeowners to enhance the strength of their
home may not be attractive to all homeowners. For example, low trust in the source of the
support can result in this support being seen as undesirable (Pennings and Grossman 2008;
Ramirez, Antrobus, and Williamson 2013). Therefore, other strategies need to be used to
increase engagement from homeowners that are not attracted to offers of financial assistance.
6.3.3. Insurance Premium Reductions
As demonstrated in the ‘My Safe Florida Home’ program, one possible incentive for
homeowners to strengthen their homes is that of reduced insurance premiums. In Florida, it is
now a legislated requirement for insurance companies to provide homeowners with reduced
premiums based on the evaluated strength of the structure. In some programs for reduced
insurance premiums, these reductions can differ depending on the level of structural
strengthening in place. For example, the Fortified program developed by the Insurance Institute
for Business and Home Safety provides gold, silver and bronze standards for insurance
companies and residents which provide guidelines of home strength (Insurance Institute for
Business and Home Safety 2013). Insurance premiums are then reduced based on the level of
standard followed, with a gold standard having the highest level of protection/strength against
potential damaging weather events.
A public opinion survey of Floridian residents indicated that for 40% of respondents, the reduced
insurance premiums were a key motivator for homeowners in undertaking improvements on their
home (Sink 2008), a finding which is consistent with past research (Botzen, Aerts, and van den
Bergh 2009). Results also indicated that it was important to respondents that this option was
something they could choose to do rather than being forced upon them (Sink 2008). This may be
analogous to residents feeling a sense of control over the suggested action. Control over choice is
consistently associated with increased likelihood of performing an action (Brody, Grover, and
Vedlitz 2011; Sattler, Kaiser, and Hittner 2000). Taking up the option would also tend to
enhance confidence in the resident’s control over adverse outcomes. Further, 40% of respondents
also reported that they were more likely to undertake improvements if others in their community
were also strengthening their homes (Sink 2008). This is consistent with research that reports
people are more likely to respond in a manner similar to those with whom they have connections
and that they trust (Ramirez, Antrobus, and Williamson 2013), which is more likely to be
‘familiar others’, such as neighbours and friends, than ‘unfamiliar others’ such as hypothetical
exemplars in promotional materials.

43 of 56
These types of insurance incentives seem to be a predominately American technique though
some alternative forms of financial incentives are evident in the Australian context. For example,
the Victorian Country Fire Authority and the Building Commission developed a set of guidelines
for renovating and rebuilding homes in areas highly vulnerable to destruction from bushfires
(Department of Environment and Heritage Protection (Queensland) 2012; Victoria Building
Authority 2015). The guideline offers a list of recommendations for strengthening homes against
bushfire impacts. Though insurance premium reductions are not offered, homeowners are
informed that the environmental rating of the home would be improved and outcomes are
operationalised in terms of dollars as reductions in heating and cooling energy costs. Despite this
incentive, some anecdotal evidence suggests that homeowners in bushfire vulnerable regions of
Australia are not upgrading homes to the highest level of protection due to the misconception
that the suggested mitigation strategies are too costly (Weir 2015).
It is argued that if the benefits of these strategies were appropriately communicated, then there
would be a higher uptake in homeowners strengthening their home. This again supports research
evidence regarding the importance of social capital in communication (Ramirez, Antrobus, and
Williamson 2013; Pennings and Grossman 2008; Szreter and Woolcock 2004).
6.3.4. Two Example Programs in USA
Two mitigation programs from Florida, USA are provided as examples. The first is a previously
active program that assumes a key motivator will be insurance savings and uses a form of self-
assessment. In this quasi-government run program, homeowners answer a series of questions
about their property to understand the insurance savings that they may currently be entitled to
from different insurers. A link to the assessment tool is provided below:
http://www.floridadisaster.org/wisc/
The second program identifies similar mitigation features to those relevant in Australia and
includes a funded mitigation program based on retrofitting key items, as outlined below and
illustrated in Figure 22:
Benefits of Wind Mitigation (from program website) • Protects the homeowners family and the home’s value
• Reduces disruption of communities, Improves health and safety
• Reduces or eliminates the need for post-storm sheltering costs
• Potentially reduces hurricane insurance premiums
• Creates jobs and revenue in the community
• Reduces financial impact on state and federal treasuries
• $1 spent on mitigation saves $4 in response and recovery costs (FEMA estimate)

44 of 56
Figure 22. Illustrative example of a USA mitigation program that offers funding for upgrading
(http://retrofitswfla.org/)
Both these mitigation programs have relevant components to older building issues in Australia
but need to be explored to determine whether outcomes were/are successful.
6.4. Communication with Target Communities
As research has repeatedly demonstrated, developing and delivering programs and services does
not necessarily result in people being aware of the existence of, or understanding, the benefits of
using the service (Updegraff et al. 2007; Terpstra, Lindell, and Gutteling 2009; Kellens, Terpstra,
and De Maeyer 2013; Hawkins et al. 2008). Therefore for a program to be successful it needs to
be effectively communicated to the target audience. For example, in Florida the government has
also developed a number of community programs and workshops that aim to enhance resident
knowledge and understanding of the assistance and services available for them to improve their
homes as well as providing a cost-benefit analysis for engaging such assistance and services
(Florida Division of Emergency Management (USA) 2013). This is a similar strategy employed
by the Queensland Government for disaster preparedness (e.g. Get Ready Qld program) with the
exception that in Queensland the focus is on communicating information rather than providing
incentives. For example, in the lead up to the start of the cyclone season in Queensland, local and
state government work in coordination to deliver preparedness information at local community
events (Disaster Management 2015).
This type of strategy employed by the Florida government can achieve a number of outcomes.
First, the knowledge that is being disseminated to residents provides them with a better
understanding of their personal risk in an extreme weather event. Second, it provides an avenue
45 of 56
to increase understanding of the nature of effective actions that can be taken to reduce such risk.
It is this type of information that is critical in building self-efficacy and resilience. Third, the
cost-benefit analysis that individuals engage in when deciding whether or not to engage in
preparatory actions can be guided so as to optimise the performance of desirable behaviours.
Direct interaction with community members also helps identify those most at need of particular
assistance allowing better match between the individual and the program, therefore contributing
to improved distribution of resources.
6.5. Summary
This review has highlighted a number of factors. First, though there are a number of programs
existing internationally, particularly in the United States, there are no coordinated, planned and
implemented programs in Australia with the aim of increasing homeowner engagement in
mitigation strategies to strengthen their home. Secondly, of the programs and services reviewed,
it is clear that a “one size fits all” approach is not appropriate as individuals are motivated by
different incentives. Third, using only one approach may also not be sustainable over longer
periods of time, such as the provision of government grants. Fourth, programs must be
appropriately marketed to individuals and communities based on identified key motivators for
engaging in mitigation strategies. These motivators will differ between individuals and
communities based on their level of experience with extreme weather events, perceptions of risk
and responsibility, connectedness and trust towards others and the availability of resources
(Bonanno et al. 2007; Sattler, Kaiser, and Hittner 2000; Poussin, Botzen, and Aerts 2014;
Pennings and Grossman 2008; Terpstra 2011).
6.6. Recommendations and Suggested Research
To inform an effective mitigation program, it is recommended that homeowners in Queensland
be profiled based on their likelihood of accepting different types of incentives. Profiles of owners
who do, and do not, perform different types of damage mitigation behaviours will be
interviewed, enabling the delivery of targeted communication and tailored incentive programs
aiming to increase desirable behaviours. For example, younger homeowners with less experience
of extreme events and high intentions to sell properties in the near future, may find ‘cash back’
offers for retrofitting more attractive than decreases in insurance premium costs over the longer
term. Further, individuals in areas where residents have strong community ties may respond to
communications inviting social comparisons (“What are your neighbours doing about this?”)
more favourably than residents in areas without such linkages.
Using a survey methodology, the suggested research would investigate how social and
community characteristics, information seeking behaviour and preferences, past extreme weather
event experiences, and perceptions of threat and risk, influence behavioural preparedness. The
interaction of such variables and demographic characteristics of individuals should also be
investigated. It is suggested that at least three different communities be targeted based on
differences in objective levels of vulnerability to adverse outcomes from an extreme weather
event. This will enable inclusion in the design consideration of objective risk of extreme weather
events, types of housing stock, and the experience of the residents with extreme events. To
ensure adequate sampling of individuals, a research team at JCU has in the past used a
combination of ‘pen and paper’ and electronic delivery of survey instruments. Both have
advantages and both tend to reach different segments of the population.
46 of 56
Predictive modelling should be used to examine the interrelationships between the assessed
variables and the behavioural outcomes. This will allow the relative contribution of variables to
the desired outcomes to be assessed and enable the resulting model of behaviour to be refined.
This procedure provides evidence of causal relationships and identifies possible intervention
points. Profiles of homeowner typology should then be developed using a cluster analysis
technique. This analysis technique is routinely used in marketing research to develop profiles of
particular types of individuals from known standing on a set of descriptive variables (e.g.,
gender, income, age) with reference to standing on an measure of consumer behaviour (e.g.,
purchase of a type of car). This latter technique provides a rich picture of population segments in
terms of the variables known to be related to behaviour.
Along with appropriate knowledge of the relevant evidence base, the research should have a
history in the practice of survey design, implementation and data analysis. Ideally, they will have
worked with communities within the North Australia area and have links to community and
government organisations within the region. Such linkages are important to the implementation
phase where community good will is essential for promoting the research and gaining adequate
and representative sampling of individuals and households.

47 of 56
7. Proposed Mitigation Program Framework
Building on the analysis and information from the literature provided herein, conceptual
frameworks for the inspection and reporting aspects of a mitigation program in north Queensland
were developed in a preliminary sense. In this first instance, it was assumed that the sample-set
of mitigation solutions discussed in Section 3 are to be implemented. The outcomes are
presented with the understanding that they may inform the development of comprehensive
programs for north Queensland in the near future. Two concepts were considered, the first
includes a more traditional approach where inspections are completed by a qualified inspector,
while the second makes use of smart-phone technologies allowing consumers to “self-assess”.
An alternative framework for a current program in the US is also discussed. It is important to
note that an effective mitigation program may require a combination of each of the options
considered.
7.1. Option A: Formal Inspections
The evaluation is based on assessment of risk via property inspections conducted by a suitably
qualified inspector. This could be (a) government funded, (b) from the insurer or agent or (c) a
third party on behalf of owner. Inspectors would need to demonstrate an adequate level of
current knowledge and may need additional training for this work.
This option is similar in principle to what has been proposed by CTS to the Insurance Council of
Australia for strata properties in cyclonic regions. Details of the inspection process including the
survey scoring system, required level and content of training of the inspectors, and possible
administration are documented in the following reports:
CTS report TS899: Pilot study: Examination of strata building risks from cyclonic weather by
utilizing policy claims data
www.insurancecouncil.com.au/assets/report/Independent%20strata%20study.pdf
CTS Report TS948: A scheme to estimate the resilience of strata properties in cyclonic areas
www.insurancecouncil.com.au/assets/media_release/2014/July%202014/100714%20Report%20
JCU%20Engineering%20Inspection%20Scheme.pdf
The survey process as described in the reports to ICA for strata properties is by necessity more
detailed that what would be required for a formal survey/inspection for housing. Nevertheless,
the process would deliver an overall building rating for the estimated resilience of the property
and provides details on possible areas/components of concern. Mitigation options could be
provided based on the survey results. It is estimated that each survey would cost in the order of
$500.
Benefits of this work extend beyond the potential for reduced premiums and the increased
understanding of an insurer’s own portfolio. The process will improve the resilience of the wider
community through both increased awareness and building maintenance/retro-fitting. The survey
of buildings will allow a comprehensive assessment of building performance and potential issues.
Remediation of the identified building elements that may limit strength or amenity will result in
lower damage bills and a more resilient community.

48 of 56
In terms of housing, it has been considered too expensive to conduct individual property
inspections as part of the insurance of residential property. However, with premiums in the order
of $3000 a reduction of 20% will “pay” for the survey over one to two years. Most of the
information that is captured in an inspection will not change from year to year, so a repeat
inspection may only be necessary every 7-10 years, with additional inspections after any
significant mitigation process. Given these factors, it may be possible to contain the cost of
inspections to 2-3% of the premiums paid over the same period.
In cases where an inspection shows that risks were adequately controlled, this information might
help to justify a reduction in premiums such that the inspection cost was met in the first year,
with savings to the homeowner in subsequent years along with confidence that the insurer was
not overly exposed to risk.
Where inspections result in a recommendation for mitigation actions, there would need to be
adequate incentive to encourage the homeowner to take action. The insurer may be prepared to
share some percentage of the initial cost, along with agreeing to a discount on premiums if the
mitigation work is completed. It may also be possible to encourage governments to assist in the
cost of inspections, retrofitting programs, interest free loans, etc., all with the outcome that will
improve the communities’ resilience.
To enable the formal inspection process to provide confidence to owners, insurers and regulators,
specific guidance in the form of AIBS webinars will need to be provided to qualified building
inspectors/certifiers as explored in the ICA strata reports. In addition to the training, a
Queensland Building Code form for structural retrofitting/renovation will be needed. It is
envisaged that this would be a modified form of existing compliance forms (e.g. Form 21) where
the level of retrofitting is inspected and “signed off”. In discussions with the QBCC, a modified
version of the form was seen as an appropriate path with the process also improving inspection
processes for the reroofing of housing following wind storms.
7.2. Option B: Self-Assessment
The second option considered is based on supplying additional information about property
resilience to the insurer, through a combination of self-assessment by the property owner and
some level of auditing by the insurer or their agent.
7.2.1. The Self-Assessment Form
It is proposed that a self-assessment form be developed, to allow property owners to report on
key factors about their property. In addition to traditional paper format, a mobile application
software tool for self-assessment (and mitigation action decision support) could be developed. In
both formats, the captured information can be used to inform insurance pricing.
The self-assessment process could be supported by some level of auditing. The extent of this
auditing may vary depending upon the initial results. While the auditing may help to improve
confidence in the data, the main intent of the auditing would not be to act as a “policeman” but
rather to refine the self-assessment process to ensure that homeowners are capable of answering
the questions easily and reliably.

49 of 56
The challenges in developing a self-reporting form is to focus only on those factors that are easy
for the homeowner to answer, while capturing key information that is relevant to the resilience of
the property. To do this, the CTS suggests drawing on experience from previous damage
investigations, as well as insurance claims data, to categorise the key areas of vulnerability.
Some considerations that may be used to develop the self-assessment form include:
The age of the property can affect its performance for a number of reasons
There are specific vulnerabilities in new construction that may affect property resilience (e.g.,
water ingress around windows and doors)
Construction quality affects performance
Property maintenance affects performance
Additions to homes that are not to the same standard as the original dwelling, or that have not
been formally approved, generally do not perform as well as the original dwelling
Specific construction details can affect water ingress, which is a significant driver of loss
7.2.2. A Mobile Application Tool for Self-Assessment
The development and near ubiquitous adoption of smartphones in Australia make it an ideal
platform for enabling homeowner self-assessment and mitigation decision support. Research has
also established the effectiveness of smartphones as mobile education devices (Wood et al. 2012)
and has proposed the use of smartphones in disaster communication (Riddell et al. 2011; Meltzer
et al. 2014). A smartphone application is proposed as a self-assessment tool that also educates
and engages homeowners in cyclone-prone regions to make better decisions regarding mitigation.
The CTS suggests leveraging the efforts already invested in a US-based version of a similar
application, entitled “ResilientResidence”, and currently in development phase in the State of
Florida. The framework for the app, currently provides a personalized wind risk assessment of
the user’s home, including the anticipated losses that would occur in a scenario event (e.g.,
Category 5 cyclone). Further, based on the self-assessment data supplied by the user, the app
provides retrofit solutions that are specifically tailored to reducing wind-induced losses for that
home. The core objective of application is to promote decision-support for homeowners to
engage in mitigation activities and to information reporting. The self-assessed information
recorded by the application can be aligned with the paper format version of the self-assessment
form and transmitted to the insurer and collated at aggregate level for research. The app concept
hinges upon the idea that mitigation information presented in abstract, large-scale terms is often
less impactful to an individual’s mitigation decision-making process than specific, personalized
content (Wood et al. 2012).
The current wireframe version of the app (Figure 23) allows individual homeowners to define the
location (using either location based services or user input) and structural characteristics of their
homes through an interactive series of questions, and then receive an engineering assessment (in
simplistic format) of the expected damage their home would receive during a Category 1 through
Category 5 cyclone event. The app then recommends three retrofit options that are likely to
minimize the loss potential for the home, showing the homeowner the estimated reduction in
expected losses from a cyclone for each retrofit. Homeowners are provided with helpful hints
and graphics throughout the process in order to educate them on construction features deemed

50 of 56
critical for wind-resistance. In addition, there are options for contacting a team of experts to
answer questions.
Figure 23. Images of the “ResilientResidence” mobile application. A user supplies resilience-
essential information about the home (left), and retrofits are recommended with estimated loss
reduction of each for varying cyclonic events
51 of 56
8. Summary and Recommendations
Mitigation pricing and associated reductions in loss for cyclone intensities were estimated from
Suncorp claims data, and estimates from assessors, builders and manufacturers.
The mitigation measures costed were;
retrofitting to roof structure for pre 1980s houses (upgrading roof framing connections),
Protection of windows and doors to reduce wind driven rain ingress and reduce
likelihood of a windward dominant opening forming, and
Community awareness measures (effective ongoing maintenance of house, dismantle
shade cloth awnings, unblock gutters, prune trees away from house, appropriate tie down
for garden sheds, etc.)
The pricing and loss data were supplied to Urbis to conduct a cost-benefit analysis. The cost
baselines (numbers and amount of damage) are based on the TC Yasi Suncorp claims data. The
data is provided as reductions in percentages of loss ratio.
It is recommended that the models be developed further to include probabilistic components for
both wind speed, and capacity and damage/loss of building elements. The resultant models
could be (a) validated with other cyclone loss data, and (b) include other loss reduction measures
such as ongoing improvements in building codes (e.g. changes to garage door standard following
Cyclone Yasi).
Community awareness mitigation programs
In terms of a community awareness program for mitigation, the literature review noted a “one
size fits all” approach to mitigation programs is not appropriate as individuals are motivated by
different incentives (e.g. financial, level of hassle, engagement with the neighbours). The
incentives and motivators will differ between individuals and communities based on their level
of experience with extreme weather events, perceptions of risk and responsibility, connectedness
and trust towards others and the availability of resources. Further research (e.g. via online and
phone polls) to ascertain most effective motivators for different demographic groups is required.
Community Engagement Considerations
There is an opportunity for the whole community to benefit from an increased focus on
mitigation:
Homeowner – increased security during storm, promoted increase in house market value if
retrofits undertaken, reduction in insurance premiums
Government – reduction in drain on community services during and after severe event, more
resilient community
Industry – niche market for retrofitting and upgrading products as well as the building trades
to professionally undertake retrofitting
Proposed “structural” mitigation programs
Based on the literature review and CTS experience as a long-term proponent for cyclone
mitigation practices, two conceptual frameworks for a mitigation program were developed. The
first includes a more traditional approach where inspections are completed by a qualified
inspector, while the second makes use of smart-phone technologies allowing consumers to “self-

52 of 56
assess”. It is important to note that an effective mitigation program may require a combination of
each of the options considered.
It is recommended that further investigation be conducted into;
Engagement with QBCC regarding development of a targeted building certification form
for retrofitting work to older housing to allow insurers and home owners to demonstrate
effective structural mitigation.
Collaboration with building product manufacturing associations to explore economies of
scale for components for retrofitting (e.g. roof space framing connectors, door braces,
gutter brackets, fence supports, shed tie-down, etc.)
Continued discussions with building associations (MBA, HIA) to promote skills and
market niche branding for structural retrofitting of older housing

53 of 56
References
Apirakvoropinit, P., and S. Daneshvaran. 2009. "Hurricane damage analysis using a wind damage
simulator for low-rise structures with gable roof." In 11th America's Conference on Wind
Engineering, . Seattle, USA: American Association of Wind Engineering.
Bonanno, G.A., S. Galea, A. Bucciarelli, and D. Vlahov. 2007. 'What predicts psychological resilience
after disaster? The role of demographics, resources, and life stress', Journal of Consulting and
Clinical Psychology; Journal of Consulting and Clinical Psychology, 75: 671.
Boon, HelenJ, Alison Cottrell, David King, RobertB Stevenson, and Joanne Millar. 2012.
'Bronfenbrenner’s bioecological theory for modelling community resilience to natural disasters',
Natural Hazards, 60: 381-408.
Botzen, W. J. W., J. C. J. H. Aerts, and J. C. J. M. van den Bergh. 2009. 'Willingness of homeowners to
mitigate climate risk through insurance', Ecological Economics, 68: 2265-77.
Brody, Samuel, Himanshu Grover, and Arnold Vedlitz. 2011. 'Examining the willingness of Americans to
alter behaviour to mitigate climate change', Climate Policy, 12: 1-22.
Chatterjee, C., and P. Mozumder. 2014. 'Understanding household preferences for hurrican risk
mitigation information: Evidence from survey responses', Risk Analysis, 34: 984-96.
Chiu, G. L. F. 1994. "An extreme extreme-wind risk assessment system." In. Department of Civil
Engineering, Stanford University.
Cocklin, C., and M. Alston (ed.)^(eds.). 2002. Community sustainability in rural Australia: A question of
capital? (Academy of the Social Sciences in Australia: Wagga Wagga, NSW).
Dao, T. N., and J. W. van de Lindt. 2010. 'Methodology for Wind-Driven Rainwater Intrusion Fragilities
for Light-Frame Wood Roof Systems', Journal of Structural Engineering-Asce, 136: 700-06.
Department of Environment and Heritage Protection (Queensland). 2012. "Natural assets for flood and
cyclone resilience: Review of planning mechanisms used worldwide for mitigation of natural
disasters using a natural assets approach." In, edited by Department of Environment and Heritage
Protection. Brisbane: Queensland Government.
Disaster Management. 2015. 'Get Ready Queensland', Accessed 25th May.
http://www.disaster.qld.gov.au/getready/.
Federal Housing Finance Agency. 2010. 'FHFA Statement on Certain Energy Retrofit Loan Programs',
Accessed 25th May. http://www.fhfa.gov/Media/PublicAffairs/Pages/FHFA-Statement-on-
Certain-Energy-Retrofit-Loan-Programs.aspx.
Florida Division of Emergency Management (USA). 2013. '2013 State of Florida Enhanced Hazard
Mitigation Plan', Accessed 11th May. http://www.floridadisaster.org/Mitigation/State/Index.htm.
Florida PACE Funding Agency. 2015. 'Florida PACE Funding Agency', Accessed 11th May.
http://floridapace.gov/.
Friedman, D. G. 1975. "Computer simulation of natural hazard assessment." In. Institute of Behavioural
Science, University of Colorado, Boulder.
Goldberg, M., J.K. Cliburn, and J. Coughlin. 2011. "Economic impacts from the Boulder County,
Colorado, ClimateSmart Loan Program: Using Property-Assessed Clean Energy (PACE)
Financing." In.: National Renewable Energy Laboratory.
Grothmann, T., and F. Reusswig. 2006. 'People at risk of flooding: Why some residents take
precautionary action while others do not', Natural Hazards, 38: 101-20.
Hamid, Shahid, B. M. Golam Kibria, Sneh Gulati, Mark Powell, Bachir Annane, Steve Cocke, Jean-Paul
Pinelli, Kurt Gurley, and Shu-Ching Chen. 2010. 'Predicting losses of residential structures in the
state of Florida by the public hurricane loss evaluation model', Statistical Methodology, 7: 552-73.
Hart, G. C. 1976. "Estimation of structural damage due to tornadoes." In Symposium on Tornadoes:
Assessment of Knowledge and Implications for Man, 645-65.

54 of 56
Hawkins, R.P., M. Kreuter, K. Resnicow, M. Fishbein, and A. Dijkstra. 2008. 'Understanding tailoring in
communicating about health', Health education research, 23: 454-66.
Henderson, D., and J. Ginger. 2007. 'Vulnerability model of an Australian high-set house subjected to
cyclonic wind loading', Wind and Structures, 10: 269-85.
Holmes, J. D. 2007. Wind loading of structures (Taylor and Francis: London).
Insurance Institute for Business and Home Safety. 2013. 'Insurer's guide to Fortified.', Accessed 11th May.
disastersafety.org.
Kellens, Wim, Teun Terpstra, and Philippe De Maeyer. 2013. 'Perception and Communication of Flood
Risks: A Systematic Review of Empirical Research', Risk Analysis, 33: 24-49.
Khanduri, A. C., and G. C. Morrow. 2003. 'Vulnerability of buildings to windstorms and insurance loss
estimation', Journal of Wind Engineering and Industrial Aerodynamics, 91: 455-67.
King, D., J. Ginger, S. Williams, A. Cottrell, Y. Gurtner, C. Leitch, D. Henderson, N. Jayasinghe, P. Kim,
K. Booth, C. Ewin, K. Innes, K. Jacobs, M. Jago-Bassingthwaighte, and L. Jackson. 2013.
Planning, building and insuring: Adaptation of built environment to climate change induced
increased intensity of natural hazards (National Climate Change Adaptation Research Facility:
Gold Coast).
King, David, Douglas Goudie, and Dale Dominey-Howes. 2006. 'Cyclone knowledge and household
preparation-some insights from Cyclone Larry'.
Lavelle, F.M., and P.J. Vickery. 2013. 'Interactions among Wind Mitigation Features in Benefit/Cost
Analysis.' in, Advances in Hurricane Engineering.
Leatherman, S.P., A.G. Chowdhury, and C.J. Robertson. 2007. 'Wall of Wind Full-Scale Destructive
Testing of Coastal Houses and Hurricane Damage Mitigation', Journal of Coastal Research:
1211-17.
Malecki, Edward J. 2011. 'Regional Social Capital: Why it Matters', Regional Studies, 46: 1023-39.
Maloney, Erin K., Maria K. Lapinski, and Kim Witte. 2011. 'Fear Appeals and Persuasion: A Review and
Update of the Extended Parallel Process Model', Social and Personality Psychology Compass, 5:
206-19.
Middelmann, M.H. . 2007. "Natural hazards in Australia: Identifying risk analysis requirements." In,
edited by Tourism & Resources Department of Industry. Canberra: Geoscience Australia.
Mishra, Sasmita, and Damodar Suar. 2012. 'Effects of Anxiety, Disaster Education, and Resources on
Disaster Preparedness Behavior', Journal of Applied Social Psychology, 42: 1069-87.
Moody's Investors Service. 2014. 'Moody's: CMBS loan documents need to explicitly address "PACE"
clean energy loan risk.', Global Credit Research.
Norris, F.H., M.J. Friedman, P.J. Watson, C.M. Byrne, E. Diaz, and K. Kaniasty. 2002. '60,000 disaster
victims speak: Part I. An empirical review of the empirical literature, 1981–2001', Psychiatry:
Interpersonal and Biological Processes, 65: 207-39.
Office of Disaster Preparedness and Emergency Management (Jamaica). 2008. 'Hazard mitigation
planning', Accessed 11th May.
http://www.odpem.org.jm/BePrepared/HowODPEMPreparesJa/HazardMitigationPlanning/tabid/
71/Default.aspx.
Paton, D., L. Smith, and J. Violanti. 2000. 'Disaster response: risk, vulnerability and resilience', Disaster
Prevention and Management, 9: 173-80.
Pennings, Joost M. E., and Daniel B. Grossman. 2008. 'Responding to crises and disasters: the role of risk
attitudes and risk perceptions', Disasters, 32: 434-48.
Pinelli, J. P., K. R. Gurley, C. S. Subramanian, S. S. Hamid, and G. L. Pita. 2008. 'Validation of a
probabilistic model for hurricane insurance loss projections in Florida', Reliability Engineering &
System Safety, 93: 1896-905.
Pinelli, J., E. Simiu, K. Gurley, C. Subramanian, L. Zhang, A. Cope, J. Filliben, and S. Hamid. 2004.
'Hurricane Damage Prediction Model for Residential Structures', Journal of Structural
Engineering, 130: 1685-91.
55 of 56
Pinelli, J.P., B.B. Torkian, K. Gurley, C. Subramanian, and S. Hamid. 2009. "Cost effectiveness of
hurrican mitigation measures for residential buildings." In 11th Americas Conference on Wind
Engineering. San Juan, Puerto Rico.
Pita, G. L., J. P. Pinelli, K. Gurley, C. Subramanian, and S. Hamid. 2009. "Vulnerability of low-rise
commercial-residential buildings in the Florida Public Hurricane Loss Model." In 11th America's
Conference on Wind Engineering, American Association of Wind Engineering.
Pita, G., J. P. Pinelli, S. Cocke, K. Gurley, J. Mitrani-Reiser, J. Weekes, and S. Hamid. 2012. 'Assessment
of hurricane-induced internal damage to low-rise buildings in the Florida Public Hurricane Loss
Model', Journal of Wind Engineering and Industrial Aerodynamics, 104-106: 76-87.
Poussin, Jennifer K., W. J. Wouter Botzen, and Jeroen C. J. H. Aerts. 2014. 'Factors of influence on flood
damage mitigation behaviour by households', Environmental Science & Policy, 40: 69-77.
Pretty, Jules. 2003. 'Social Capital and the Collective Management of Resources', Science, 302: 1912-14.
Queensland Government. 2015. 'Disaster Relief Activations', Accessed 25th May.
http://www.disaster.qld.gov.au/Financial%20Support/Activations.html.
Ramirez, Suzanna, Emma Antrobus, and Harley Williamson. 2013. 'Living in Queensland: Preparing for
and communicating in disasters and emergencies', Australian Journal of Communication, 40.
Saha, D. 2012. "Enact legislation supporting residential Property Assessed Clean Energy financing
(PACE)." In Strengthen Federalism, Renewing the Economy, edited by Brookings Metropolitan
Policy Program. Brookings.
Sattler, David N., Charles F. Kaiser, and James B. Hittner. 2000. 'Disaster preparedness: Relationships
among prior experience, personal characteristics, and distress', Journal of Applied Social
Psychology, 30: 1396-420.
Sciaudone, J. C., D. Feuerborn, G. N. Rao, and S. Daneshvaran. 1997. "Development of objective wind
damage functions to predict wind damage to low-rise structures." In 8th US Conference on Wind
Engineering, American Association of Wind Engineering.
Sink, A. 2008. "My Safe Florida Home Program." In Hurrican Risk Mitigation Forum. Florida.
———. 2013. 'Strengthen your home and save money on your homeowner's insurance', Accessed 13th
November. mysafeflorida.org.
Sparks, P. R., and S. A. Bhindarwala. 1993. "Relationship between residential insurance losses and wind
conditions in Hurricane Andrew." In Conference on Hurricanes of 1992. American Society of
Civil Engineers.
Sparks, P. R., S. D. Schiff, and T. A. Reinhold. 1994. 'Wind damage to envelopes of houses and
consequent insurance losses', Journal of Wind Engineering and Industrial Aerodynamics, 53:
145-55.
Stubbs, N., and A. Boissonnade. 1993. "Damage simulation model for building contents in a hurricane
environment." In 7th US National Conference on Wind Engineering, 523-32.
Szreter, S., and M. Woolcock. 2004. 'Health by association? Social capital, social theory, and the political
economy of public health', International Journal of Epidemiology, 33: 650-67.
Terpstra, Teun. 2011. 'Emotions, Trust, and Perceived Risk: Affective and Cognitive Routes to Flood
Preparedness Behavior', Risk Analysis, 31: 1658-75.
Terpstra, Teun, Michael K. Lindell, and Jan M. Gutteling. 2009. 'Does Communicating (Flood) Risk
Affect (Flood) Risk Perceptions? Results of a Quasi-Experimental Study', Risk Analysis, 29:
1141-55.
The Office of the Inspector-General Emergency Management. 2014. "Queensland Community
Preparedness Survey November 2013." In, edited by The Office of the Inspector-General
Emergency Management. Brisbane, Qld: Queensland Government.
The Queensland Cabinet and Ministerial Directory. 2011. 'Yasi damage bill set to top $800 million',
Accessed 10th June. http://statements.qld.gov.au/statement/id/73637.
Unanwa, C. O., J. R. McDonald, K. C. Mehta, and D. A. Smith. 2000. 'The development of wind damage
bands for buildings', Journal of Wind Engineering and Industrial Aerodynamics, 84: 119-49.
56 of 56
Updegraff, J.A., D.K. Sherman, F.S. Luyster, and T.L. Mann. 2007. 'The effects of message quality and
congruency on perceptions of tailored health communications', Journal of Experimental Social
Psychology, 43: 249-57.
Usher, Kim, Petra Buettner, Caryn West, Jane Millis, Cindy Woods, Matt Mason, Helen Boon, and
Jennifer Chamberlain-Salaun. 2013. 'Preparedness for and Impact of Tropical Cyclone Yasi in
North Queensland, Australia', Prehospital and disaster medicine, 28: 272-78.
Vickery, P., J. Lin, P. Skerlj, L. Twisdale, and K. Huang. 2006. 'HAZUS-MH Hurricane Model
Methodology. I: Hurricane Hazard, Terrain, and Wind Load Modeling', Natural Hazards Review,
7: 82-93.
Vickery, P., P. Skerlj, J. Lin, L. Twisdale, M. Young, and F. Lavelle. 2006. 'HAZUS-MH Hurricane
Model Methodology. II: Damage and Loss Estimation', Natural Hazards Review, 7: 94-103.
Victoria Building Authority. 2015. 'A guide to retrofit your home for better protection from a bushfire',
Accessed 25th May. www.vba.vic.gov.au.
Walker, George R. 2011. 'Modelling the vulnerability of buildings to wind—a review', Canadian Journal
of Civil Engineering, 38: 1031-39.
Weir, I. 2015. "We can build homes to survive bushfires, so why don't we?" In The Conversation.
Witte, Kim. 1992. 'Putting the fear back into fear appeals: The extended parallel process model',
Communications Monographs, 59: 329-49.
Woodhouse, A. 2006. 'Social capital and economic development in regional Australia: A case study',
Journal of Rural Studies, 22: 83-94.
Woolcock, Michael, and Deepa Narayan. 2000. 'Social capital: Implications for development theory,
research, and policy', The world bank research observer, 15: 225-49.