jeanne albert & bill peterson middlebury college may 15, 2012 ecots 2012 storytelling in the...
TRANSCRIPT
Jeanne Albert & Bill PetersonMiddlebury College
May 15, 2012
eCOTS 2012
Storytelling in the Statistics Classroom

A Brief History of the CHANCE Project
• The CHANCE Project was funded by the National Science Foundation (1992 to 1996) to develop instructional materials for a course called Chance.
• The Chance course teaches fundamental ideas of probability and statistics in the context of real-world questions of interest.
The original CHANCE Team:
J. Laurie Snell, Peter Doyle, Joan Garfield, Tom Moore,
Bill Peterson, Ngambal Shah
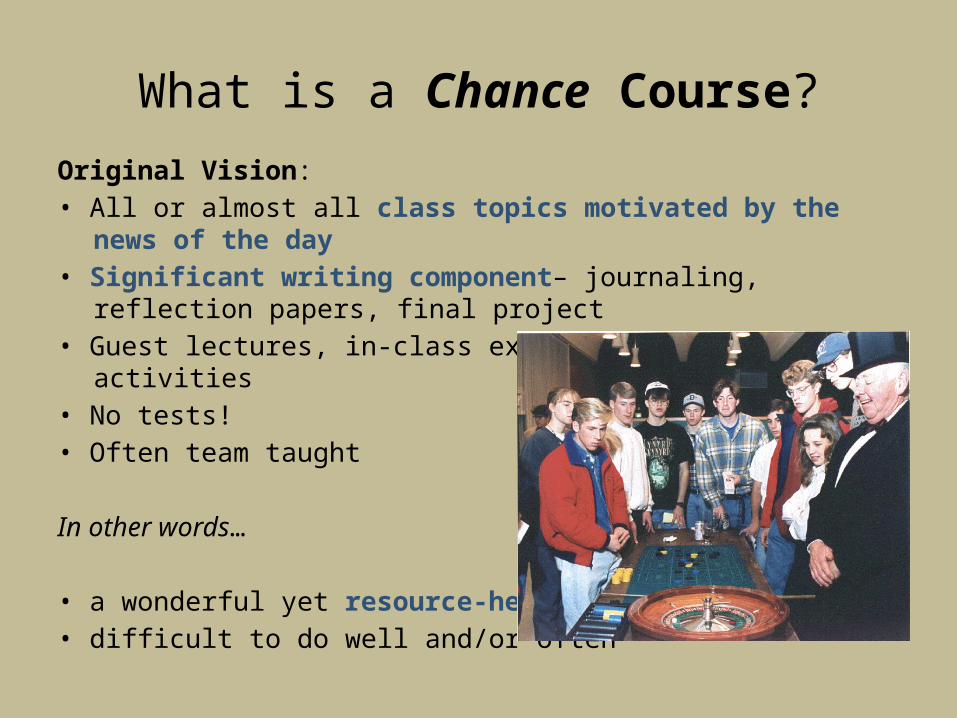
What is a Chance Course?
Original Vision: • All or almost all class topics motivated by the news of the day• Significant writing component– journaling, reflection papers, final project• Guest lectures, in-class experiments, and other activities • No tests!• Often team taught
In other words…
• a wonderful yet resource-heavy model• difficult to do well and/or often
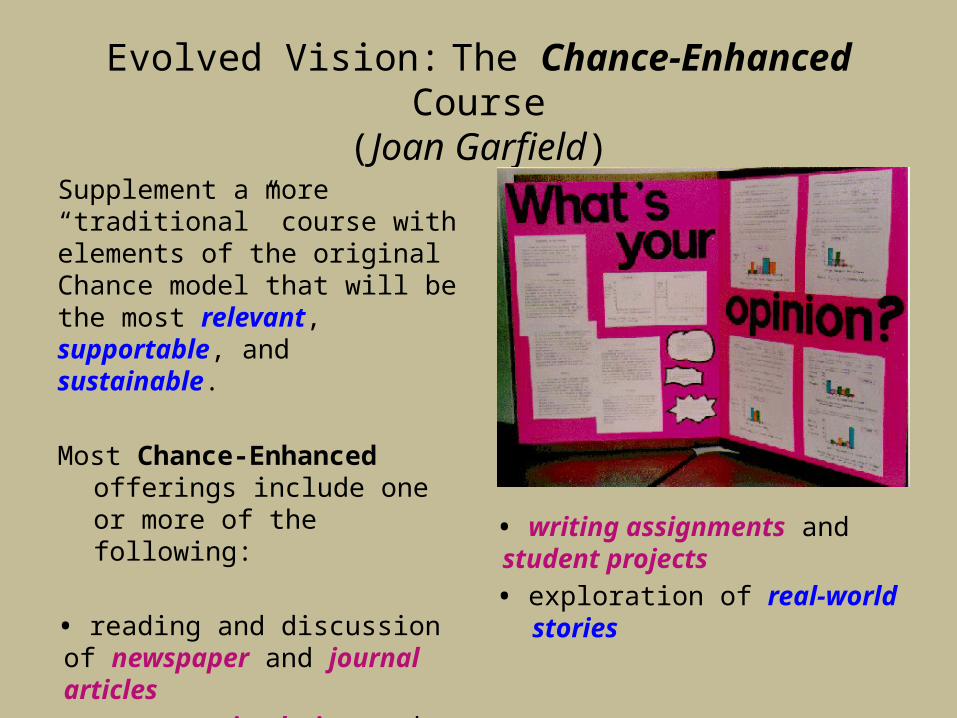
Evolved Vision: The Chance-Enhanced Course
(Joan Garfield)Supplement a more “traditional” course with elements of the original Chance model that will be the most relevant, supportable, and sustainable.
Most Chance-Enhanced offerings include one or more of the following:
• reading and discussion of newspaper and journal articles
• computer simulations and activities
• writing assignments and student projects
• exploration of real-world stories
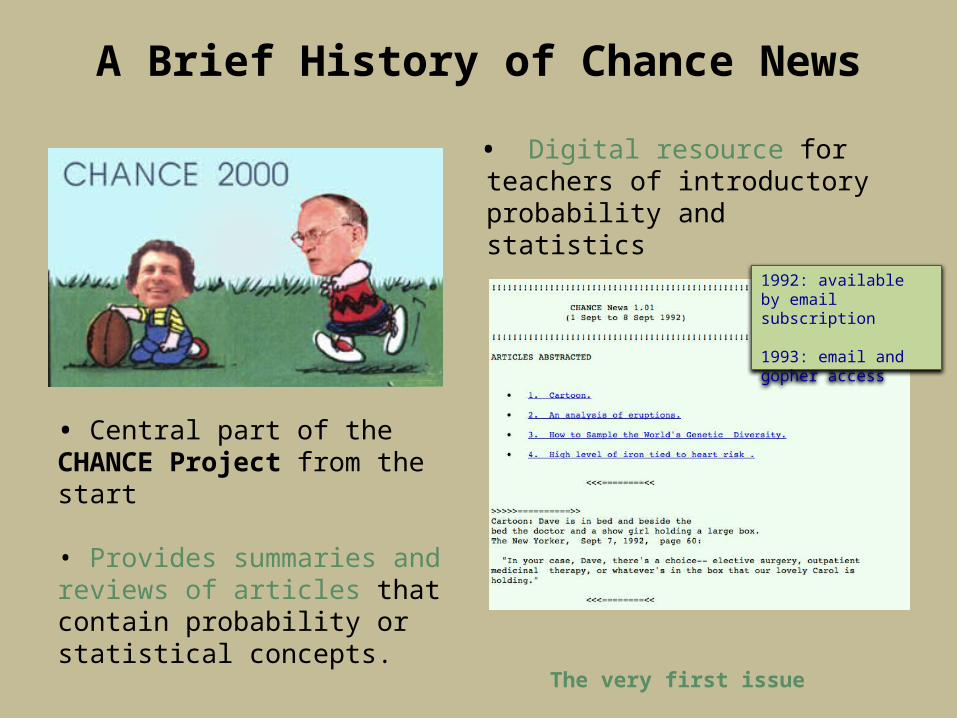
A Brief History of Chance News
• Central part of the CHANCE Project from the start
• Provides summaries and reviews of articles that contain probability or statistical concepts.
• Digital resource for teachers of introductory probability and statistics
The very first issue
1992: available by email subscription
1993: email and gopher access
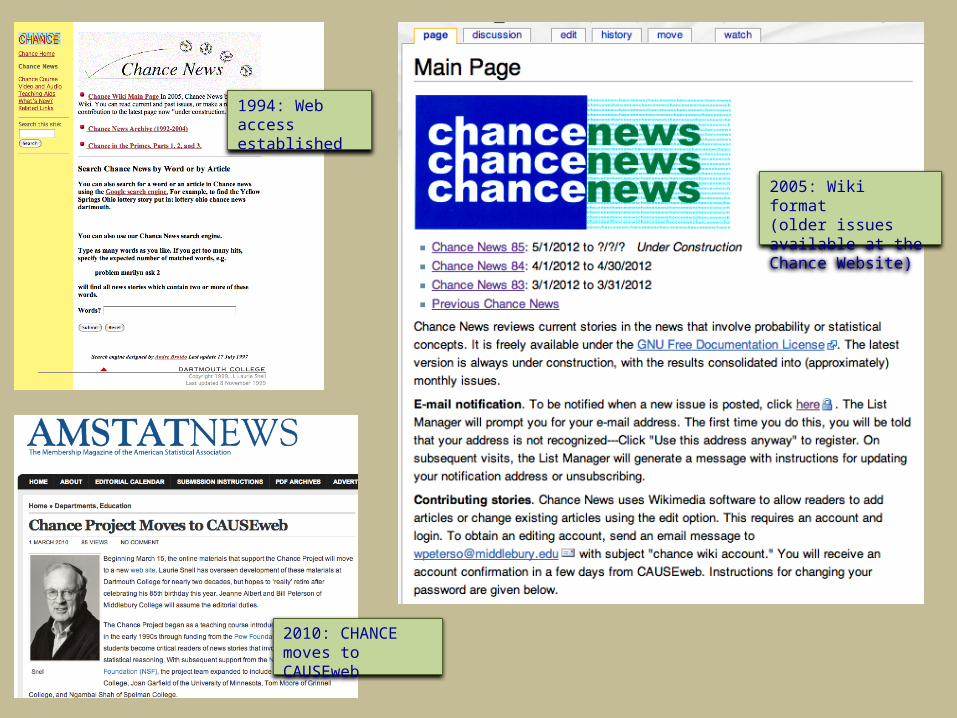
1994: Web access established
2005: Wiki format(older issues available at the Chance Website)
2010: CHANCE moves to CAUSEweb
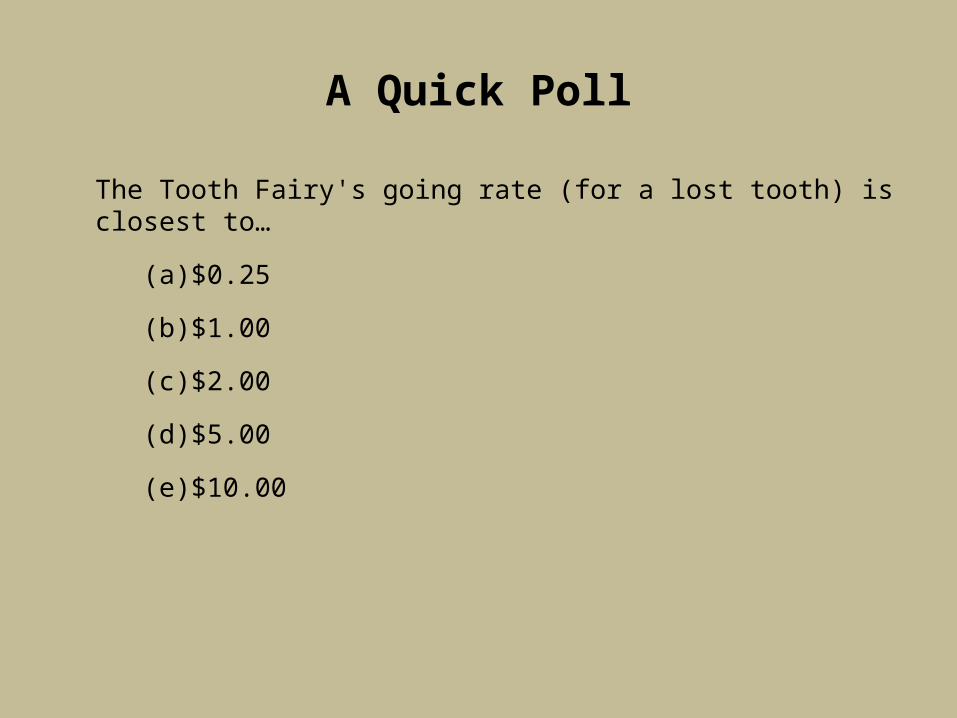
A Quick Poll
The Tooth Fairy's going rate (for a lost tooth) is closest to…
(a) $0.25
(b) $1.00
(c) $2.00
(d) $5.00
(e) $10.00
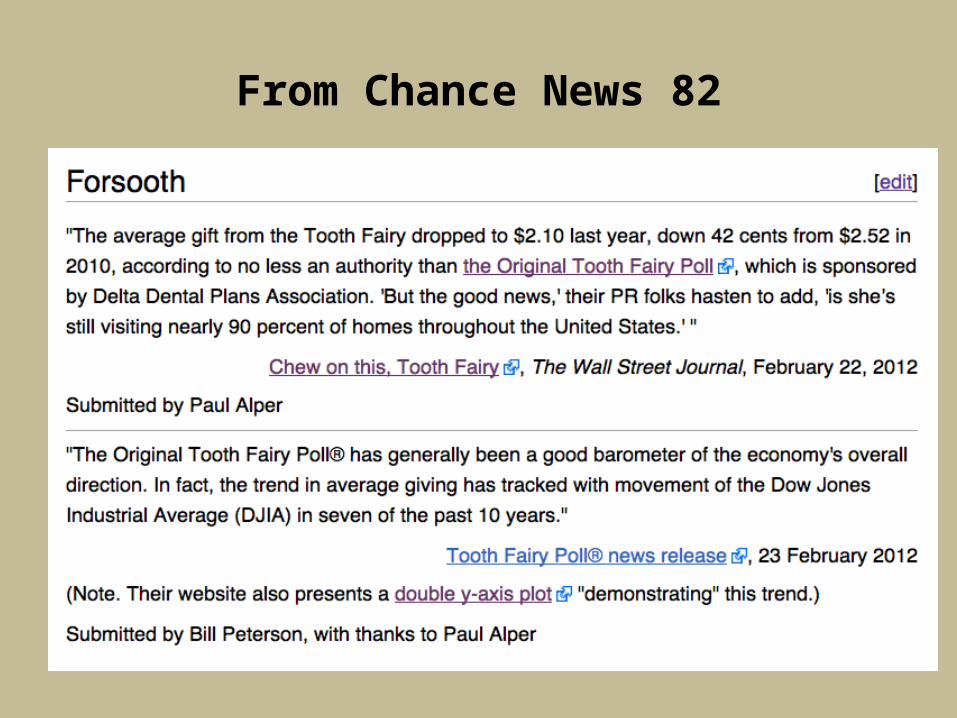
From Chance News 82
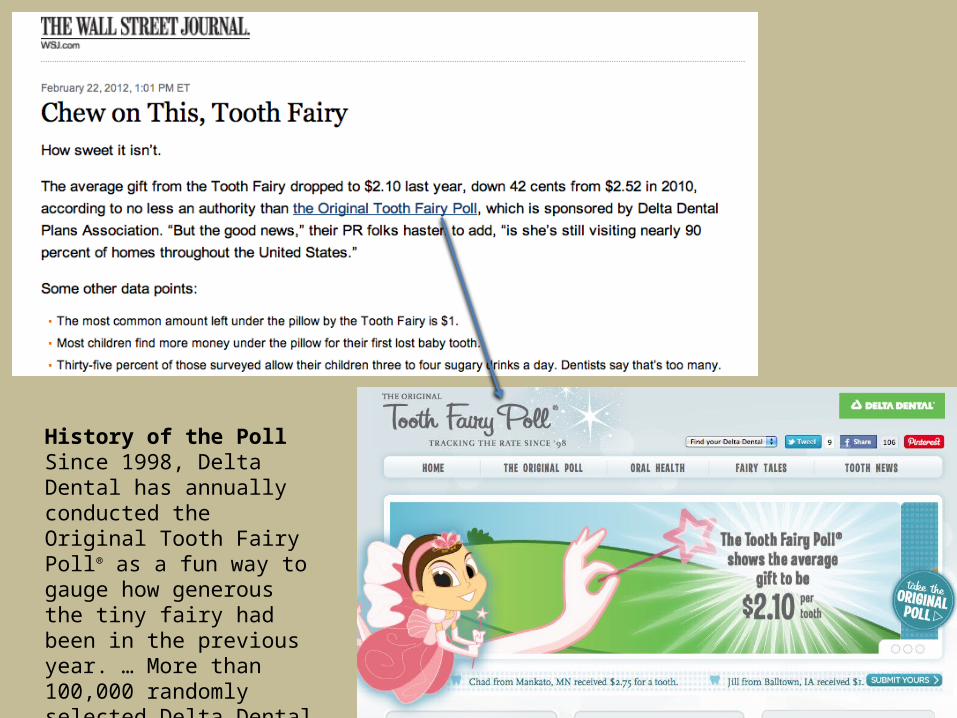
History of the PollSince 1998, Delta Dental has annually conducted the Original Tooth Fairy Poll® as a fun way to gauge how generous the tiny fairy had been in the previous year. … More than 100,000 randomly selected Delta Dental subscribers are invited to participate in the poll.
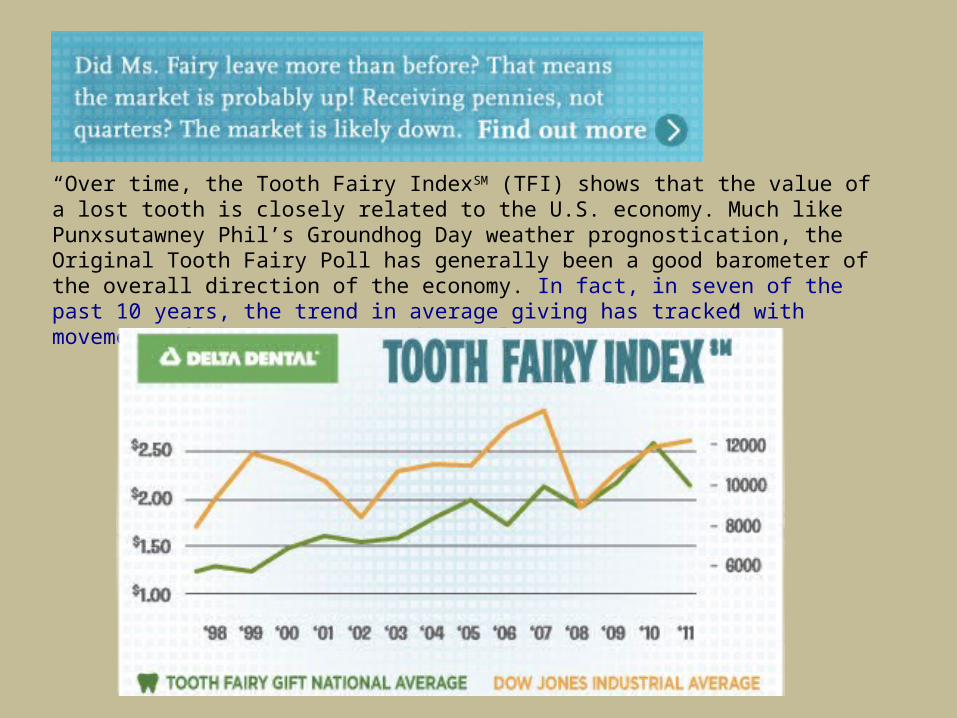
“Over time, the Tooth Fairy IndexSM (TFI) shows that the value of a lost tooth is closely related to the U.S. economy. Much like Punxsutawney Phil’s Groundhog Day weather prognostication, the Original Tooth Fairy Poll has generally been a good barometer of the overall direction of the economy. In fact, in seven of the past 10 years, the trend in average giving has tracked with movement of the Dow Jones Industrial Average (DJIA).”
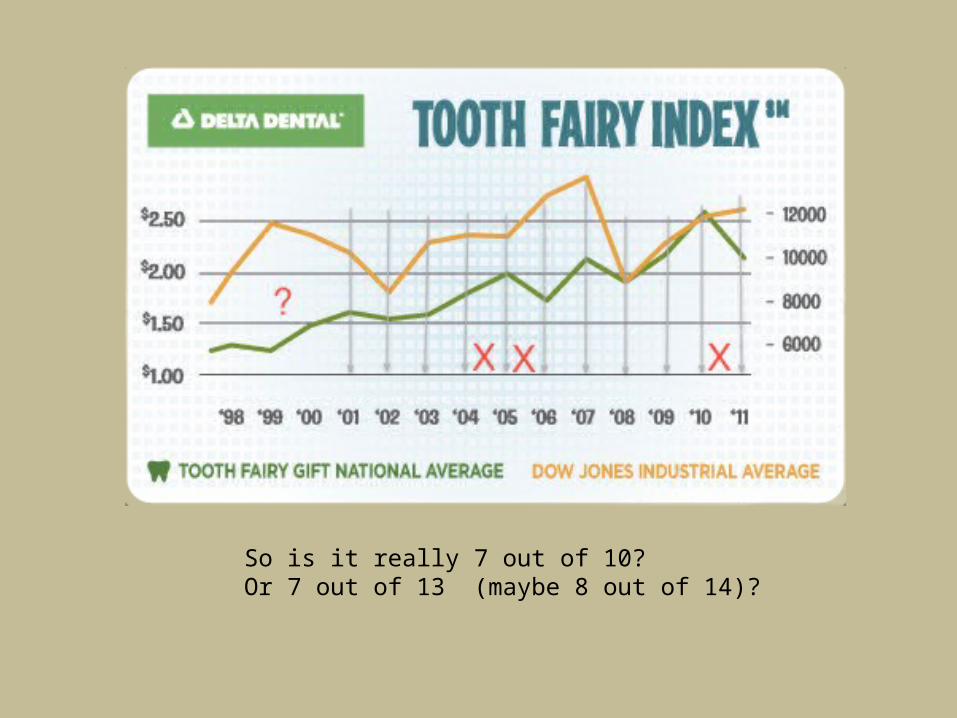
So is it really 7 out of 10?Or 7 out of 13 (maybe 8 out of 14)?

Why are we worried?
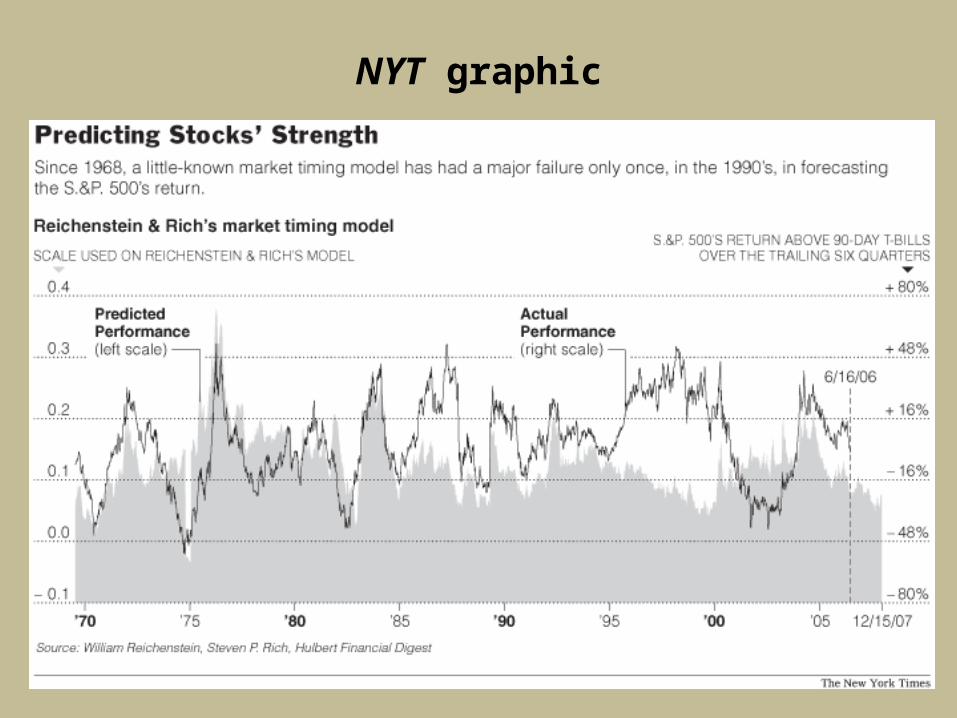
NYT graphic
About those 1990’s…
The model's failure in the 1990's, however, may be the exception that proves the rule. In an interview, Professor Reichenstein contended that the stock market's outsized returns in that decade were in large part attributable to investor “irrationality” and that the model should therefore not be faulted for failing to forecast them. The model aims to forecast what the market's level would be if investors were rational, and “no model built on rational pricing is able to explain irrational behavior,” he said.
A study by The Hulbert Financial Digest provides further support for the notion that the model's failure during the 1990's was an anomaly. The study focused on its performance from 1968 through 2006 — a period that includes the 22 years covered in the professors' original study and the 17 years since. Even after the incorrect forecasts in the 1990's are taken into account, the model's overall record is good enough to be statistically meaningful and not likely to be mere luck.
(from NYT)
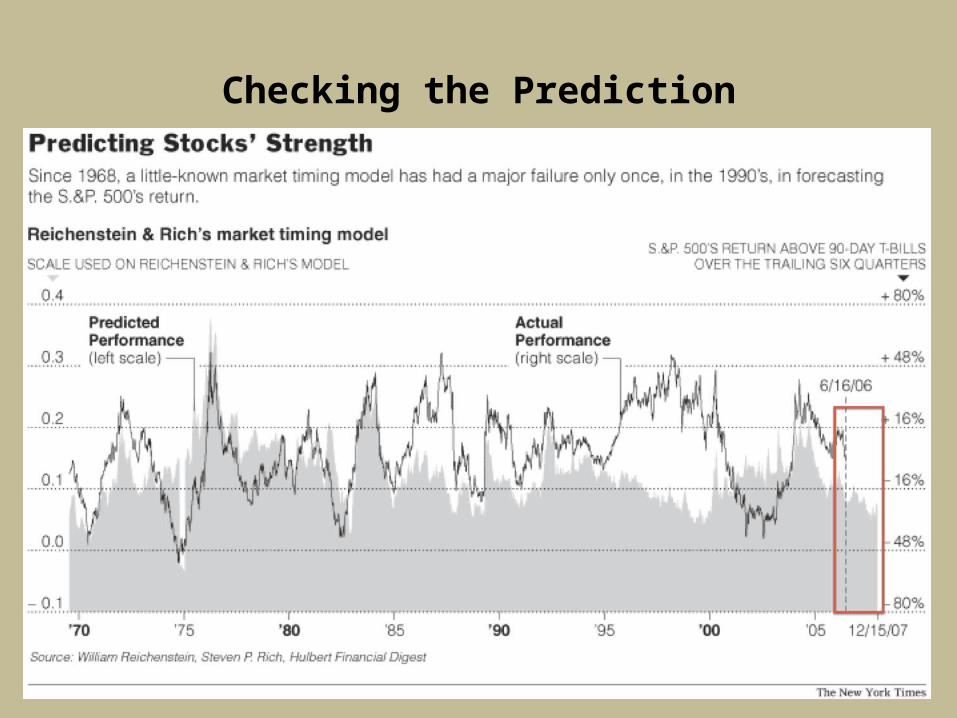
Checking the Prediction
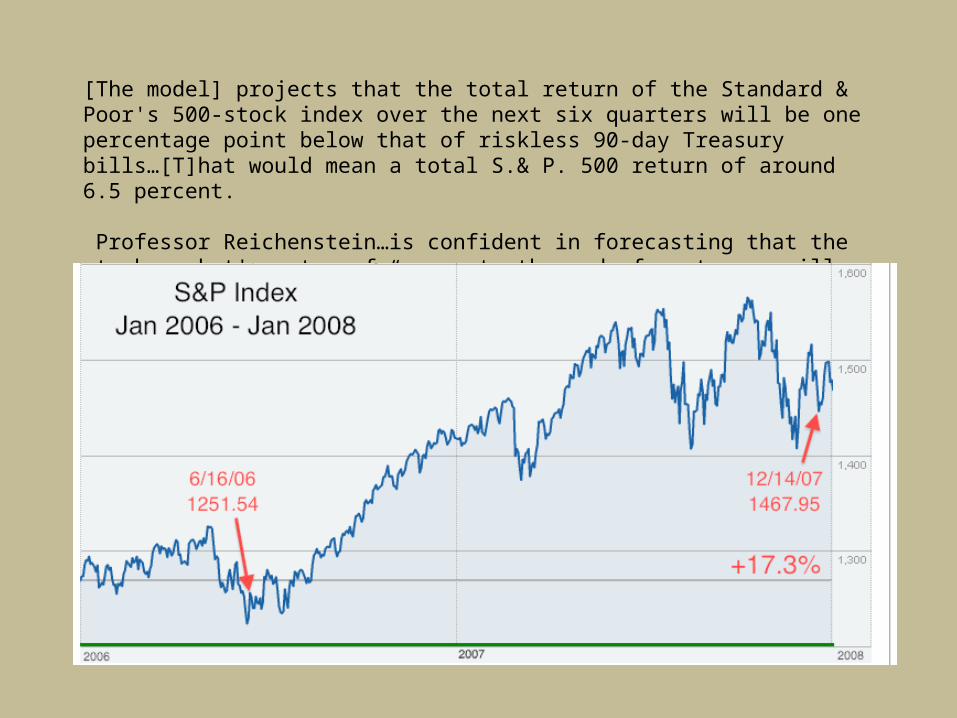
[The model] projects that the total return of the Standard & Poor's 500-stock index over the next six quarters will be one percentage point below that of riskless 90-day Treasury bills…[T]hat would mean a total S.& P. 500 return of around 6.5 percent.
Professor Reichenstein…is confident in forecasting that the stock market's return from now to the end of next year will be "well below average.” (from NYT)
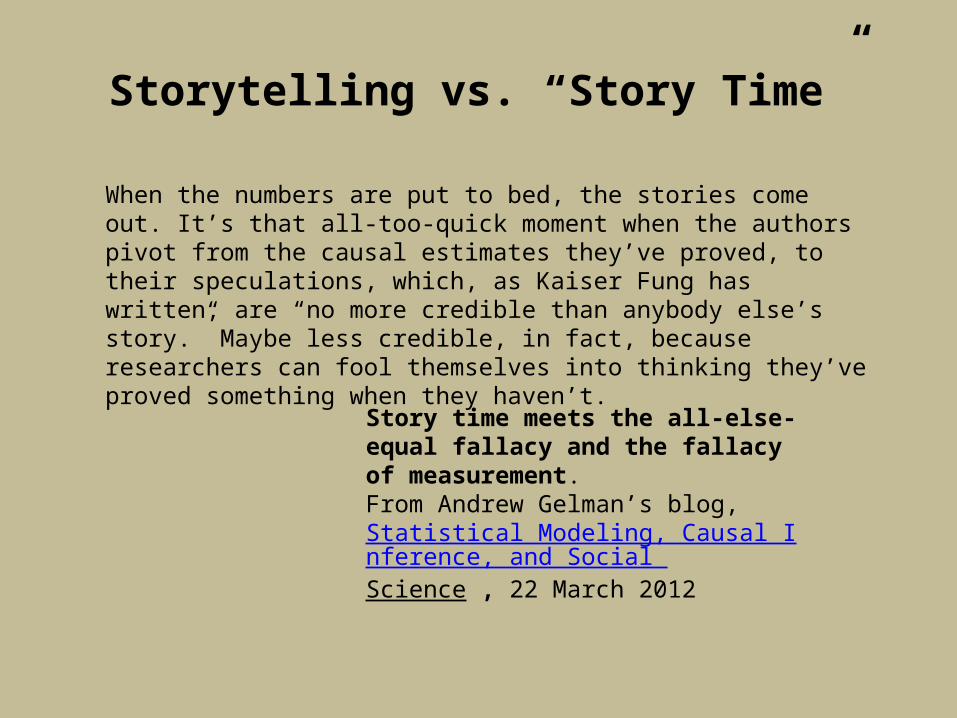
Storytelling vs. “Story Time”
When the numbers are put to bed, the stories come out. It’s that all-too-quick moment when the authors pivot from the causal estimates they’ve proved, to their speculations, which, as Kaiser Fung has written, are “no more credible than anybody else’s story.” Maybe less credible, in fact, because researchers can fool themselves into thinking they’ve proved something when they haven’t.
Story time meets the all-else-equal fallacy and the fallacy of measurement.From Andrew Gelman’s blog, Statistical Modeling, Causal Inference, and Social Science , 22 March 2012
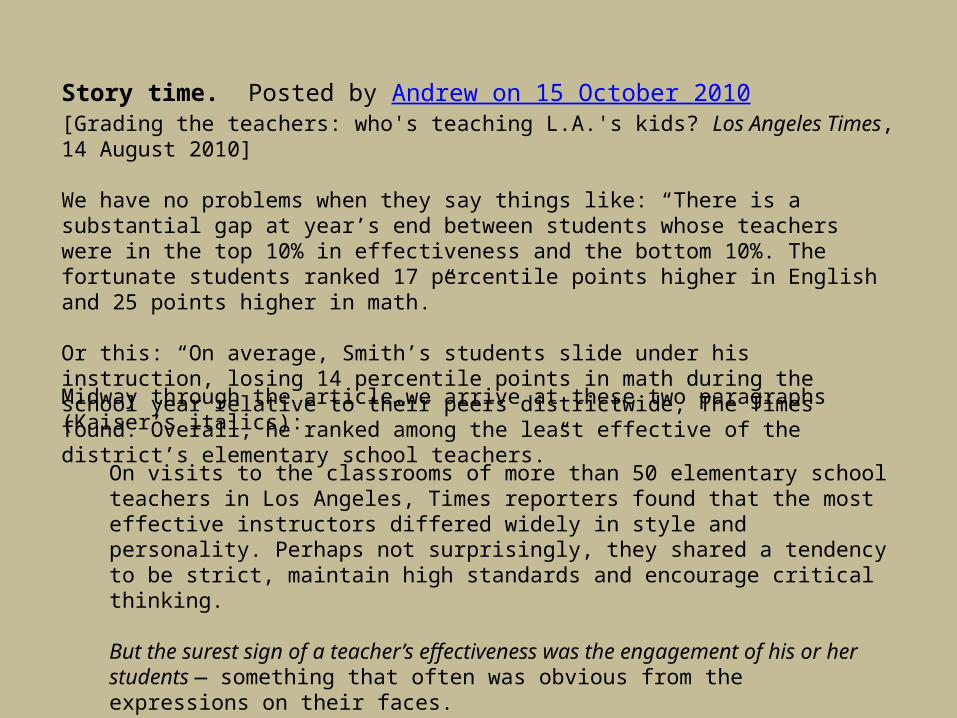
Story time. Posted by Andrew on 15 October 2010[Grading the teachers: who's teaching L.A.'s kids? Los Angeles Times, 14 August 2010]
We have no problems when they say things like: “There is a substantial gap at year’s end between students whose teachers were in the top 10% in effectiveness and the bottom 10%. The fortunate students ranked 17 percentile points higher in English and 25 points higher in math.”
Or this: “On average, Smith’s students slide under his instruction, losing 14 percentile points in math during the school year relative to their peers districtwide, The Times found. Overall, he ranked among the least effective of the district’s elementary school teachers.”
Midway through the article…we arrive at these two paragraphs (Kaiser’s italics):
On visits to the classrooms of more than 50 elementary school teachers in Los Angeles, Times reporters found that the most effective instructors differed widely in style and personality. Perhaps not surprisingly, they shared a tendency to be strict, maintain high standards and encourage critical thinking.
But the surest sign of a teacher’s effectiveness was the engagement of his or her students — something that often was obvious from the expressions on their faces.
The Tooth Fairy Poll and Story Time
“Though the drop in tooth value may portend a plunge in the stock market, the poll offered some positive signals for the economy too. A fully 90 percent of the parents surveyed said they take their kids to the dentist every six months. Lacking health insurance can often be a sign of poverty, as patients with health insurance are more likely to visit the dentist.”
Tooth Fairy left less money under pillows last year, survey finds.Huffington Post, 23 February 2012