jefferies 2018 global industrials conference · a strong, global company delivering outstanding...
TRANSCRIPT

www.lyondellbasell.com
Jefferies 2018 Global Industrials ConferenceBob PatelCEO
August 8, 2018
1
www.lyondellbasell.com
The statements in this presentation relating to matters that are not historical facts are forward-looking statements. These forward-looking statements are based upon assumptions of management which are believed to be reasonable at the time made and are subject to significant risks and uncertainties. Actual results could differ materially based on factors including, but not limited to, the business cyclicality of the chemical, polymers and refining industries; the availability, cost and price volatility of raw materials and utilities, particularly the cost of crude oil, natural gas, and associated natural gas liquids; competitive product and pricing pressures; labor conditions; our ability to attract and retain key personnel; operating interruptions (including leaks, explosions, fires, weather-related incidents, mechanical failure, unscheduled downtime, supplier disruptions, labor shortages, strikes, work stoppages or other labor difficulties, transportation interruptions, spills and releases and other environmental risks); the supply/demand balances for our and our joint ventures’ products, and the related effects of industry production capacities and operating rates; our ability to achieve expected cost savings and other synergies; our ability to successfully execute projects and growth strategies; any proposed business combination, the expected timetable for completing any proposed transactions and the receipt of any required governmental approvals, future financial and operating results, benefits and synergies of any proposed transactions, future opportunities for the combined company; legal and environmental proceedings; tax rulings, consequences or proceedings; technological developments, and our ability to develop new products and process technologies; potential governmental regulatory actions; political unrest and terrorist acts; risks and uncertainties posed by international operations, including foreign currency fluctuations; and our ability to comply with debt covenants and service our debt. Additional factors that could cause results to differ materially from those described in the forward-looking statements can be found in the “Risk Factors” section of our Form 10-K for the year ended December 31, 2017, which can be found at www.lyondellbasell.com on the Investor Relations page and on the Securities and Exchange Commission’s website at www.sec.gov.
The illustrative results or returns of growth projects are not in any way intended to be, nor should they be taken as, indicators or guarantees of performance. The assumptions on which they are based are not projections and do not necessarily represent the Company’s expectations and future performance. You should not rely on illustrated results or returns or these assumptions as being indicative of our future results or returns.
Additionally, this communication includes forward-looking statements relating to the proposed merger between LYB and A. Schulman, Inc. (“Schulman”), including financial estimates and statements as to the expected timing, completion and effects of the proposed merger. These estimates and statements are subject to risks and uncertainties, and actual results might differ materially. Such estimates and statements include, but are not limited to, statements about the benefits of the merger, including future financial and operating results, the combined company’s plans, expectations and intentions, and other statements that are not historical facts. Such statements are based upon the current beliefs and expectations of the management of LYB and Schulman and are subject to significant risks and uncertainties outside of our control. Actual results could differ materially based on factors including, but not limited to, the occurrence of any event, change or other circumstances that could give rise to the termination of the Merger Agreement, the risk that the necessary regulatory approvals may not be obtained or may be obtained subject to conditions that are not anticipated, failure to realize the benefits expected from the proposed merger and the effect of the announcement of the proposed merger on the ability of LYB and Schulman to retain customers and retain and hire key personnel and maintain relationships with their suppliers, and on their operating results and businesses generally. Discussions of additional risks and uncertainties are contained in LYB’s and Schulman’s filings with the Securities and Exchange Commission. Neither LYB nor Schulman is under any obligation, and each expressly disclaim any obligation, to update, alter, or otherwise revise any forward-looking statements, whether written or oral, that may be made from time to time, whether as a result of new information, future events, or otherwise. Persons reading this communication are cautioned not to place undue reliance on these forward-looking statements which speak only as of the date hereof.
This presentation contains time sensitive information that is accurate only as of the date hereof. Information contained in this presentation is unaudited and is subject to change. We undertake no obligation to update the information presented herein except as required by law.
Reconciliations for our non-GAAP measures can be found in the Appendix to this presentation or on our website at www.lyondellbasell.com/investorrelations.
Cautionary Statement
2
www.lyondellbasell.com
LyondellBasell A Strong, Global Company Delivering Outstanding Performance
3
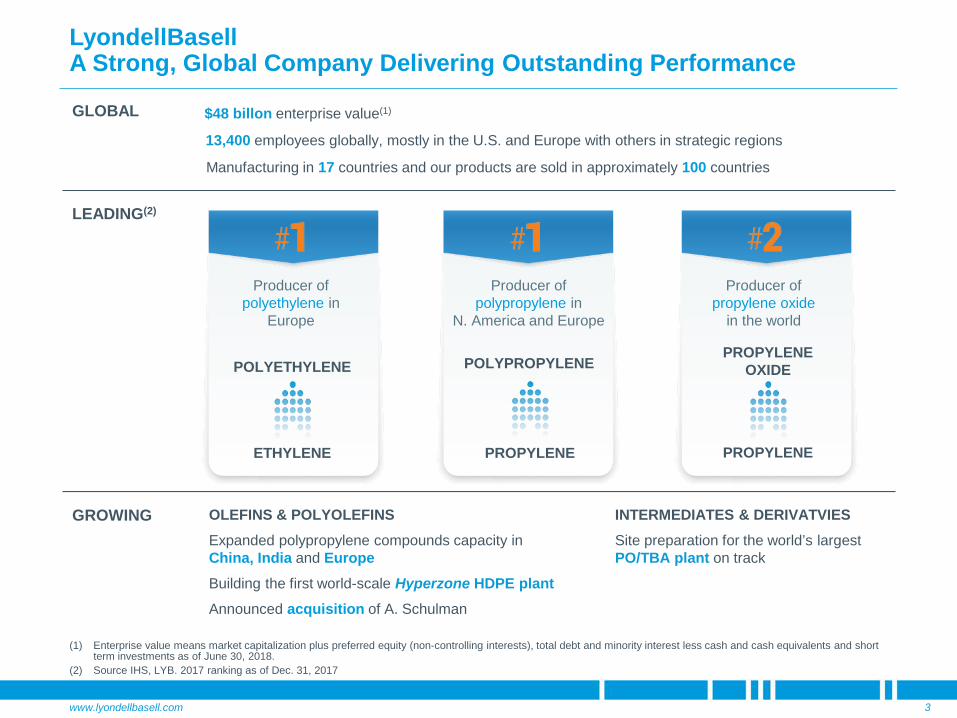
(1) Enterprise value means market capitalization plus preferred equity (non-controlling interests), total debt and minority interest less cash and cash equivalents and short term investments as of June 30, 2018.
(2) Source IHS, LYB. 2017 ranking as of Dec. 31, 2017
13,400 employees globally, mostly in the U.S. and Europe with others in strategic regions
GLOBAL
Manufacturing in 17 countries and our products are sold in approximately 100 countries
$48 billon enterprise value(1)
LEADING(2)
OLEFINS & POLYOLEFINSExpanded polypropylene compounds capacity in China, India and EuropeBuilding the first world-scale Hyperzone HDPE plantAnnounced acquisition of A. Schulman
INTERMEDIATES & DERIVATVIESSite preparation for the world’s largestPO/TBA plant on track
GROWING
Producer ofpolyethylene in
Europe
POLYETHYLENE
ETHYLENE
Producer ofpolypropylene in
N. America and Europe
POLYPROPYLENE
PROPYLENE
Producer ofpropylene oxide
in the world
PROPYLENE OXIDE
PROPYLENE

www.lyondellbasell.com
LyondellBasell 2Q 2018 Last Twelve Months
4
DeliveringResults
AdvancingGrowth
CapturingOpportunity
$ 7.5 billionEBITDA
35%Total Shareholder Return(1)
TargetedInvestment
In Project Management & Execution
Monetizing Innovation
by Licensing Technology
Refinery Reliability
Capturing Margin
Construction on trackfor Hyperzone HDPE
1.1 billion lb
Building theworld’s largest
PO/TBA Plant
NewCompounding
PlantDalian, China
PremiumPolyolefin
Recycling JVwith Suez9.5%
Free Cash Flow Yield
$ 5.8 billionNet Income
(1) Source: CapitalIQ
Exclusive Negotiationswith Odebrecht S.A.
Acquisition on track
A. Schulman
www.lyondellbasell.com
LYB Portfolio Diversity Increases Earnings Resiliency
5
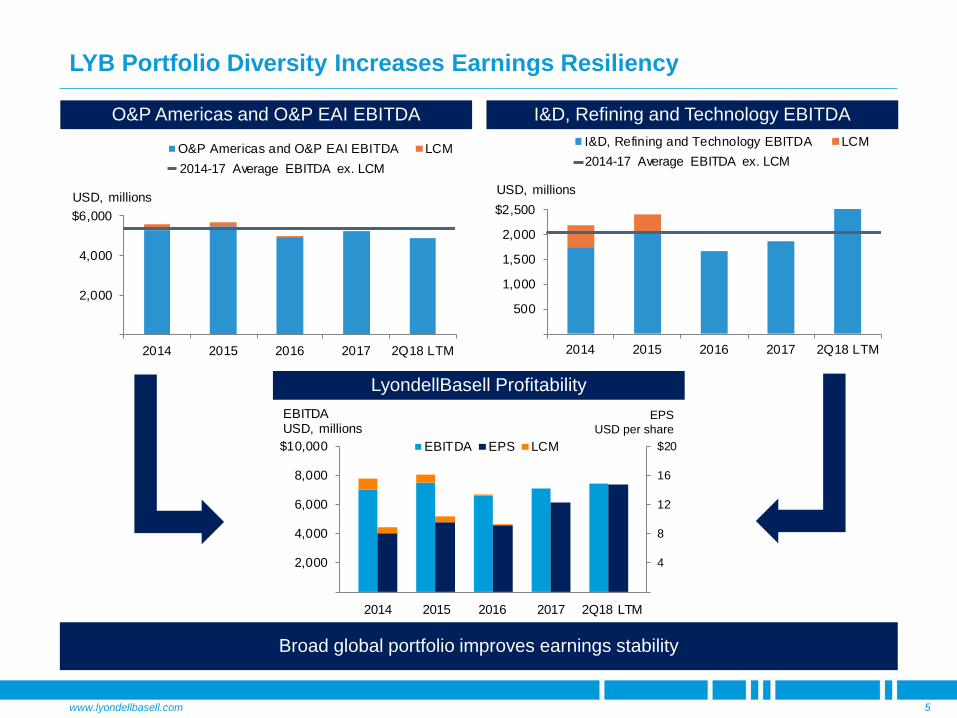
EPSUSD per share
O&P Americas and O&P EAI EBITDA I&D, Refining and Technology EBITDA
LyondellBasell Profitability
Broad global portfolio improves earnings stability
2,000
4,000
$6,000
2014 2015 2016 2017 2Q18 LTM
USD, millions
O&P Americas and O&P EAI EBITDA LCM2014-17 Average EBITDA ex. LCM
500
1,000
1,500
2,000
$2,500
2014 2015 2016 2017 2Q18 LTM
USD, millions
I&D, Refining and Technology EBITDA LCM2014-17 Average EBITDA ex. LCM
4
8
12
16
$20
2,000
4,000
6,000
8,000
$10,000
2014 2015 2016 2017 2Q18 LTM2014 2015 2016 2017 2Q18 LTM
EBITDAUSD, millions
EBITDA EPS LCM
www.lyondellbasell.com
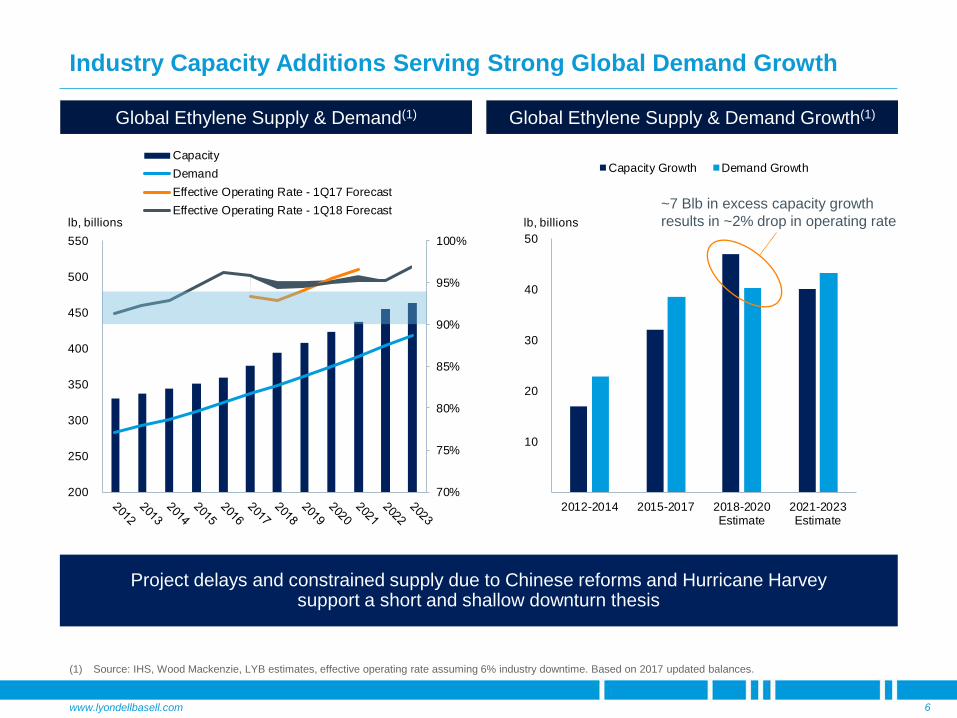
Project delays and constrained supply due to Chinese reforms and Hurricane Harvey support a short and shallow downturn thesis
Industry Capacity Additions Serving Strong Global Demand Growth
6
Global Ethylene Supply & Demand(1)
(1) Source: IHS, Wood Mackenzie, LYB estimates, effective operating rate assuming 6% industry downtime. Based on 2017 updated balances.
Global Ethylene Supply & Demand Growth(1)
70%
75%
80%
85%
90%
95%
100%
200
250
300
350
400
450
500
550lb, billions
CapacityDemandEffective Operating Rate - 1Q17 ForecastEffective Operating Rate - 1Q18 Forecast
10
20
30
40
50
2012-2014 2015-2017 2018-2020Estimate
2021-2023Estimate
lb, billions
Capacity Growth Demand Growth
~7 Blb in excess capacity growth results in ~2% drop in operating rate

www.lyondellbasell.com
Majority of New N. America Industry Capacity Already in the Market
7
2016-2019: N. America Capacity Startups(1)
(1) Source: IHS and LYB estimates.(2) Source: IHS and LYB estimates. Polyethylene domestic demand growth is YTD 2018 compared to YTD 2017. YTD 2018 includes actuals for 1Q18 and IHS forecasts
for 2Q18.
2016-2019: Polyethylene Trade(1)
■ Ethylene units are running well
■ Not all PE units are operating at full rates
■ PE exports are expected to increase
Status & Impact of New Capacity
100
200
Net Exports Net Imports
lbs., billions
North America ChinaAsia ex. China EuropeMiddle East Rest of World
2018 YTD: Strong Operations and Markets(2)
EthyleneEffective
Operating Rate
Polyethylene Domestic Demand
Growth
U.S. & Canada 95% 4.6%
Northeast Asia 97% 6.6%
Europe 96% 1.2%
~ 65% of 19 Blbs of Polyethylene
~ 65% of 24 Blbs of Ethylene

www.lyondellbasell.com
Demand GrowthCapacity Additions
LYB’s Hyperzone PE Technology is Poised to Capture HDPE Demand
8
5
10
15
2015-2017 2018-2020Estimate
World Scale Plants(1)
LDPE 5
10
15
2015-2017 2018-2020Estimate
World Scale Plants(1)
5
10
15
2015-2017 2018-2020Estimate
World Scale Plants(1)
La Porte Hyperzone HDPE
■ 1.1 billion pounds per year
■ Estimated investment: ~$725 million
■ Startup 2019
■ Estimated EBITDA(2): $150 - $200 MM/year
(1) Source: IHS polyethylene supply-demand data with an operating rate of 90%. World scale plant equivalents are 1.1 billion pounds.(2) For the purpose of this slide, estimated EBITDA for Hyperzone Polyethylene is volume times average 2015-2017 margins.
LLDPE
HDPE
La Porte, Texas

www.lyondellbasell.com
Intermediates and Derivatives: A Platform for Earnings Stability & Growth
9
Key Messages
Stable earnings and consistent cash generation
Broad product portfolio with feedstock integration
Leading market positions and differential technologies
Strong market outlook and platform for growth
EBITDA (ex. LCM) History
2017 Product Capacities and Rankings(1)
Botlek, The Netherlands
Product Capacity Global Ranking
Propylene Oxide
5.1 Blbs. #2
Oxyfuels 75 MBPD #2
Styrene 5.9 Blbs. #3
(1) Source: IHS. Capacity data represents 100% capacity share. Ranking represents LYB capacity and LYB proportionate share of joint ventures’ capacity.
500
1,000
1,500
$2,000
2014 2015 2016 2017 2Q18 LTM
USD, millions
EBITDA LCM2014-17 Average EBITDA ex. LCM
www.lyondellbasell.com
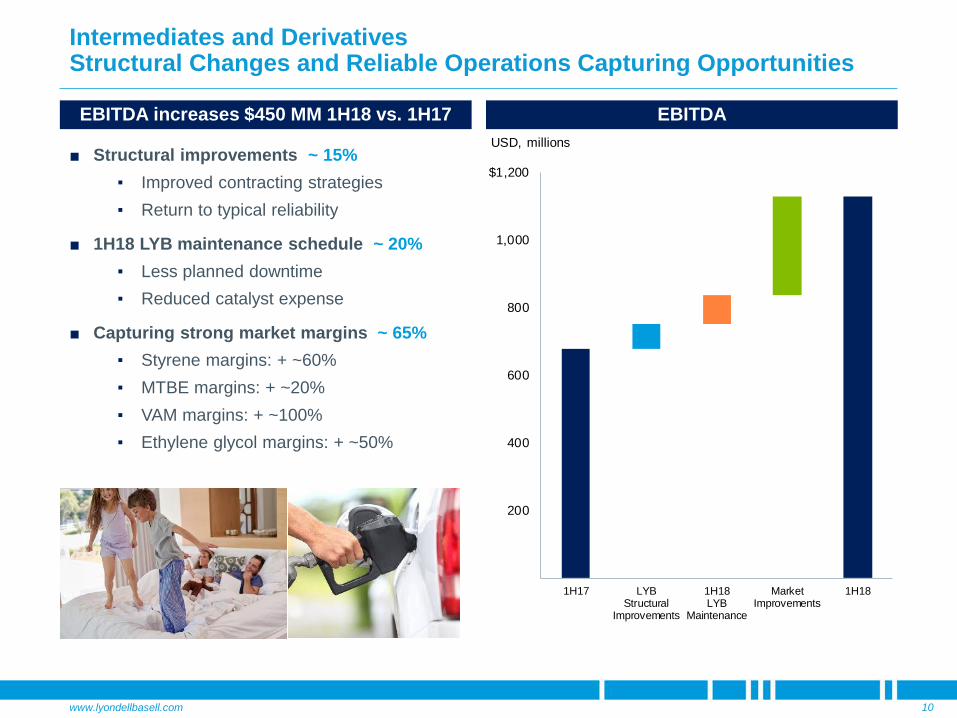
Intermediates and Derivatives Structural Changes and Reliable Operations Capturing Opportunities
10
EBITDA
■ Structural improvements ~ 15%▪ Improved contracting strategies▪ Return to typical reliability
■ 1H18 LYB maintenance schedule ~ 20%▪ Less planned downtime▪ Reduced catalyst expense
■ Capturing strong market margins ~ 65%▪ Styrene margins: + ~60%▪ MTBE margins: + ~20%▪ VAM margins: + ~100%▪ Ethylene glycol margins: + ~50%
EBITDA increases $450 MM 1H18 vs. 1H17
200
400
600
800
1,000
$1,200
1H17 LYBStructural
Improvements
1H18LYB
Maintenance
MarketImprovements
1H18
USD, millions
www.lyondellbasell.com
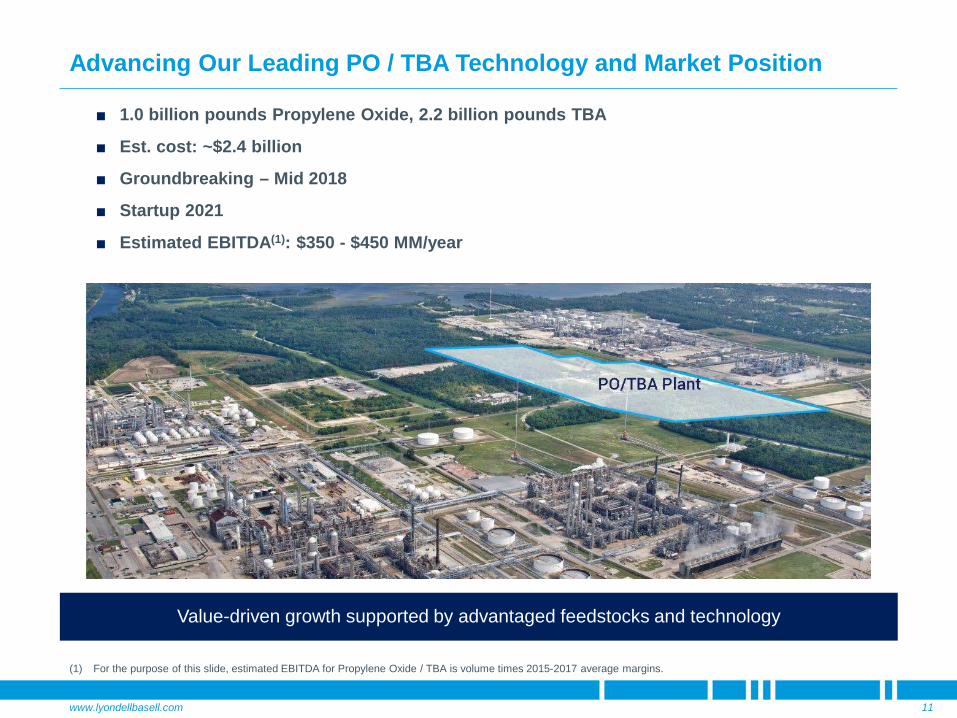
Advancing Our Leading PO / TBA Technology and Market Position
11
Value-driven growth supported by advantaged feedstocks and technology
(1) For the purpose of this slide, estimated EBITDA for Propylene Oxide / TBA is volume times 2015-2017 average margins.
■ 1.0 billion pounds Propylene Oxide, 2.2 billion pounds TBA
■ Est. cost: ~$2.4 billion
■ Groundbreaking – Mid 2018
■ Startup 2021
■ Estimated EBITDA(1): $350 - $450 MM/year

www.lyondellbasell.com
2
4
6
8
$10
5
10
15
20
$25
Sep-18 Mar-19 Sep-19 Mar-20 Sep-20 Mar-21
ULSD - Brent,USD per bbl
■ Improved reliability increased operating rates and throughput since 2017
■ Increased profitability driven by strong diesel demand and improved heavy/light crude differentials
■ Full capability to meet Tier 3 gasoline sulfur specifications
■ Poised to benefit from the January 2020 IMO marine fuel oil sulfur regulations
Improved Refining Reliability Producing Results
12
EBITDA
Refining Throughput
Refinery Outlook
(1) Source: NYMEX as of July 20, 2018
Indicative Forward Curves(1)
Brent – Dubai,USD per bbl
ULSD – Brent
Brent – Dubai
200
400
$600
2014 2015 2016 2017 2Q18 LTM
EBITDA LCMUSD, millions
100
200
300
2014 2015 2016 2017 2Q18 LTM
BPD, thousandsCrude Capacity

www.lyondellbasell.com
Strong, Consistent Cash Generation
13
LYB Cash From Operating Activities
Cash From Operating Activities as a Percent of Average Enterprise Value(3)
(1) Free Cash Flow is calculated as cash from operating activities less capital expenditures. (2) Total liquidity includes cash and cash equivalents, restricted cash and restricted cash equivalents, short term investments, repurchase agreements, and availability
under our Senior Revolving Credit Facility and U.S. Receivables Facility as of June 30, 2018.(3) Source: CapIQ, LYB. Cash from operating activities is as of December 31 for each full year and as of June 30, 2018 for the period 2Q18 LTM. Average enterprise
value means average market capitalization plus preferred equity, total debt and minority interest less cash and cash equivalents and short term investments. Market capitalization is based upon the average daily closing share price for the respective period. Preferred equity, total debt, minority interest, cash and cash equivalents and short-term investments are as of the last day of the respective period.
■ 2Q18 LTM Capex: $1.6 billion
■ 2Q18 LTM Free Cash Flow(1): $4.1 billion
■ 2Q18 Ending Total Liquidity(2): $7.3 billion1,0002,0003,0004,0005,0006,000
$7,000
2014 2015 2016 2017 2Q18 LTM
USD, millions Free Cash Flow Capex
0%
3%
6%
9%
12%
15%
18%
LYB WLK HUN DOW EMN CE DD
2014 2015 2016 2017 2Q18 LTM

www.lyondellbasell.com
Sources 2013-2017 Uses Priority
Cash From Operating Activities
Balance Sheet
Capacity
Optional
Mandatory
Profitability Supports Reinvestment for Value-Driven Growth
14
BaseCAPEX
Dividends
Growth CAPEX
ShareRepurchase
Balance Sheet
Capacity
2018-2022 Uses
BaseCAPEX
Dividends
Growth CAPEX
ShareRepurchase
Inorganic Opportunities
Note: Graphic for illustrative purposes only.
www.lyondellbasell.com
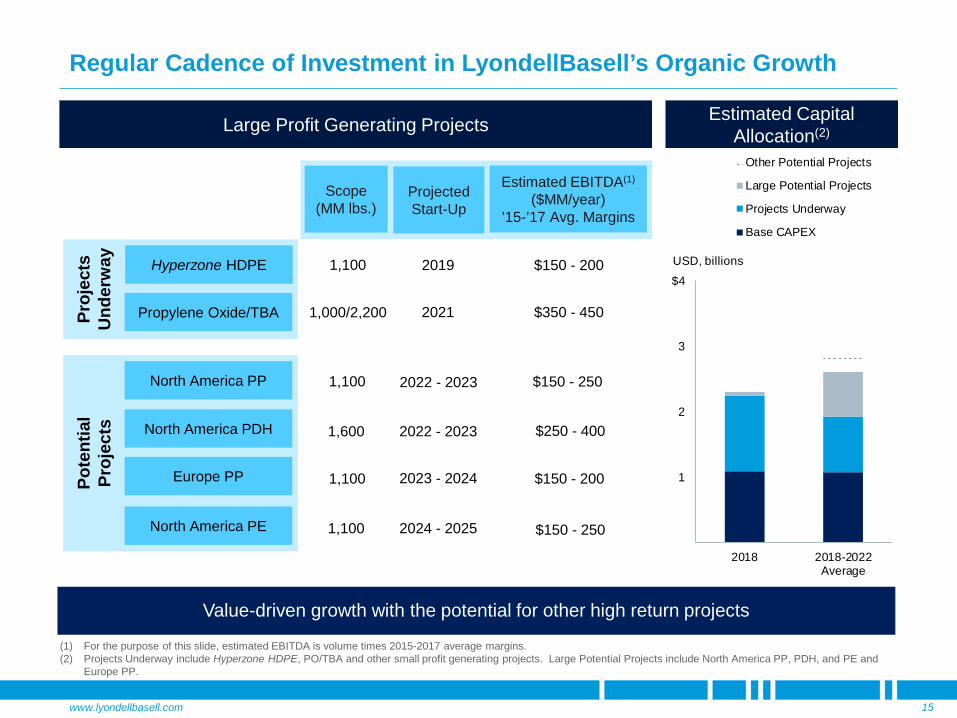
Regular Cadence of Investment in LyondellBasell’s Organic Growth
15
Value-driven growth with the potential for other high return projects
Pote
ntia
lPr
ojec
tsPr
ojec
ts
Und
erw
ay
North America PDH
North America PP
Propylene Oxide/TBA
Hyperzone HDPE
Europe PP
North America PE
Scope (MM lbs.)
Estimated EBITDA(1)
($MM/year)’15-’17 Avg. Margins
1,100 $150 - 200
1,000/2,200 $350 - 450
1,100
1,600
1,100
1,100
$150 - 250
$250 - 400
$150 - 200
$150 - 250
Large Profit Generating Projects Estimated Capital Allocation(2)
(1) For the purpose of this slide, estimated EBITDA is volume times 2015-2017 average margins.(2) Projects Underway include Hyperzone HDPE, PO/TBA and other small profit generating projects. Large Potential Projects include North America PP, PDH, and PE and
Europe PP.
Projected Start-Up
2019
2021
2022 - 2023
2022 - 2023
2023 - 2024
2024 - 2025
1
2
3
$4
2018 2018-2022Average
USD, billions
Other Potential Projects
Large Potential Projects
Projects Underway
Base CAPEX
www.lyondellbasell.com 16
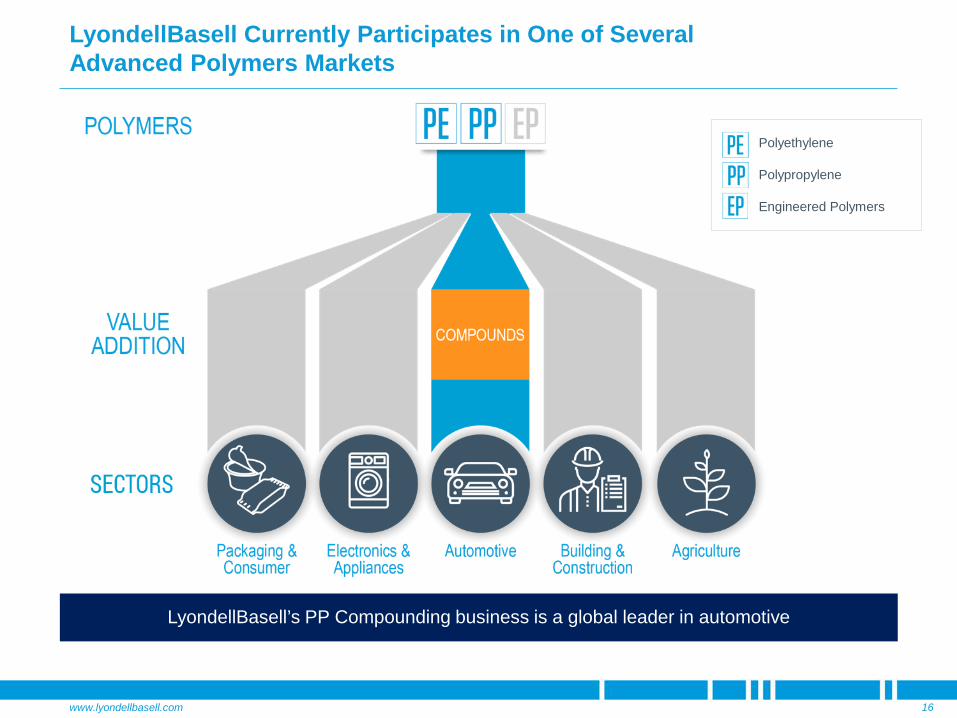
LyondellBasell Currently Participates in One of SeveralAdvanced Polymers Markets
LyondellBasell’s PP Compounding business is a global leader in automotive
Polyethylene
Polypropylene
Engineered Polymers

www.lyondellbasell.com 17
Combination Enables Vertically Integrated Solutions and Expands Offering
Comprehensive customer solutions for broad and attractive markets
Polyethylene
Polypropylene
Engineered Polymers
www.lyondellbasell.com
(1)
Revenue by Geographies
Revenue by End Markets
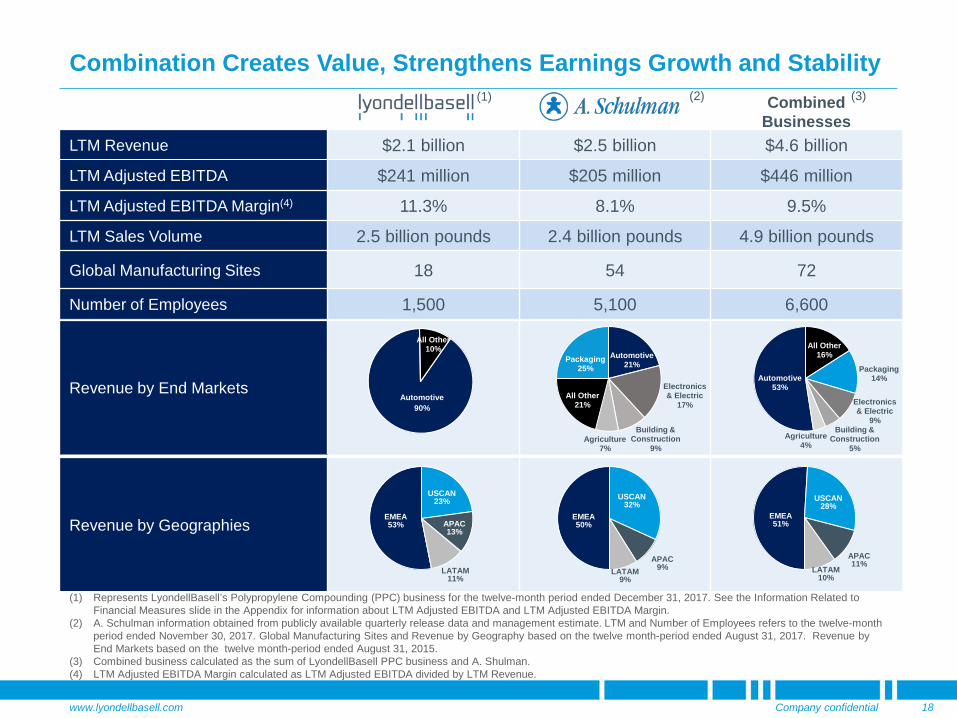
Combination Creates Value, Strengthens Earnings Growth and Stability
18Company confidential
Combined Businesses
LTM Revenue $2.1 billion $2.5 billion $4.6 billion
LTM Adjusted EBITDA $241 million $205 million $446 million
LTM Adjusted EBITDA Margin(4) 11.3% 8.1% 9.5%
LTM Sales Volume 2.5 billion pounds 2.4 billion pounds 4.9 billion pounds
Global Manufacturing Sites 18 54 72
Number of Employees 1,500 5,100 6,600
Building & Construction
9%Agriculture
7%
Automotive90%
Packaging25%
Automotive21%
Electronics & Electric
17%All Other
21%
Automotive53%
All Other16%
Packaging14%
Electronics & Electric
9%Building &
Construction5%
Agriculture4%
EMEA53%
USCAN23%
APAC13%
LATAM11%
EMEA50%
USCAN32%
APAC9%LATAM
9%
EMEA51%
USCAN28%
APAC11%
LATAM10%
(1) Represents LyondellBasell’s Polypropylene Compounding (PPC) business for the twelve-month period ended December 31, 2017. See the Information Related to Financial Measures slide in the Appendix for information about LTM Adjusted EBITDA and LTM Adjusted EBITDA Margin.
(2) A. Schulman information obtained from publicly available quarterly release data and management estimate. LTM and Number of Employees refers to the twelve-month period ended November 30, 2017. Global Manufacturing Sites and Revenue by Geography based on the twelve month-period ended August 31, 2017. Revenue by End Markets based on the twelve month-period ended August 31, 2015.
(3) Combined business calculated as the sum of LyondellBasell PPC business and A. Shulman.(4) LTM Adjusted EBITDA Margin calculated as LTM Adjusted EBITDA divided by LTM Revenue.
(2) (3)
All Other10%
www.lyondellbasell.com
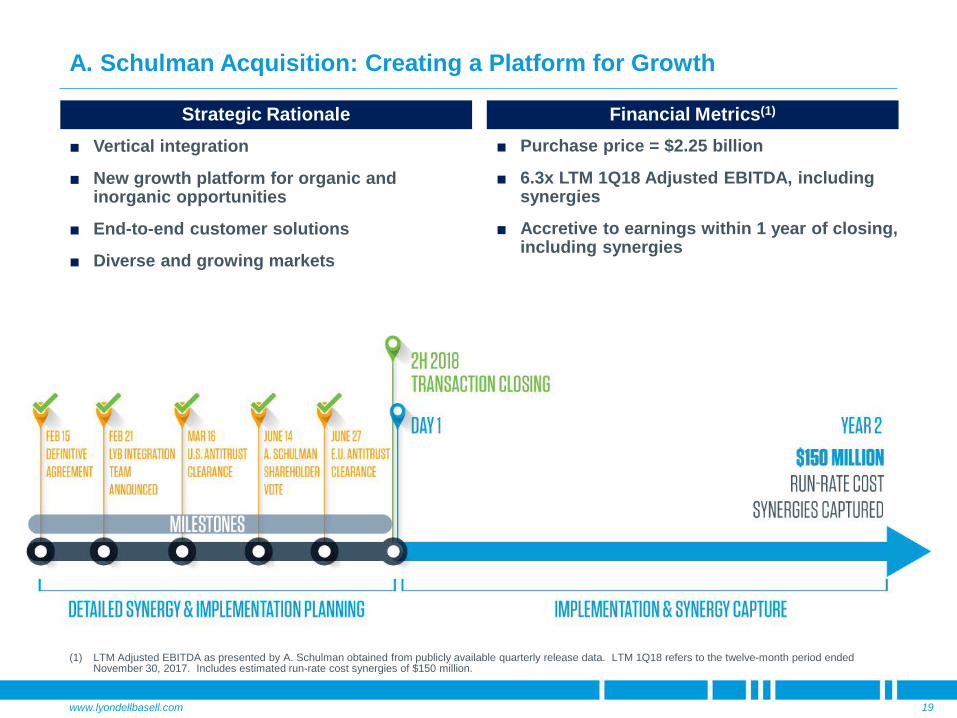
■ Vertical integration
■ New growth platform for organic and inorganic opportunities
■ End-to-end customer solutions
■ Diverse and growing markets
A. Schulman Acquisition: Creating a Platform for Growth
19
■ Purchase price = $2.25 billion
■ 6.3x LTM 1Q18 Adjusted EBITDA, including synergies
■ Accretive to earnings within 1 year of closing, including synergies
Financial Metrics(1)Strategic Rationale
(1) LTM Adjusted EBITDA as presented by A. Schulman obtained from publicly available quarterly release data. LTM 1Q18 refers to the twelve-month period ended November 30, 2017. Includes estimated run-rate cost synergies of $150 million.
www.lyondellbasell.com
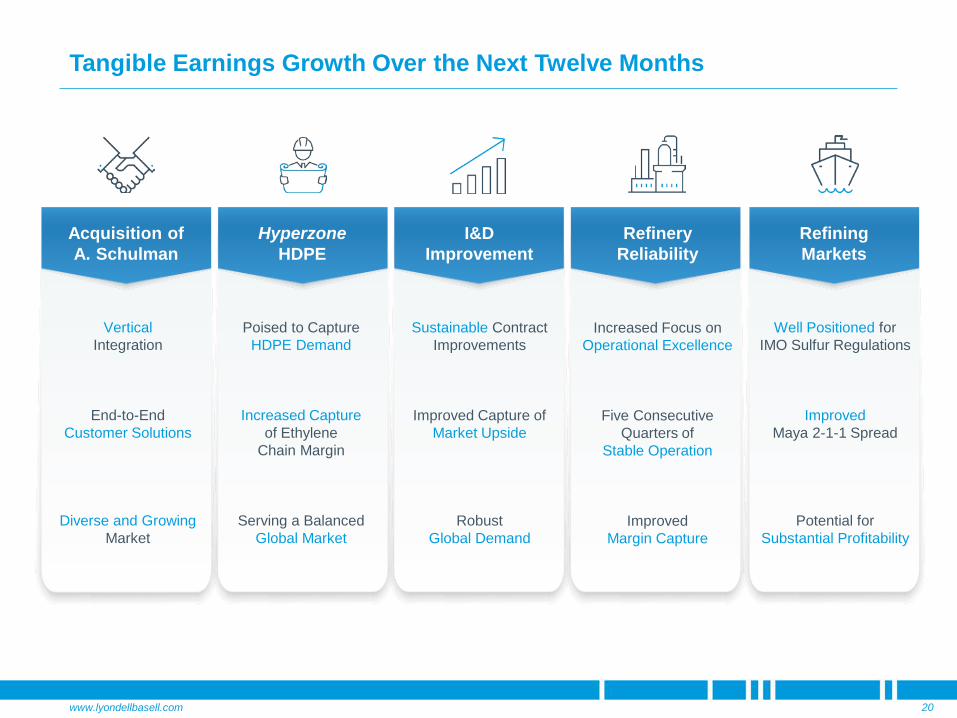
Tangible Earnings Growth Over the Next Twelve Months
20
HyperzoneHDPE
Refinery Reliability
I&D Improvement
Refining Markets
VerticalIntegration
End-to-End Customer Solutions
Diverse and Growing Market
Poised to Capture HDPE Demand
Increased Capture of Ethylene
Chain Margin
Serving a BalancedGlobal Market
Acquisition of A. Schulman
Sustainable Contract Improvements
Improved Capture of Market Upside
Robust Global Demand
Increased Focus on Operational Excellence
Five Consecutive Quarters of
Stable Operation
ImprovedMargin Capture
Well Positioned for IMO Sulfur Regulations
Improved Maya 2-1-1 Spread
Potential for Substantial Profitability

www.lyondellbasell.com
Growth Guided by Strategic Goals
21
Leverage Core Strengths: Safe & reliable operations Cost discipline Global reach and broad portfolio
Advance Profitable Growth: Focus on advantaged and
differentiated products and markets
Capture Opportunities: Consistent with LYB strengths Create tangible value
Consistent Top-Quartile
TSR
MAINTAIN INVESTMENT-GRADE CREDIT RATING

www.lyondellbasell.com
Appendix
22Company confidential

www.lyondellbasell.com
-40
-30
-20
-10
0PE PPlbs., billions
2017 2022
50
100
150
200
250
1990 1994 1998 2002 2006 2010 2014 2018Fcst.
lbs., billions
PE PP
Global Macro Trends - Demographics Driving Demand
23
2016 Polyolefins Consumption
World PE and PP Demand
Source: IHS.1. China polyolefin trade deficit is production less domestic demand.
China Polyolefin Trade Deficit(1)
’90 – ’16 PE: 4.4%PP: 6.6%
’11 – ’16 PE: 3.6%PP: 4.9%
’15 – ‘16PE: 3.9%PP: 4.4%0
100
200
300
400
2012 2013 2014 2015 2016 2017 2018 2019 2020 2021
China India Western Europe U.S.
Households, millions
20
40
60
80
0 10 20 30 40 $50GDP per capita, USD thousands
Consumption, lb/personN. America
W. EuropeNortheast
AsiaSoutheast
Asia
Indian Subcontinent
PE
PP
Upper/Middle Class Households
www.lyondellbasell.com
This presentation makes reference to certain “non-GAAP” financial measures as defined in Regulation G of the U.S. Securities Exchange Act of 1934, as amended. The non-GAAP measures we have presented include diluted earnings per share excluding LCM, EBITDA, EBITDA excluding LCM, LTM Adjusted EBITDA and LTM Adjusted EBITDA Margin. LCM stands for “lower of cost or market,” which is an accounting rule consistent with GAAP related to the valuation of inventory. Our inventories are stated at the lower of cost or market. Cost is determined using the last-in, first-out (“LIFO”) inventory valuation methodology, which means that the most recently incurred costs are charged to cost of sales and inventories are valued at the earliest acquisition costs. Market is determined based on an assessment of the current estimated replacement cost and selling price of the inventory. In periods where the market price of our inventory declines substantially, cost values of inventory may be higher than the market value, which results in us writing down the value of inventory to market value in accordance with the LCM rule, consistent with GAAP. This adjustment is related to our use of LIFO accounting and the decline in pricing for many of our raw material and finished goods inventories. We report our financial results in accordance with U.S. generally accepted accounting principles, but believe that certain non-GAAP financial measures, such as EBITDA and earnings and EBITDA excluding LCM, provide useful supplemental information to investors regarding the underlying business trends and performance of the company's ongoing operations and are useful for period-over-period comparisons of such operations. Non-GAAP financial measures should be considered as a supplement to, and not as a substitute for, or superior to, the financial measures prepared in accordance with GAAP.
EBITDA, as presented herein, may not be comparable to a similarly titled measure reported by other companies due to differences in the way the measure is calculated. We calculate EBITDA as income from continuing operations plus interest expense (net), provision for (benefit from) income taxes, and depreciation & amortization. EBITDA should not be considered an alternative to profit or operating profit for any period as an indicator of our performance, or as an alternative to operating cash flows as a measure of our liquidity. We have also presented financial information herein exclusive of adjustments for LCM.
Additionally, LTM Adjusted EBITDA and LTM Adjusted EBITDA Margin, as presented herein, may not be comparable to similarly titled measures of A. Schulman or as reported by other companies due to differences in the way the measure is calculated. LTM Adjusted EBITDA, as presented for LyondellBasell Polypropylene Compounding (PPC) business, is calculated based upon a standard inventory costing methodology. For GAAP purposes, we present EBITDA for our Olefins and Polyolefins Europe, Asia, and International segment which includes PPC based upon last-in, first-out (LIFO) inventory costing methodology. To date, we have not allocated a ‘LIFO effect’ to PPC as it is not available. As such, we are unable to provide a quantitative reconciliation of Adjusted EBITDA to the most directly comparable GAAP measure. We calculate PPC Adjusted EBITDA in this presentation as income from continuing operations, with cost of goods sold valued at standard cost, plus interest expense (net), provision for (benefit from) income taxes, and depreciation & amortization. Adjusted EBITDA should not be considered an alternative to profit or operating profit for any period as an indicator of our performance, or as an alternative to operating cash flows as a measure of our liquidity. LTM Adjusted EBITDA Margin is calculated as LTM Adjusted EBITDA divided by LTM Revenue.
While we also believe that free cash flow (FCF) and free cash flow yield (FCF Yield) are measures commonly used by investors, free cash flow and free cash flow yield, as presented herein, may not be comparable to similarly titled measures reported by other companies due to differences in the way the measures are calculated. For purposes of this presentation, free cash flow means net cash provided by operating activities minus capital expenditures and free cash flow yield means the ratio of free cash flow to market capitalization.
Additionally, total liquidity, enterprise value and the ratio of cash from operating activities to average enterprise value are measures that provide an indicator of value to investors. For purposes of this presentation, total liquidity includes cash and cash equivalents, restricted cash and restricted cash equivalents, short term investments, repurchase agreements, and availability under our Senior Revolving Credit Facility and U.S. Receivables Securitization Facility. Enterprise value means market capitalization plus preferred equity (non-controlling interests), total debt and minority interest less cash and cash equivalents and short term investments. The ratio of cash from operating activities to average enterprise value means cash from operating activities divided by average enterprise value. Average enterprise value means average market capitalization plus preferred equity (non-controlling interests), total debt and minority interest less cash and cash equivalents and short term investments.
Reconciliations for our non-GAAP measures can be found on our website at www.lyondellbasell.com/investorrelations.
Information Related to Financial Measures
24

www.lyondellbasell.com
Enterprise Value
25
Calculation of Enterprise Value
In Millions of Dollars, except share amounts June 30,
2018Common Shares Outstanding 390,343,283 Closing Price $ 109.85 Market Capitalization 42,879
Current Maturities of Long Term Debt 974 Short-Term Debt 76 Long-Term Debt 7,490
Less:Cash and Cash Equivalents 2,384 Short-Term Investments 933 Net Debt 5,223
Non-Controlling Interests 1Enterprise Value 48,103$
Enterprise Value, in billions $ 48

www.lyondellbasell.com
EBITDA Excluding LCM Adjustments to EBITDA
26
For the Year Ended
Last Twelve Months Average
In Millions of DollarsDecember 31,
2014December 31,
2015December 31,
2016March 31,
2017June 30,
2017September 30,
2017December 31,
2017December 31,
2017June 30,
2017June 30,
2018June 30,
2018 2014 - 2017EBITDA excluding LCM: Olefins & Polyolefins - Americas 4,190$ 3,821$ 2,906$ 723$ 859$ 616$ 784$ 2,982$ (1,582)$ 1,480$ 2,880$ 3,475$ Olefins & Polyolefins - EAI 1,410 1,855 2,067 529 699 698 356 2,282 (1,228) 965 2,019 1,904 Intermediates & Derivatives 1,552 1,656 1,333 339 339 402 410 1,490 (678) 1,128 1,940 1,508 Refining 409 519 72 (30) 25 58 104 157 5 167 329 289 Technology 232 243 262 60 48 47 68 223 (108) 169 284 240 Other 17 (13) (9) (4) - - 4 - 4 14 18 (1) Continuing 7,810 8,081 6,631 1,617 1,970 1,821 1,726 7,134 (3,587) 3,923 7,470 7,414
LCMOlefins & Polyolefins - Americas 279 160 29 - - - - - - - - 117 Olefins & Polyolefins - EAI 44 30 - - - - - - - - - 19 Intermediates & Derivatives 93 181 - - - - - - - - - 69 Refining 344 177 - - - - - - - - - 130 Technology - - - - - - - - - - - - Other - - - - - - - - - - - - Continuing 760 548 29 - - - - - - - - 334
EBITDA: Olefins & Polyolefins - Americas 3,911 3,661 2,877 723 859 616 784 2,982 (1,582) 1,480 2,880 3,358 Olefins & Polyolefins - EAI 1,366 1,825 2,067 529 699 698 356 2,282 (1,228) 965 2,019 1,885 Intermediates & Derivatives 1,459 1,475 1,333 339 339 402 410 1,490 (678) 1,128 1,940 1,439 Refining 65 342 72 (30) 25 58 104 157 5 167 329 159 Technology 232 243 262 60 48 47 68 223 (108) 169 284 240 Other 17 (13) (9) (4) - - 4 - 4 14 18 (1) Continuing 7,050 7,533 6,602 1,617$ 1,970$ 1,821$ 1,726$ 7,134$ (3,587)$ 3,923$ 7,470$ 7,080
Reconciliation of EBITDA Excluding Lower of Cost or Market Inventory Valuation Adjustments ("LCM Adjustments") to EBITDA
For the Years Ended For the Three Months Ended For the Six Months Ended
www.lyondellbasell.com
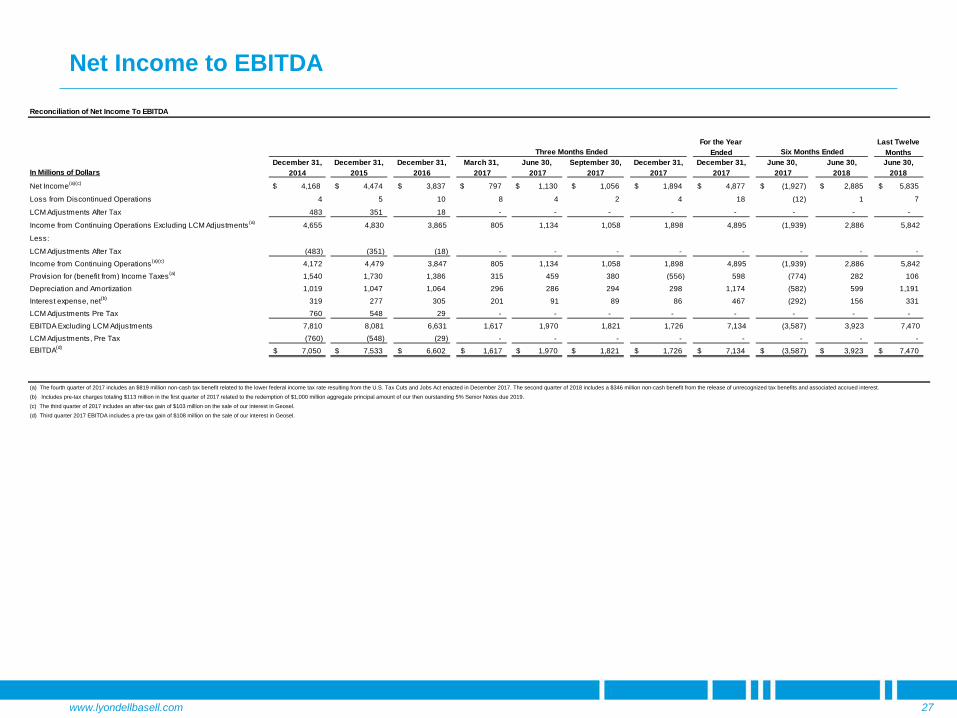
Net Income to EBITDA
27
Reconciliation of Net Income To EBITDA
For the Year Ended
Last Twelve Months
In Millions of DollarsDecember 31,
2014December 31,
2015December 31,
2016March 31,
2017June 30,
2017September 30,
2017December 31,
2017December 31,
2017June 30,
2017June 30,
2018June 30,
2018Net Income(a)(c) $ 4,168 4,474$ 3,837$ $ 797 $ 1,130 1,056$ 1,894$ 4,877$ (1,927)$ 2,885$ 5,835$
Loss from Discontinued Operations 4 5 10 8 4 2 4 18 (12) 1 7
LCM Adjustments After Tax 483 351 18 - - - - - - - -
Income from Continuing Operations Excluding LCM Adjustments(a) 4,655 4,830 3,865 805 1,134 1,058 1,898 4,895 (1,939) 2,886 5,842
Less:
LCM Adjustments After Tax (483) (351) (18) - - - - - - - - Income from Continuing Operations(a)(c) 4,172 4,479 3,847 805 1,134 1,058 1,898 4,895 (1,939) 2,886 5,842 Provision for (benefit from) Income Taxes(a) 1,540 1,730 1,386 315 459 380 (556) 598 (774) 282 106 Depreciation and Amortization 1,019 1,047 1,064 296 286 294 298 1,174 (582) 599 1,191 Interest expense, net(b) 319 277 305 201 91 89 86 467 (292) 156 331 LCM Adjustments Pre Tax 760 548 29 - - - - - - - - EBITDA Excluding LCM Adjustments 7,810 8,081 6,631 1,617 1,970 1,821 1,726 7,134 (3,587) 3,923 7,470 LCM Adjustments, Pre Tax (760) (548) (29) - - - - - - - - EBITDA(d) 7,050$ 7,533$ 6,602$ 1,617$ 1,970$ 1,821$ 1,726$ 7,134$ (3,587)$ 3,923$ 7,470$
Three Months Ended Six Months Ended
(a) The fourth quarter of 2017 includes an $819 million non-cash tax benefit related to the lower federal income tax rate resulting from the U.S. Tax Cuts and Jobs Act enacted in December 2017. The second quarter of 2018 includes a $346 million non-cash benefit from the release of unrecognized tax benefits and associated accrued interest.(b) Includes pre-tax charges totaling $113 million in the first quarter of 2017 related to the redemption of $1,000 million aggregate principal amount of our then ourstanding 5% Senior Notes due 2019.(c) The third quarter of 2017 includes an after-tax gain of $103 million on the sale of our interest in Geosel. (d) Third quarter 2017 EBITDA includes a pre-tax gain of $108 million on the sale of our interest in Geosel.

www.lyondellbasell.com
Free Cash Flow Yield
28
Calculation of Free Cash Flow Yield
Last Twelve
In Millions of Dollars (except share data)September 30,
2017December 31,
2017March 31,
2017June 30,
2018June 30,
2018Net Cash Provided by Operating Activities $ 1,486 $ 1,482 $ 1,006 $ 1,727 $ 5,701 Less: Capital Expenditures 318 401 429 496 1,644 Free Cash Flow $ 1,168 $ 1,081 $ 577 $ 1,231 $ 4,057
Divided by:
Market Capital:Common stock outstanding 390,343,283 Closing Share Price, end of period $ 109.85 Market Capital $ 42,879
Free Cash Flow Yield 9.5%
Three Months Ended

www.lyondellbasell.com
Diluted EPS Excluding LCM Adjustments to Diluted EPS
29
Reconciliation of Diluted EPS Excluding LCM Adjustments to Diluted EPS
Last Twelve Months
June 30,
2014
2015
2016 2017 2018
Diluted Earnings Per Share Excluding LCM Adjustments $ 8.91 $ 10.34 $ 9.18 $ 12.23 $ 14.79 Less: LCM Adjustments 0.92 0.75 0.05 - - Diluted Earnings Per Share 7.99$ 9.59$ 9.13$ 12.23$ 14.79$
For the Years Ended December 31,

www.lyondellbasell.com
Free Cash Flow to Net Cash Provided by Operating Activities
30
Reconciliation of Free Cash Flow to Net Cash Provided by Operating Activities
Year EndedLast Twelve
Months
In Millions of Dollars 2014 2015 2016 2017December 31,
2017June 30,
2017June 30,
2018June 30,
2018Free Cash Flow $ 4,549 $ 4,402 $ 3,363 $ 3,659 $ 3,659 $ (1,410) $ 1,808 $ 4,057 Add: Capital Expenditures 1,499 1,440 2,243 1,547 1,547 (828) 925 1,644 Net Cash Provided by Operating Activities 6,048$ 5,842$ 5,606$ 5,206$ 5,206$ (2,238)$ 2,733$ 5,701$
Years Ended December 31, Six Months Ended

www.lyondellbasell.com
Cash and Liquid Investments and Total Liquidity
31
In Millions of DollarsJune 30,
2018Cash and Cash Equivalents and Restricted Cash $ 2,386 Short-Term Investments 933 Repurchase Agreements 554
Cash and Liquid Investments 3,873 Availability under Senior Revolving Credit Facility 2,500
Availability under U.S. Receivables Facility 900 Total Liquidity 7,273$
Components of Cash and Liquid Investments and Total Liquidity

www.lyondellbasell.com
Cash from Operating Activities as a Percent of Average Enterprise Value
32
Cash from Operating Activities as a Percent of Average Enterprise Value
Last Twelve Months
In Millions of Dollars, except share amounts 2014 2015 2016 2017June 30,
2018Cash from Operating Activities $ 6,048 $ 5,842 $ 5,606 $ 5,206 $ 5,701
Average Enterprise Value:Common Shares Outstanding 486,969,402 440,150,069 404,046,331 394,512,054 390,343,283 Daily Average Closing Price $ 93.66 $ 91.47 $ 81.00 $ 92.00 $ 103.77 Market Capitalization 45,610 40,261 32,728 36,295 40,506
Current Maturities of Long Term Debt 4 4 2 2 974 Short-Term Debt 346 353 594 68 76 Long-Term Debt 6,695 7,671 8,385 8,549 7,490
Less:Cash and Cash Equivalents 1,031 924 875 1,523 2,384 Short-Term Investments 1,593 1,064 1,147 1,307 933 Net Debt 4,421 6,040 6,959 5,789 5,223
Non-Controlling Interests 30 24 25 1 1 Enterprise Value 50,061$ 46,325$ 39,712$ 42,085$ 45,730$
Cash from Operating Activities as a Percent of Enterprise Value 12% 13% 14% 12% 12%
For the Years Ended December 31,