jefferies industrials conference - luxfer · jefferies industrials conference. new york city....
TRANSCRIPT
1LUXFER GROUP © 2017 Luxfer Holdings PLC, All Rights Reserved
Innovative solutions in material technology
© 2017 Luxfer Holdings PLC, All Rights Reserved
Jefferies Industrials Conference
New York City
August, 2017

2LUXFER GROUP © 2017 Luxfer Holdings PLC, All Rights Reserved
FORWARD-LOOKING STATEMENTS
This presentation contains forward-looking statements. Examples of such forward-looking statements include, but are not limited to: (i) statements regarding the Group’s results of operations and financial condition, (ii) statements of plans, objectives or goals of the Group or its management, including those related to financing, products or services, (iii) statements of future economic performance; and (iv) statements of assumptions underlying such statements. Words such as “believes”, “anticipates”, “expects”, “intends”, “forecasts” and “plans” and similar expressions are intended to identify forward-looking statements but are not the exclusive means of identifying such statements. By their very nature, forward-looking statements involve inherent risks and uncertainties, both general and specific, and risks exist that the predictions,forecasts, projections and other forward-looking statements will not be achieved. The Group cautions that a number of important factors could cause actual results to differ materially from the plans, objectives, expectations, estimates and intentions expressed in such forward-looking statements. These factors include, but are not limited to: (i) future revenues being lower than expected; (ii) increasing competitive pressures in the industry; (iii) general economic conditions or conditions affecting demand for the services offered by us in the markets in which we operate, both domestically and internationally, including as a result of the Brexit referendum, being less favorable than expected; (iv) worldwide economic and business conditions and conditions in the industries in which we operate; (v) fluctuations in the cost of raw materials and utilities; (vi) currency fluctuations and hedging risks; (vii) our ability to protect our intellectual property; and (viii) the significant amount of indebtedness we have incurred and may incur and the obligations to service such indebtedness and to comply with the covenants contained therein. The Group cautions that the foregoing list of important factors is not exhaustive. These factors are more fully discussed in the sections “Forward-Looking Statements” and “Risk factors” in our Annual Report on Form 20-F for the year ended December 31, 2016, filed with the U.S. Securities and Exchange Commission on March 14, 2017. When relying on forward-looking statements to make decisions with respect to the Group, investors and others should carefully consider the foregoing factors and other uncertainties and events. Such forward-looking statements speak only as of the date on which they are made, and the Group does not undertake any obligation to update or revise any of them, whether as a result of new information, future events or otherwise.

3LUXFER GROUP © 2017 Luxfer Holdings PLC, All Rights Reserved
Luxfer Holdings PLC is an industrial manufacturer of technologically advanced lightweight, high-strength, corrosion-resistant alloys, composites and specialty materials for a wide range of applications in aerospace, industrial, defense, safety and healthcare. Luxfer listed on the NYSE in October 2012, under the symbol LXFR.
LUXFER OVERVIEW
Key Metrics
• 2016 Revenue: $415M
• 2016 EBITDA*: $55M
• 2016 EPS*: $0.92
• Current Market Cap: 334M
• Current Employees: 1,800
2017 Expectation
10% improvementin EBITDA*
Gas Cylinders Segment
Key product lines
• Aluminum cylinders
• Composite cylinders
• Alternative fuel cylinders
• Superform
Key metrics
• 2016 Revenue: $226M
• 2016 EBITDA*: $20M
Elektron Segment
Key product lines
• Magnesium alloys
• Zirconium chemicals
• Magtech products
• Graphic arts products
Key metrics
• 2016 Revenue: $189M
• 2016 EBITDA*: $35M
*Adjusted non-IFRS/GAAP numbers. Reconciliation published in 20-F available at www.luxfer.com.
4LUXFER GROUP © 2017 Luxfer Holdings PLC, All Rights Reserved
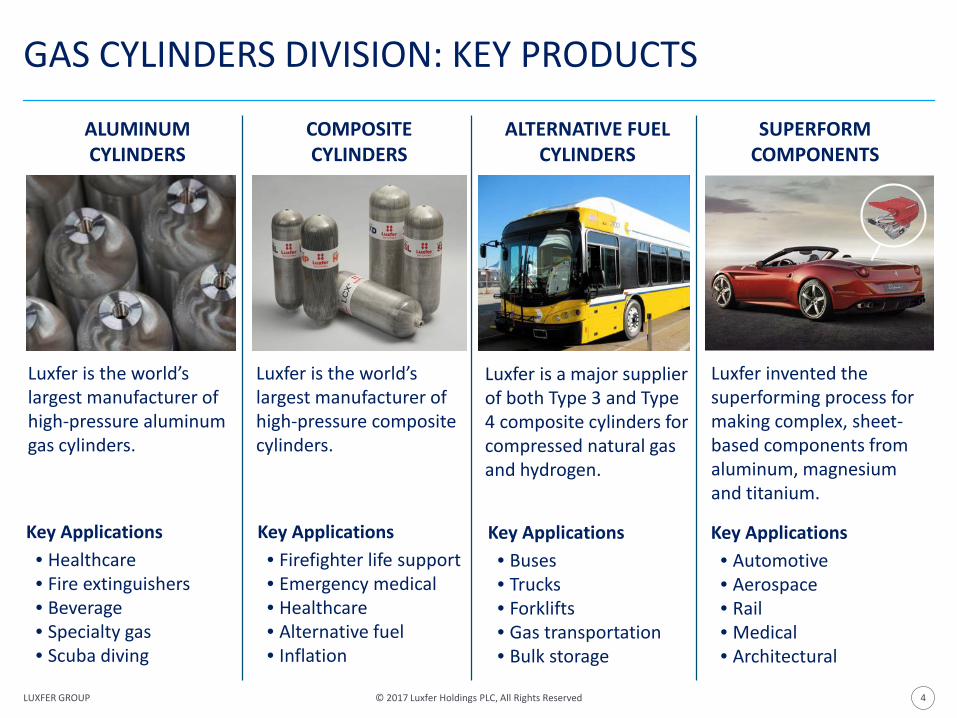
GAS CYLINDERS DIVISION: KEY PRODUCTS
ALUMINUM CYLINDERS
Key Applications• Healthcare• Fire extinguishers• Beverage• Specialty gas• Scuba diving
COMPOSITE CYLINDERS
Key Applications• Firefighter life support• Emergency medical• Healthcare• Alternative fuel• Inflation
ALTERNATIVE FUEL CYLINDERS
Key Applications• Buses• Trucks• Forklifts• Gas transportation• Bulk storage
SUPERFORMCOMPONENTS
Key Applications• Automotive• Aerospace• Rail• Medical• Architectural
Luxfer is the world’s largest manufacturer of high-pressure composite cylinders.
Luxfer is a major supplier of both Type 3 and Type 4 composite cylinders for compressed natural gas and hydrogen.
Luxfer invented the superforming process for making complex, sheet-based components from aluminum, magnesiumand titanium.
Luxfer is the world’s largest manufacturer of high-pressure aluminum gas cylinders.
5LUXFER GROUP © 2017 Luxfer Holdings PLC, All Rights Reserved
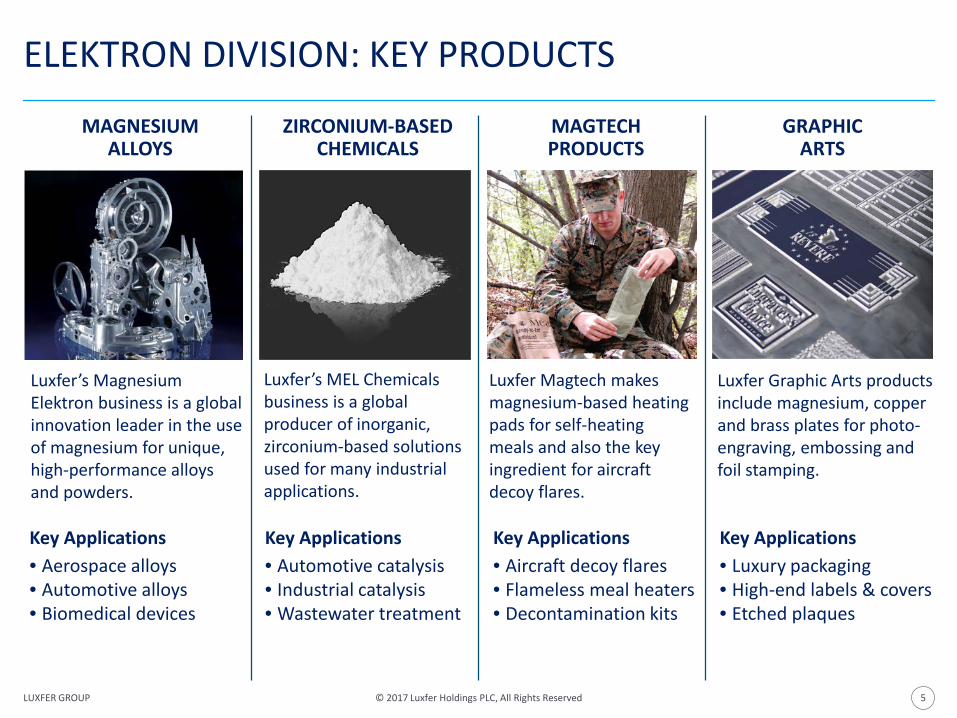
ELEKTRON DIVISION: KEY PRODUCTS
MAGNESIUMALLOYS
Key Applications• Aerospace alloys• Automotive alloys• Biomedical devices
ZIRCONIUM-BASEDCHEMICALS
Key Applications• Automotive catalysis• Industrial catalysis• Wastewater treatment
MAGTECHPRODUCTS
Key Applications• Aircraft decoy flares• Flameless meal heaters• Decontamination kits
GRAPHICARTS
Key Applications• Luxury packaging• High-end labels & covers• Etched plaques
Luxfer’s Magnesium Elektron business is a global innovation leader in the use of magnesium for unique, high-performance alloys and powders.
Luxfer’s MEL Chemicals business is a global producer of inorganic, zirconium-based solutions used for many industrial applications.
Luxfer Graphic Arts products include magnesium, copper and brass plates for photo-engraving, embossing and foil stamping.
Luxfer Magtech makes magnesium-based heating pads for self-heating meals and also the key ingredient for aircraft decoy flares.

6LUXFER GROUP © 2017 Luxfer Holdings PLC, All Rights Reserved
UPDATE ON STRATEGIC GROWTH INITIATIVES
Biotronik, Luxfer’s partner, recently launched their Magmaris® magnesium-based cardiovascular stent. The product uses Luxfer’s patented SynerMag alloy.
SynerMag® medical alloy
SoluMag dissolving alloy for disposable tooling is used in oil and gas wells. SoluMagevolved from work on our SynerMagmedical alloy technology.
SoluMag® alloy for oil & gas Emerging market growth
L7X® medical cylinders Magnesium airliner seats Superform Technology Centre
We are making solid progress towards increasing the penetration of our graphic arts products into fast-growth regions such as the Middle East and India.
Our patented magnesium aerospace alloysare being tested for use in commercial airliner seats.
Our new Superform Technology Centre in the UK has initiated production. We have major contracts for high-end sports car components.
Our high-pressure carbon composite cylinders for medical applications have a liner made from L7X, a proprietary, higher-strength aluminum alloy developed by Luxfer. L7X cylinders are also available in monolithic all-aluminum models.
7LUXFER GROUP © 2017 Luxfer Holdings PLC, All Rights Reserved
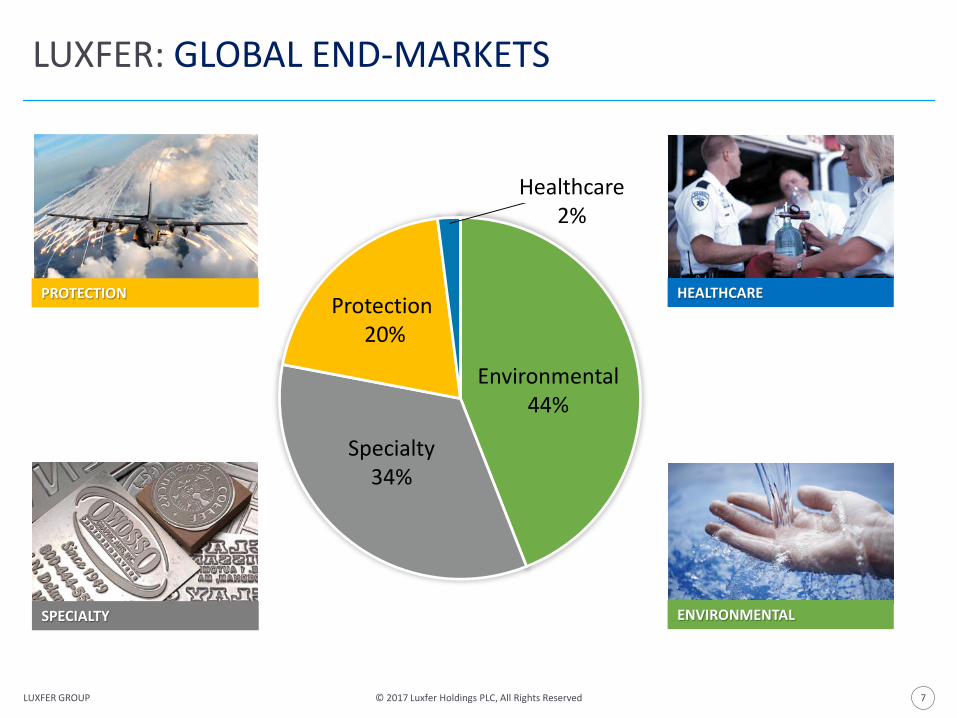
LUXFER: GLOBAL END-MARKETS
HEALTHCAREProtection
20%
Environmental44%
Specialty34%
Healthcare2%
PROTECTION
SPECIALTY ENVIRONMENTAL

8LUXFER GROUP © 2017 Luxfer Holdings PLC, All Rights Reserved
SCALEABLE GLOBAL FOOTPRINT
Graham, NC
Swinton, UK(2 locations)
Gerzat, France
Shanghai, China
Calgary, Canada
Manchester, UK
Worcester, UK
Nottingham, UK
Tamaqua, PA
Flemington, NJ
Lakehurst, NJ
Niagara Falls, CanadaFindlay, OH
Shizuoka, Japan
Madison, IL
Riverside, CA(2 locations)
New Delhi, India (JV)
Sydney, Australia
1,800employees
Luxfer Group operates 20 plants in seven countries on four continents with joint ventures and distribution centers in four more countries.
USA Canada UK France Czech Republic China Japan Australia India
Cincinnati, OH
Riverhead, NY
Litvinov, Czech Republic
Brigham City, UT
Tulsa, OK (JV)

9LUXFER GROUP © 2017 Luxfer Holdings PLC, All Rights Reserved
LUXFER: MISSION, VISION AND VALUES
Common Vision, Mission and Values for all of Luxfer.
Mission:We will help to create a safe, clean and energy-efficient world by reducingthe weight of high-performance components used by our customers.
Vision:Luxfer Group is an industrial manufacturer of technologically advanced lightweight, high-strength, corrosion-resistant alloys, composites and specialty materials for a wide range of applications in aerospace, industrial, defense, safety and healthcare.
Values—the principles that guide our conduct:
• Customer First• Accountability
• Integrity• Teamwork
• Innovation• Personal Development

10LUXFER GROUP © 2017 Luxfer Holdings PLC, All Rights Reserved
LUXFER B.E.S.T.: CONTINUOUS IMPROVEMENT
Disciplined Capital Allocation
Luxfer Business Excellence Standard Toolkit
Finance Standardization
Lean Manufacturing
Performance Culture
Strategy and Digital Marketing
IT Standardization
Supply Productivity
Talent Development
New Product Development
Sales Efficiency
Cust
omer
Ch
arte
r
Scor
ecar
d De
ploy
men
t

11LUXFER GROUP © 2017 Luxfer Holdings PLC, All Rights Reserved
Self Help
PRELIMINARY OVERVIEW OF LUXFER TURNAROUND PLAN
• Right-size cost structure
• Drive differentiated organic growth
• Simplification and standardization 2018-2020 ExpectationDouble-digit annual earnings increase
+Dividend payoutM&AD
Strategy • Small, value-enhancing bolt-on
acquisitions
• Strategic portfolio assessment

12LUXFER GROUP © 2017 Luxfer Holdings PLC, All Rights Reserved
KEY TAKEAWAYS
• Global leader in high-performing industrial lightweight alloys.
• Attractive, high-growth end-markets.
• Long-standing blue-chip customers.
• Focus on technology and innovation.
• Strong balance sheet.
• Strong new product pipeline.

13LUXFER GROUP © 2017 Luxfer Holdings PLC, All Rights Reserved 13LUXFER GROUP© 2017 Luxfer Holdings PLC, All Rights Reserved
FINANCIALS
From second-quarter 2017 resultsreleased August 2

14LUXFER GROUP © 2017 Luxfer Holdings PLC, All Rights Reserved
KEY INCOME STATEMENT METRICS
NOTE: The calculation of earnings per share is performed separately for each discrete quarterly period, and for the year-to-date period. As a result, the sum of the discrete quarterly earnings per share amounts in any particular year-to-date period may not be equal to the earnings per share amount for the year-to-date period.
NOTE: *See appendices for non-GAAP reconciliations.
$ in millions Q2 2017 Q2 2016 FY 2016 FY 2015Revenue 106.6 111.0 414.8 460.3Adjusted EBITDA* 15.2 16.3 55.3 62.2
Trading Profit (adjusted operating profit)* 10.1 11.0 35.3 42.3
Restructuring and other costs (3.3) (0.1) (2.2) (22.4)
Operating Profit 6.8 10.9 35.8 37.9
Net Income 2.5 6.7 21.9 16.1Adjusted Net Income* 6.6 7.9 24.7 29.5
Diluted Adjusted EPS* $0.25 $0.29 $0.93 $1.10Basic EPS $0.09 $0.25 $0.83 $0.60

15LUXFER GROUP © 2017 Luxfer Holdings PLC, All Rights Reserved
KEY BALANCE SHEET AND CASH FLOW METRICS
NOTE: *See appendices for non-GAAP reconciliations.
$ in millions Q2 2017 Q2 2016 FY 2016 FY 2015Cash & cash equivalents 57.2 83.6 13.6 36.9Total debt (160.6) (185.5) (121.0) (131.6)Net debt (103.4) (101.9) (107.4) (94.7)
Inventories, net 90.7 91.0 82.5 91.8Accounts receivable, net 65.0 73.8 57.6 62.3Accounts payable (56.0) (68.4) (51.1) (65.5)Trade working capital 99.7 96.4 89.0 88.6
Adjusted return on invested capital* 11% 13% 11% 12%
$ in millions Q2 2017 Q2 2016 FY 2016 FY 2015Net cash flows from operating activities 9.7 9.6 29.2 52.8Net cash flows from investing activities (2.2) (4.6) (15.1) (21.2)Net cash flows before financing 7.5 5.0 14.1 31.6
Funds returned to shareholders 3.1 3.3 19.6 12.7

16LUXFER GROUP © 2017 Luxfer Holdings PLC, All Rights Reserved
BALANCE SHEET ANALYSISDecember 31 Shareholder Pension FX June 30
2016 Trading Returns Movements Translation 2017$M $M $M $M $M $M
Property, plant and equipment 127.9 (4.0) - - 3.2 127.1Intangible assets 80.6 (0.3) - - 2.2 82.5Investments 10.0 (3.1) - - 0.3 7.2Deferred income tax assets 16.6 (5.6) - 2.6 0.8 14.4Trade and other receivables 0.3 0.1 - - - 0.4
Long term assets 235.4 (12.9) 2.6 6.5 231.6Inventories 82.5 5.7 - - 2.5 90.7Trade and other receivables 57.6 5.4 - - 2.0 65.0Trade and other payables (51.1) (3.4) - - (1.5) (56.0)
Trading working capital 89.0 7.7 3.0 99.7Net tax liabilities (excluding deferred tax assets) (2.6) (2.6) - - - (5.2)Non-current trade and other payables (0.6) (1.2) - - - (1.8)Provisions (2.6) 0.4 - - - (2.2)Capital employed 318.6 (8.6) 2.6 9.5 322.1Retirement benefits (66.5) - - 16.8 (2.8) (52.5)Deferred contingent consideration (2.8) 1.2 - - - (1.6)Invested capital 249.3 (7.4) 19.4 6.7 268.0
Banking revolver (31.8) (38.4) - - (1.1) (71.3)Cash and cash equivalents 13.6 55.3 (6.2) (6.5) 1.0 57.2Loan notes (89.2) (0.1) - - - (89.3)
Net assets 141.9 9.4 (6.2) 12.9 6.6 164.6
Capital & reserves:Ordinary share capital 25.3 - - - - 25.3Deferred share capital 150.9 - - - - 150.9Share premium account 56.4 - - - - 56.4Treasury shares (7.1) - 0.4 - - (6.7)Retained earnings 308.1 7.1 (6.6) 12.9 - 321.5Other reserves (57.9) 2.3 - - 6.6 (49.0)Merger reserve (333.8) - - - - (333.8)Total equity 141.9 9.4 (6.2) 12.9 6.6 164.6
17LUXFER GROUP © 2017 Luxfer Holdings PLC, All Rights Reserved
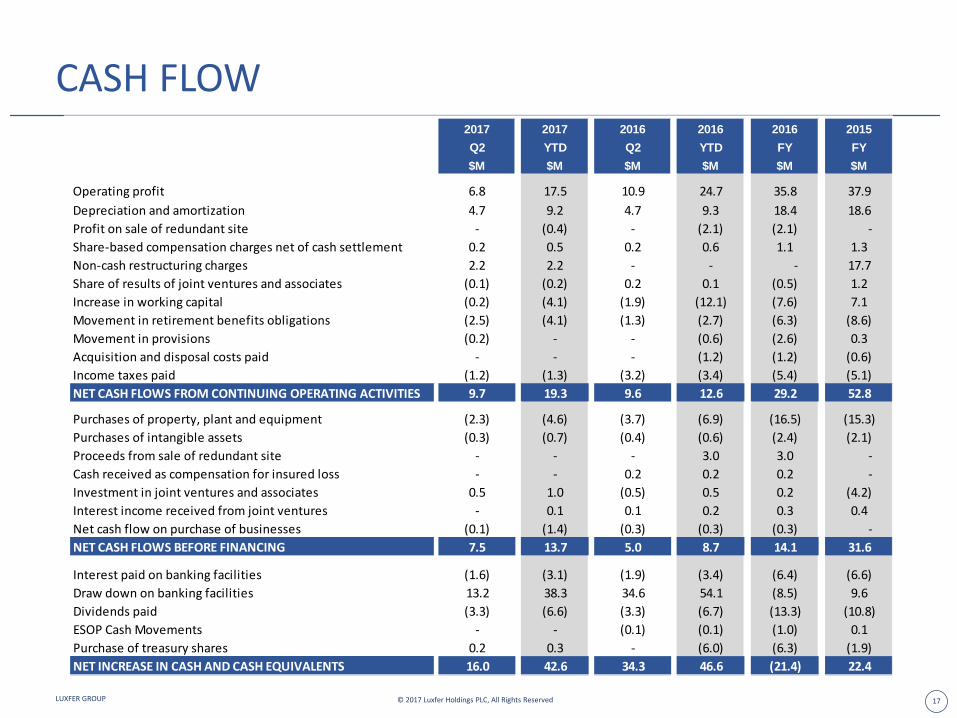
CASH FLOW2017 2017 2016 2016 2016 2015Q2 YTD Q2 YTD FY FY$M $M $M $M $M $M
Operating profit 6.8 17.5 10.9 24.7 35.8 37.9Depreciation and amortization 4.7 9.2 4.7 9.3 18.4 18.6Profit on sale of redundant site - (0.4) - (2.1) (2.1) - Share-based compensation charges net of cash settlement 0.2 0.5 0.2 0.6 1.1 1.3Non-cash restructuring charges 2.2 2.2 - - - 17.7Share of results of joint ventures and associates (0.1) (0.2) 0.2 0.1 (0.5) 1.2Increase in working capital (0.2) (4.1) (1.9) (12.1) (7.6) 7.1Movement in retirement benefits obligations (2.5) (4.1) (1.3) (2.7) (6.3) (8.6)Movement in provisions (0.2) - - (0.6) (2.6) 0.3Acquisition and disposal costs paid - - - (1.2) (1.2) (0.6)Income taxes paid (1.2) (1.3) (3.2) (3.4) (5.4) (5.1)NET CASH FLOWS FROM CONTINUING OPERATING ACTIVITIES 9.7 19.3 9.6 12.6 29.2 52.8
Purchases of property, plant and equipment (2.3) (4.6) (3.7) (6.9) (16.5) (15.3)Purchases of intangible assets (0.3) (0.7) (0.4) (0.6) (2.4) (2.1)Proceeds from sale of redundant site - - - 3.0 3.0 - Cash received as compensation for insured loss - - 0.2 0.2 0.2 - Investment in joint ventures and associates 0.5 1.0 (0.5) 0.5 0.2 (4.2)Interest income received from joint ventures - 0.1 0.1 0.2 0.3 0.4Net cash flow on purchase of businesses (0.1) (1.4) (0.3) (0.3) (0.3) - NET CASH FLOWS BEFORE FINANCING 7.5 13.7 5.0 8.7 14.1 31.6
Interest paid on banking facilities (1.6) (3.1) (1.9) (3.4) (6.4) (6.6)Draw down on banking facilities 13.2 38.3 34.6 54.1 (8.5) 9.6Dividends paid (3.3) (6.6) (3.3) (6.7) (13.3) (10.8)ESOP Cash Movements - - (0.1) (0.1) (1.0) 0.1Purchase of treasury shares 0.2 0.3 - (6.0) (6.3) (1.9)NET INCREASE IN CASH AND CASH EQUIVALENTS 16.0 42.6 34.3 46.6 (21.4) 22.4

18LUXFER GROUP © 2017 Luxfer Holdings PLC, All Rights Reserved
RECONCILIATION OF NON-GAAP MEASURES
2017 2017 2016 2016 2016 2015Q2 YTD Q2 YTD FY FY$M $M $M $M $M $M
Net income for the period - as reported 2.5 9.1 6.7 15.4 21.9 16.1Accounting charges relating to acquisitions and disposals of businesses:
Unwind of discount on deferred contingent consideration from acquisitions 0.1 0.1 0.1 0.2 0.4 0.4Amortization on acquired intangibles 0.3 0.6 0.4 0.7 1.0 1.4
IAS 19R retirement benefits finance charge 0.4 0.9 0.5 1.0 2.1 3.0Profit on sale of redundant site - (0.4) - (2.1) (2.1) - Restructuring and other expense 3.3 3.5 0.1 0.2 2.2 22.4Other share-based compensation charges 0.4 0.7 0.6 1.0 1.4 1.3Income tax thereon (0.4) (0.7) (0.5) (0.4) (1.4) 0.9Adjusted net income 6.6 13.8 7.9 16.0 24.7 29.5Add back / (deduct): Income tax thereon 0.4 0.7 0.5 0.4 1.4 (0.9)Income tax expense 2.0 4.0 2.1 5.0 6.0 9.5Net interest costs 1.8 3.4 1.5 3.1 5.6 6.9Depreciation and amortization 4.7 9.2 4.7 9.3 18.4 18.6Less: Amortization on acquired intangibles (0.3) (0.6) (0.4) (0.7) (1.0) (1.4)Adjusted EBITDA 15.2 30.5 16.3 33.1 55.3 62.2

19LUXFER GROUP © 2017 Luxfer Holdings PLC, All Rights Reserved
RECONCILIATION OF NON-GAAP MEASURES
2017 2017 2016 2016 2016 2015Q2 YTD Q2 YTD FY FY
Gas Cylinders Adjusted EBITDA $M 5.2 10.4 5.4 10.4 19.7 16.5
Other share-based compensation charges (0.2) (0.3) (0.3) (0.5) (0.6) (0.7)Depreciation and amortization (1.8) (3.6) (1.8) (3.6) (7.6) (7.2)
Trading profit $M 3.2 6.5 3.3 6.3 11.4 8.6
Elektron Adjusted EBITDA $M 10.0 20.1 10.9 22.7 35.6 45.7Other share-based compensation charges (0.2) (0.4) (0.3) (0.5) (0.8) (0.6)Depreciation and amortization (2.9) (5.6) (2.9) (5.7) (10.8) (11.4)
Trading profit $M 6.9 14.1 7.7 16.5 23.9 33.7
Group Adjusted EBITDA $M 15.2 30.5 16.3 33.1 55.3 62.2Other share-based compensation charges (0.4) (0.7) (0.6) (1.0) (1.4) (1.3)Depreciation and amortization (4.7) (9.2) (4.7) (9.3) (18.4) (18.6)
Trading profit $M 10.1 20.6 11.0 22.8 35.3 42.3

20LUXFER GROUP © 2017 Luxfer Holdings PLC, All Rights Reserved
RECONCILIATION OF NON-GAAP MEASURES
2015 2016 Q1 2015 Q2 2015 Q3 2015 Q4 2015 Q1 2016 Q2 2016 Q3 2016 Q4 2016 Q1 2017 Q2 2017
$M $M $M $M $M $M $M $M $M $M $M $MTrading profit - per income statement 42.3 35.3 10.5 11.7 10.6 9.5 11.8 11.0 7.3 5.2 10.5 10.1Effective tax rate - per income statement 37.1% 21.5% 0.0% 48.3% 21.8% 37.3% 25.0% 23.9% 19.5% 5.9% 23.3% 44.4%Notional tax (15.7) (7.3) 0.0 (5.7) (2.3) (3.5) (3.0) (2.6) (1.4) (0.3) (2.4) (4.5)Trading profit after notional tax 26.6 28.0 10.5 6.0 8.3 6.0 8.8 8.4 5.9 4.9 8.1 5.6Annualized trading profit after notional tax (A) 26.6 28.0 42.0 24.0 33.2 24.0 35.2 33.6 23.6 19.6 32.4 22.4
Bank and other loans 131.6 121.0 121.5 156.7 137.2 131.6 150.8 185.5 137.5 121.0 146.3 160.6Cash and cash equivalents (36.9) (13.6) (15.7) (58.3) (39.6) (36.9) (48.9) (83.6) (32.3) (13.6) (40.4) (57.2)Net debt 94.7 107.4 105.8 98.4 97.6 94.7 101.9 101.9 105.2 107.4 105.9 103.4Total equity 169.7 141.9 159.4 174.6 161.9 169.7 160.0 146.9 129.4 141.9 153.4 164.6Invested capital 264.4 249.3 265.2 273.0 259.5 264.4 261.9 248.8 234.6 249.3 259.3 268.0
Average invested capital (B) 273.3 242.6 273.7 269.1 266.3 262.0 263.2 255.4 241.7 242.0 254.3 263.7
Return on invested capital (A) / (B) 10% 12% 15% 9% 12% 9% 13% 13% 10% 8% 13% 8%
Adjusted net income for the period 1 29.5 24.7 6.9 7.6 7.6 7.4 8.1 7.9 5.0 3.7 7.2 6.6Income tax charge for the period 2 9.5 6.0 0.5 2.9 1.7 4.4 2.9 2.1 0.8 0.2 2.0 2.0Income tax on adjustments to net income 3 (0.9) 1.4 2.1 (0.1) 0.4 (3.3) (0.1) 0.5 0.7 0.3 0.3 0.4
Adjusted income tax charge (C) (2 + 3) 8.6 7.4 2.6 2.8 2.1 1.1 2.8 2.6 1.5 0.5 2.3 2.4Adjusted profit before taxation (D) (1 + 2 + 3) 38.1 32.1 9.5 10.4 9.7 8.5 10.9 10.5 6.5 4.2 9.5 9.0
Adjusted effective tax rate (C) / (D) = (E) 22.6% 23.1% 27.4% 26.9% 21.6% 12.9% 25.7% 24.8% 23.1% 11.9% 24.2% 26.7%
Trading profit - per income statement (as above) (F) 42.3 35.3 10.5 11.7 10.6 9.5 11.8 11.0 7.3 5.2 10.5 10.1Adjusted notional tax (E) x (F) (9.5) (8.1) (2.9) (3.2) (2.3) (1.2) (3.0) (2.7) (1.7) (0.6) (2.5) (2.7)Adjusted trading profit after notional tax 32.8 27.2 7.6 8.5 8.3 8.3 8.8 8.3 5.6 4.6 8.0 7.4Annualized adjusted trading profit after notional tax (G) 32.8 27.2 30.5 33.8 33.2 33.1 35.1 33.1 22.5 18.3 31.8 29.6
Adjusted return on invested capital (G) / (B) 12% 11% 11% 13% 12% 13% 13% 13% 9% 8% 13% 11%