jennifer morgan - cap and trade
TRANSCRIPT

8/6/2019 Jennifer Morgan - Cap and Trade
http://slidepdf.com/reader/full/jennifer-morgan-cap-and-trade 1/22
Cap and Trade: Managing
Decisions around Allocation
Jennifer Morgan
Director, Climate and Energy ProgramJune 23, 2011
1

8/6/2019 Jennifer Morgan - Cap and Trade
http://slidepdf.com/reader/full/jennifer-morgan-cap-and-trade 2/22
IDENTIFY ENTITIES TO BE COVERED IN ONE OR MORE SECTORS
REQUIRE ENTITIES TO MEASURE, MONITOR & REPORT EMISSIONS
BASIC BUILDING BLOCKS
OF CAP-AND-TRADE
ENFORCEMENT & PENALTIES FOR NON-COMPLIANCE
ESTABLISH AGGREGATE EMISSIONS BASELINE FOR SOURCES
DETERMINE THE REDUCTION OVER TIME (i.e., SUCCESSIVE BUDGETS REDUCED)
ESTABLISH COMPLIANCE PERIOD FOR SOURCES
SOURCES “TRUE UP” AT END OF EACH COMPLIANCE PERIOD
DISTRIBUTE OR AUCTION ONE “ALLOWANCE” FOR EACH TON IN BUDGET
ESTABLISH ANNUAL EMISSIONS CAP (OR ANNUAL ALLOWANCE BUDGET)
2

8/6/2019 Jennifer Morgan - Cap and Trade
http://slidepdf.com/reader/full/jennifer-morgan-cap-and-trade 3/22
3
• Allowances are assets created by
government
• Value is not known in advance• Distribution is much like handing out money
• Distribution is inherently a political exercise
Allowance Distribution Key Concepts
3

8/6/2019 Jennifer Morgan - Cap and Trade
http://slidepdf.com/reader/full/jennifer-morgan-cap-and-trade 4/22
4
• Should allowances be divided among covered sectorsand/or other entities or should they be put up forauction?
• If apportioned among sectors, then how many
allowances does each covered sector get? – What are the key criteria for dividing up allowances amongsectors to establish sectoral allowance budgets?
• Emissions baselines for each sector?
• Relative competitive posture of each sector?
• Relative ability to reduce emissions?
• Ability to pass through costs?
• Other?
• How will subsequent sectoral allowance budgets bedetermined? i.e., what reductions will take place
where?
Allocate Allowances to Sectors

8/6/2019 Jennifer Morgan - Cap and Trade
http://slidepdf.com/reader/full/jennifer-morgan-cap-and-trade 5/22
5
• How should allowances bedistributed?
– Allocate to covered entities based on:• Past emissions, or “grandfathering”?
• “Recent” emissions relative to output on an updating basis?
• Output only
– Auction?
• Will amount auctioned increase overtime?
Distributing Allowances
to Covered Entities

8/6/2019 Jennifer Morgan - Cap and Trade
http://slidepdf.com/reader/full/jennifer-morgan-cap-and-trade 6/22
Summary of primary distribution options
Type Description Examples
Grandfathering Allocations to existingsources, based onpast emissions.
U.S. SO2 Program;Most EU ETSMembers
Output-based,
Updated
Allocations to existingemissions sources,
based on recentemissions per unit ofoutput; updated everyX years
Certain NortheastStates in NOx
Program, Waxman-Markey for industry
Input-based,Updated
Allocations to existing
sources, based onrecent heat input;updated every X years
Certain Northeast
States in NOxProgram.
Auction Allowances sold atauction
Most RGGI states;Partial Auctions in EU;Small US SO2 Auction
8/6/2019 Jennifer Morgan - Cap and Trade
http://slidepdf.com/reader/full/jennifer-morgan-cap-and-trade 7/22
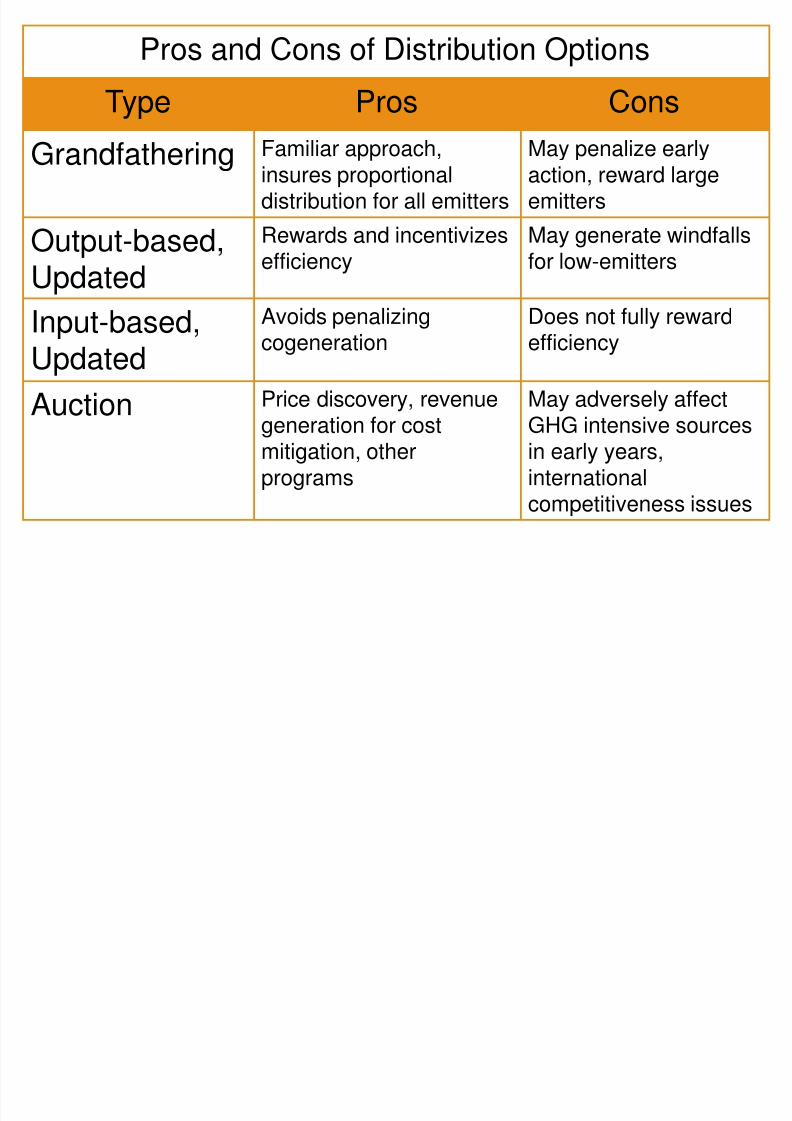
Pros and Cons of Distribution Options
Type Pros Cons
Grandfathering Familiar approach,insures proportionaldistribution for all emitters
May penalize earlyaction, reward largeemitters
Output-based,
Updated
Rewards and incentivizesefficiency
May generate windfallsfor low-emitters
Input-based,Updated
Avoids penalizingcogeneration
Does not fully rewardefficiency
AuctionPrice discovery, revenuegeneration for costmitigation, otherprograms
May adversely affectGHG intensive sourcesin early years,internationalcompetitiveness issues

8/6/2019 Jennifer Morgan - Cap and Trade
http://slidepdf.com/reader/full/jennifer-morgan-cap-and-trade 8/228
Allocation to non-regulated
entities• Allowances can be distributed to mitigate cost toaffected groups
• Examples – Consumers
– States
– Displaced workers
– Local governments
– Internationally competitive industries
• Allowances can also be distributed to reward GHGreductions
• Examples: – Increased carbon sequestration
– Low carbon technology deployment
– Energy efficiency

8/6/2019 Jennifer Morgan - Cap and Trade
http://slidepdf.com/reader/full/jennifer-morgan-cap-and-trade 9/229
Allowances are directed to dozens of
purposes
9

8/6/2019 Jennifer Morgan - Cap and Trade
http://slidepdf.com/reader/full/jennifer-morgan-cap-and-trade 10/2210
Example: Waxman Markey Allowance
Distribution

8/6/2019 Jennifer Morgan - Cap and Trade
http://slidepdf.com/reader/full/jennifer-morgan-cap-and-trade 11/2211
Why Auction?
• Avoids politics of allocation butintroduces politics of revenue
distribution• Price discovery
• Raise revenue for complementary
purposes• Most economically efficient way todistribute allowances but not alwaysmost politically viable

8/6/2019 Jennifer Morgan - Cap and Trade
http://slidepdf.com/reader/full/jennifer-morgan-cap-and-trade 12/2212
RGGI approach: Nearly 100% auction
• Deregulated electricity market means statescannot control generators‟ electricity bids
• Value of allowance ends up in bid becauseallowances have value
• Therefore, consumer pays cost whether
allowance is given to generators or thegenerators pay for them at auction
• Revenue for program administration, energyefficiency, renewables
8/6/2019 Jennifer Morgan - Cap and Trade
http://slidepdf.com/reader/full/jennifer-morgan-cap-and-trade 13/2213
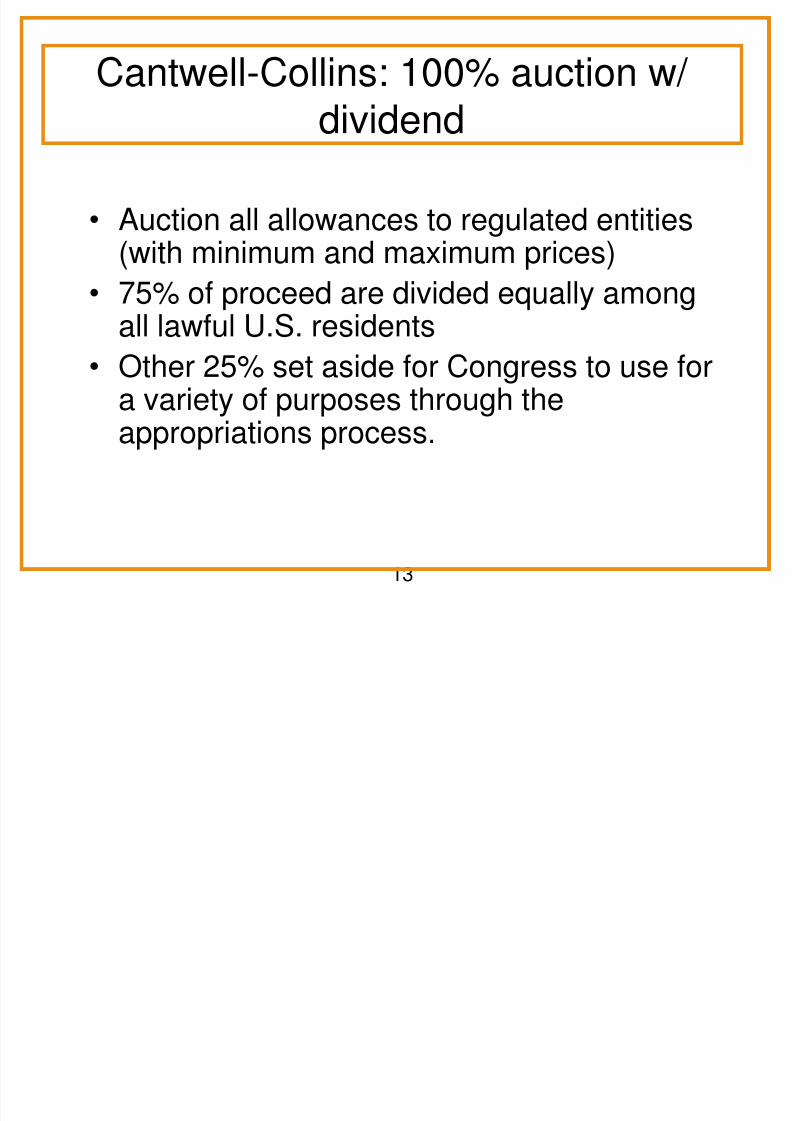
Cantwell-Collins: 100% auction w/
dividend
• Auction all allowances to regulated entities(with minimum and maximum prices)
• 75% of proceed are divided equally amongall lawful U.S. residents
• Other 25% set aside for Congress to use for
a variety of purposes through theappropriations process.

8/6/2019 Jennifer Morgan - Cap and Trade
http://slidepdf.com/reader/full/jennifer-morgan-cap-and-trade 14/22

8/6/2019 Jennifer Morgan - Cap and Trade
http://slidepdf.com/reader/full/jennifer-morgan-cap-and-trade 15/22
EU ETS Timeline
2005 2006 2008 2009 2010 2011 2012 2013 2014 2015 2016 2017 2018 2019 20202007
EU ETS PHASE 1 EU ETS PHASE 2
1st KYOTO COMMITMENT PERIOD KYOTO PROTOCOL POST-2012 FRAMEWORK?
EU ETS PHASE 3? EU ETS PHASE 4?
January 2005 - EU ETS commences
• Phase 1 EU ETS – 2005-2007 „learning phase‟
• Phase 2 EU ETS – 2008-2012 „Kyoto Commitment
Period‟
• Phase 3 and beyond….

8/6/2019 Jennifer Morgan - Cap and Trade
http://slidepdf.com/reader/full/jennifer-morgan-cap-and-trade 16/2216
Sector Coverage
• Covers CO2 emissions from combustion processes(approximately 50% of EU CO2 emissions, 30% of EU greenhouseemissions)
• Covers approx 12,000 installations across the EU from thesesectors:
– Electricity generators
– Other combustion installations (heat & steam production)
– Mineral oil refineries – Iron and steel production and processing
– Cement & lime
– Glass & ceramics
– Pulp & paper sector

8/6/2019 Jennifer Morgan - Cap and Trade
http://slidepdf.com/reader/full/jennifer-morgan-cap-and-trade 17/2217
Allocation of Allowances
• National Allocation Plan (NAP) sets out thetotal number of allowances to be issued anddistributed to national installations
• Member States may auction up to 5% ofallowances for Phase I, up to 10% for PhaseII
• Majority of allowances allocated for free – Member States used a range of methods for allocation –
including historical emissions, projected emissions, sectorbenchmarks etc

8/6/2019 Jennifer Morgan - Cap and Trade
http://slidepdf.com/reader/full/jennifer-morgan-cap-and-trade 18/22Percent emissions below allocation Percent emissions above allocation
% difference between Member State allocations and emissions in 2005
Lithuania
Denmark
Latvia
Finland
Estonia
Slovak Republic
Czech Republic
Hungary
Sweden
France
Netherlands
Belgium
Germany
Portugal
Slovenia
Greece
Italy
Austria
Spain
UK
Ireland
-50 -40 -30 -20 -10 0 10 20
M e m b e r
S t a t e
Surplus of
allocatedallowances
Shortfall in
allocatedallowances

8/6/2019 Jennifer Morgan - Cap and Trade
http://slidepdf.com/reader/full/jennifer-morgan-cap-and-trade 19/2219
Impact of EU ETS to date
• Very high compliance in first 2 years
• Improved emissions data across Europe
• Internalising cost of carbon in price of electricity generation
• Driving investment in Kyoto project credits (CDM)
• Behavioural change – mainstreaming?
“Carbon dioxide has moved out of the domain of the environmentalofficer at a company to the boardroom and the chief financial officerand the chief executive officer”
Head of Director General Environment, European Commission

8/6/2019 Jennifer Morgan - Cap and Trade
http://slidepdf.com/reader/full/jennifer-morgan-cap-and-trade 20/22
20
Future of the EU ETS
• Phase III: 2012-2020
• At least a 21 percent reduction from 2005 levels for coveredsources
• New: single EU-wide cap instead of 27 caps set byMember States
• CO2 allowances available in 2020: 1720 Mt
• Linear decrease – predictable trend-line to 2020 and beyond – can be adjusted to stricter target
• Emissions from all flights taking off or landing in the EU tobe included

8/6/2019 Jennifer Morgan - Cap and Trade
http://slidepdf.com/reader/full/jennifer-morgan-cap-and-trade 21/22
21
Phase 3 allowance distribution
21
• Harmonised allocation rules ensure level playing field across the EU
• Basic principle for allocation is auctioning:
– Eliminates windfall profits
– Simplest and most transparent allocation system
• Full auctioning for sectors able to pass on costs
– E.g. Power sector
• Partial free allocation to industry as a transitional measure
– Phased out by 2020 for “normal industry”
– Exception: possibly higher levels (up to 100%) of free allocation to industriesparticularly vulnerable to international competition („carbon leakage‟) to be
determined in 2010
• European Commission to report on „carbon leakage‟ by 2011 and make a
proposal, if appropriate:
– To review free allocation levels and/or
– To introduce system to neutralise distortive effects
8/6/2019 Jennifer Morgan - Cap and Trade
http://slidepdf.com/reader/full/jennifer-morgan-cap-and-trade 22/22
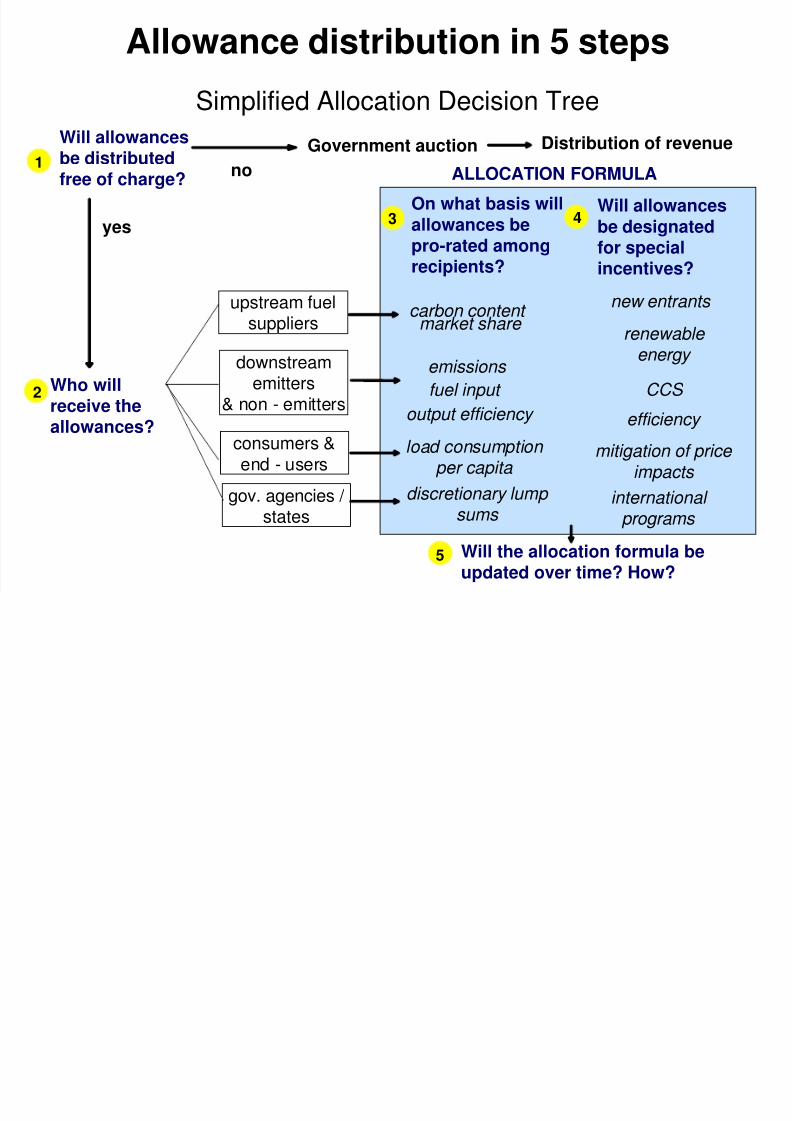
Simplified Allocation Decision Tree
new entrants
renewable energy
CCS
efficiency
mitigation of price impacts
Will allowancesbe distributedfree of charge?
Government auction
Who willreceive theallowances?
downstreamemitters
& non - emitters
upstream fuelsuppliers
Will the allocation formula beupdated over time? How?
no
yes
1
3 4
5
2
Distribution of revenue
consumers &end - users
carbon content
emissions
fuel input
output efficiency
load consumption per capita
ALLOCATION FORMULA
On what basis willallowances bepro-rated amongrecipients?
Will allowancesbe designatedfor specialincentives?
market share
Allowance distribution in 5 steps
gov. agencies / states
discretionary lump sums
international programs