jerome a. orosz - arxiv · arxiv:astro-ph/0404343v1 17 apr 2004 orbital parameters for theblack...
TRANSCRIPT
arX
iv:a
stro
-ph/
0404
343v
1 1
7 A
pr 2
004
Orbital Parameters for the Black Hole Binary XTE J1650-5001
Jerome A. Orosz
Department of Astronomy, San Diego State University, 5500 Campanile Drive, San Diego, CA 82182-1221
Jeffrey E. McClintock
Harvard-Smithsonian Center for Astrophysics, 60 Garden Street, Cambridge, MA 02138
Ronald A. Remillard
Center for Space Research, Massachusetts Institute of Technology, Cambridge, MA 02139-4307
Stephane Corbel
Service d’Astrophysique, DAPNIA, baiment 709, l’Orme des merisiers, CEA Saclay, 91191 Gif-sur-Yvette
Cedex, France, and Universite Paris VII, 2 place Jussieu, 75251 Paris Cedex 05, France
ABSTRACT
We present R-band photometry of the X-ray transient and candidate black hole binary XTEJ1650-500 obtained between 2003 May and August with the 6.5m Clay Telescope. A timinganalysis of these data reveals a photometric period of 0.3205 ± 0.0007 days (i.e. 7.63 hr) witha possible alias at 0.3785 days (9.12 hr). Our photometry completely rules out the previouslypublished spectroscopic period of 0.212 days (5.09 hr). Consequently, we reanalyzed the 15archival ESO/VLT spectra (obtained 2002 June by others) that were the basis of the previouslypublished spectroscopic period. We used a “restframe search” technique that is well suited forcases when the signal-to-noise ratio of individual spectra is low. For each of roughly 1.1 millionbinary ephemerides, we summed all of the spectra in a trial restframe of the secondary star, andeach restframe spectrum was cross-correlated against a template spectrum. We then searchedfor the set of orbital parameters that produced the strongest cross-correlation value. The resultsconfirmed the photometric period of 0.3205 days, and rule out the alias period near 0.38 days.The best value for the velocity semiamplitude of the companion star is K2 = 435 ± 30 km s−1,and the corresponding optical mass function is f(M) = 2.73± 0.56M⊙. The limited number oftemplate spectra available to us suggest a spectral type of K3V to K5V for the companion star.We also find that the accretion disk dominates the light in the R-band where the disk fractionis 80% or higher, although this value should be treated with caution owing to the poor signal-noise-ratio and the limited number of templates. The amplitude of the phased R-band light
1Based on observations made with the Magellan 6.5m Clay telescope at Las Campanas Observatory of the Carnegie Institutionand on observations made with European Southern Observatory (ESO) Telescopes at the Paranal Observatory under programmeID 69.D-0644(A)
1

curve is 0.2 magnitudes, which gives a lower limit to the inclination of 50 ± 3 in the limitingcase of no contribution to the R-band light curve from the accretion disk. If the mass ratio ofXTE J1650-500 is similar to the mass ratios of other black hole binaries like A0620-00 or GRS1124-683 (e.g. Q & 10), then our lower limit to the inclination gives an upper limit to the mass ofthe black hole in XTE J1650-500 of M1 . 7.3M⊙. However, the mass can be considerably lowerif the R-band flux is dominated by the accretion disk. For example, if the accretion disk doescontribute 80% of the flux, as our preliminary results suggest, then the black hole mass wouldbe only about 4M⊙.
Subject headings: binaries: spectroscopic — black hole physics — stars: individual (XTE J1650-500) —X-rays: stars
1. Introduction
X-ray novae (XN) provide the strongest evi-dence for the existence of stellar mass black holes.XN are interacting binaries where a neutron staror a black hole accretes matter from a compan-ion (usually a K or M dwarf). The accretionrate on to the black hole increases substantiallyduring the outburst phase, and hence the X-rayluminosity can vary by large amounts (e.g. fac-tors of 106 or more). The majority of XN spendmost of their time in a “quiescent” state wherethe X-ray luminosity is on the order of the op-tical luminosity of the companion star. It is inquiescence where the companion star can be beststudied in the optical, where the observed radialvelocity and light curves of the companion leadto dynamical mass measurements for the com-pact primary. There are 18 X-ray binaries (15 ofthem XN) where the mass of the primary has beenshown to exceed the maximum mass of a stableneutron star (≈ 3M⊙, Kalogera & Baym 1996),confirming the presence of black holes in these sys-tems (Bailyn et al. 1995; Casares, Charles, & Nay-lor 1992; Casares, Charles, & Marsh 1995; Cow-ley et al. 1983; Filippenko, Matheson, & Ho 1995;Filippenko et al. 1999; Filippenko & Chornock2001; Gies & Bolton 1986; Greiner, Cuby, & Mc-Caughrean 2001; Hutchings et al. 1987; Hynes etal. 2003; McClintock & Remillard 1986; McClin-tock et al. 2001; Orosz & Bailyn 1995; Orosz et al.1998; Orosz et al. 2001; Orosz et al. 2002; Remil-lard, McClintock, & Bailyn 1992; Remillard et al.1996; Wagner et al. 2001). These sources openup the possibility of studying general relativity inthe strong field regime. For example, the studyof high frequency quasiperiodic oscillations in theX-ray light curves of certain XN may lead to ameasurement of black hole spin (e.g. McClintock& Remillard 2004 and cited references). We must
press hard to obtain further observations of blackhole masses in order to fully pursue these oppor-tunities.
XTE J1650-500 (hereafter J1650) was discov-ered by RXTE on 2001 September 5 (Remillard2001) and subsequently reached a peak X-ray in-tensity of 0.5 Crab. Based on subsequent obser-vations, J1650 was established as a strong blackhole candidate based on its X-ray spectrum andvariability in the X-ray light curve (Markwardt,Swank, & Smith 2001; Revnivtsev & Sunyaev2001; Wijnands, Miller, & Lewin 2001). The ra-dio counterpart was discovered with the AustraliaTelescope Compact Array (ATCA) by Groot etal. (2001). Further radio observations sampledthe behavior of XTE J1650-500 along all its X-ray states (Corbel et al. in preparation). We high-light two key results obtained during its outburstphase. First, RXTE observations during the thirdand fourth weeks of the outburst yielded a strongX-ray QPO with an rms amplitude of 5.0 ± 0.4%at a frequency of ν = 250 ± 5 Hz (Homan et al.2003b). Second, XMM-Newton observed a broad,skewed emission line due to Fe Kα (Miller et al.2002). Those authors argue that their results im-ply the primary is a nearly maximal Kerr blackhole that is delivering its spin-down energy to theaccretion flow.
The first significant observational program inthe optical was that of Sanchez-Fernandez et al.(2002, hereafter SF2002). They observed J1650on the night of 2002 June 10 with the fourth 8.2mtelescope at the European Southern Observatory,Paranal, and reported the following orbital ele-ments: an orbital period of P = 0.212 ± 0.001days and a velocity semiamplitude of K2 = 309±4km s−1, resulting in an optical mass function off(M) = 0.64± 0.03M⊙. The results in this paper
2

contradict those findings.
In this paper we report the results of our pho-tometric study of J1650. A time series analysisof our photometry rules out the orbital period re-ported by SF2002. Consequently we also reportherein our reanalysis of the SF2002 data obtainedfrom the ESO archives. We show that the spec-troscopic period we derive from these data is con-sistent with our photometric period pf P = 0.3205days, and we go on to determine the orbital ele-ments of the system. We outline below our ob-servations and reductions, and our analysis tech-niques. We end with a brief discussion of the im-plications of our results regarding the fast QPOobserved for J1650.
2. Observations
2.1. Optical Photometry
We observed J1650 with the 6.5m Clay tele-scope at Las Campanas Observatory of theCarnegie Institution 2003 May 31 and June 1 us-ing the Magellan Instant Camera (MagIC) andan R-band filter. A total of 47 R-band imageswith typical exposure times between 500 and 600seconds were obtained over the two nights in goodconditions. M. Holman and P. Schechter kindlyprovided an additional 65 images obtained 2003August 1 and 2 using the same instrumentation.
In order to minimize readout time, the MagICcamera is read out simultaneously using four am-plifiers. Thus, bias and flat-fielding is done sep-arately for each quadrant of the detector. Thesecalibrations and the merging of the quadrant im-ages into a single image were performed usingthe publicly-available MagIC reduction pipeline.Stetson’s programs DAOPHOT IIe, ALLSTAR,and DAOMASTER (Stetson 1987, 1990; Stetson,Davis, & Crabtree 1991; Stetson 1992a,b) wereused to extract the stellar intensities and derivethe light curve for J1650. Fig. 1 shows a findingchart for J1650 made from the MagIC data.
2.2. Optical Spectroscopy
SF2002 observed J1650 on the night of 2002June 10 with the fourth 8.2m telescope at theEuropean Southern Observatory, Paranal, usingthe FORS2 imaging spectrograph with an MITCCD mosaic, the 1200R grism, the GG435 block-
ing filter, and a fixed slit width of 0.7 arcsec-ond. This instrumental configuration yields awavelength range of 5750-7310 A with a resolu-tion of about 0.76 A FWHM. SF2002 obtained atotal of 15 spectra of J1650 in somewhat marginalseeing (typically between 1.0 and 1.5 arcseconds).They also obtained the spectra of six bright G-and K-type dwarfs using the same instrumentalconfiguration. We obtained these data from theESO archive, and used tasks in IRAF1 to performthe CCD reductions and to extract the spectra.Since the flat field and wavelength calibration im-ages were obtained exclusively during the daytimehours at Paranal, it was necessary to correct forflexure in the spectrograph by applying small cor-rections (≤ 0.6A) to the wavelength scales of theextracted spectra using bright night-sky emissionlines.
3. Analysis
The Magellan light curve of J1650 showed con-siderable variability, so we phased the data on theperiod reported by SF2002 (P = 0.212 days). Toour surprise, the light curve phased on that pe-riod showed considerable scatter. Consequently,we searched the Magellan light curve for period-icities using the ELC code with its genetic fittingalgorithm (Orosz & Hauschildt 2000; Orosz et al.2002). About 1,106,000 ellipsoidal models weregenerated and compared with the data using theabsolute deviation as the merit function:
A =
N∑
i=1
∣
∣
∣
∣
y(xi; a)− yiσi
∣
∣
∣
∣
,
where the notation y(xi; a) means “the modelvalue computed at xi”, yi means “the observedquantity at the same xi”, and σi is the uncer-tainty in yi. This merit function is more robustthan the χ2 function because it is less sensitiveto a few outlying points. Models were computedusing a period range of 0.15 to 0.50 days. Afterall of the fits were performed, the merit functionhypersurface was projected onto the trial periodaxis (see Orosz et al. 2002 for a more in-depthdiscussion of this error estimation technique); the
1IRAF is distributed by the National Optical AstronomyObservatories, which are operated by the Association ofUniversities for Research in Astronomy, Inc., under coop-erative agreement with the National Science Foundation.
3

resulting periodogram is shown in the top of Fig.2. The absolute deviation has a minimum valueat a trial period of 0.3205 days, and a secondaryminimum at a trial period of 0.3785 days. Fig. 3shows the Magellan light curve phased on a periodof P = 0.3205 days. There is no dip in the abso-lute deviation near the period reported by SF2002(P = 0.212 days), and the light curve phased onthat period is essentially a scatter plot. As a checkon our results, we used the ‘pdm’ task in IRAF,which is an implementation of the phase disper-sion technique of Stellingwerf (1978). A similarperiodogram was obtained. To estimate the erroron our photometric measurement of the orbital pe-riod, we did additional fits using ELC’s genetic al-gorithm and the normal χ2 as the merit function.We find a 1σ uncertainty of about 0.0007 day, sowe adopt P = 0.3205± 0.0007 day.
We then analyzed the VLT spectra in an at-tempt to understand the disagreement of our pho-tometric period with the spectroscopic period re-ported by SF2002. We tried to extract radial ve-locities using the standard cross correlation tech-nique of Tonry & Davis (1979, implemented in theIRAF ‘fxcor’ task). However, we found that thespectra were very noisy and yielded only a fewmarginal measurements of velocity. We thereforeused the “restframe” analysis that we developedfor H1705-250 (Remillard et al. 1996). This tech-nique is similar to the “skew mapping” techniquesometimes used for cataclysmic variables (Smith,Cameron, & Tucknott 1993; Vande Putte et al.2003), and is quite simple to employ. Supposeone has a time series of spectroscopic observa-tions. If the spectra are Doppler shifted to zerovelocity and coadded using the correct orbital el-ements, then the absorption features of the com-panion star will appear at the same wavelengthsin all of the individual spectra. Consequently, thelines in the summed spectrum will have a highersignal-to-noise ratio than in the individual spectra.If, on the other hand, one uses the incorrect orbitalelements, then the absorption lines from the com-panion will be at different wavelengths in differentindividual spectra, and hence will be “averagedout” in the resulting summed spectrum. In ourimplementation of the restframe analysis, we useda FORTRAN program that writes IRAF scripts todo the Doppler shifting and the spectrum summa-tion. The fxcor task was used to provide a mea-
sure of how well a restframe spectrum matchedthe template spectrum. In particular, we usedthe peak cross correlation value as the measureof the goodness-of-fit of the template spectrum tothe restframe spectrum.
We are interested in three orbital elements: theperiod P , the semiamplitude K2 and the time ofmaximum velocity T0. We proceeded by iterationas follows. First, we adopted a period of 0.320 daysand made a grid of restframe spectra in theK2−T0
plane. We then cross-correlated these restframespectra against all six of the template spectra inturn and determined that the K4V star BS5568provided the best match. Next, we proceeded tomake a periodogram by searching periods in therange 0.1500 to 0.5000 days in steps of 0.0020 days.The results for each trial period were stored in aseparate subdirectory on disk. For each period, wesearched the K2 − T0 plane as follows. The rangeconsidered for K2 was 300–600 km s−1 in steps of2 km s−1. For T0 the range was centered on HJD2,452,436.6 and the step size was 0.005 days. Theextent of the range for T0 was adapted to accom-modate the trial value of the period. An individualrestframe spectrum was generated for each set oforbital elements. All of these spectra were cross-correlated in batch mode against the K4V tem-plate. In total we generated 1,166,146 restframespectra using this same number of scripts storedas separate files. The entire process required 48.89gigabytes of disk space.
We searched for the best period by parsing thefxcor log files to get the peak cross-correlationvalue for each restframe spectrum. The maxi-mum peak cross correlation value within each pe-riod subdirectory was saved, resulting in the pe-riodogram shown at the bottom of Fig. 2. Themaximum cross correlation value occurs for a trialperiod of P = 0.320 days, in agreement with thephotometric results, which thereby establishes theorbital period. Thus, we rule out the alias photo-metric period near 0.38 days and again rule out the0.212 day spectroscopic period reported by SF2002(Fig. 2).
Adopting a period of P = 0.320 days, we per-formed a finer search of the K2 − T0 plane, withstep sizes of 1 km s−1 in K2 and 0.001 days inT0. The results are shown in Fig. 4. The crosscorrelation values have a fairly well-defined peakvalue along the T0 axis, where the maximum cross
4

correlation is for T0 = 2, 452, 436.600 (HJD). Onthe other hand, the peak along the K2 axis isbroad with a maximum that occurs in the range430 . K2 . 439 km s−1. Judging from the widthof the peak and on our experience with H1705-250(Remillard et al. 1996), we adopt K2 = 435 ± 30km s−1. The optical mass function is then
f(M) =PK3
2
2πG= 2.73± 0.56M⊙.
The best restframe spectrum found for the finergrid is shown in Fig. 5. Although few obvious K-star absorption features are apparent, the crosscorrelation of this restframe spectrum using theK4V star BS 5568 as a template does yield a signif-icant peak near zero velocity (Fig. 5). In order toget some estimate of the spectral type of the com-panion star, we cross correlated the best restframespectrum against all six template spectra. Ta-ble 1 gives the cross correlation value at the peakand the Tonry & Davis ‘r’ value (which is a mea-sure of the significance of the peak) for each tem-plate. Although the number of templates is small,these results indicate a spectral type of aroundK4. We attempted to decompose the restframeinto its stellar and accretion disk components us-ing the technique outlined in Marsh, Robinson, &Wood (1994). Using the K4V template BS 5568,we found that the accretion disk dominates in theR-band, where its contribution is & 80%. How-ever, owing to the limited number of templatesand the poor signal-to-noise, this result should betreated with caution.
Our measurement of the optical mass functionsets a lower limit on the mass of the compact pri-mary. To find the actual mass we need to find themass ratio of the two components and inclinationof the orbital plane. If the companion star fillsits Roche lobe and is in synchronous rotation, themass ratio can be computed if one can measureK2 and the projected rotational velocity of thecompanion star (e.g. Wade & Horne 1988). Onecan also get an estimate of the mass ratio if theradial velocities of the Hα emission line can be re-liably measured (e.g. Orosz et al. 1994). However,in the case of J1650, the poor quality of the dataprevents us from making either measurement. Wecan use our Magellan light curve to place someconstraints on the inclination. However, the re-sults are sensitive to the amount of light the ac-
cretion disk contributes in the R-band, and ourestimate of the disk contamination outlined aboveis quite uncertain. Nevertheless, if we assume thelimiting case of no light from the disk in the R-band, then we find an inclination of i = 50 ± 3.If we add a substantial contribution from the diskin the R-band (& 80%), then the inclination is70 or higher (a representative ellipsoidal modelfor this case is shown in Fig. 3). Owing to thelack of X-ray eclipses, the inclination is less thanabout 80 (the exact limit depends on the mass ra-tio). If, for the sake of discussion, we assume themass ratio of J1650 is similar to that of A0620-00or GRS 1124-683 (Q ≈ 10), then an inclinationof 50 combined with our measured value of theoptical mass function yields a black hole mass of7.3± 0.6M⊙. Likewise, an assumed inclination of70 yields a black hole mass of 4.0± 0.6M⊙.
4. Discussion
Is general relativity (GR) the correct theoryof gravity in the strong fields found near a blackhole? One promising approach to answering thisfundamental question is offered by the key discov-ery of the Rossi X-ray Timing Explorer (RXTE)that seven Galactic black holes (including J1650)display quasiperiodic (QPO) X-ray oscillations inthe range of 100 − 450 Hz (McClintock & Remil-lard 2004 and cited references). These fast QPOsmust be produced near the event horizon since theX-rays originate there and since such high frequen-cies are comparable to the Kepler frequency of theinnermost stable circular orbit around a black hole(νK = 2199 − 16150 (M/M⊙)
−1 Hz depending onthe dimensionless spin parameter a∗, where thefull range of a∗ is 0 to 1 e.g. Shapiro & Teukolsky1983).
RXTE has made a further important discovery:four of these seven black holes produce pairs of sta-tionary, fast QPOs that have frequencies in a 3:2ratio (McClintock & Remillard 2004; Homan et al.2003a). Such commensurate frequencies are a hall-mark of non-linear resonance phenomena. Thus,this discovery has promoted a “resonance model”that invokes enhanced emissivity at the radius inthe accretion disk where two of the three spatialcoordinate frequencies (e.g. Keplerian and radial)are commensurate (Abramowicz & Kluzniak 2001;Abramowicz et al. 2003). For the three black
5

holes with the QPO pairs and measured masses(e.g. GRO J1655-40, XTE J1550-564, and GRS1915+105), the QPO frequency is correlated withthe black hole mass, where ν ∝ M−1 (e.g. McClin-tock & Remillard 2004). This scaling is expectedfor GR oscillations, but different sources can lie onthe same curve only if they have similar values ofthe dimensionless spin parameter a∗.
Schnittman & Bertschinger (2004) performedray tracing calculations in the Kerr metric foremitting blobs orbiting a black hole at a radiuswhere there is a 3:1 resonance between the az-imuthal (Ω) and radial coordinate frequencies. Itwas shown that general relativistic effects may im-part a QPO at Ω and a beat oscillation at 2
3Ω with
a relative strength that depends on the angularwidth of the emitting blob of material. This in-terpretation, when combined with accurate massmeasurements, yields values for the dimensionlessspin parameter: 0.40 ≤ a∗ ≤ 0.55 for GRO J1655-40 and 0.3 ≤ a∗ ≤ 0.6 for XTE J1550-564 (Remil-lard et al. 2002). This illustrates the potential di-agnostic power of fast QPOs, if we can specify thecorrect oscillation mechanism. Furthermore, mea-surements of black hole mass and QPO frequencyallow model-independent comparisons of spin dif-ferences between black hole subclasses as distin-guished, for example, by relativistic jets or binaryperiod.
With our measurement of the orbital periodand optical mass function of J1650, we have takenthe first steps need to fully exploit the potentialof this system. If the QPO at ν = 250± 5 Hz ob-served by Homan et al. (2003b) represents the 2ν0oscillation, then the predicted mass of the blackhole would be about 7.5M⊙, if J1650 lies on thesame ν : M curve on which GRO J1655-40, XTEJ1550-564, and GRS 1915+105 lie. On the otherhand, if J1650 contains a maximal Kerr black holeas argued by Miller et al. (2002), then J1650 wouldlie on a different ν : M curve than the other threesources, and the black hole mass would be higherthan the 7.5M⊙ predicted (e.g. Abramowicz et al.2004). Although there are substantial uncertain-ties in both our measured value for the opticalmass function and in our inclination estimate, itappears that the black hole mass might be lessthan 7.5M⊙.
Clearly additional data will be required to makemore definitive statements about the mass of the
compact object in J1650. It should not be un-duly difficult to obtain higher quality spectra. Inhindsight, we now know that the companion staris a late K-star, and as such it should have rela-tively strong absorption features near 5170A. Thisregion was not included in the VLT spectra owingto the relatively high resolving power of the 1200Rgrism. It should be easier to measure radial veloc-ities in spectra with more wavelength coverage (atthe expense of resolving power). Also, spectralobservations obtained in good to excellent seeingconditions (. 0.6 arcseconds) obviously will havebetter signal-to-noise than the current spectra do(the seeing varied between 1 and about 1.4 arcsec-onds). Additional photometry should be obtained,and it would be helpful if two or more bandpassescould be used, since the amount of contaminatinglight from the disk should vary with color.
5. Summary
Using R-band photometry of XTE J1650-500obtained with the 6.5m Clay telescope, we havemeasured a photometric period of P = 0.3205 ±0.007 days. This value seems secure since it isconfirmed by our reanalysis of archival spectro-scopic data. Our reanalysis of the spectroscopyalso yields a velocity semiamplitude for the com-panion star of K2 = 435± 30 km s−1, which whencombined with the orbital period, gives an opticalmass function of f(M) = 2.73 ± 0.56M⊙. Thespectral type of the companion is roughly K4V,and the summed spectrum suggests that the ac-cretion disk may contribute a substantial amountof light in R (≈ 80% or more). Using the R-bandlight curve, we find a lower limit to the inclinationof i = 50 ± 3, which gives an upper limit to themass of the black hole of M1 ≤ 7.3M⊙, assuminga mass ratio of Q = 10. If we assume that the ac-cretion disk contributes 80% of the light in R, thenthe inclination would be about 70 or more, andthe black hole mass would be about 4M⊙ (againassuming a mass ratio of Q = 10).
We thank Matt Holman and Paul Schechterfor providing supplementary photometric data andMauricio Navarette for help with the observations.This work was supported in part by NASA grantNAG5-9930.
6
REFERENCES
Abramowicz, M. A., & Kluzniak, W. 2001, A&A,374, L19
Abramowicz, M. A., Karas, V., Kluzniak, W., Lee,W. H., & Rebusco, P. 2003, PASJ, 55, 467
Abramowicz, M. A., Kluzniak, W., McClintock,J. E., & Remillard, R. A. 2004, A&A, in press(astro-ph/0402012)
Bailyn, C. D., Orosz, J. A., McClintock, J. E., &Remillard, R. A. 1995, Nature, 378, 157
Casares, J., Charles, P. A., & Naylor, T. 1992,Nature, 355, 614
Casares, J., Charles, P. A., & Marsh, T. R. 1995,MNRAS, 277, L45
Cowley, A. P., Crampton, D., Hutchings, J. B.,Remillard, R., & Penfold, J. E. 1983, ApJ, 272,118
Filippenko, A. V., Matheson, T., & Barth, A. J.1995, ApJ, 455, L139
Filippenko, A. V., Leonard, D. C., Matheson, T.,Li, W., Moran, E. C., & Riess, A. G. 1999,PASP, 111, 696
Filippenko, A. V., & Chornock, R. 2001, IAU Circ.#7644
Gies, D. R., & Bolton, C. T. 1986, ApJ, 304, 371
Greiner, J., Cuby, J. G., & McCaughrean, M. J.2001, Nature, 414, 522
Groot, P., Tingay, S., Udalski, A., & Miller, J.2001, IAU Circ. #7708
Homan, J., Miller, J. M., Wijnands, R., Steeghs,D., Belloni, T., van der Klis, M., & Lewin, W.H. G. 2003a, ATel #162
Homan, J. Klein-Wolt, M., Rossi, S., Miller, J. M.,Wijnands, R., Belloni, T., van der Klis, M., &Lewin, W. H. G. 2003b, ApJ, 586, 1262
Hutchings, J. B., Crampton, D., Cowley, A. P.,Bianchi, L., & Thompson, I. B. 1987, AJ, 94,340
Hynes, R. I., Steeghs, D., Casares, J., Charles, P.A., & O’Brien, K. 2003, ApJ, 583, L95
Kalogera, V., & Baym, G. 1996, ApJ, 470, L61
Markwardt, C., Swank, J., & Smith, E. 2001, IAUCirc., 7707, 2
Marsh, T. R., Robinson, E. L., & Wood, J. H.1994, MNRAS, 266, 137
McClintock, J. E., & Remillard, R. A. 1986, ApJ,308, 110
McClintock, J. E., Garcia, M. R., Caldwell, N.,Falco, E. E., Garnavich, P. M., & Zhao, P. 2001,ApJ, 511, L147
McClintock, J. E., & Remillard, R. A. 2004, inCompact Stellar X-ray Sources, eds. W. H.G. Lewin & M. van der Klis, (Cambridge:Cambridge University Press), in press (astro-ph/0306213)
Miller, J. M., Fabian, A. C., Wijnands, R.,Reynolds, C. S., Ehle, M., Freyberg, M. J.,van der Klis, M., Lewin, W. H. G., Sanchez-Fernandez, C., & Castro-Tirado, A. J. 2002,ApJ, 570, L69
Orosz, J. A., Bailyn, C. D., Remillard, R. A., Mc-Clintock, J. E., & Foltz, C. B. 1994, ApJ, 436,848
Orosz, J. A., & Bailyn, C. D. 1995, ApJ, 446, L59
Orosz, J. A., Jain, R. K., Bailyn, C. D., McClin-tock, J. E., & Remillard, R. A. 1998, ApJ, 499,375
Orosz, J. A., & Hauschildt, P. H. 2000, A&A, 364,265
Orosz, J. A., Kuulkers, E., van der Klis, M., Mc-Clintock, J. E., Garcia, M. R., Callanan, P. C.,Bailyn, C. D., Jain, R. K., & Remillard, R. A.2001, ApJ, 555, 489
Orosz, J. A., Groot, P. J., van der Klis, M., Mc-Clintock, J. E., Garcia, M. R., Zhao, P., Jain,R. K., Bailyn, C. D., & Remillard, R. A. 2002,ApJ, 568, 845
Remillard, R. A., McClintock, J. E., & Bailyn, C.D. 1992, ApJ, 399, L145
Remillard, R. A., Orosz, J. A., McClintock, J. E.,Bailyn, C. D. 1996, ApJ, 459, 226
7

Remillard, R. A. 2001, IAU Circ., 7707, 1
Remillard, R. A., Muno, M. P., McClintock, J. E.,& Orosz, J. A. 2002, ApJ, 580, 1030
Revnivtsev, M., & Sunyaev, R. 2001, IAU Circ.,7715, 1
Sanchez-Fernandez, C., Zurita, C., Casares, J.,Castro-Tirado, A. J., Bond, I., Brandt, S., &Lund, N. 2002, IAU Circ., 7989, 1 (SF2002)
Schnittman, J. D., & Bertschinger, E. 2004, ApJ,in press (astro-ph/0309458)
Shapiro, S. L., & Teukolsky, S. L. 1983, BlackHoles, White Dwarfs, and Neutron Stars (NewYork: Wiley)
Smith, R. C., Cameron, A. C., & Tucknott, D.S. 1993, in Cataclysmic Variables and RelatedPhysics, eds. O. Regev & G. Shaviv, G., (Bris-tol: IOP Publishing), p. 70
Stellingwerf, R. F. 1978, ApJ, 224, 953
Stetson, P. B., 1987, PASP, 99, 191
Stetson, P. B., 1990, PASP, 102, 932
Stetson, P. B., Davis, L. E., Crabtree, D. R., 1991,in “CCDs in Astronomy,” ed. G. Jacoby, ASPConference Series, Volume 8, page 282
Stetson P. B., 1992a, in “Astronomical Data Anal-ysis Software and Systems I,” eds. D. M. Wor-rall, C. Biemesderfer, & J. Barnes, ASP Con-ference Series, Volume 25, page 297
Stetson, P. B., 1992b, in “Stellar Photometry–Current Techniques and Future Develop-ments,” IAU Coll. 136, eds. C. J. Butler, & I.Elliot, Cambridge University Press, Cambridge,England, page 291
Tonry, J., & Davis, M. 1979, AJ, 84, 1511
Vande Putte, D., Smith, R. C., Hawkins, N. A., &Martin, J. S. 2003, MNRAS, 342, 151
Wade, R. A., & Horne, K. 1988, ApJ, 324, 411
Wagner, R. M., Foltz, C. B., Shahbaz, T., Casares,J., Charles, P. A., Starrfield, S. G., & Hewett,P. 2001, ApJ, 556, 42
Wijnands, R., Miller, J. M., & Lewin W. H. G.2001, IAU Circ., 7715, 2
This 2-column preprint was prepared with the AAS LATEXmacros v5.2.
8
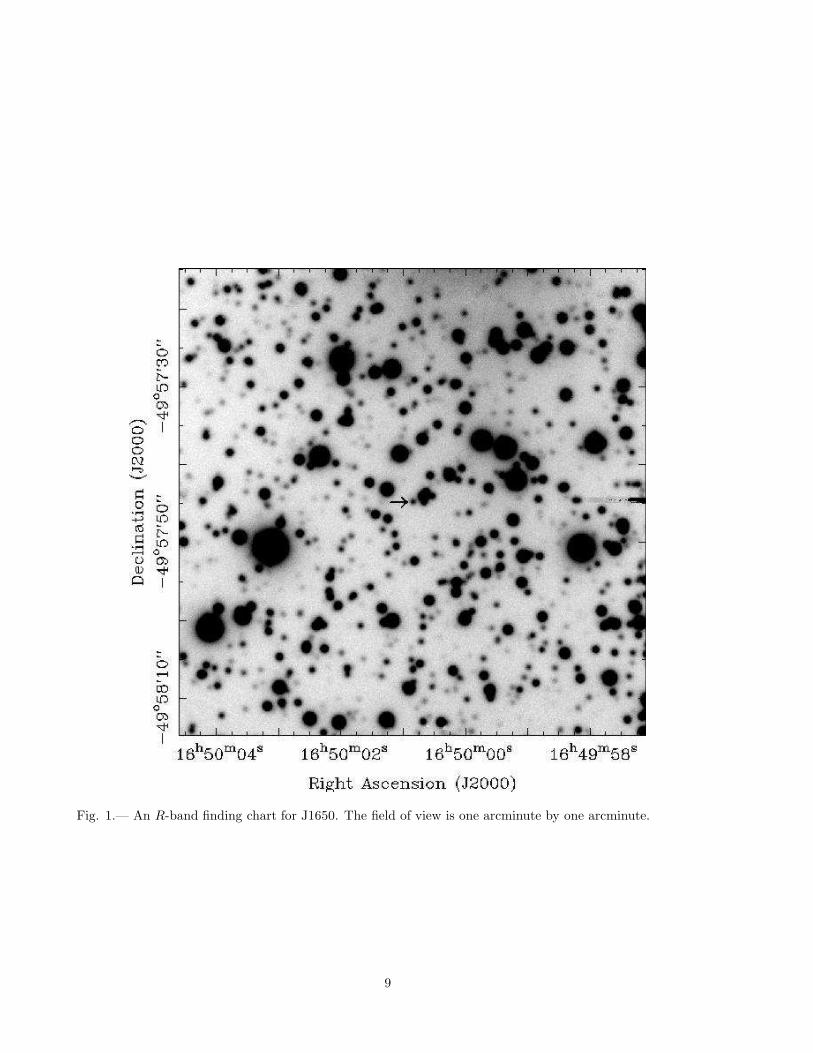
Fig. 1.— An R-band finding chart for J1650. The field of view is one arcminute by one arcminute.
9
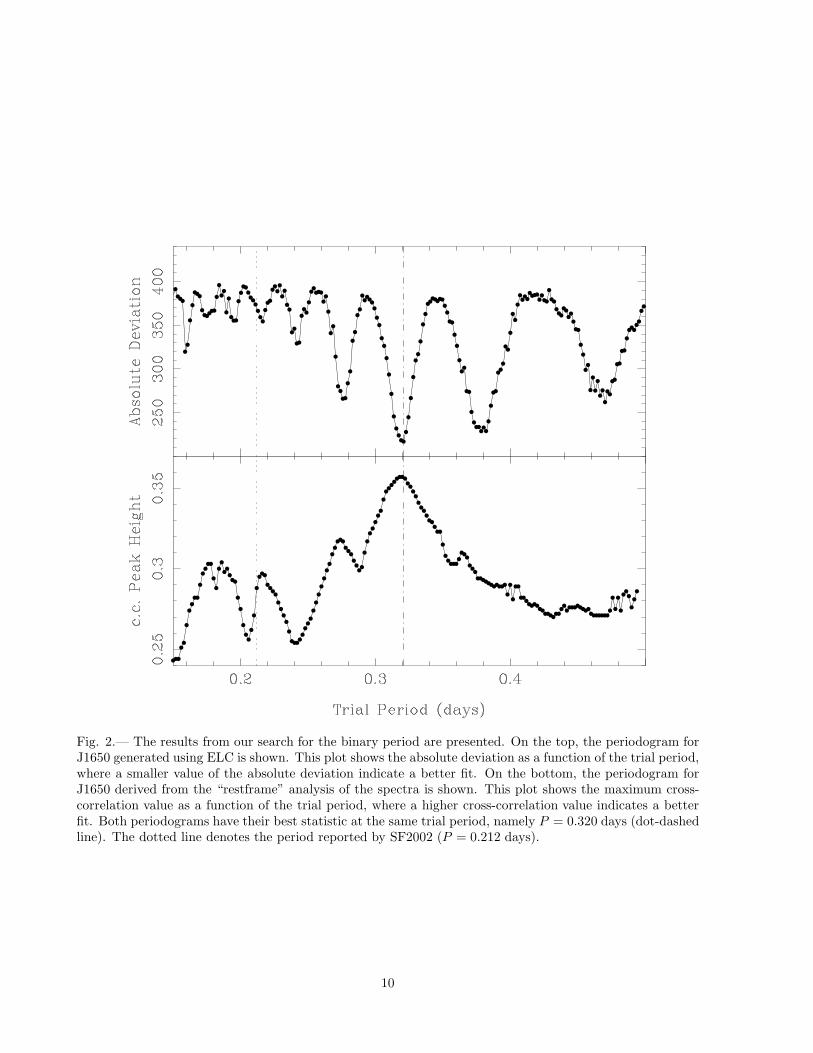
Fig. 2.— The results from our search for the binary period are presented. On the top, the periodogram forJ1650 generated using ELC is shown. This plot shows the absolute deviation as a function of the trial period,where a smaller value of the absolute deviation indicate a better fit. On the bottom, the periodogram forJ1650 derived from the “restframe” analysis of the spectra is shown. This plot shows the maximum cross-correlation value as a function of the trial period, where a higher cross-correlation value indicates a betterfit. Both periodograms have their best statistic at the same trial period, namely P = 0.320 days (dot-dashedline). The dotted line denotes the period reported by SF2002 (P = 0.212 days).
10

Fig. 3.— The Magellan light curve of J1650 phased on the spectroscopic ephemeris derived from the restframeanalysis. The top panel shows all of the data points, and the bottom panel shows the smoothed light curveusing 20 bins in phase, along with a representative ellipsoidal model fit.
11

Fig. 4.— A grayscale image and contour plot showing the peak cross-correlation value as a function ofK2 andT0 at a fixed period of P = 0.32 days. The maximum-cross correlation values happen when 430 . K2 . 439km s−1 and T0 = 2, 452, 436.600 (HJD). The thinner panels show the cross cuts of the cross-correlationvalues through the peak along the K2-axis and the T0-axis.
12

Fig. 5.— Bottom: The best normalized restframe spectrum of J1650 (top spectrum), the normalized spec-trum of the K4V star BS 5568, scaled by 0.1 and shifted upwards by 0.5 (bottom spectrum), and thedifference spectrum (middle spectrum). Top: The cross correlation function of the best restframe spectrumagainst the K4V star BS 5568.
13

Table 1
Cross Correlation Values for Templates
Star Spectral type Cross Correlation Tonry & Davis rPeak Value
BS 5568 K4V 0.36 7.69BS 7330 G5V 0.27 6.84
HD 11301 K2III 0.26 3.91BS 2668 K0V 0.18 1.88BS 8042 G3 IV 0.10 1.22
HD 209290 M0V 0.06 0.70
14