jes f i s electrochemistry and …
TRANSCRIPT

H3020 Journal of The Electrochemical Society, 166 (5) H3020-H3028 (2019)
JES FOCUS ISSUE ON SEMICONDUCTOR ELECTROCHEMISTRY AND PHOTOELECTROCHEMISTRY IN HONOR OF KRISHNAN RAJESHWAR
Integrated Membrane-Electrode-Assembly PhotoelectrochemicalCell under Various Feed Conditions for Solar Water Splitting
Tobias A. Kistler, 1,2,3,4 David Larson,2,3 Karl Walczak,2,3,a Peter Agbo,2,3 Ian D. Sharp,2,3,b
Adam Z. Weber, 1,3,∗,z and Nemanja Danilovic1
1Energy Storage and Distributed Resources Division, Lawrence Berkeley National Laboratory, Berkeley,California, USA2Chemical Sciences Division, Lawrence Berkeley National Laboratory, Berkeley, California, USA3Joint Center for Artificial Photosynthesis, Lawrence Berkeley National Laboratory, Berkeley, California, USA4Chair of Technical Electrochemistry, Department of Chemistry, Technische Universitat Munchen, Munich,Germany, USA
Photoelectrochemical (PEC) water splitting has the potential to significantly reduce the costs associated with electrochemicalhydrogen production through the direct utilization of solar energy. Many PEC cells utilize liquid electrolytes that are detrimental tothe durability of the photovoltaic (PV) or photoactive materials at the heart of the device. The membrane-electrode-assembly (MEA)style, PEC cell presented herein is a deviation from that paradigm as a solid electrolyte is used, which allows the use of a water vaporfeed. The result of this is a correspondent reduction in the amount of liquid and electrolyte contact with the PV, thereby openingthe possibility of longer PEC device lifetimes. In this study, we demonstrate the operation of a liquid and vapor-fed PEC deviceutilizing a commercial III-V photovoltaic that achieves a solar-to-hydrogen (STH) efficiency of 7.5% (12% as a PV-electrolyzer).While device longevity using liquid water was limited to less than 24 hours, replacement of reactant with water vapor permitted100 hours of continuous operation under steady-state conditions and diurnal cycling. Key findings include the observations thatthe exposure of bulk water or water vapor to the PV must be minimized, and that operating in mass-transport limited regime gavepreferable performance.© The Author(s) 2018. Published by ECS. This is an open access article distributed under the terms of the Creative CommonsAttribution 4.0 License (CC BY, http://creativecommons.org/licenses/by/4.0/), which permits unrestricted reuse of the work in anymedium, provided the original work is properly cited. [DOI: 10.1149/2.0041905jes]
Manuscript submitted October 15, 2018; revised manuscript received November 27, 2018. Published December 10, 2018. This paperis part of the JES Focus Issue on Semiconductor Electrochemistry and Photoelectrochemistry in Honor of Krishnan Rajeshwar.
Widespread adoption of inexpensive renewable-electricity sourcesbrings with it many exciting challenges and opportunities, the mostsignificant being an overabundance of low-cost electricity as a resultof low-cost solar panels and wind turbines.1,2 Thus, there is an op-portunity to use virtually free electrons and photovoltaics to producefuels and chemicals using electrochemical and photoelectrochemicaldevices, respectively with water and/or carbon dioxide as reactants.While electrochemical hydrogen production using water electroly-sis is a commercial technology, barriers remain in terms of cost andefficiency improvements for its widespread adoption.3,4 Alternativewater-splitting technologies that have the long-term potential to pro-duce inexpensive hydrogen include photoelectrochemical (PEC) ap-proaches, which are still in their infancy.5,6 A PEC cell comprisesat least one and sometimes two photoelectrodes that provide a plat-form for direct solar-to-chemical conversion. The anodic reaction isoxygen evolution, while the cathodic reaction is hydrogen evolution.While there are many cell designs used for demonstrating material anddevice properties, a true PEC must have at least one PV-electrolytejunction, otherwise it is a solar driven electrochemical cell (PV-E).7–9
Most PEC studies and proposed devices consist of a liquid junction,in which a liquid electrolyte is in contact with one or both photoactiveelectrodes.10–14 The main disadvantage of the use of liquid electrolytesis that the pH is usually at pH 0 or pH 14, and degrades the semicon-ductor material at an unacceptably high rate through corrosion andphotocorrosion mechanisms.15–17 Furthermore, the use of liquid feedsnecessitates more complicated water management and piping at scale.One solution to the limited durability issue is to remove the liquidelectrolyte and use liquid water or vapor in combination with a solidpolymer electrolyte, such as Nafion.18–21 Herein, we describe a proton-exchange-membrane (PEM)-based water-splitting platform (Figure 1)
∗Electrochemical Society Fellow.aPresent address: Sandia National Laboratory, Albuquerque, New Mexico, USA.bPresent address: Walter Schottky Institute and Physics Department, Technische Uni-versitat Munchen, Munich, Germany.
zE-mail: [email protected]
that can be used for PV-electrolysis (PV-E) and PEC operation witheither liquid or vapor reactants, and that can easily accommodate pho-toanodes and photocathodes while producing stable solar to hydrogenefficiencies exceeding 12% for more than 100 hours.
Experimental
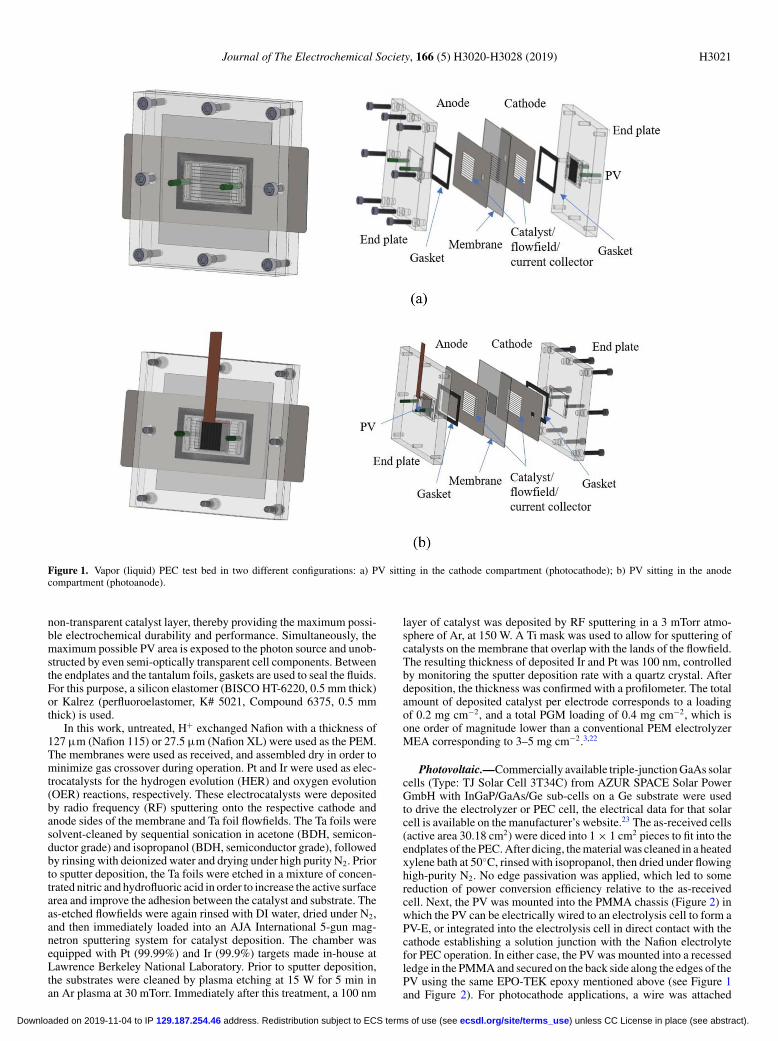
Cell architecture and components.—The philosophy behind thedesign of the cell includes many facets incorporated from traditionalelectrochemical membrane electrode assembly (MEA) based elec-trolyzers and fuel cells, which consist of endplates, flowfields, currentcollectors, and electrodes separated by an ion-conducting membrane.The main modifications that are introduced arise from the requirementthat the photoactive components of the cell must have access to light.Due to this constraint, the endplates used herein are machined frompolymethylmethacrylate (PMMA, McMaster-Carr Supply Company,Santa Fe Springs, CA), a tough, translucent, and chemically resistantplastic that ensures the mechanical sealing of the cell (Figure 1). Theflow ports are attached with a two-component epoxy (EPO-TEK 302-3M) in the holes of the plates (green tubes, perpendicular to endplatein Figure 1). A header is machined in the PMMA to improve the dis-tribution of the reactant coming in and out of the endplate through theflow port, while decreasing the pump pressure. The endplates are usedto compress the cell components, but since they are electrically iso-lating, a conductive tantalum foil with channels serves as a flowfield.The flowfields are used to channel reactants to the active sites and re-move products, while also providing current collection. Furthermore,the flow channels serve as catalyst supports. The flowfields were fab-ricated using electrical discharge machining (EDM) or laser cutting100 μm thick tantalum foil, creating 0.9 mm wide channels, 100 μmwide lands and channel lengths of 17.3 mm. This pattern maximizedthe amount of light going through the cell, while still supporting themembrane and allowing for mass transport, which is very importantfor the photocathode (Figure 1a) configuration, in which the total illu-minated PV area is limited by the tantalum foils. For the photoanodeconfiguration (Figure 1b) the entire available area can be coated with
) unless CC License in place (see abstract). ecsdl.org/site/terms_use address. Redistribution subject to ECS terms of use (see 129.187.254.46Downloaded on 2019-11-04 to IP
Journal of The Electrochemical Society, 166 (5) H3020-H3028 (2019) H3021
Figure 1. Vapor (liquid) PEC test bed in two different configurations: a) PV sitting in the cathode compartment (photocathode); b) PV sitting in the anodecompartment (photoanode).
non-transparent catalyst layer, thereby providing the maximum possi-ble electrochemical durability and performance. Simultaneously, themaximum possible PV area is exposed to the photon source and unob-structed by even semi-optically transparent cell components. Betweenthe endplates and the tantalum foils, gaskets are used to seal the fluids.For this purpose, a silicon elastomer (BISCO HT-6220, 0.5 mm thick)or Kalrez (perfluoroelastomer, K# 5021, Compound 6375, 0.5 mmthick) is used.
In this work, untreated, H+ exchanged Nafion with a thickness of127 μm (Nafion 115) or 27.5 μm (Nafion XL) were used as the PEM.The membranes were used as received, and assembled dry in order tominimize gas crossover during operation. Pt and Ir were used as elec-trocatalysts for the hydrogen evolution (HER) and oxygen evolution(OER) reactions, respectively. These electrocatalysts were depositedby radio frequency (RF) sputtering onto the respective cathode andanode sides of the membrane and Ta foil flowfields. The Ta foils weresolvent-cleaned by sequential sonication in acetone (BDH, semicon-ductor grade) and isopropanol (BDH, semiconductor grade), followedby rinsing with deionized water and drying under high purity N2. Priorto sputter deposition, the Ta foils were etched in a mixture of concen-trated nitric and hydrofluoric acid in order to increase the active surfacearea and improve the adhesion between the catalyst and substrate. Theas-etched flowfields were again rinsed with DI water, dried under N2,and then immediately loaded into an AJA International 5-gun mag-netron sputtering system for catalyst deposition. The chamber wasequipped with Pt (99.99%) and Ir (99.9%) targets made in-house atLawrence Berkeley National Laboratory. Prior to sputter deposition,the substrates were cleaned by plasma etching at 15 W for 5 min inan Ar plasma at 30 mTorr. Immediately after this treatment, a 100 nm
layer of catalyst was deposited by RF sputtering in a 3 mTorr atmo-sphere of Ar, at 150 W. A Ti mask was used to allow for sputtering ofcatalysts on the membrane that overlap with the lands of the flowfield.The resulting thickness of deposited Ir and Pt was 100 nm, controlledby monitoring the sputter deposition rate with a quartz crystal. Afterdeposition, the thickness was confirmed with a profilometer. The totalamount of deposited catalyst per electrode corresponds to a loadingof 0.2 mg cm−2, and a total PGM loading of 0.4 mg cm−2, which isone order of magnitude lower than a conventional PEM electrolyzerMEA corresponding to 3–5 mg cm−2.3,22
Photovoltaic.—Commercially available triple-junction GaAs solarcells (Type: TJ Solar Cell 3T34C) from AZUR SPACE Solar PowerGmbH with InGaP/GaAs/Ge sub-cells on a Ge substrate were usedto drive the electrolyzer or PEC cell, the electrical data for that solarcell is available on the manufacturer’s website.23 The as-received cells(active area 30.18 cm2) were diced into 1 × 1 cm2 pieces to fit into theendplates of the PEC. After dicing, the material was cleaned in a heatedxylene bath at 50◦C, rinsed with isopropanol, then dried under flowinghigh-purity N2. No edge passivation was applied, which led to somereduction of power conversion efficiency relative to the as-receivedcell. Next, the PV was mounted into the PMMA chassis (Figure 2) inwhich the PV can be electrically wired to an electrolysis cell to form aPV-E, or integrated into the electrolysis cell in direct contact with thecathode establishing a solution junction with the Nafion electrolytefor PEC operation. In either case, the PV was mounted into a recessedledge in the PMMA and secured on the back side along the edges of thePV using the same EPO-TEK epoxy mentioned above (see Figure 1and Figure 2). For photocathode applications, a wire was attached
) unless CC License in place (see abstract). ecsdl.org/site/terms_use address. Redistribution subject to ECS terms of use (see 129.187.254.46Downloaded on 2019-11-04 to IP

H3022 Journal of The Electrochemical Society, 166 (5) H3020-H3028 (2019)
Figure 2. Test bed components (from left to right): Transparent endplate; with tubes (beige) added; endplate with PV attached; PV endplate from the back sideshowing wire connection and tubing.
with Ag conductive glue to the back of the PV for current collectionand is secured with more epoxy, while the front of the PV was indirect contact with the cathode tantalum flowfield. For photoanodeoperation, a copper strip was used to make contact along the edgeof the front of the PV for current collection, while the back side issputtered with gold as a protective layer and Ir as catalyst and makescontact with the anode tantalum flowfield.
Cell assembly.—A mounting plate is used to assemble the compo-nents; the plate consists of a holder with four screws that protrude upand fit into the holes of the backplate. First, the backplate is placed ontop of the mounting table, which allows the entire cell to be alignedeasily as the layers are stacked. Then, the cathode gasket is centered onthe back endplate, followed by the cathode tantalum foil. In the case ofthe PEC photocathode design, the electrical stripes of the photovoltaicfront side should be perpendicular to the wires of the tantalum foil toimprove the contact. The stripes of the catalyst on the membrane haveto be aligned well with the wires of the tantalum foil flowfield to es-tablish good electrical contact, and to minimize the percentage of lightthat gets blocked coming from the side of the front endplate goingto the photovoltaic embedded in the back endplate. Next, the anodegasket is positioned on top of the anode tantalum foil, followed bythe front endplate. The cell is then compressed by tightening the eightscrews evenly and in a star-shaped pattern to a final torque of 0.1 Nm.The gasket’s thickness and endplate load is tuned in order to provideadequate active area pressure but not to damage the membrane by thelands of the tantalum flowfields, confirmed with pressure film.24 How-ever, we emphasize that without the use of any gas-diffusion layersor porous-transport layers, whose opacity precludes their application,areas of the membrane are unsupported and thus affected by pressuredifferences. The assembled cell as either PV-E or PEC can be seen inFigure 3.
Device performance measurements .—All electrochemical, pho-toelectrochemical, and solid-state photovoltaic data were collectedusing a Biologic SP-300 potentiostat. Dark (without illumination,potentiostat biased), two-electrode measurements were taken usingcounter electrode and reference electrode leads connected to the cath-
Figure 3. Test bed as PV-E, with PV as a separate chassis out of view (left)and PEC with integrated electrolyzer and PV (right).
ode, while the working electrode was connected to the anode. Foron-sun experiments (with illumination, potentiostat un-biased) in ei-ther PV-E or PEC mode, the reference and counter electrodes wereconnected to the cathode and front contact of the PV, while the work-ing electrode was connected to the anode and the back contact of thePV as the potentiostat served to measure the current flowing throughthe cell. Simulated sunlight was produced using an AAA-rated New-port Oriel Sol3A equipped with a Xe lamp and AM 1.5 G filter toobtain a 12′′ × 12′′ illumination area. A Newport 91150V referencecell with a monocrystalline silicon solar cell and an integrated ther-mocouple was used to measure the solar irradiance. The reference cellwas calibrated and traceable to both NREL and to the InternationalSystem of Units (SI). Solar water-splitting devices were positioned toreceive 1 sun (1000 W m−2) illumination to the PV front surface, asdetermined using the reference cell.
The produced gases were analyzed using a gas chromatograph(GC, Agilent 7890A, Santa Clara, CA). The gas chromatograph wasequipped with two channels, between which measurements couldbe toggled. The cycle time for each run was 7.5 min. Calibrationcurves for H2 and O2 were obtained with a 3-point calibration curveat 100, 1000, 9918 ppm and 100, 1000, 8000 ppm, respectively. Priorto calibration, the system was purged for 20 min with 10 sccm ofthe calibration gas of interest, after which the mass-flow controllers(Alicat Scientific, 10 sccm full scale) were set to the desired flow rate.A minimum of ten samples was collected for each calibration point.On the cathode side, a dry N2 sweep gas was used flowing throughthe cathode compartment of the cell into a hydrogen/vapor waterseparator; the hydrogen gas went out of the headspace and into the GC.On the anode side, Milli-Q water (MilliporeSigma, Burlington, MA,resistivity of >18.2 M�∗cm) was pumped through the cell and intothe oxygen/liquid water separator; the head space of the separator waspurged with dry N2 into the GC for analysis. Two syringe pumps with aDual Pump Plumbing Kit (New Era Pump Systems Inc., Farmingdale,NY) were used to maintain continuous flow of water at a rate of0.05 ml min−1. The flow rate of purge gases was controlled usingmass flow controllers, a combination of 0.5 sccm for the anode and10 sccm for the cathode showed the best performance in the case of aliquid-feed anode. In the case of vapor-feed tests, humidified nitrogenflowed into either the anode and cathode compartments or only theanode compartment, at rates between 25 to 50 sccm. A test stand (FuelCell Technologies. Inc., Albuquerque, NM), equipped with a heatedhumidifier filled with Milli-Q water and heated gas lines, was usedto humidify the feed gases. To ensure minimal water condensation,the gas line temperature was set to 50◦C, which is 5◦C higher thanthe humidifier and cell temperature after exposure to the light sourcefor at least 30 minutes. This results in a relative humidity of roughly100% in the electrode compartment(s) fed by humidified N2.
Results and Discussion
We systematically evaluated the impact of materials of cell orMEA manufacture, cell preparation, and operating conditions (liquidand vapor feed), with the goal of achieving stable electrolysis and
) unless CC License in place (see abstract). ecsdl.org/site/terms_use address. Redistribution subject to ECS terms of use (see 129.187.254.46Downloaded on 2019-11-04 to IP

Journal of The Electrochemical Society, 166 (5) H3020-H3028 (2019) H3023
Figure 4. Gas crossover and efficiency comparison between two different membranes: Nafion XL and N115. A) Biased polarization curves overlaid with the PVj-V curve, intersections indicate operating points are limited by the PV. B) Faradaic efficiency and gas crossover as a function of membrane thickness during a50-hour PV-E durability test with an average current of 10.5 mA cm−2 during both experiments.
PV-E conditions in either mode of operation (liquid water or watervapor) prior to PEC testing. The results of these tests are provided inthe Supplemental Information.
Effect of membrane thickness.—To maximize the amount of lightthat reaches the PV sitting in the cathode compartment, the membraneneeds to be as thin as possible. A thinner membrane also results inlower ohmic resistance, however at the expense of increased hydrogencrossover.25,26 Thus, we evaluated two membrane thicknesses of theperfluorosulfonic-acid chemistry. The thinner membrane Nafion XL(27.5 μm thick) also contained a PTFE membrane support material,while the thicker membrane was Nafion 115 (127 μm thick). As ex-pected, decreasing the membrane thickness improved the electrolysisperformance by 120 mV at the operating current density due to thelower ohmic resistance (Figure 4a). However, this resulted in a sig-nificantly increased hydrogen crossover (Figure 4b) from 6% to 18%,which reduces the solar to hydrogen (STH, Equation 1) efficiency:
STH = current density × 1.229 V × faradaic efficiency
illumination power density[1]
We note that crossover hydrogen from the cathode to the anode, ef-fectively reduces the amount of produced H2. This is reflected in thefaradaic efficiency which is the difference between the amount of H2
produced from the supplied current and the amount of H2 that doesnot go into the cathode product stream. Thus, the resulting faradaicefficiency of over 90% using Nafion 115 decreases to about 70% us-ing Nafion XL (see Figure 4b). Since the intersection with the PVpower curve limits the operating point of the cell, as shown by theintersection points of the photocurrent with the OER current duringelectrolysis (Figure 4a), maximum achievable PV-E or PEC currentdensity is controlled by the PV, regardless of the thickness of mem-brane used. However, the crossover is severely affected as shown bythe H2 crossover and faradaic efficiency in Figure 4b. Hence, Nafion115 was chosen for further studies in this work. As shown in Figure4a, a maximum current density of at least 20 mA cm−2 below 2 Vis achieved in biased electrolyzer experiments with the MEA. This iswell above the short circuit current of the PV which represents theupper limit of current that it can supply to the MEA (as describedin the SI, Figure S1). Thus, for the PV-E and PEC experiments, theintersections in Figure 4a between the electrolyzer and PV representthe maximum photocurrent density of nearly 14 mA cm−2 achiev-able during operation. We measured the transmission of light throughN115 and found it to transmit 97% of light across the visible spectrum.Therefore, it is not expected that the membrane is limiting under PECconditions. However, the choice of liquid water pump circulation anddelivery pump could limit the durability of the PEC cell due to im-
proper membrane hydration conditions, as presented in the SI (FigureS2 and Figure S3).
Liquid-water feed PV-E and PEC.—Initial integration utilizedthe PV-E setup, wherein the PV connects to the anode or the cathodeside of the cell, but still not fully integrated (see Figure 3 left). Inboth anode and cathode configuration, PV area (1 cm2) and catalystareas (1 cm2) are the same, only the geometry differs. In the cathodePV-E configuration, the front of the PV was contacted by a tantalumfoil and wired to the electrolysis cell, in the anode, the electricalcontact between the back of the PV and the anode compartment wasestablished by conductive glue.
First, to evaluate the long-term durability of the electrolysis MEAand the PV contact, a photocathode PV-E configuration was used witha syringe pump setup, and Nafion 115. Under these conditions, a max-imum solar to hydrogen (STH) efficiency above 12% was observedwith stable performance (STH efficiency loss of less than 1%) formore than 100 hours (Figure 5b, photocathode). Also, the expectedH2/O2 stoichiometry of 2 was observed (see Figure S4a), indicatinghigh faradaic efficiency (Figure S4b), and the stability of the MEAwas confirmed by cyclic voltammetry measurements before and afterthe long-term operation (Figure S4c).
Second, the photoanode configuration was tested keeping all theother conditions the same. The initial electrolysis performance of thephotoanode cell, showed in Figure 5a, is lower than the photocathodeperformance. This was probably due to the use of dense and thicksputtered catalyst layers on the membrane, which lack the porosity toproduce superior electrocatalytic performance.27 A more reasonableapproach is to utilize a conventional coating process for the catalystlayer which no longer has the requirement to be optically transparent.On the other hand, the PV performance is more efficient in the pho-toanode configuration because of the improved front contact to thePV (compare with Figure S1). However, in both cases, the achievableelectrical current of the whole system is still limited by the maximumcurrent available from the PV, see intersections 1 and 2 in Figure 5a.Both configurations show similar initial STH efficiencies and insignif-icant degradation rates which results in over 12% STH efficiency aftermore than 100 hours, see Figure 5b.
For PEC operation, the PV was glued into the cathode compartmentendplate of the electrolysis cell and put directly in contact with thecathode catalyst and electrolyte to form an integrated PEC cell. Theanode was fed with liquid water from the dual syringe pump while thecathode was flushed with dry nitrogen and light was provided by thesolar simulator through the cell. Initial STH was around 7%, which is42% lower than the PV-E configuration as a result of the reduced lighttransparency to the PV. More significantly and unexpectedly, the STH
) unless CC License in place (see abstract). ecsdl.org/site/terms_use address. Redistribution subject to ECS terms of use (see 129.187.254.46Downloaded on 2019-11-04 to IP

H3024 Journal of The Electrochemical Society, 166 (5) H3020-H3028 (2019)
Figure 5. Comparison between photoanode and photocathode operation in PV-E configuration, liquid feed to the anode using double syringe pump setup (a)Biased polarization curves for photoanode and photocathode MEAs overlaid with PV cell performance showing the operating performance of either cell is notlimited by the MEA but by the PV. (b) Long-term durability test of the unbiased PV-E cells showing equivalent durability and STH in both photoanode andphotocathode configurations culminating in more than 12% STH efficiency for over 100 hours continuous operation, using a liquid-water fed double syringe pumpsetup.
and operating current decreased rapidly with time and after 24 hoursthe efficiency was too low to continue the experiment (see Figure 6a).This accelerated degradation is due to pitting corrosion of the PV (seeFigure 6b) from liquid water that diffused or was electro-osmoticallytransported from the anode to the cathode. The resulting corrosiondrastically affected the PV efficiency, see Figure 6c for comparisonbefore and after PEC test. The open-circuit voltage of the PV as wellas the fill factor dropped significantly, hence making it impossible forthe PV to provide enough potential to drive water splitting. Since thematerial properties of the sub-cells in the triple junction PV and theantireflection coating (ARC) are carefully matched,28 it is importantto protect each layer of the PV from damage. If one of the sub-cellsor the ARC falls victim to corrosion or mechanical damage, the lightamount and distribution to the sub-cells changes, which results in acurrent drop and mismatch and therefore decrease in PV efficiency.For this reason, either the PV front surface needs to be protected forefficient PV operation in the cathode compartment or the amount ofwater reaching the PV needs to be reduced substantially.29,30
Vapor feed PV-E and PEC.—The same MEA setup used in liquidwater fed PV-E mode was used for evaluating performance and dura-bility of vapor-feed operation. For vapor-feed operation, the syringepump is replaced by nitrogen gas with a controlled water content(∼100% relative humidity) by using mass-flow controllers as de-scribed above. Initially, humidified gas was supplied to both sides
of the cell (dual vapor feed). Comparing the liquid-water-feed ver-sus vapor-feed performance (Figure 7a), the performance of the dualvapor-feed cell during the limited timeframe for this potentiodynamic,biased test was not impacted by either the lower mass transport of va-por versus liquid, nor the reduced conductivity of the membrane undervapor conditions. Furthermore, the same STH efficiency of 12% wasachieved (Figure 7b) compared to liquid feed PV-E operation, and thedurability was also unaffected as the STH remained above 11% after100 hours, indicating that the cell operation was once again durablein dual vapor-feed mode.
Since water on the cathode side of the cell is detrimental to thePV, vapor-feed operation may reduce the corrosion by decreasingthe amount of liquid water in the cell without impacting the elec-trochemical performance significantly. However, we found that usingthe same PEC configuration and with humidified feeds in both com-partments results in similar degradation. Thus, in order to decreasedegradation in PEC operation, a more drastic reduction in water con-tent in the cathode compartment must be achieved. To accomplishthis, water vapor is only supplied to the anode side of the cell whilethe cathode is flushed with dry nitrogen gas. In this configuration,the PEC’s durability increased to over 4 days while still achievingthe same peak STH of ∼7% (Figure 8a) as the liquid-water fedPEC. However, in this configuration, the cell is very sensitive to gasflow conditions and humidity. During the first 22 hours of operation(part I), the bubble humidifier was heated to 50◦C, which is slightly
Figure 6. Corrosion arising on the PV front surface during unprotected PEC photocathode operation with liquid water fed to the anode (a) Decreasing STH overtime due to PV corrosion; (b) Optical image showing corrosion on PV surface after cell disassembly; (c) Comparison of PV efficiency from beginning of life toafter 25 hours of durability testing showing decrease in fill factor and electrical current.
) unless CC License in place (see abstract). ecsdl.org/site/terms_use address. Redistribution subject to ECS terms of use (see 129.187.254.46Downloaded on 2019-11-04 to IP

Journal of The Electrochemical Society, 166 (5) H3020-H3028 (2019) H3025
Figure 7. Comparing PV-E performance in photocathode configuration between liquid-water-anode and dual (anode and cathode) vapor feed (a) Biased polarizationcurves for liquid water and vapor feed. (b) Long-term durability test of the unbiased PV-E cells showing equivalent durability and STH in both liquid-water andvapor feed culminating in more than 11% STH efficiency for over 100 hours continuous operation.
above the cell temperature (45◦C) in order to ensure 100% relativehumidity in the anode compartment. At these conditions, the mem-brane in the PEC periodically dried and re-humidified, resulting in atemporary increase in membrane resistance and fewer water moleculesbeing available for the water-splitting reaction. In other words, the celloperated under water mass-transport limiting conditions, which alsolimited the amount of water that made it to the cathode side of thecell, thus extending the lifetime of the PV. However, this resulted influctuation of STH efficiency between around 5 and 8% as the cellperformance oscillated. To balance the cell’s water supply and waterconsumption, during the next 20 hours (22 to 42, part II in Figure 8a)the temperature of the humidifier was increased to 60◦C, resultingin super-saturation and some liquid water in the anode compartment.This decreased the dry time of the cell in which the membrane wasbeing re-humidified and resulted in a higher average STH efficiencyover time and decreased frequency of oscillation. Then, after 42 hoursof operation (part III), the anode gas flow rate was doubled from aninitial 25 sccm to 50 sccm to deliver even more water to the PEC.As a consequence, the membrane did not dry out and the fluctuationsin STH efficiency were entirely removed. Initially, this can be seenas a benefit due to improved steady-state performance, however, afteraround 10 hours of operation under those conditions, the STH effi-ciency gradually decreased, mimicking the failure of the liquid-water
PEC test. Under these conditions, there is an excess of water in thePEC, resulting in slow corrosion of the PV. The performance beforeand after operation of the two parts, PV and electrolysis cell, is shownseparately in Figure 8b. The open-circuit voltage, short-circuit currentand fill factor of the PV dropped considerably, reducing its ability todrive reactions in the electrolysis cell. While the decrease in elec-trolytic activity would not influence the resulting current density ofthe overall device using a new PV (compare intersections labeled 1and 2 in Figure 8b), it further drops the current density in combina-tion with the degraded PV because of the PV’s decreased fill factor(compare intersections labeled 3 and 4). Since the water balance iscritical to long term operation of the PEC, it is essential to preventor block liquid-water accumulation and condensation at the PV, eventhough it might cause more oscillatory behavior. We also evaluatedthe operation of the vapor fed PEC cell under more aggressive diurnalcycling which is included in the SI (Figure S5).
After disassembling the PEC, the PV was examined usingSEM/EDX and XRF. The corrosion of the PV was obvious visually,in the form of pits. The XRF, SEM/EDX measurements (Figure 9)show that the Ag/Au electrical contact was largely intact, except inthe locations where pits where formed. The corrosion starts with theAl2O3 and TiOx anti-reflective coating layer, and then proceeds to thetop layers (InGaP and GaAs) of the triple-junction PV. The patterns
Figure 8. PEC photocathode operation with water vapor fed to the anode and dry N2 to the cathode. (a) STH efficiency plotted as a function of time during thedurability test lasting more than four days. Sections demark different operating conditions in order to manage the cell water consumption and hydration. I) 100%RH condition resulting in oscillating STH due to membrane dehydration; II) oversaturated condition with decreased oscillation periods; III) increased flow ratefurther increasing the membrane hydration but causing liquid water to collect on the cathode and corrode the PV. Note for the first 17 hours (dashed line), directgas detection was not available, the STH efficiency was calculated assuming the same faradaic efficiency as in the first 10 hours of direct gas detection with a gaschromatograph (solid line). (b) MEA CV overlays with PV j-V curves before and after testing, showing a combination of electrochemical degradation and PVcorrosion resulting in decreased STH after 96 hours.
) unless CC License in place (see abstract). ecsdl.org/site/terms_use address. Redistribution subject to ECS terms of use (see 129.187.254.46Downloaded on 2019-11-04 to IP

H3026 Journal of The Electrochemical Society, 166 (5) H3020-H3028 (2019)
Figure 9. Failure analysis characterization of the PV after durability testing. a) XRF with insets b) SEM c) EDX pictures of the corroded PV after 100 hours.Corrosion only occurs on some parts of the PV while other parts remain unaffected as seen in the XRF and SEM images. The Au/Ag front electrical contactsare largely intact except near corroded spots. The Al and Ti oxide top layers and InGaP semiconducting layers are only affected in certain areas that visuallycorrespond to the channels that are formed by the Ta flowfields. The corrosion forms surfaces similar to impact craters: the thickness of the PV at the center of acrater is reduced, only the germanium substrate of the triple-junction PV is left, while at the edge of the crater the thickness of the PV increased, which can causethe front contact to lift and break.
of corrosion follow the Ta flowfields of the device, the corrosion ofthe semiconducting layers which are gradually removed in some spotsduring the operation inevitably lead to the decrease in PV’s perfor-mance. Visual analysis of the video feed (see Supplemental video)during PEC operation clearly shows disparity between liquid floodedareas, which indicates that the main cause of corrosion of the PV iscondensed water that accumulates locally and causes degradation. Atthis time, we do not want to speculate as to the mechanism of corro-sion through the Al2O3 and TiOx layers, except that it most likely hasto do with the following: The PV is in contact with the Nafion mem-brane (which is strongly acidic) through the channels of the flowfield(depending on the balance of fluid pressure between the anode andcathode); the water emerging through the membrane from the anodeto the cathode is protonated which renders it more acidic than DIwater. XRF analysis of the MEA and cathode Tantalum foil indicate
that the sputtered Pt and Ir catalyst layers are largely preserved duringoperation (Figure S6).
Barrier layer operation.—Finally, having characterized the natureand operation of the integrated MEA device, we introduced a barrierlayer to the PEC to improve its durability by further limiting accessof water to the PV. The approach used is derived from a previouspublication,15 we first ensured adequate contact between the PV andthe Ta flowfield, and then coated the exposed PV surface with epoxy(EPO-TEK 302-3M). The cell with barrier coating was first evaluatedunder steady state operation with 1 sun illumination intensity andanode vapor feed (Figure 10a), to compare it with the most stablePEC operating condition without barrier layer (Figure 8). While theoscillations due to membrane dehydration persist, the STH is steadyover 100 hours of testing, peaking at 7.5%. Due to the ruggedness
Figure 10. Cell operation with vapor feed and a barrier layer. (a) First 100 hours of durability test with anode vapor feed only, STH efficiency plotted as a functionof time shows durable performance with fluctuations due to hydration/dehydration cycles of the membrane. (b) Diurnal cycling performed with dual vapor feedafter 122 hours of steady state testing at 1 sun. The STH output was largely not affected during the cycles which indicated the durability of the cell.
) unless CC License in place (see abstract). ecsdl.org/site/terms_use address. Redistribution subject to ECS terms of use (see 129.187.254.46Downloaded on 2019-11-04 to IP

Journal of The Electrochemical Society, 166 (5) H3020-H3028 (2019) H3027
Figure 11. Vapor fed device with barrier layer characterization. a) MEA CV overlays with PV j-V curves before and after testing, showing unchanged PV operationand slight electrochemical degradation of the cell after a cumulative 122 hours of steady state durability testing and three diurnal cycles. b) XRF measurement ofPV after testing, showing the PV surface is intact with neither signs of pitting nor loss of antireflection coating/semiconducting components. Note that the tantalumstrip shown is from the altered current collecting scheme used with the barrier coating.
of the barrier coating, we subsequently used dual vapor flow on thesame sample for an additional 22 hours of further steady state opera-tion (Figure S7a), which decreased the amplitude of oscillations. Toexplore more realistic operation, diurnal cycle testing was conductedusing the dual vapor-feed (Figure 10b), j-V curves of the PV at dif-ferent light intensities can be seen in Figure S8a. Diurnal cycling isthe most realistic test condition for a PEC cell as it mimics the naturalday and night transitions and causes additional stresses to the PEC.This also provides an understanding of the effective turndown ratioof the integrated cell. The results of the diurnal cycling again showedstable operation and a peak STH of 7.5%, while for an unprotectedPV the STH dropped from 7.5% to around 2.5% over the course ofthe diurnal test (Figure S5a).
Post testing analysis of the unprotected PEC device revealed thatthe degradation in performance was primarily due to degradation ofthe PV (CV and j-V curves in Figure S5b). In contrast, post test-ing analysis of the barrier protected device showed that the cell waslargely unaffected after a cumulative 182 hours of testing (122 hoursof steady state followed by three diurnal cycles). First, j-V curves ob-tained before and after operation show that the PV performance wasunaffected, while CVs of the MEA showed a slight degradation of∼50 mV (Figure 11a). A comparison of the peak current densities at 1sun across the steady state and diurnal tests (Figure S7a and b, FigureS8b) also show that the electrical current did not degrade over the 182hours. Furthermore, we analyzed the PV surface after testing withXRF which showed minimal to zero loss of functional components asa result of cell operation (Figure 11b).
Summary
Photoelectrochemical cells have long been tested in liquid elec-trolyte, where they suffer from short durability due to exposure ofthe PV to the liquid electrolyte. The membrane-electrode-assembly(MEA) style PEC cell presented herein is a deviation from thatparadigm as a solid electrolyte is used with a vapor feed which reducesthe amount of liquid and electrolyte contact with the PV, therefore of-fering the ability to prolong the life of the PEC. While in this studycommercial III-V semiconductors were used in order to optimize,characterize and demonstrate the testbed itself, any PEC photoanode,or photocathode or both could be used if they are transparent. Wedemonstrate the durability of the electrochemical components whichunder liquid and vapor conditions in PV-E mode resulted in a STHefficiency of 12% and a durability of at least 100 hours using loadingsthat are lower compared with a commercial PEM electrolyzer basedPV-E system (0.4 mg cm−2 vs. 3–5 mg cm−2 respectively) whichwould operate at a STH efficiency of 16% under the same conditions.
Under PEC operating conditions with either liquid or vapor feed oper-ation the STH efficiency is reduced to below 7.5% due to obstructionof light to the PV through cell components. Durability suffers as welldue to exposure of the PEC to water; under bulk liquid and dual (anodeand cathode) vapor feed operation the device lifetime was reduced to24 hours, while under anode-only vapor operation the PEC slowlydegraded over 100 hours. We finally demonstrated the use of a bar-rier coating on the cell which resulted in a stable STH efficiency of7.5% during 182 hours of combined steady state and diurnal testingwithout any sign of PV degradation. Important conclusions of thisstudy included our findings that PV exposure to water must be mini-mized, and that minimizing water drag between the anode and cathodecould be achieved by operating the device in mass transport-limitedregimes.
Acknowledgments
The authors gratefully acknowledge research support from both:Joint Center for Artificial Photosynthesis (JCAP), a DOE Energy In-novation Hub, supported through the Office of Science of the U. S.Department of Energy under Award Number DE-SC0004993 and theHydroGEN Advanced Water Splitting Materials Consortium, estab-lished as part of the Energy Materials Network under the U. S. Depart-ment of Energy, Office of Energy Efficiency and Renewable Energy,Fuel Cell Technologies Office, under Contract Number DE-AC02-05CH11231. The work performed by JCAP consisted of generatingthe device conceptualization, proof of concept and catalyst devel-opment. The work performed under HydroGEN consisted of devicefabrication, optimization, device characterization and failure analysis.Initial laser cutting experiments were supported by COMPRES, theConsortium for Materials Properties Research in Earth Sciences un-der NSF Cooperative Agreement EAR 11-57758. Authors gratefullyacknowledge Frances Houle for guidance, insights and assistance inmanuscript preparation.
ORCID
Tobias A. Kistler https://orcid.org/0000-0001-6458-8024Adam Z. Weber https://orcid.org/0000-0002-7749-1624
References
1. S. Almosni, A. Delamarre, Z. Jehl, D. Suchet, L. Cojocaru, M. Giteau, B. Behaghel,A. Julian, C. Ibrahim, L. Tatry, H. Wang, T. Kubo, S. Uchida, H. Segawa,N. Miyashita, R. Tamaki, Y. Shoji, K. Yoshida, N. Ahsan, K. Watanabe, T. Inoue,M. Sugiyama, Y. Nakano, T. Hamamura, T. Toupance, C. Olivier, S. Chambon,
) unless CC License in place (see abstract). ecsdl.org/site/terms_use address. Redistribution subject to ECS terms of use (see 129.187.254.46Downloaded on 2019-11-04 to IP

H3028 Journal of The Electrochemical Society, 166 (5) H3020-H3028 (2019)
L. Vignau, C. Geffroy, E. Cloutet, G. Hadziioannou, N. Cavassilas, P. Rale, A. Cattoni,S. Collin, F. Gibelli, M. Paire, L. Lombez, D. Aureau, M. Bouttemy, A. Etcheberry,Y. Okada, and J.-F. Guillemoles, Sci. Technol. Adv. Mater., 19, 336 (2018).
2. M. Gul, Y. Kotak, and T. Muneer, Energy Explor. Exploit., 34, 485 (2016).3. N. Danilovic, K. E. Ayers, C. Capuano, J. N. Renner, L. Wiles, and M. Pertoso, ECS
Trans., 75, 395 (2016).4. B. Pivovar, N. Rustagi, and S. Satyapal, Electrochem. Soc. Interface, 27, 47
(2018).5. A. J. Bard and M. A. Fox, Acc. Chem. Res., 28, 141 (1995).6. B. A. Pinaud, J. D. Benck, L. C. Seitz, A. J. Forman, Z. Chen, T. G. Deutsch,
B. D. James, K. N. Baum, G. N. Baum, S. Ardo, H. Wang, E. Miller, andT. F. Jaramillo, Energy Environ. Sci., 6, 1983 (2013).
7. J. Jia, L. C. Seitz, J. D. Benck, Y. Huo, Y. Chen, J. W. D. Ng, T. Bilir, J. S. Harris,and T. F. Jaramillo, Nat. Commun., 7, 13237 (2016).
8. J. W. Ager, M. R. Shaner, K. A. Walczak, I. D. Sharp, and S. Ardo, Energy Environ.Sci., 8, 2811 (2015).
9. M. A. Modestino and S. Haussener, Annu. Rev. Chem. Biomol. Eng., 6, 13 (2015).10. O. Khaselev and J. A. Turner, Science, 280, 425 (1998).11. R. C. Kainthla, B. Zelenay, and J. O. Bockris, J. Electrochem. Soc., 134, 841
(1987).12. M. R. Shaner, K. T. Fountaine, S. Ardo, R. H. Coridan, H. A. Atwater, and
N. S. Lewis, Energy Environ. Sci., 7, 779 (2014).13. C. Liu, J. Tang, H. M. Chen, B. Liu, and P. Yang, Nano Lett., 13, 2989 (2013).14. H. Mettee, J. W. Otvos, and M. Calvin, Sol. Energy Mater., 4, 443 (1981).15. K. A. Walczak, G. Segev, D. M. Larson, J. W. Beeman, F. A. Houle, and I. D. Sharp,
Adv. Energy Mater., 1602791 (2017).
16. M. M. May, H.-J. Lewerenz, D. Lackner, F. Dimroth, and T. Hannappel, Nat. Com-mun., 6, 8286 (2015).
17. E. Verlage, S. Hu, R. Liu, R. J. Jones, K. Sun, C. Xiang, N. S. Lewis, andH. A. Atwater, Energy Environ. Sci., 8, 3166 (2015).
18. M. A. Modestino, M. Dumortier, S. M. H. Hashemi, S. Haussener, C. Moser, andD. Psaltis, Lab. Chip, 15, 2287 (2015).
19. C. Xiang, Y. Chen, and N. S. Lewis, Energy Environ. Sci., 6, 3713 (2013).20. S. Kumari, R. T. White, B. Kumar, and J. M. Spurgeon, Energy Environ. Sci., 9, 1725
(2016).21. G. Heremans, C. Trompoukis, N. Daems, T. Bosserez, I. F. J. Vankelecom,
J. A. Martens, and J. Ronge, Sustain. Energy Fuels, 1, 2061 (2017).22. M. Carmo, D. L. Fritz, J. Mergel, and D. Stolten, Int. J. Hydrog. Energy, 38, 4901
(2013).23. AzurSpace http://www.azurspace.com/index.php/en/products/products-special.24. M. Bernt and H. A. Gasteiger, J. Electrochem. Soc., 163, F3179 (2016).25. A. Atifi, H. Mounir, and A. El Marjani, in Renewable and Sustainable Energy Con-
ference (IRSEC), 2014 International, p. 907, IEEE (2014).26. R. Borup, J. Meyers, B. Pivovar, Y. S. Kim, R. Mukundan, N. Garland, D. Myers,
M. Wilson, F. Garzon, and D. Wood, Chem. Rev., 107, 3904 (2007).27. R. O’Hayre, S.-J. Lee, S.-W. Cha, and F. B. Prinz, J. Power Sources, 109, 483
(2002).28. D. J. Aiken, Prog. Photovolt. Res. Appl., 8, 563 (2000).29. K. A. Walczak, J. W. Beeman, and I. D. Sharp, (2018) https://patents.google.com/
patent/WO2018017320A1.30. S. Hu, N. S. Lewis, J. W. Ager, J. Yang, J. R. McKone, and N. C. Strandwitz, J. Phys.
Chem. C, 119, 24201 (2015).
) unless CC License in place (see abstract). ecsdl.org/site/terms_use address. Redistribution subject to ECS terms of use (see 129.187.254.46Downloaded on 2019-11-04 to IP