jessica e garb rosemary g gillespie department of
TRANSCRIPT

Molecular Ecology (2009) 18, 1746–1764 doi: 10.1111/j.1365-294X.2009.04125.x
© 2009 Blackwell Publishing Ltd
Blackwell Publishing LtdDiversity despite dispersal: colonization history and phylogeography of Hawaiian crab spiders inferred from multilocus genetic data
JESSICA E . GARB and ROSEMARY G . GILLESPIEDepartment of Environmental Science Policy and Management, University of California, Berkeley, 137 Mulford Hall, Berkeley, CA 94720-3114, USA
Abstract
The Hawaiian archipelago is often cited as the premier setting to study biological diver-sification, yet the evolution and phylogeography of much of its biota remain poorlyunderstood. We investigated crab spiders (Thomisidae, Mecaphesa) that demonstratecontradictory tendencies: (i) dramatic ecological diversity within the Hawaiian Islands, and(ii) accompanying widespread distribution of many species across the archipelago. We usedmitochondrial and nuclear genetic data sampled across six islands to generate phylogenetichypotheses for Mecaphesa species and populations, and included penalized likelihoodmolecular clock analyses to estimate arrival times on the different islands. We foundthat 17 of 18 Hawaiian Mecaphesa species were monophyletic and most closely related tothomisids from the Marquesas and Society Islands. Our results indicate that the Hawaiianspecies evolved from either one or two colonization events to the archipelago. Estimateddivergence dates suggested that thomisids may have colonized the Hawaiian Islands asearly as ~10 million years ago, but biogeographic analyses implied that the initial diver-sification of this group was restricted to the younger island of Oahu, followed by back-colonizations to older islands. Within the Hawaiian radiation, our data revealed severalwell-supported genetically distinct terminal clades corresponding to species previouslydelimited by morphological taxonomy. Many of these species are codistributed acrossmultiple Hawaiian Islands and some exhibit genetic structure consistent with stepwisecolonization of islands following their formation. These results indicate that dispersal hasbeen sufficiently limited to allow extensive ecological diversification, yet frequent enoughthat interisland migration is more common than speciation.
Keywords: Hawaii, mitochondrial DNA, nuclear DNA, phylogeny, phylogeography, Thomisidae
Received 25 October 2008; revision received 17 January 2009; accepted 26 January 2009
Introduction
Oceanic islands formed de novo, such as those producedby volcanic activity, accumulate biological diversity solelyby colonization and subsequent within- or between-islanddiversification (Gillespie & Roderick 2002; Whittaker &Fernández-Palacios 2007). The relative importance of theseevolutionary processes is largely determined by an island’sdegree of isolation. Situated approximately 3200 km fromthe nearest continent, the Hawaiian archipelago is the
world’s most isolated landmass, with natural colonizationbeing rare and restricted to organisms possessingexceptional dispersal capabilities (Gressitt 1956). Thisisolation appears to have provided available ‘ecologicalopportunity’ for the limited number of organisms thatsuccessfully colonized and established populations withinthe remote Hawaiian archipelago (Carlquist 1974). Theecological opportunity in turn has allowed some successfulcolonists to undergo lineage diversification in associationwith adaptive divergence of morphological traits thatpermit the descendents to exploit a variety of resources(Schluter 2000; Gillespie et al. 2001). Consequently, assem-blages of closely related, yet phenotypically and ecologicallydiverse, species dominate the archipelago, as illustrated by
Correspondence: Jessica E. Garb, Department of Neurobiology,University of Arizona, Rm 611, Gould-Simpson Bldg, 1040 E.4th Street, Tucson, AZ 85721, USA, Fax: 520-621-8282; E-mail:[email protected]

P H Y L O G E O G R A P H Y O F H AWA I I A N C R A B S P I D E R S 1747
© 2009 Blackwell Publishing Ltd
the spectacular radiations of Hawaiian drosophilid flies(O’Grady & DeSalle 2008), drepanidine honeycreepers(Tarr & Fleischer 1995), silverswords (Baldwin & Robichaux1995), achatinelline tree snails (Holland & Hadfield 2004),and Tetragnatha spiders (Gillespie 2004).
A variety of geological processes have caused theHawaiian archipelago to become richly dissected bygeographic boundaries, such that lineage splitting is alsostrongly influenced by repeated colonization or vicarianceevents within and across islands (Funk & Wagner 1995;Vandergast et al. 2004). Islands of the archipelago beganforming in an assembly-line manner approximately 70million years ago at a fixed volcanic plume or ‘hot spot’(Clague 1996). As the Pacific tectonic plate moves north-westward, magma extruded at the hot spot repeatedlyproduces new islands (Fig. 1). Because of their sequentialarrangement the Hawaiian Islands provide a temporalframework for investigating consecutive stages of evolution,a general premise being that islands are successivelycolonized in a stepping-stone fashion following their
formation, resulting in a phylogeographic pattern termedthe ‘progression rule’ (Funk & Wagner 1995). The availabilityof known ages of the Hawaiian Islands, obtained frompotassium-argon dating (e.g. Clague 1996), also suppliestime ranges for estimating colonization dates and speciationrates from phylogenetic hypotheses (Fleischer et al. 1998;Hormiga et al. 2003; Jordan et al. 2003).
The present study examines evolutionary relationshipsamong Hawaiian crab spiders (Thomisidae), one of the fewspecies-rich spider lineages in the archipelago (Gillespieet al. 1998). Thomisids are characterized as ambush predatorsthat employ colour camouflage for substrate matching,presumably for prey capture and/or predator avoidance(Oxford & Gillespie 1998). Perhaps the best-known thomisidspecies are flower-specialists that can reversibly changetheir coloration to match different floral colours and preyon pollinating insects (Heiling et al. 2003). Although theability of individuals to change coloration has neverbeen observed in Hawaiian thomisids, a wide range ofpigmentation is exhibited across these species (e.g. green,
Fig. 1 Distributional map of the Hawaiian Mecaphesa (Thomisidae) after Suman (1970) and Garb (2003). Numbers following species namesindicate number of individuals sampled for this study from each island. Island ages as reported in Clague (1996).

1748 J . E . G A R B and R . G . GI L L E S P I E
© 2009 Blackwell Publishing Ltd
brown, white, black or yellow; Suman 1970). This inter-specific colour variation appears to reflect specializationto mimic different microhabitats. For example, certainHawaiian species are restricted to mosses, others to lichens,leaves, etc., and are cryptically coloured against thesesubstrates (Garb 2003).
Thomisid crab spiders are represented in the HawaiianIslands by 20 endemic species that occupy a complexgeographic distribution. Compared to the majority ofterrestrial lineages in which species tend to be single-islandendemics (Cowie & Holland 2008), thomisids are somewhatunusual in that ~50% of all species occur on two or moreislands (Fig. 1), implying frequent movement betweenislands. At the same time, the ranges of many speciesoverlap, with apparent coexistence of multiple species atseveral localities (Garb 2003), suggesting that dispersalhas been sufficiently restricted as to allow differentiationand adaptation (Givnish et al. 2009). Indeed, the substantialinterspecific morphological variation led earlier systematiststo assign the species to multiple genera (Simon 1900;Suman 1970). The current study addresses this puzzle byexamining the following hypotheses to explain the highdiversity yet widespread distributions of Hawaiian crabspider species: (i) species designations have been con-founded by convergence, such that species that appearto be widespread are not; (ii) thomisids have colonizedthe archipelago multiple times and several independentlyderived lineages subsequently became widespread; or(iii) thomisids have colonized the archipelago once, butintra-archipelago migration has been more frequent thanspeciation. We address these hypotheses using mitochon-drial (ribosomal 16S, tRNA leu, NADH1 and cytochromeoxidase I) and nuclear (elongation factor 1-α) genesequences densely sampled within and among species toexamine inter- and intraspecific phylogenetic relationships,genetic distance and divergence dates from relaxed molec-ular clock methods. Further, we reconstruct the ancestraldistributions of Hawaiian thomisids to infer geographicpoints of colonization and to assess the temporal sequenceimplied by estimated divergence dates.
Materials and methods
Sampling
The spider family Thomisidae comprises over 2000 speciesworldwide and has been divided into seven subfamilies,the largest being Thomisinae. The subfamily Thomisinaeagain is divided into 13 tribes, the largest being Misumenini(sensu Ono 1988), which contains 19 genera, includingMecaphesa, Misumenops, and Misumenoides. The genusMecaphesa is comprised of 48 species and is distributed inthe Hawaiian Islands (20 spp.), North and Central America(26 spp.), the Galapagos (1 sp.) and Juan Fernandez Islands
(1 sp.) (Platnick 2008). Lehtinen (1993) proposed that allHawaiian species of Mecaphesa represented an adaptiveradiation resulting from ‘explosive’ speciation in thearchipelago. Previous molecular phylogenetic studies havesupported this hypothesis of intra-archipelago radiation(Garb 1999; Garb & Gillespie 2006). However, conclusionsregarding the degree of insular radiation and interspecificrelationships were uncertain due to inadequate samplingof characters and taxa. Here, we sampled 82 specimensincluding 58 from the Hawaiian Islands, correspondingto 17 of the 20 Hawaiian Mecaphesa species (Table 1). TwoHawaiian specimens (nos137 and 705; Table 1) could not bediagnosed as any of the described species using Suman’s(1970) key and are putatively considered one or twoundescribed species. For each species, we included twoindividuals from every island where it occurs wheneverpossible. Garb & Gillespie (2006) found evidence for a closerelationship between Hawaiian Mecaphesa and Misumenopsfrom the Marquesas (1 sp.) and Society Islands (2 spp.).We included these Misumenops species and six NorthAmerican Mecaphesa species. Selection of outgroups reliedon phylogenetic hypotheses in Garb & Gillespie (2006)that included a greater diversity of thomisid species fromthe same tribe (Misumenini), and was rooted with a speciesin a different tribe (Coriarachnini sensu Ono 1988) fromthe same subfamily. Garb & Gillespie (2006) found strongsupport for Misumenops pallidus (Argentina), Misumenopsrapaensis (Austral Islands), Misumenoides formosipes (NorthAmerica) and Diaea praetexta (Tonga) being outside of theingroup taxa. These species are included as outgroupsin our analyses. For convenience, we refer to species ofMisumenops and Mecaphesa as ‘Mi.’ and ‘Me.,’ respectively.
DNA sequence data
Mitochondrial (mt) and nuclear genomic DNA wasextracted using the phenol-chloroform preparation ofPalumbi et al. (1991) or the QIAGEN DNeasy Tissue kit(QIAGEN, Inc.). Specimens were retained as vouchers in70% ethanol and deposited in the University of CaliforniaBerkeley Essig Museum of Entomology. Two fragments ofthe mitochondrial genome were amplified by polymerasechain reaction (PCR): (i) an ~820-bp section of cytochromeoxidase I (COI), and (ii) an ~600-bp fragment spanningpart of ribosomal RNA 16S, tRNA leu and NADH dehy-drogenase subunit I (henceforth referred to as 16S-ND1).Primers and conditions used to amplify these fragmentsare listed in Table 2 and detailed in Garb & Gillespie (2006).We obtained sequences of elongation factor 1-∝ (EF1-∝), anuclear protein-coding gene frequently utilized in arthropodmolecular systematics due to its conserved nature (e.g.Hedin & Maddison 2001; Magnacca & Danforth 2007).Some arthropods possess a second copy of the EF1-∝ gene(Danforth & Ji 1998). In jumping spiders (Salticidae) one

P H Y L O G E O G R A P H Y O F H AWA I I A N C R A B S P I D E R S 1749
© 2009 Blackwell Publishing Ltd
Table 1 Specimens sampled in this study, collecting locality and GenBank Accession numbers
ID no.* Species Collecting locality r16S-ND1 COI EF1-α
Hawaiian taxa 007 Mecaphesa anguliventris Kauai Island: Alakai Swamp FJ590878 FJ590772 NA024 Mecaphesa anguliventris Maui Island: West Maui, Pu’u Kukui FJ590879 FJ590773 FJ590817097 Mecaphesa anguliventris Hawaii Island: Mauna Kea, Hakalau NWR FJ590885 FJ590779 FJ590823099 Mecaphesa anguliventris Oahu Island: Waianae Mountains, Mount Ka’ala Summit DQ174333 DQ174376 FJ590824104 Mecaphesa anguliventris Hawaii Island: Mauna Kea, Hakalau NWR FJ590887 FJ590781 FJ590828112 Mecaphesa anguliventris Oahu Island: Mount Ka’ala Summit FJ590891 FJ590785 FJ590832490 Mecaphesa anguliventris Maui Island: West Maui, Pu’u Kukui FJ590910 FJ590801 FJ590855650 Mecaphesa anguliventris Kauai Island: Hono’nonapali NARS FJ590923 FJ590813 FJ590871261 Mecaphesa arida Maui Island: East Maui, Auwahi FJ590901 FJ590793 NA542 Mecaphesa arida Maui Island: East Maui, Auwahi DQ174342 DQ174385 FJ590860651 Mecaphesa arida Hawaii Island: Mount Hualalai, Pu’uwa’awa’a FJ590924 FJ590814 NA652 Mecaphesa arida Hawaii Island: Mount Hualalai, Pu’uwa’awa’a FJ590925 FJ590815 NA557 Mecaphesa baltea Maui Island: East Maui, Auwahi FJ590914 FJ590805 NA101 Mecaphesa cavata Hawaii Island: Mauna Kea DQ174334 DQ174377 FJ590825107 Mecaphesa cavata Hawaii Island: Mauna Kea FJ590888 FJ590782 FJ590829067 Mecaphesa discreta Kauai Island: Alakai Swamp FJ590881 FJ590775 FJ590819095 Mecaphesa discreta Kauai Island: Alakai Swamp DQ174332 DQ174375 FJ590822103 Mecaphesa edita Oahu Island: Mount Ka’ala Summit DQ174335 DQ174378 FJ590827111 Mecaphesa edita Oahu Island: Mount Ka’ala Summit FJ590890 FJ590784 FJ590831238 Mecaphesa facunda Hawaii Island: Mauna Loa/Mauna Kea Saddle, Kipuka 3 DQ174338 DQ174381 FJ590838613 Mecaphesa facunda Hawaii Island: Kohala Mts FJ590916 FJ590807 FJ590864263 Mecaphesa hiatus Maui Island: East Maui, Auwahi FJ590902 NA NA554 Mecaphesa hiatus Maui Island: East Maui, Auwahi DQ174343 DQ174386 FJ590862153 Mecaphesa imbricata Oahu Island: Ko’olau Mountains, Pauoa Flats DQ174337 DQ174380 FJ590836155 Mecaphesa imbricata Oahu Island: Ko’olau Mountains, Pauoa Flats FJ590895 FJ590789 FJ590837272 Mecaphesa imbricata Maui Island: West Maui, Iao Valley State Park FJ590903 FJ590794 NA348 Mecaphesa imbricata Maui Island: East Maui, Kuhiwa Valley FJ590904 FJ590795 NA536 Mecaphesa insulana Necker Island: Summit Hill FJ590913 FJ590804 FJ590858537 Mecaphesa insulana Necker Island: Summit Hill DQ174341 DQ174384 FJ590859072 Mecaphesa juncta Molokai Island: Pu’u Kolekole DQ174345 DQ174388 FJ590820043 Mecaphesa kanakana Oahu Island: Ko’olau Mountains, Wa’ahila Ridge FJ590880 FJ590774 NA102 Mecaphesa kanakana Hawaii Island: Mauna Kea FJ590886 FJ590780 FJ590826108 Mecaphesa kanakana Hawaii Island: Mauna Kea FJ590889 FJ590783 FJ590830237 Mecaphesa kanakana Kauai Island: Mount Kahili FJ590896 FJ590790 NA547 Mecaphesa kanakana Oahu Island: Ko’olau Mountains, Manoa Cliff Trail DQ174347 DQ174390 FJ590861617 Mecaphesa kanakana Maui Island: East Maui, Lower Waikamoi FJ590917 FJ590808 FJ590865618 Mecaphesa kanakana Maui Island: East Maui, Lower Waikamoi FJ590918 FJ590809 FJ590866644 Mecaphesa kanakana Kauai Island: Kokee State Park FJ590919 FJ590810 FJ590867066 Mecaphesa naevigera Maui Island: missing further information DQ174336 DQ174379 FJ590818240 Mecaphesa naevigera Kauai Island: Kokee State Park, Nualolo Trail FJ590897 NA NA241 Mecaphesa naevigera Kauai Island: Kokee State Park, Nualolo Trail FJ590898 NA NA340 Mecaphesa naevigera Oahu Island: Waianae Mountains, Pahole NARS DQ174344 DQ174387 FJ590841513 Mecaphesa naevigera Hawaii Island: Mauna Loa, Kipahoehoe NARS FJ590911 FJ590802 FJ590857582 Mecaphesa naevigera Maui Island: West Maui, Pu’u Kukui FJ590915 FJ590806 FJ590863654 Mecaphesa naevigera Oahu Island: Waianae Mountains, Pahole NARS FJ590926 NA NA068 Mecaphesa nigrofrenata Oahu Island: Waianae Mountains, Pu’upane Ridge FJ590882 FJ590776 NA074 Mecaphesa nigrofrenata Hawaii Island: Mount Hualalei FJ590883 FJ590777 NA086 Mecaphesa nigrofrenata Kauai Island: Ku’ia NARS FJ590884 FJ590778 FJ590821343 Mecaphesa nigrofrenata Hawaii Island: Mount Hualalai, Pu’uwa’awa’a DQ174340 DQ174383 FJ590842531 Mecaphesa nigrofrenata Oahu Island: Waianae Mountains, Palikea Ridge FJ590912 FJ590803 NA120 Mecaphesa perkinsi Oahu Island: Ko’olau Mountains,Wa’ahila Ridge FJ590892 FJ590786 FJ590833132 Mecaphesa perkinsi Oahu Island: Waianae Mountains, Mokule’ia Trail FJ590893 FJ590787 FJ590834500 Mecaphesa rufithorax Oahu Island: Ko’olau Mountains, Manoa Cliff Trail DQ174346 DQ174389 FJ590856645 Mecaphesa rufithorax Oahu Island: Ko’olau Mountains, Manoa Cliff Trail FJ590920 FJ590811 FJ590868245 Mecaphesa semispinosa Oahu Island: Waianae Mountains, Mount Ka’ala Summit FJ590899 FJ590791 FJ590839653 Mecaphesa semispinosa Oahu Island: Waianae Mountains, Mount Ka’ala Summit DQ174339 DQ174382 FJ590872137 Mecaphesa sp. Maui: West Maui, Mount Eke FJ590894 FJ590788 FJ590835705 Mecaphesa sp. Maui: East Maui FJ590927 FJ590816 NA

1750 J . E . G A R B and R . G . GI L L E S P I E
© 2009 Blackwell Publishing Ltd
Non-Hawaiian taxa396 Misumenops melloleitaoi Society Archipelago: Mo’orea Island FJ590906 FJ590797 FJ590845484 Misumenops melloleitaoi Society Archipelago: Mo’orea Island DQ174330 DQ174373 FJ590854369 Misumenops melloleitaoi Society Archipelago: Tahiti Island FJ590905 FJ590796 FJ590844368 Misumenops melloleitaoi Society Archipelago: Tahiti Island DQ174331 DQ174374 FJ590843460 Misumenops temihana Society Archipelago: Raiatea Island FJ590908 FJ590799 FJ590849461 Misumenops temihana Society Archipelago: Raiatea Island DQ174328 DQ174371 FJ590850701 Misumenops temihana Society Archipelago: Huahine Island DQ174329 DQ174372 NA482 Misumenops delmasi Marquesan Archipelago: Tahuata Island DQ174326 DQ174369 FJ590853408 Misumenops delmasi Marquesan Archipelago: Hiva Oa Island FJ590907 FJ590798 FJ590846412 Misumenops delmasi Marquesan Archipelago: Hiva Oa Island DQ174325 DQ174368 FJ590848473 Misumenops delmasi Marquesan Archipelago: Nuku Hiva Island FJ590909 FJ590800 FJ590851479 Misumenops delmasi Marquesan Archipelago: Nuku Hiva Island DQ174324 DQ174367 FJ590852646 Misumenops delmasi Marquesan Archipelago: Fatu Hiva Island FJ590921 FJ590812 FJ590869657 Misumenops delmasi Marquesan Archipelago: Fatu Hiva Island DQ174327 DQ174370 FJ590873647 Misumenops pallidus Argentina: Carrizo Plain DQ174354 DQ174397 FJ590870256 Mecaphesa asperata USA: South Dakota FJ590900 FJ590792 FJ590840410 Mecaphesa rothi USA: California, San Luis Obispo County DQ174348 DQ174391 FJ590847661 Mecaphesa celer USA: California, Riverside County DQ174350 DQ174393 FJ590876658 Mecaphesa importuna USA: California, San Diego County DQ174349 DQ174392 FJ590874660 Mecaphesa devia USA: California, Riverside County DQ174352 DQ174395 NA659 Mecaphesa sp. USA: California, Riverside County DQ174351 DQ174394 FJ590875076 Misumenoides formosipes USA: Maryland DQ174353 DQ174396 FJ590877649 Misumenops rapaensis Austral Archipelago: Rurutu Island FJ590922 DQ174427 NA703 Diaea praetexta Tonga: Vava’u Island DQ174365 DQ174401 NA
*Code number refers to specimen specific code catalogued in authors’ collection database; ‘NA’ indicates sequences that were not obtained due to PCR/sequencing failure.
ID no.* Species Collecting locality r16S-ND1 COI EF1-α
Table 2 Primer combinations used in this study
Locus Primer Sequence (5′–3′) Reference
Cytochrome oxidase I
LCOI 1490 (F) C1-N- 2568 (R) LCOI 2198 (R) C1-J-1718 (F) C1-N-2191 (R)
GGTCAACAAATCATAAAGATATTGG GCTACAACATAATAAGTATCATG TAAACTTCAGGGTGACCAAAAAATCA GGAGGATTTGGAAATTGATTAGTTCC GGTAAAATTAAAATATAAACTTC
Folmer et al. 1994 Hedin & Maddison 2001 Folmer et al. 1994 Simon et al. 1994 Simon et al. 1994
16S-ND1 LR-N-12945 (F) CGACCTCGATGTTGAATTAA Hedin 1997ND1Thom (R) GAGCTACTCTTCGAATTGATCC Garb & Gillespie 2006
EF1-∝ efF172 (F) GAAGAAATCAAGAAGGAAGTTTC This studyefR912 (R) CCTCAGTCAAAGCTTCATGATGC This study
F, forward; R, reverse.
Table 1 Continued
copy contains introns, while the second does not (Hedin &Maddison 2001). The latter is presumed to be nonfunc-tional because it contains premature stop codons. Wedesigned thomisid-specific primers efF172 and efR912(Table 2) to amplify a section of EF1-∝ containing two exonsflanking one intron. PCR amplification used a touch-downprotocol of 16 cycles of 30 s at 95 °C, followed by 58 °C for60 s, and 60 s at 72 °C, lowering the temperature 2 °C everythree cycles. This was followed by 18 cycles of a 95 °C at
30 s, 60 s at 42 °C, and 60 s at 72 °C. The majority ofamplified products corresponded to the intron-containingcopy of the EF1-∝, but an intron-containing and intron-lesscopy were intermittently co-amplified. The larger productwas gel-purified and directly sequenced. Occasionaldifficulties associated with direct sequencing of EF1-∝,likely due to co-amplification of length-variable alleles,required cloning. For these samples, ~5 recombinant cloneswere screened for positive inserts by PCR followed by

P H Y L O G E O G R A P H Y O F H AWA I I A N C R A B S P I D E R S 1751
© 2009 Blackwell Publishing Ltd
plasmid purification. PCR products were purified usingthe QIAquick PCR purification kit (QIAGEN, Inc.) andeach sample was sequenced in both directions. EF1-∝chromatograms directly sequenced from PCR productscontained some sites exhibiting two peaks of equivalentintensity in forward and reverse directions. Such sites wereinterpreted as heterozygous positions and were recodedusing IUPAC ambiguity codes.
Phylogenetic analyses
Sequences of the different genes were manually aligned.All protein-coding sequences were equal in length andconserved at the amino acid level, making their alignmenttrivial. 16S and tRNA leu sequences exhibited lengthvariation and included three short sections that couldnot be unambiguously aligned (31 bp in total) that wereexcluded from phylogenetic analyses. EF1-∝ intronsequences contained minimal length variability (159–168 bp) and were easily aligned except the intron fromMisumenoides formosipes, which was substantially longer(280 bp). This species’ intron was recoded as missing data,while retaining its exon sequence in analyses. For the threesequence types (16S-ND1, COI and EF1-∝) we computedpairwise uncorrected (‘p’) and maximum-likelihood (ML)corrected sequence divergence. Homogeneity of nucleotidecomposition across taxa was tested in paup* version 4.0b10(Swofford 2002) excluding invariant sites.
Phylogenetic trees were estimated using parsimonyand Bayesian methods for mitochondrial and nuclear datasets separately and combined. Heuristic parsimonysearches were performed in paup*, with 10 000 random-taxon-addition replicates of stepwise addition followedby tree-bisection and reconnection branch swapping. Allcharacters were treated as equally weighted and reversible.The mitochondrial data contained three characters withgaps, each uninformative, which were treated as missingdata. The majority of variable nuclear characters containedinformative gaps and were included as recoded presence/absence characters using the ‘simple coding’ methods ofSimmons & Ochoterena (2000). Branch support was esti-mated from 1000 bootstrap (BS) replicates and decay indices(DI) with TreeRot version 3 (Sorenson & Franzosa 2007).Substitution models for eight character partitions (1: 16S+tRNA leu; 2–4: mt codon positions 1, 2 and 3; 5–7: EF1-∝codon positions 1, 2 and 3; 8: EF1-∝ intron) were determinedby the likelihood-ratio test in ModelTest 3.7 (Posada &Crandall 1998) and implemented in Bayesian analyses withMrBayes 3.1.2 (Huelsenbeck & Ronquist 2001). Bayesiananalyses including the nuclear data also employed a binarymodel for recoded gapped characters. MrBayes runsconsisted of four chains for at least 5 × 10⁶ generations,sampling a tree every 1000 generations and continued untilsplit frequencies fell below 0.01. Clade posterior probability
values were computed from a 50% majority rule consensusof post burn-in trees. Heuristic ML tree searches wereconducted in paup* for the combined data matrix with 10random taxon addition replicates, employing one substitu-tion model. The resulting tree was used to test alternativehypotheses, by performing additional ML searches whileenforcing topological constraints. Resulting trees werecompared to the optimal tree using the S–H test (Shimo-daira & Hasegawa 1999), with full optimization and 1000bootstrap replicates.
Conflict among mitochondrial and nuclear genes wasassessed by the incongruence length difference (ILD) (Farriset al. 1994), with the partition homogeneity test imple-mented in paup*. Null distributions were created from 1000replicates, with 10 random taxon addition searches perreplicate, removing invariant characters (Cunningham1997). Trees from mitochondrial and nuclear data sets werecompared visually to identify well-supported yet conflictingnodes (i.e. supported > 0.95 PP in Bayesian trees, or BS > 70in parsimony trees) to detect areas of topological disagree-ment (Wiens 1998). For the parsimony tree(s), partitionedBremer support (PBS) values (Baker et al. 1998) were com-puted as another way to assess character conflict amongthe data.
Molecular dating
Homogeneity of nucleotide substitution rate acrosslineages was assessed by the likelihood ratio test statistic(Huelsenbeck & Rannala 1997), comparing ML scores withand without an enforced molecular clock. Node ages of theunconstrained ML tree were estimated using the programr8s (Sanderson 2003), which has been extensively utilizedto obtain divergence dates for insular radiations (e.g. Clarket al. 2008; Givnish et al. 2009). ML tree topology and branchlengths were supplied with three calibration points toscale branch lengths with time. Outgroup taxa and zero-length terminal branches of the ML tree were pruned.We conducted the cross-validation procedure in r8s forthe penalized likelihood (PL) method with the truncatedNewton algorithm over a range of values for the smoothingparameter (λ). The value of λ producing the minimumcross-validation score (lowest chi-square error) was usedas the optimal level of smoothing for penalized likelihoodestimates of node ages. We estimated uncertainty of nodeages by generating 500 bootstrapped matrices from the MLtree data using the SeqBoot program in the phylip version3.6 package (Felsenstein 2004). ML branch lengths of theoriginal topology were computed over each of the 500bootstrapped matrices in paup. The resulting 500 tree fileswith identical topology but varying branch lengths wereanalysed in r8s using optimal PL smoothing values. Meanand standard deviation of node ages were estimated in r8susing the ‘profile’ command.

1752 J . E . G A R B and R . G . GI L L E S P I E
© 2009 Blackwell Publishing Ltd
Biogeographic inference
Ancestral geographic distributions of Hawaiian taxa wereinferred at tree nodes in the combined data Bayesian treeusing stochastic mapping (SM). SM is a Bayesian methodof estimating ancestral character states that accounts forvariation in branch lengths as well as topological uncertaintyfrom trees sampled from a posterior distribution (Nielsen2002). Clark et al. (2008) compared four methods of recons-tructing ancestral ranges for insular taxa and found thatSM provided inferences that were most compatible withassumptions about Pacific geology and dispersal mediatedspeciation. We performed SM analyses using the programSIMMAP (Bollback 2006). Taxa were coded as occurringin one of the following area states: (i) North and SouthAmerica; (ii) Eastern Polynesia, i.e. Marquesas and SocietyIslands; (iii) Necker; (iv) Kauai; (v) Oahu; (vi) Maui-Nui(Maui, Lanai and Molokai); and (vii) Hawaii Island(SIMMAP is limited to seven states). A subsample of 1000post burn-in trees with branch lengths from the MrBayesanalysis was supplied as the posterior distribution oftopologies. Ancestral states were also reconstructed ontoML and parsimony topologies using maximum parsimonyin MacClade 4.0 (Maddison & Maddison 2000), with thesame coding scheme used in SIMMAP.
Results
Sequence characteristics
Mitochondrial 16S-ND1 was collected from all 82 examinedspecimens, whereas mtCOI was obtained from all but fourindividuals. Nuclear EF1-∝ was sequenced from 61 of the82 specimens, due to PCR failure with more distantlyrelated taxa or difficulties with sequencing heterozygouslength-variable introns. GenBank Accession numbers forsequences are listed in Table 1. Protein-coding genes wereconceptually translated and contained no unexpected stopcodons or length variability. blastx (www.ncbi.nlm.nih.gov/blast/) searches of these sequences against the NCBIprotein database found highest similarity to orthologuesfrom other spiders and were appropriately conserved atthe protein level. All protein-coding genes also showedgreatest variation at third sites (Table 3). Thus, we found noevidence of psuedogenes among our data.
Maximal uncorrected genetic distance (‘p’) across allsampled taxa for the mitochondrial data was 0.172 (MLestimates in Table 3), whereas the uncorrected geneticdistance EF1-∝ was 0.109. Uncorrected interspecificgenetic distance among Hawaiian species ranged between0.001 and 0.091 (average = 0.064) for the mitochondrial
Table 3 Summary statistics for aligned sequence data
Data type Sites Variable Inform. Max. dist. %A %C %G %T Bias Ti/Tv Model
mt 16S- tRNA leu 166 49 20 17.9/60.7 0.35940 0.12626 0.13259 0.38175 n.s. 1.03 K81uf + I + G
mt ND1 395 176 154 23.5/99.9 0.33519 0.12752 0.08479 0.45250 n.s. 3.31 TVM + I + GND1 1st 132 43 35 — 0.38115 0.12413 0.12422 0.37051 n.s. — HKY + GND1 2nd 132 17 14 — 0.21756 0.16450 0.10873 0.50920 n.s. — F81 + GND1 3rd 131 116 106 — 0.40736 0.09367 0.02090 0.47806 n.s. — TrN + G
mtCOI 820 292 247 13.4/40.6 0.26258 0.13089 0.18418 0.42235 n.s. 3.13 GTR + I + GCOI 1st 274 52 34 — 0.27247 0.12726 0.28995 0.31032 n.s. — TrN + GCOI 2nd 273 13 6 — 0.13430 0.25147 0.17754 0.43669 n.s. — F81 + GCOI 3rd 273 227 207 — 0.38107 0.01384 0.08464 0.52045 n.s. — TIM + G
All mtDNA 1381 517 430 17.2/62.9 0.29738 0.12926 0.14682 0.42655 n.s. 2.96 GTR + I + GEF1-∝ 523 141 66 10.9/14.5 0.27670 0.18745 0.20148 0.33437 n.s. 1.70 HKY + GEF1-∝ 1st 117 8 3 — 0.32612 0.19663 0.34087 0.13638 n.s. — F81EF1-∝ 2nd 117 8 3 — 0.26504 0.27889 0.18054 0.27552 n.s. — JCEF1-∝ 3rd 117 42 22 — 0.21316 0.19400 0.16090 0.43193 n.s. — HKYintron 172 83 38 — 0.29533 0.10976 0.14499 0.44992 n.s. — HKY
All data 1904 612 448 11.5/27.9 0.29115 0.14535 0.16287 0.40062 n.s. 2.80 GTR + I + G
mt, mitochondrial; Inform., number of informative characters; Max. dist., maximal genetic distance for data, with uncorrected (p) distance left of diagonal and maximum likelihood corrected distance to right; n.s., non-significant; mitochondrial + ef1 variable and Inform sites do not sum to ‘All data,’ as some sequences in mt analyses did not have corresponding nuclear sequence. Twenty-three recoded gapped characters from EF1-∝ intron also included in parsimony and Bayesian analysis of nuclear data (Figs S2 and S3) and combined (Figs S3 and S4) data set. Models for all mitochondrial first, second, and third codon positions were TrN + I + G, F81 + I and TIM + G, respectively.

P H Y L O G E O G R A P H Y O F H AWA I I A N C R A B S P I D E R S 1753
© 2009 Blackwell Publishing Ltd
data and 0.000–0.031 (average = 0.013) for the nuclear data.Mitochondrial intraspecific genetic distances betweenislands across Hawaiian species ranged from 0.005 (Oahuand Maui Me. kanakana) to 0.036 (Kauai and Maui Me.naevigera; Table 4). Nucleotide composition of the mito-chondrial sequences was more A/T skewed (0.72), as wasthe intron of EF1-∝ (0.74) in comparison to its exons (0.55).Tests of nonhomogeneity of base composition across taxa(uncorrected for phylogeny) were nonsignificant for allgene partitions and at each codon position within genes(Table 3).
Phylogenetic analyses
The aligned mitochondrial data comprised 1381 nucleotides,including 517 variable sites, of which 430 were parsimony-informative (Table 3). Parsimony analyses retained sixequal length trees (length = 2050, CI = 0.357, RI = 0.703). Aconsensus of these MPTs (Fig. S1, Supporting Information)recovered Hawaiian Mecaphesa as monophyletic but thisnode was not supported in the bootstrap consensus.The Hawaiian clade was sister to an Eastern PolynesianMisumenops clade (Marquesas + Society Islands). Nearlyall Hawaiian species grouped into well-supported, recipro-cally monophyletic clades, including species distributedacross multiple Hawaiian Islands. One exception wasindividuals of Me. arida from Maui, which appeared moreclosely related to sympatric Me. baltea than to Me. aridafrom Hawaii. Intraspecific relationships among speciesdistributed on multiple islands exhibited geographicstructure largely consistent with the progression rule:{Kauai [Oahu (Maui + Hawaii)]}. Relationships betweenmost of the Hawaiian species were weakly supported.Bayesian analyses of the mitochondrial data found supportfor groups that were well supported in the parsimonyanalysis but were less resolved at the poorly supportednodes (Fig. 2). Of the 18 Hawaiian Mecaphesa species, 17formed a well-supported clade (PP = 0.91), but relationshipsamong the Hawaiian species were largely unresolved.
The EF1-∝ data included 523 characters and 23 recodedgapped characters, with 164 variable sites, 82 of whichwere parsimony-informative. Parsimony analyses recov-ered 24 MPTs (L = 215), resulting in a partially resolvedconsensus (Fig. S2, Supporting Information). Despite limitedvariability, EF1-∝ had much less homoplasy (CI = 0.847,RI = 0.904) than the mitochondrial data. HawaiianMecaphesa were not monophyletic, as the Eastern PolynesianMisumenops clade was nested among the Hawaiian taxa.Strong support was found uniting the Marquesas + SocietyIslands Misumenops (BS = 94), with moderate support formonophyly of the Society Islands species (BS = 68). SomeHawaiian species that were recovered as well-supportedclades by the mitochondrial data were not monophyletic(e.g. Me. kanakana). Bayesian analyses of the EF1-∝ dataproduced a consensus topology that was nearly identical tothat found by the parsimony analysis (Fig. 3), with bettersupport for various nodes.
Partition homogeneity tests comparing the collectedmitochondrial fragments (16S-ND1 and COI) with EF1-∝indicated significant incongruence in each pairwisecomparison (16S-ND1 vs. COI =0.030; 16S-ND1 vs.EF1-∝ = 0.004; COI vs. EF1-∝ =0.001; all mtDNA vs. EF1-∝ = 0.012). Visual comparisons of well-supported nodes inthe mt and EF1-∝ trees suggested conflicting support forrelationships among a few Hawaiian species. Mitochondrialtrees strongly supported Me. imbricata + Mi. facundus(BS = 100, PP = 1.00), whereas EF1-∝ united Me. imbricatawith Me. nigrofrenata (BS = 64, PP = 0.87). Also, Me. kanakanafrom all islands was strongly supported as monophyleticin mt analyses (BS = 100, PP = 1.00), but were scattered inthe EF1-∝ trees, uniting the Maui and Hawaii populationswith different species within their respective islands.
A parsimony analysis of the combined data (1927characters, 464 parsimony-informative) found two MPTs(L = 1937, CI = 0.432, RI = 0.696). One of the two showedall Hawaiian Mecaphesa as monophyletic; the other MPTdiffered by nesting the Eastern Polynesian Misumenopsclade among the Hawaiian species (Fig. S3, Supporting
Table 4 Uncorrected pairwise mitochondrial genetic distance (‘p’) between island populations of Hawaiian thomisid species sampled frommore than one island. Minimum distance left of diagonal, maximal distance right of diagonal in cells; K, Kauai; O, Oahu; M, Maui;H, Hawaii
Species K vs. O K vs. M K vs. H O vs. M O vs. H M vs. H
Me. kanakana 0.027/0.033 0.027/0.032 0.023/0.029 0.005/0.006 0.012/0.021 0.010/0.019Me. anguliventris 0.028/0.031 0.029/0.032 0.032/0.035 0.021/0.023 0.023/0.027 0.006/0.007Me. naevigera 0.019/0.019 0.035/0.036 0.024/0.024 0.019/0.031 0.011/0.012 0.029/0.030Me. nigrofrenata 0.028/0.028 — 0.016/0.022 — 0.015/0.017 —Me. arida — — — — — 0.027/0.029Me. imbricata — — — 0.021/0.025 — —
‘—’ comparison unavailable because species does not occur or was not sampled from one or both islands.

1754 J . E . G A R B and R . G . GI L L E S P I E
© 2009 Blackwell Publishing Ltd
Fig. 2 Fifty per cent majority-rule consensus of the Bayesian posterior probability distribution of trees (post burn-in) formitochondrial (16S-ND1 + COI; 1381 characters) data. Numbers above nodes indicate posterior probabilities of clades.

P H Y L O G E O G R A P H Y O F H AWA I I A N C R A B S P I D E R S 1755
© 2009 Blackwell Publishing Ltd
Information). Marquesan and Society Island taxa formedreciprocally monophyletic groups. Each Hawaiian specieswas recovered as a well-supported monophyletic group,but most relationships between these species remained
weakly supported. Partitioned Bremer support (PBS) values(Table S1, Supporting Information) indicated conflictingnegative support from mtCOI at the node uniting Hawaiian,Marquesan and Society Island taxa (node 2, COI PBS = –4.0)
Fig. 3 Fifty per cent majority-rule consensus of the Bayesian posterior probability distribution of trees (post burn-in) for the nuclear geneEF1-∝ (523 bp + 23 gapped characters). Numbers above nodes indicate posterior probabilities of clades.

1756 J . E . G A R B and R . G . GI L L E S P I E
© 2009 Blackwell Publishing Ltd
and at the node uniting Marquesan and Society Island taxa(node 3, COI PBS = –8.7). Otherwise, PBS values weresmall when negative (i.e. > –2). Bayesian analyses of thecombined data set yielded a consensus topology (Fig.S4, Supporting Information) that was highly congruentwith the parsimony analysis showing the Marquesan+ Society Islands clade nested among the Hawaiiantaxa. Support was found for this Hawaiian + Marquesas+ Society Islands clade (PP = 1.00) as well as for themonophyly of the Society Islands taxa (PP = 0.97). MLheuristic searches of the combined data set also found atree that was extremely similar to the Bayesian consensusand parsimony trees (Fig. 4). Additional tree searchesenforcing the constraint of Hawaiian monophyly resultedin a tree score that was only slightly greater (–ln L= 12 226.03) and not significantly different from theML tree (–ln L = 12 225.46; P = 0.422).
Divergence time estimates
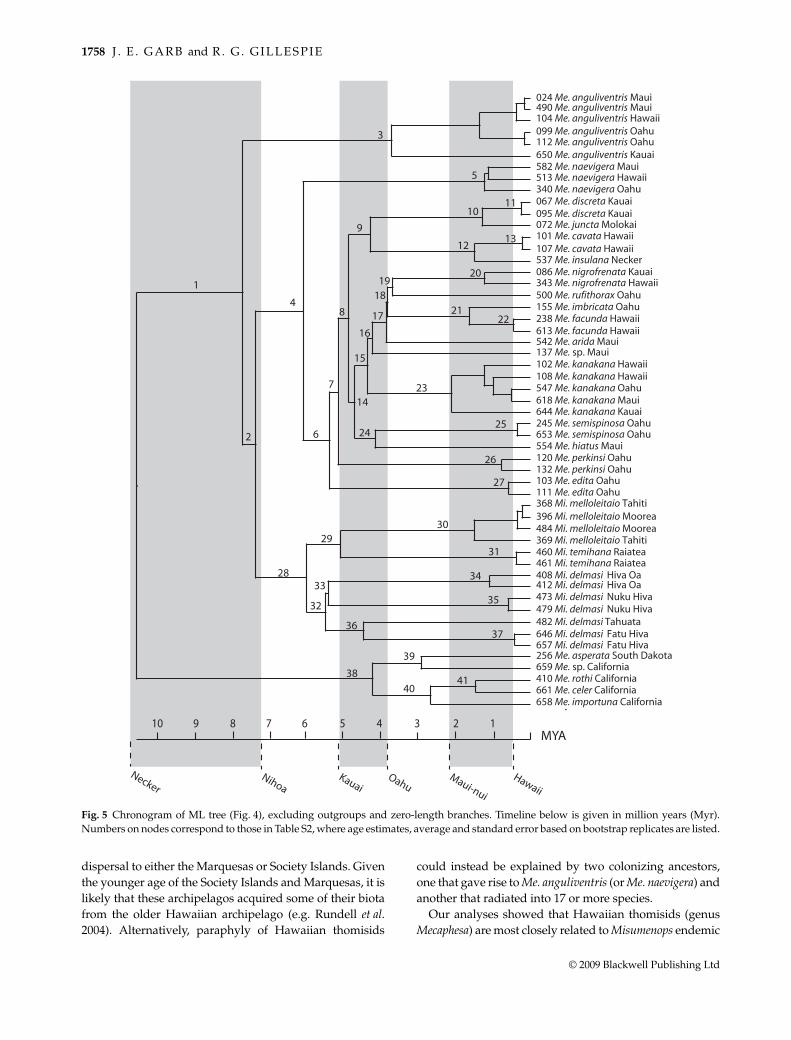
A likelihood-ratio test found the enforced clock tree to be asignificantly worse fit to the data than the unconstrainedML tree (χ2 = 96.27, d.f. = 59, P = 0.001), indicatingsubstantial rate heterogeneity among lineages. PL analysesin r8s were applied to the ML topology using maximalage constraints on three nodes (Fig. 4, nodes A, B and C).Fleischer et al. (1998) outlined assumptions underlying theuse of island ages as calibration points for moleculardating. Notably, topologies imply successive colonizationof islands in parallel with their formation and each islandpopulation formed shortly after island emergence. Diver-gences between taxa distributed on older and youngerislands (e.g. Kauai vs. Oahu + Maui + Hawaii) are thus notexpected to exceed the maximal age of the younger islands(Fleischer et al. 1998; Hormiga et al. 2003; Jordan et al. 2003).Here, node ‘A’ of Fig. 4 was constrained so as not to exceedthe maximal age of Oahu [3.7 million years (Myr); Clague1996] because relationships among island populationsof Me. anguliventris matched the progression rule, whichassumes stepwise colonization from older to youngerislands (Funk & Wagner 1995; Fleischer et al. 1998).Relationships of Hawaiian species to those from theMarquesas and the Society Islands allowed us to placetwo other maximal age constraints on the tree. The SocietyIslands and Marquesan Islands are estimated to be no olderthan 10 Myr and 6 Myr in age, respectively (White &Duncan 1996; Craig et al. 2001; Clouard & Bonneville 2005).Node ‘B’ (Fig. 4), representing the common ancestor ofsister lineages restricted to these two archipelagos, wouldnot predate 6 Myr and was constrained to this maximalage. Node ‘C’ preceding the Society Islands + MarquesanIslands clade was constrained to a maximal age of 10 Myr.PL cross-validation resulted in the minimal chi-squareerror for a smoothing value of λ = 0.025. The common
ancestor of the Polynesian thomisids (node 1, Fig. 5; TableS2, Supporting Information) dated to 7.72 ± 2.43 Myr.Geologically, this ranges from shortly after the formation ofNecker to a period roughly coincident with the emergenceof Kauai. Node 4, corresponding to the monophyleticHawaiian radiation (all Hawaiian species except Me.anguliventris), was dated to 6.08 ± 1.48 Myr. Age estimatesfor nodes representing Hawaiian speciation events suggestthat they predominately occurred prior to the origin ofMaui-Nui (originally contiguous islands of Molokai, Mauiand Lanai) ~2.2 Myr. Excepting divergences within Me.anguliventris, the earliest estimates of intraspecific diver-gence events largely dated to between 1 million and 2million years ago (Ma). The age of node ‘C’ was dated to7.36 Myr, but nodes ‘A’ and ‘B’ were pushed to theirmaximal constraints, suggesting that the resulting agesare overestimates.
Biogeographic analysis
At basal nodes of clades including Hawaiian taxa, the SManalysis assigned highest posterior probability (PP) valuesto the island of Oahu (Fig. 6; Table S3, SupportingInformation). Nodes 1 and 2 (Fig. 6), which also include theEastern Polynesian Misumenops, were resolved to Oahuwith PP values of 0.96 and 0.86, respectively. Node 4,corresponding to the monophyletic Hawaiian clade wasalso reconstructed as Oahu (PP = 0.99). Overall, theanalysis inferred that thomisids initially colonized Oahuand experienced their early diversification on this island,which was followed by numerous colonization events toboth younger and older islands (in addition to EasternPolynesia). Reconstructions suggested several instances ofcolonization from Oahu to Maui-Nui and then HawaiiIsland, but there were no pathways showing colonizationfrom Kauai or Necker to younger islands. Parsimonyreconstructions of island area onto the ML tree alsoindicated that the primary area of colonization was Oahu,whereas the parsimony trees were equivocal betweenOahu and Maui (not shown).
Discussion
Hawaiian colonization, geographic origins and age
Phylogenetic analyses of both mitochondrial and nucleardata found that 17 of the 18 sampled Hawaiian Mecaphesaspecies comprise a monophyletic group. Some analyses(i.e. mt and combined data parsimony) recoveredalternative phylogenies in which Hawaiian Mecaphesawere monophyletic. Although we did not find strongevidence for the monophyly of Hawaiian thomisids, ourresults clearly indicate that these spiders have undergonesubstantial radiation within the archipelago. Moreover, the

P H Y L O G E O G R A P H Y O F H AWA I I A N C R A B S P I D E R S 1757
© 2009 Blackwell Publishing Ltd
bulk of the lineage’s diversity could be traced to as few asone or two colonizing ancestors. A single colonizationevent would be consistent with the phylogenies in whichall Hawaiian thomisids are monophyletic as well as those
that nest the Society + Marquesas Misumenops amongHawaiian Mecaphesa (nuclear and combined Bayesian).From this paraphyletic arrangement, a single colonizationevent to Hawaii could be inferred if it was followed by
Fig. 4 Maximum-likelihood tree from combined data (1904 bp; −ln L = 12226.034) using GTR + I + G model. Model parameters are asfollows: (A–C) = 0.7864; (A–G) = 14.8955; (A–T) = 1.9500; (C–G) = 0.8267; (C–T) = 8.0336; freqA = 0.3109; freqC = 0.1290; freqG = 0.1348;freqT = 0.4254; I = 0.5151; G = 0.5217. Numbers above nodes indicate posterior probability vales for clade from Bayesian analysis,where ≥ 0.95 (see Fig. S4). Circled node ‘A’ was constrained to not exceed the maximal age of Oahu island (3.7 Myr) in penalized likelihoodr8s estimates of divergence dates. Node ‘B’ was constrained to not exceed the maximum age of the Marquesas (6 Myr), whereas node ‘C’could not exceed the maximal age of the Society Islands (10 Myr).
1758 J . E . G A R B and R . G . GI L L E S P I E
© 2009 Blackwell Publishing Ltd
dispersal to either the Marquesas or Society Islands. Giventhe younger age of the Society Islands and Marquesas, it islikely that these archipelagos acquired some of their biotafrom the older Hawaiian archipelago (e.g. Rundell et al.2004). Alternatively, paraphyly of Hawaiian thomisids
could instead be explained by two colonizing ancestors,one that gave rise to Me. anguliventris (or Me. naevigera) andanother that radiated into 17 or more species.
Our analyses showed that Hawaiian thomisids (genusMecaphesa) are most closely related to Misumenops endemic
Fig. 5 Chronogram of ML tree (Fig. 4), excluding outgroups and zero-length branches. Timeline below is given in million years (Myr).Numbers on nodes correspond to those in Table S2, where age estimates, average and standard error based on bootstrap replicates are listed.

P H Y L O G E O G R A P H Y O F H AWA I I A N C R A B S P I D E R S 1759
© 2009 Blackwell Publishing Ltd
to the Marquesas (3000 km to the south) and SocietyIslands (4400 km to the south), two archipelagos that aremost similar in distance from Hawaii to its nearest continent(3200 km). While the phylogenetic affinity between thedifferent archipelagos of Polynesia conflicts with currenttaxonomy (Lehtinen & Marusik 2008), it is a biogeographicpattern shared with other organisms (e.g. Bidens, Ganderset al. 2000; Ilex, Cuénoud et al. 2000). In a previous study,we found that the Hawaiian, Society and Marquesanthomisids were more closely related to North AmericanMecaphesa than to thomisids sampled from Western Polynesiaand Melanesia (Garb & Gillespie 2006), corroboratingLehtinen’s (1993) hypothesis of a New World origin forHawaiian thomisids. However, determining the precisecontinental or other island source of these Hawaiianspiders, as well as the sequence in which they dispersedacross Polynesia, will require additional taxonomic samplingand genetic data. Additional sampling of Mecaphesa species,particularly those from Mexico, Central America and the
West Indies (~9 spp.), the Galapagos (1 sp.) and the JuanFernandez Islands (1 sp.), as well as additional New andOld World continental Misumenops species would beespecially informative for addressing these biogeographicquestions.
A recent review of molecular age estimates suggestedthat the majority of Hawaii’s biota arrived after the forma-tion of Kauai (~5 Myr), although the archipelago hadland continuously available for colonization for the last 32Myr (Price & Clague 2002). Prior to the formation of Kauai,there was a period when the islands were smaller, low,and more widely spaced, implying a reduced frequency ofwaif dispersal from these older islands to the current highislands and suggesting that the current high islandsacquired most of their biota from sources outside of theHawaiian chain. Given that Gardner Island (16 Myr) was atone time comparable in size to Hawaii Island (Price &Clague 2002), it is nevertheless likely that islands olderthan Kauai harboured some ancestors of extant Hawaiian
Fig. 6 Ancestral island distributions recon-structed by stochastic mapping (SM) withSIMMAP. Topology derived from Bayesiananalysis of combined mitochondrial andnuclear data; thickened branches supportedby posterior probability values ≥ 0.95. Labelsabove branches indicates range at nodeswith states as follows: AM, Americas;EP, Eastern Polynesia (Marquesas and/orSociety Islands); NE, Necker; KA, Kauai;OA, Oahu; MA, Maui-Nui; HA, HawaiiIsland. Numbers below branches correspondto those in Table S3 where posteriorprobabilities of each area state are reported.

1760 J . E . G A R B and R . G . GI L L E S P I E
© 2009 Blackwell Publishing Ltd
radiations, such as drosophilids (O’Grady & DeSalle 2008)and lobeliads (Givnish et al. 2009). Our relaxed molecularclock estimates suggest that Mecaphesa spiders may havecolonized the Hawaiian archipelago as early as ~10 Ma.Because the small, older islands of Necker and Nihoacurrently support thomisid populations, it is plausiblethat these spiders established populations long beforethe emergence of Kauai. However, the lower bound ontheir ancestor’s arrival (5.29 Ma) dated to a period approxim-ately concurrent with the emergence of Kauai (Clague 1996).This recent date is more consistent with our biogeo-graphic analyses, which inferred an ancestral distributionrestricted to the island of Oahu, followed by back-colonizations to Kauai. These conflicting results are notsurprising given the strong possibility that our datamay violate certain assumptions of using island ages ascalibration points. For example, it is likely that colonizationof Oahu by Me. anguliventris occurred a substantial timeafter its emergence, resulting in an overestimate of diver-gence dates. Another source of error may be associatedwith tree topology, which is fixed in our analysis. In sometrees, all Hawaiian species were monophyletic and sisterto the Eastern Polynesian clade. If the split of these twolineages coincided with colonization of either the Marquesasor Society Islands, the entire group could not exceed 10Myr in age.
Hybridization, speciation and ecological diversification
Our mitochondrial data largely supported previoushypotheses of species boundaries for Hawaiian thomisids.An exception was found in Me. arida on Maui, which wasmore closely related to sympatric Me. baltea than to Me.arida on Hawaii. Mitochondrial sequences for Me. balteaand Me. arida from Maui were nearly identical (> 99%)raising the intriguing possibility of interspecific hybridiza-tion among sympatric species. Alternatively, the groupingof Me. baltea and Me. arida on Maui may represent anexample of recent sympatric speciation (giving rise to Me.baltea), in which morphological divergence has precededmolecular divergence at the loci sequenced. Distinguishingbetween these hypotheses will require additional samplingof nuclear data from a greater number of individuals acrossthe ranges of these two species. In contrast to the mito-chondrial data, the nuclear data did not clearly supportmorphological species boundaries in many cases. Forexample, the mitochondrial data strongly united Me.kanakana from different islands, whereas EF1-∝ showedMaui and Hawaii populations of Me. kanakana as moreclosely related to populations of other species from theirrespective islands. Discordance between the mitochondrialand nuclear data could be explained by introgression amongsympatric populations of different species. However, giventhat EF1-∝ exhibits very limited variability, it is just as
likely that the placement of Me. kanakana populations is anartefact of retained ancestral polymorphisms that have notsorted to monophyly. Again, the collection of additional,more rapidly evolving markers is needed to address thesehypotheses.
Although we found limited support for relationshipsamong the Hawaiian species, it is nevertheless clear thatcrab spiders have undergone several ecological shiftswithin the archipelago. For example, both Me. nigrofrenataand Me. arida are found in association with filamentouslichens and are colour-camouflaged against this substrate.This is an uncommon habit for thomisid spiders and thephylogenetic placement of these two species suggests thisstrategy may have evolved convergently on differentislands of the Hawaiian chain. Also nested within theHawaiian radiation is the morphologically enigmatic Me.rufithorax, which is extremely dorso-ventrally flattenedand restricted to the narrow spaces between leaves of thenative vine Freycinetia arborea on Oahu. It is likely that anumber of unknown species in the Hawaiian Mecaphesaradiation exhibiting other unique ecological strategies areyet to be found. Indeed, our data corroborate the geneticdistinctness of a putative undescribed species from Maui(specimens 137 and 705). The rich diversity of this spiderradiation, with its unique ecological specializations andcomplex distribution, contrasts with the widespreaddistribution of many of the species.
Phylogeography of widespread Hawaiian species
We proposed three hypotheses to explain the unusuallywidespread distribution of thomisid species across theHawaiian Islands. First, we hypothesized that speciesdesignations may have been confounded by convergence,such that species that appear to be widespread are not.This hypothesis predicts that species designations wouldbe inconsistent with molecular relationships becauseconvergent morphologies can repeatedly arise in replicateenvironments such as an archipelago’s islands (Losos et al.1998; Gillespie 2004). However, our mitochondrial dataidentified all but one of the widespread Hawaiian speciesdelimited by morphology (e.g. Me. kanakana, Me. anguliventris,Me. nigrofrenata, Me. naevigera, Me. imbricata) as belongingto genetically distinct reciprocally monophyletic clades.While our mitochondrial data strongly corroborate Suman’s(1970) morphological-based taxonomy and verify theexistence of multiple geographically widespread species,our nuclear data did not group all of these species intodistinct clades, possibly due to its slower evolutionary rateand retention of ancestral polymorphisms.
Our second hypothesis to explain the widespread dis-tribution of thomisid species was that these spiders havecolonized the archipelago multiple times, and several ofthese independent lineages subsequently dispersed across
P H Y L O G E O G R A P H Y O F H AWA I I A N C R A B S P I D E R S 1761
© 2009 Blackwell Publishing Ltd
multiple islands. Multiple colonization events wouldaccount for the substantial morphological and ecologicaldiversity found across Hawaiian thomisids, despite theirability to migrate between islands, which should otherwiselimit speciation and divergence. Our results show thatmultiple colonizations could play some role: Me. anguliventrismay represent an independent colonization to the archi-pelago and shows a progression down the island chain.However, most species belong to a single lineage that hasdiversified within the archipelago.
Our final hypothesis that thomisids have colonized thearchipelago once, but intra-archipelago migration has beenmore frequent than speciation, is most consistent withour data. Extensive speciation has occurred within thearchipelago, but several descendent species have sub-sequently dispersed between islands without developingmorphologically recognizable single-island endemics.Morphological cohesion across islands may be maintainedthrough recent (or ongoing) interisland migration andgene flow. Alternatively, interisland migration may havebeen more ancient such that these widespread speciesrepresent morphologically cryptic species on differentislands. Intraspecific phylogeographic patterns and geneticdistances can reveal whether this implied inter-islanddispersal was recent or more ancient. Widespread speciesthat have recently expanded their range through naturalor human-mediated movement should exhibit limitedgenetic differentiation between islands and relationshipsthat are approximately random with respect to island age.By contrast, species that have independently colonizedthe different islands shortly after their emergence shoulddisplay substantial genetic differentiation between islandsas well as relationships that mirror the progression rule.Our data mainly corroborate this latter scenario. Specifi-cally, mitochondrial phylogenies showed that intraspecificrelationships of species sampled from three or moreislands largely adhere to the progression rule, implyingthat younger islands were colonized from older ones (e.g.Me. anguliventris, Me. nigrofrenata). In addition, maximalintraspecific genetic distances between islands rangedbetween 2.5% and 3.6% (Table 4). If these distances scale toBrower’s (1994) often cited rate of arthropod mitochondrialsequence divergence (2.3% per Myr), they would suggestthat intraspecific divergence began ~1 Ma and 1.5 Ma. Ourestimates of divergence dates (although assuming theprogression rule in Me. anguliventris) similarly indicate thatdivergence between island populations occurred as earlyas ~1–2 Ma. At that time, Kauai and Oahu had alreadyemerged, Maui-Nui was in the process of forming, andHawaii did not exist (Clague 1996). Accordingly, thesedates do not support a recent spread of Mecaphesa speciesto the different Hawaiian Islands. They instead suggestthat the widespread species arose on Kauai or Oahu andindependently colonized Maui and Hawaii relatively soon
after their emergence. The intraspecific genetic differenti-ation between islands further suggests that gene flow is notongoing and that each widespread species represents acomplex of morphologically cryptic species restricted tothe different islands.
Insular taxa often evolve a diminished capacity fordispersal, as evidenced by wing loss in insects or increasedfruit and seed size in plants (Carlquist 1974). For Hawaiianspider taxa in which it has been considered, dispersal byballooning appears to be minimal or nonexistent (Gillespie& Oxford 1998; Hormiga 2002). The consequence ofreduced dispersal is higher levels of endemism and a tightcorrelation between geography and genealogy, leadingto the high prevalence of single-island endemics on thedifferent islands of the Hawaiian chain (e.g. Rundell et al.2004), and such a relationship has been shown in plantswhere decreasing dispersal ability — via wind, birds, etc. —has resulted in increasing levels of speciation, single-islandendemism and net diversification (Price & Wagner 2004;Givnish et al. 2009). The spread of multiple thomisidlineages across the different Hawaiian Islands, coupled totheir high overall species diversity, suggests that dispersalmust be severely restricted in these spiders, but frequentenough to allow occasional interisland migration. Muchresearch is still needed to understand the interplay betweendispersal and adaptive diversification that have givenrise to the rich diversity and complex distributions of thesespiders. Hawaiian crab spiders clearly provide a valuablesystem for future studies exploring the relative roles ofgeography and ecology in adaptive divergence.
Acknowledgements
We thank the following individuals: M. Arnedo, A. Bohonak,E. Claridge, B. Gagne, J. Griffin, L. Hasty, C. Hayashi, M. Heddle,M. Hedin, P. Krushelnycky, A. Lancaster, A. Mediros, C. Moreau,J.H. Mun, T. Near, G. Nishida, M. Rivera, G. Roderick, L. Shapiro,S. Swift, A. Suarez, A. Vandergast. We thank the Bernice PauahiBishop Museum, Hawaii State Department of Land and NaturalResources and the Hawaii Natural Areas Reserve System,Haleakala National Park and Volcanoes National Park and theDelegation de la Recherche in Tahiti for access to specimens.Funding was provided by the Schlinger Foundation, the U.C.Agricultural Experiment Station, and the National ScienceFoundation (DEB 0451971) to R.G.G. and a U.C. Berkeley GumpResearch Station Grant to J.E.G. N. Ayoub, N. Bailey, and M.McGowen and three anonymous reviewers provided commentson earlier drafts.
References
Baker RH, Yu X, DeSalle R (1998) Assessing the relative contribu-tion of molecular and morphological characters in simultaneousanalysis trees. Molecular Phylogenetics and Evolution, 9, 427–436.
Baldwin BG, Robichaux RH (1995) Historical biogeography andecology of the Hawaiian silversword alliance (Asteraceae).

1762 J . E . G A R B and R . G . GI L L E S P I E
© 2009 Blackwell Publishing Ltd
In: Hawaiian Biogeography: Evolution on a Hot Spot Archipelago(eds Wagner WL, Funk VA), pp. 259–287. Smithsonian InstitutionPress, Washington, D.C.
Bollback JP (2006) Stochastic character mapping of discrete traitson phylogenies. BMC Bioinformatics, 7, 88.
Brower AV (1994) Rapid morphological radiation and conver-gence among races of the butterfly Heliconious erato inferredfrom patterns of mitochondrial DNA evolution. Proceedings ofthe National Academy of Sciences, USA, 91, 6491–6495.
Carlquist S (1974) Island Biology. Columbia University Press, NewYork.
Clague DA (1996) The growth and subsidence of the Hawaiian-Emperor volcanic chain. In: The Origin and Evolution of PacificIsland Biotas, New Guinea to Eastern Polynesia: Patterns andProcesses (eds Keast A, Miller SE), pp. 35–50. SPB AcademicPublishing, Amsterdam, The Netherlands.
Clark JR, Ree RH, Alfaro ME, King MG, Wagner WL, Roalson EH(2008) A comparative study in ancestral range reconstructionmethods: retracing the uncertain histories of insular lineages.Systematic Biology, 57, 693–707.
Clouard V, Bonneville A (2005) Ages of seamounts, islands, andplateaus on the Pacific plate. The Geological Society of AmericaBulletin, 388, 71–90.
Cowie RH, Holland BS (2008) Molecular biogeography and diver-sification of the endemic terrestrial fauna of the HawaiianIslands. Philosophical Transactions of the Royal Society B: BiologicalSciences, 363, 3363–3376.
Craig DA, Currie DC, Joy DA (2001) Geographical history of thecentral-western Pacific black fly subgenus Inseliellum (Diptera:Simuliidae: Simulium) based on a reconstructed phylogeny ofthe species, hot-spot archipelagos and hydrological considera-tions. Journal of Biogeography, 28, 1101–1127.
Cuénoud PM, Del Pero Martinez A, Loizeau PA et al. (2000)Molecular phylogeny and biogeography of the genus Ilex L.(Aquifoliaceae). Annals of Botany, 85, 111–122.
Cunningham CW (1997) Can three incongruence tests predictwhen data should be combined? Molecular Biology and Evolution,14, 733–740.
Danforth BN, Ji S (1998) Elongation factor-1alpha occurs as twocopies in bees: Implications for phylogenetic analysis of EF-1alpha sequences in insects. Molecular Biology and Evolution, 15,225–235.
Farris JS, Kallersjo M, Kluge AG, Bult C (1994) Constructing asignificance test for incongruence. Systematic Biology, 44, 570–572.
Felsenstein J (2004) PHYLIP (Phylogeny Inference Package), Version 3.6.Distributed by the author, WA Department of Genomic Sciences,University of Washington, Seattle, Washington.
Fleischer RC, McIntosh CE, Tarr CL (1998) Evolution on a volcanicconveyor belt: using phylogeographic reconstructions andK-Ar-based ages of the Hawaiian Islands to estimate molecularevolutionary rates. Molecular Ecology, 7, 533–545.
Folmer O, Black M, Hoeh W, Lutz R, Vrijenhoek R (1994) DNAprimers for amplification of mitochondrial cytochrome c oxidasesubunit I from diverse metazoan invertebrates. Molecular MarineBiology and Biotechnology, 3, 294–299.
Funk VA, Wagner WL (1995) Biogeographic patterns in the HawaiianIslands. In: Hawaiian Biogeography: Evolution on a Hot Spot Archi-pelago (eds Wagner WL, Funk VA). Smithsonian Institution Press,Washington D.C.
Ganders FR, Berbee M, Pirseyedi M (2000) ITS base sequencephylogeny in Bidens (Asteraceae): evidence for the continental
relatives of Hawaiian and Marquesan Bidens. Systematic Botany,25, 122–133.
Garb JE (1999) An adaptive radiation of Hawaiian Thomisidae:Biogeographic and genetic evidence. Journal of Arachnology, 27,71–78.
Garb JE (2003) Evolutionary studies of Polynesian crab spiders(Araneae: Thomisidae) and Latrodectus spiders (Araneae: Theridiidae):phylogeny and biogeography. PhD Thesis. University of California,Berkeley, California.
Garb JE, Gillespie RG (2006) Island hopping across the centralPacific: mitochondrial DNA detects sequential colonizationof the Austral Islands by crab spiders (Araneae: Thomisidae).Journal of Biogeography, 33, 201–220.
Gillespie RG (2004) Community assembly through adaptiveradiation in Hawaiian spiders. Science, 303, 356–359.
Gillespie RG, Howarth FG, Roderick GK (2001) Adaptive radiation.In: Encyclopedia of Biodiversity (ed. Levin SA). Academic Press,New York.
Gillespie RG, Oxford GS (1998) Selection on the color poly-morphism in Hawaiian happy-face spiders: evidence from geneticstructure and temporal fluctuations. Evolution, 52, 775–783.
Gillespie RG, Rivera MJ, Garb JE (1998) Sun, surf and spiders:taxonomy and phylogeography of Hawaiian Araneae. In:Proceeding of the 17th European Colloquium of Arachnology,Edinburgh 1997 (ed. Selden PA), pp. 41–50, British ArachnologicalSociety, Burnham Beeches, Bucks, UK.
Gillespie RG, Roderick GK (2002) Arthropods on islands: coloniza-tion, speciation, and conservation. Annual Review of Entomology,47, 595–632.
Givnish TJ, Millam KC, Mast AR et al. (2009) Origin, adaptiveradiation and diversification of the Hawaiian lobeliads (Asterales:Campanulaceae). Proceedings of the Royal Society B: BiologicalScience, 276, 407–416.
Gressitt JL (1956) Some distributions patterns of Pacific islandfauna. Systematic Zoology, 5, 11–32.
Hedin MC (1997) Molecular phylogenetics at the population/species interface in cave spiders of the southern Appalachians(Araneae: Nesticidae: Nesticus). Molecular Biology and Evolution,14, 309–324.
Hedin MC, Maddison WP (2001) Phylogenetic utility and evidencefor multiple copies of elongation factor-1alpha in the spidergenus Habronattus (Araneae: Salticidae). Molecular Biology andEvolution, 18, 1512–1521.
Heiling AM, Heberstein ME, Chittka L (2003) Crab spidersmanipulate flower signals. Nature, 421, 334.
Holland BS, Hadfield MG (2004) Origin and diversification of theendemic Hawaiian tree snails (Achatinellidae: Achatinellinae)based on molecular evidence. Molecular Phylogenetics andEvolution, 32, 588–600.
Hormiga G (2002) Orsonwelles, a new genus of giant linyphiidspiders (Araneae) from the Hawaiian Islands. Invertebrate System-atics, 16, 369–448.
Hormiga G, Arnedo M, Gillespie RG (2003) Speciation on a con-veyor belt: sequential colonization of the Hawaiian Islands byOrsonwelles spiders (Araneae, Linyphiidae). Systematic Biology,52, 70–88.
Huelsenbeck JP, Rannala B (1997) Phylogenetic methods come ofage: testing hypotheses in an evolutionary context. Science, 276,227–232.
Huelsenbeck JP, Ronquist F (2001) MrBayes: Bayesian inference ofphylogenetic trees. Bioinformatics, 17, 754–755.

P H Y L O G E O G R A P H Y O F H AWA I I A N C R A B S P I D E R S 1763
© 2009 Blackwell Publishing Ltd
Jordan S, Simon C, Polhemus D (2003) Molecular systematicsand adaptive radiation of Hawaii’s endemic damselfly genusMegalagrion (Odonata: Coenagrionidae). Systematic Biology, 52,89–109.
Lehtinen PT (1993) Polynesian Thomisidae — a meeting of old andnew world groups. Memoirs of the Queensland Museum, 33, 585–591.
Lehtinen PT, Marusik YM (2008) A redefinition of Misumenops F.O. Pickard-Cambridge, 1900 (Araneae, Thomisidae) and reviewof the New World species. Bulletin of the British ArachnologicalSociety, 14, 173–198.
Losos JB, Jackman TR, Larson A, de Queiroz K, Rodriquez-SchettinoL (1998) Contingency and determinism in replicated adaptiveradiations of island lizards. Science, 279, 2115–2118.
Maddison DR, Maddison WP (2000) MacClade 4 Analysis of Phyl-ogeny and Character Evolution. Sinauer Associates, Sunderland,Massachusetts.
Magnacca KN, Danforth BN (2007) Low nuclear DNA variationsupports a recent origin of Hawaiian Hylaeus bees (Hymenoptera:Colletidae). Molecular Phylogenetics and Evolution, 43, 908–915.
Nielsen R (2002) Mapping mutations on phylogenies. SystematicBiology, 51, 729–739.
O’Grady P, DeSalle R (2008) Out of Hawaii: the origin and bio-geography of the genus Scaptomyza (Diptera: Drosophilidae).Biology Letters, 4, 195–199.
Ono H (1988) A Revisional Study of the Spider Family Thomisidae ofJapan. National Science Museum, Tokyo.
Oxford GS, Gillespie RG (1998) Evolution and ecology of spidercoloration. Annual Review of Entomology, 43, 619–643.
Palumbi SR, Martin A, Romano S et al. (1991) The Simple Fool’sGuide to PCR. Department of Zoology, University of Hawaii,Honolulu, Hawaii.
Platnick NI (2009) The World Spider Catalog, Version 9.5. AmericanMuseum of Natural History, New York. Available online at http://research.amnh.org/entomology/spiders/catalog/index.html.
Posada D, Crandall KA (1998) ModelTest: testing the model ofDNA substitution. Bioinformatics, 14, 817–818.
Price JP, Clague DA (2002) How old is the Hawaiian biota? Geologyand phylogeny suggest recent divergence. Proceedings of the RoyalSociety B: Biological Sciences, 269, 2429–2435.
Price JP, Wagner WL (2004) Speciation in Hawaiian angiospermlineages: cause, consequence, and mode. Evolution, 58, 2185–2200.
Rundell RJ, Holland BS, Cowie RH (2004) Molecular phylogenyand biogeography of the endemic Hawaiian Succineidae(Gastropoda: Pulmonata). Molecular Phylogenetics and Evolution,31, 246–255.
Sanderson MJ (2003) r8s: inferring absolute rates of molecularevolution and divergence times in absence of a molecular clock.Bioinformatics, 19, 301–302.
Schluter D (2000) The Ecology of Adaptive Radiation. Oxford UniversityPress, Oxford, UK.
Shimodaira H, Hasegawa M (1999) Multiple comparisons oflog-likelihoods with applications to phylogenetic inference.Molecular Biology and Evolution, 16, 1114–1116.
Simmons MP, Ochoterena H (2000) Gaps as characters insequence-based phylogenetic analyses. Systematic Biology, 49,369–381.
Simon E (1900) Arachnida. Fauna Hawaiiensis, 2, 443–519.Simon C, Frati F, Beckenbach A, Crespi B, Liu H, Flook P (1994)
Evolution, weighting, and phylogenetic utility of mitochondrialgene sequences and a compilation of conserved polymerase
chain reaction primers. Annals of the Entomological Society ofAmerica, 87, 651–701.
Sorenson MD, Franzosa EA (2007) TreeRot, Version 3. BostonUniversity, Boston, Massachusetts.
Suman TW (1970) Spiders of the family Thomisidae in Hawaii.Pacific Insects, 12, 773–864.
Swofford DL (2002) PAUP*. Phylogenetic Analysis Using Parsi-mony (*and Other Methods). Sinauer Associates, Sunderland,Massachusetts.
Tarr CL, Fleischer RC (1995) Evolutionary relationships of theHawaiian honeycreepers (Aves, Drepanidinae). In: HawaiianBiogeography: Evolution on a Hot Spot Archipelago (eds WagnerWL, Funk VA). Smithsonian Institution Press, Washington D.C.
Vandergast AG, Gillespie RG, Roderick GK (2004) Influence ofvolcanic activity on the population genetic structure of HawaiianTetragnatha spiders: fragmentation, rapid population growthand the potential for accelerated evolution. Molecular Ecology,13, 1729–1743.
White WM, Duncan RA (1996) Geochemistry and geochronologyof the Society Islands: new evidence for deep mantle recycling.Geophysical Monography, 95, 183–206.
Whittaker RJ, Fernández-Palacios JM (2007) Island Biogeography:Ecology, Evolution and Conservation. Oxford University Press,Oxford, UK.
Wiens JJ (1998) Combining data sets with different phylogenetichistories. Systematic Biology, 47, 568–581.
Jessica Garb is an NIH postdoctoral fellow at the University ofArizona and her current research focuses on the molecularevolution of spider silk and venom. Her PhD thesis examinedthe diversification and biogeography of Polynesian crab spiders.Rosemary Gillespie is Professor and Director of the Essig Museumof Entomology, Berkeley Natural History Museum. Her researchinterests include evolutionary and ecological processes that shapecommunities, biodiversity science, and systematics, especially spidersin the Pacific.
Supporting Information
Additional Supporting Information may be found in the onlineversion of this article:
Fig. S1 Strict consensus of the six most parsimonious treesderived from mitochondrial DNA data (16S-ND1 + COI; 1381characters, 430 parsimony informative).
Fig. S2 Strict consensus of 24 most parsimonious trees fromanalysis of nuclear protein coding gene elongation factor 1-α (EF1-α;523 bp + 23 gapped characters, 164 variable character; 82 parsi-mony informative).
Fig. S3 Phylogram of one of two most parsimonious trees fromcombined mitochondrial and nuclear data (1927 characters, 635variable, 464 parsimony informative).
Fig. S4 Fifty per cent majority rule consensus of the Bayesianposterior probability distribution of trees (post burn-in) for thecombined data analysis of nine partitions (1: 16S + tRNA leu; 2–4:mt codon positions 1,2 and 3; 5–7: EF1-α codon positions 1,2 and3; 8: EF1-α intron; 9: intron recoded gaps).

1764 J . E . G A R B and R . G . GI L L E S P I E
© 2009 Blackwell Publishing Ltd
Table S1 Bootstrap and partitioned support values for selectclades in combined parsimony analysis (Fig. S3) in comparison tobootstrap and clade posterior probability values in separate anal-yses of mitochondrial and nuclear data
Table S2 Node age for Hawaiian thomisids in millions of years.Numbers correspond to node labels in chronogram (Fig. 5), aver-age and standard error from 500 bootstrap replicates. Shaded rowsindicate nodes with support in Bayesian analyses > 0.95
Table S3 Posterior probability (PP) values of ancestral distribu-tions for each node in the combined Bayesian tree (Fig. S4) deter-mined in SIMMAP 1.0. Areas with highest values are labelled ontheir corresponding node in Fig. 6
Please note: Wiley-Blackwell are not responsible for the content orfunctionality of any supporting materials supplied by the authors.Any queries (other than missing material) should be directed tothe corresponding author for the article.