jim furey – lehman brothers small-cap strategy 1 the high productivity, low barrier era lehman...
TRANSCRIPT

1Jim Furey – Lehman Brothers Small-Cap Strategy
The High Productivity, Low Barrier EraLehman Brothers Small-Cap StrategyJames H. Furey, CFA, Managing Director
02/02/05
Lehman Brothers does and seeks to do business with companies covered in its research reports. As a result, investors should be aware that the Firm may have a conflict of interest that could affect the objectivity of this report.
Customers of Lehman Brothers in the United States can receive independent, third-party research on the company or companies covered in this report, at no cost to them, where such research is available. Customers can access this independent research at www.lehmanlive.com or can call 1-800-2-LEHMAN to request a copy of this research.
Investors should consider this report as only a single factor in making their investment decisions.
PLEASE SEE ANALYST(S) CERTIFICATION(S) AND IMPORTANT DISCLOSURES BEGINNING ON PAGE 37

02/02/05 2Jim Furey – Lehman Brothers Small-Cap Strategy
Today’s “Small” Talking Points
The “High Productivity, Low Barrier Era” and Its Effects on Small-Caps.
Is the Small-Cap Cycle Over?
Our Approach to Small-Cap Decision-Making

3Jim Furey – Lehman Brothers Small-Cap Strategy
High Productivity, Low Barrier Era

02/02/05 4Jim Furey – Lehman Brothers Small-Cap Strategy
The High Productivity, Low Barrier Era What is the “High Productivity, Low Barrier Era”?
The Digital Revolution still defines our time.
Era of Unintended Consequences
Portfolio Manager “DNA” must change: Sector Performance in Up & Down Markets Seasonality

02/02/05 5Jim Furey – Lehman Brothers Small-Cap Strategy
High Productivity, Low Barrier Era “Digital Revolution” still defines our time but
unintended consequences exist and are the key to investing success
Connecting the disparate dots…
Fiscal and monetary policy,
High cash on the balance sheet,
Rapidly rising commodity prices,
China’s emergence as a global economic force
Outsourcing appeal and political backlash,
Poor technology stock market returns,
Loss of value by traditional broadcast and radio.
High bond prices and low yields,
Reticence to hire and spend capital,
Rising real estate prices,
Why China’s growth is the envy and worry of the world,
Weak US dollar,
Technology’s multiple compression,
Financials, Industrials, Materials, Energy, Utilities strength.

02/02/05 6Jim Furey – Lehman Brothers Small-Cap Strategy
Small-Cap Portfolio Manager DNA
Cons. Cons. Health Info. Telco.Dscr. Stpls. Energy Fin. Care Ind. Tech. Mat. Srvc. Util. R2000
Average Nominal Return 9.5 7.5 7.1 8.1 11.2 8.7 13.0 7.9 12.3 6.0 9.3
Average Relative Return 0.2 -1.9 -2.3 -1.2 1.8 -0.6 3.7 -1.4 3.0 -3.4 0.0
# of Positive Nominal Quarters 45 48 34 45 44 49 45 46 44 48 52
% of Positive Nominal Quarters 87% 92% 65% 87% 85% 94% 87% 88% 85% 92% 100%
# of Outperforming Quarters 27 25 25 21 30 22 31 16 33 13 NA
% of Outperforming Quarters 52% 48% 48% 40% 58% 42% 60% 31% 63% 25% NA
Rank 4 9 10 7 3 6 1 8 2 11 5
…this sector had the following statistics:
Whe
n th
e R2
000 h
ad
positiv
e no
min
al
qua
rterly
ret
urns
…
When R2000 had positive nominal returns…
Analysis of Sector Statistics in a Rising Small-Cap Market (1Q85 to 4Q04)
Analysis of Sector Statistics in a Declining Small-Cap Market (1Q85 to 4Q04)
Cons. Cons. Health Info. Telco.Dscr. Stpls. Energy Fin. Care Ind. Tech. Mat. Srvc. Util. R2000
Average Nominal Return -8.2 -4.5 -4.2 -3.6 -9.2 -7.5 -13.1 -5.9 -13.0 -1.4 -7.7
Average Relative Return -0.4 3.3 3.5 4.2 -1.5 0.2 -5.3 1.9 -5.2 6.3 0.0
# of Negative Quarters 24 16 17 19 26 25 23 21 22 20 28
% of Negative Quarters 86% 57% 61% 68% 93% 89% 82% 75% 79% 71% 100%
# of Outperforming Quarters 10 20 16 20 9 15 8 16 10 24 NA
% of Outperforming Quarters 36% 71% 57% 71% 32% 54% 29% 57% 36% 86% NA
Rank 8 4 3 2 9 6 11 5 10 1 7
…this sector had the following statistics:
Whe
n th
e R2
000 h
ad
negativ
e no
min
al
qua
rterly
ret
urns
…
When R2000 had negative nominal returns…
Source: Lehman Brothers and FactSet
Source: Lehman Brothers and FactSet
02/02/05 7Jim Furey – Lehman Brothers Small-Cap Strategy
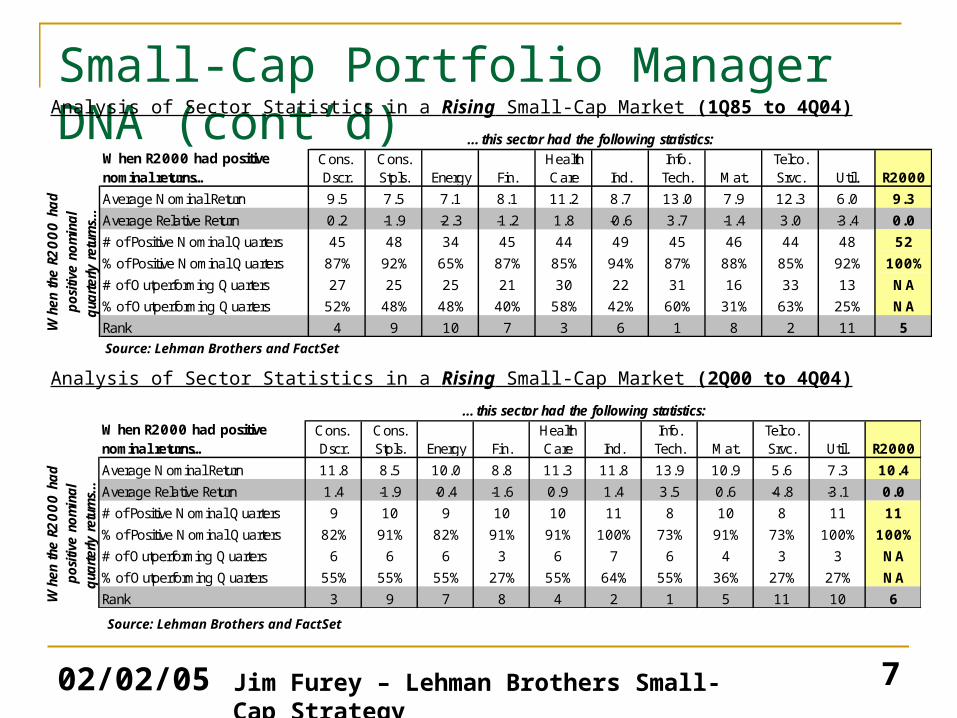
Small-Cap Portfolio Manager DNA (cont’d)
Cons. Cons. Health Info. Telco.Dscr. Stpls. Energy Fin. Care Ind. Tech. Mat. Srvc. Util. R2000
Average Nominal Return 9.5 7.5 7.1 8.1 11.2 8.7 13.0 7.9 12.3 6.0 9.3
Average Relative Return 0.2 -1.9 -2.3 -1.2 1.8 -0.6 3.7 -1.4 3.0 -3.4 0.0
# of Positive Nominal Quarters 45 48 34 45 44 49 45 46 44 48 52
% of Positive Nominal Quarters 87% 92% 65% 87% 85% 94% 87% 88% 85% 92% 100%
# of Outperforming Quarters 27 25 25 21 30 22 31 16 33 13 NA
% of Outperforming Quarters 52% 48% 48% 40% 58% 42% 60% 31% 63% 25% NA
Rank 4 9 10 7 3 6 1 8 2 11 5
…this sector had the following statistics:
Whe
n th
e R2
000 h
ad
positiv
e no
min
al
qua
rterly
ret
urns
…
When R2000 had positive nominal returns…
Analysis of Sector Statistics in a Rising Small-Cap Market (1Q85 to 4Q04)
Analysis of Sector Statistics in a Rising Small-Cap Market (2Q00 to 4Q04)
Cons. Cons. Health Info. Telco.Dscr. Stpls. Energy Fin. Care Ind. Tech. Mat. Srvc. Util. R2000
Average Nominal Return 11.8 8.5 10.0 8.8 11.3 11.8 13.9 10.9 5.6 7.3 10.4
Average Relative Return 1.4 -1.9 -0.4 -1.6 0.9 1.4 3.5 0.6 -4.8 -3.1 0.0
# of Positive Nominal Quarters 9 10 9 10 10 11 8 10 8 11 11
% of Positive Nominal Quarters 82% 91% 82% 91% 91% 100% 73% 91% 73% 100% 100%
# of Outperforming Quarters 6 6 6 3 6 7 6 4 3 3 NA
% of Outperforming Quarters 55% 55% 55% 27% 55% 64% 55% 36% 27% 27% NA
Rank 3 9 7 8 4 2 1 5 11 10 6
…this sector had the following statistics:
Whe
n th
e R2
000 h
ad
pos
itive
nom
inal
qua
rterly
ret
urns
…
When R2000 had positive nominal returns…
Source: Lehman Brothers and FactSet
Source: Lehman Brothers and FactSet

02/02/05 8Jim Furey – Lehman Brothers Small-Cap Strategy
Small-Cap Portfolio Manager DNA (cont’d)Analysis of Sector Statistics in a Declining Small-Cap Market (1Q85 to 4Q04)
Analysis of Sector Statistics in a Declining Small-Cap Market (2Q00 to 4Q04)
Cons. Cons. Health Info. Telco.Dscr. Stpls. Energy Fin. Care Ind. Tech. Mat. Srvc. Util. R2000
Average Nominal Return -8.2 -4.5 -4.2 -3.6 -9.2 -7.5 -13.1 -5.9 -13.0 -1.4 -7.7
Average Relative Return -0.4 3.3 3.5 4.2 -1.5 0.2 -5.3 1.9 -5.2 6.3 0.0
# of Negative Quarters 24 16 17 19 26 25 23 21 22 20 28
% of Negative Quarters 86% 57% 61% 68% 93% 89% 82% 75% 79% 71% 100%
# of Outperforming Quarters 10 20 16 20 9 15 8 16 10 24 NA
% of Outperforming Quarters 36% 71% 57% 71% 32% 54% 29% 57% 36% 86% NA
Rank 8 4 3 2 9 6 11 5 10 1 7
…this sector had the following statistics:
Whe
n th
e R2
000 h
ad
negativ
e no
min
al
qua
rterly
ret
urns
…
When R2000 had negative nominal returns…
Cons. Cons. Health Info. Telco.Dscr. Stpls. Energy Fin. Care Ind. Tech. Mat. Srvc. Util. R2000
Average Nominal Return -7.1 -1.8 -2.8 0.8 -9.3 -7.0 -24.3 -5.2 -24.1 -2.4 -9.4
Average Relative Return 2.3 7.6 6.6 10.2 0.1 2.4 -14.9 4.2 -14.8 7.0 0.0
# of Negative Quarters 6 3 5 4 7 6 8 5 7 6 8
% of Negative Quarters 75% 38% 63% 50% 88% 75% 100% 63% 88% 75% 100%
# of Outperforming Quarters 3 6 6 8 4 6 1 5 1 8 NA
% of Outperforming Quarters 38% 75% 75% 100% 50% 75% 13% 63% 13% 100% NA
Rank 7 2 4 1 8 6 11 5 10 3 9
When R2000 had negative nominal returns…
…this sector had the following statistics:
Whe
n th
e R2
000 h
ad
negativ
e no
min
al
qua
rterly
ret
urns
…
Source: Lehman Brothers and FactSet
Source: Lehman Brothers and FactSet
02/02/05 9Jim Furey – Lehman Brothers Small-Cap Strategy
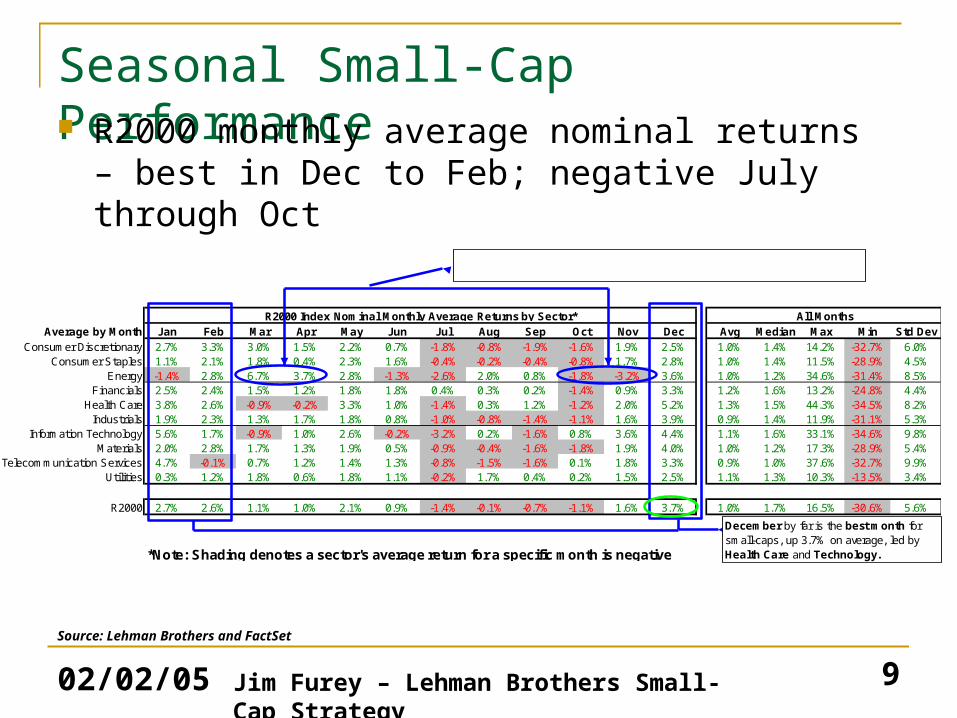
Seasonal Small-Cap Performance
Average by Month Jan Feb Mar Apr May Jun Jul Aug Sep Oct Nov Dec Avg Median Max Min Std DevConsumer Discretionary 2.7% 3.3% 3.0% 1.5% 2.2% 0.7% -1.8% -0.8% -1.9% -1.6% 1.9% 2.5% 1.0% 1.4% 14.2% -32.7% 6.0%
Consumer Staples 1.1% 2.1% 1.8% 0.4% 2.3% 1.6% -0.4% -0.2% -0.4% -0.8% 1.7% 2.8% 1.0% 1.4% 11.5% -28.9% 4.5%Energy -1.4% 2.8% 6.7% 3.7% 2.8% -1.3% -2.6% 2.0% 0.8% -1.8% -3.2% 3.6% 1.0% 1.2% 34.6% -31.4% 8.5%
Financials 2.5% 2.4% 1.5% 1.2% 1.8% 1.8% 0.4% 0.3% 0.2% -1.4% 0.9% 3.3% 1.2% 1.6% 13.2% -24.8% 4.4%Health Care 3.8% 2.6% -0.9% -0.2% 3.3% 1.0% -1.4% 0.3% 1.2% -1.2% 2.0% 5.2% 1.3% 1.5% 44.3% -34.5% 8.2%
Industrials 1.9% 2.3% 1.3% 1.7% 1.8% 0.8% -1.0% -0.8% -1.4% -1.1% 1.6% 3.9% 0.9% 1.4% 11.9% -31.1% 5.3%Information Technology 5.6% 1.7% -0.9% 1.0% 2.6% -0.2% -3.2% 0.2% -1.6% 0.8% 3.6% 4.4% 1.1% 1.6% 33.1% -34.6% 9.8%
Materials 2.0% 2.8% 1.7% 1.3% 1.9% 0.5% -0.9% -0.4% -1.6% -1.8% 1.9% 4.0% 1.0% 1.2% 17.3% -28.9% 5.4%Telecommunication Services 4.7% -0.1% 0.7% 1.2% 1.4% 1.3% -0.8% -1.5% -1.6% 0.1% 1.8% 3.3% 0.9% 1.0% 37.6% -32.7% 9.9%
Utilities 0.3% 1.2% 1.8% 0.6% 1.8% 1.1% -0.2% 1.7% 0.4% 0.2% 1.5% 2.5% 1.1% 1.3% 10.3% -13.5% 3.4%
R2000 2.7% 2.6% 1.1% 1.0% 2.1% 0.9% -1.4% -0.1% -0.7% -1.1% 1.6% 3.7% 1.0% 1.7% 16.5% -30.6% 5.6%
*Note: Shading denotes a sector's average return for a specific month is negative
R2000 Index Nominal Monthly Average Returns by Sector* All Months
December by far is the best month for small-caps, up 3.7% on average, led by Health Care and Technology.
Energy's best performance occurs in March & April; Energy's worst months are October & November.
R2000 monthly average nominal returns – best in Dec to Feb; negative July through Oct
Source: Lehman Brothers and FactSet
02/02/05 10Jim Furey – Lehman Brothers Small-Cap Strategy
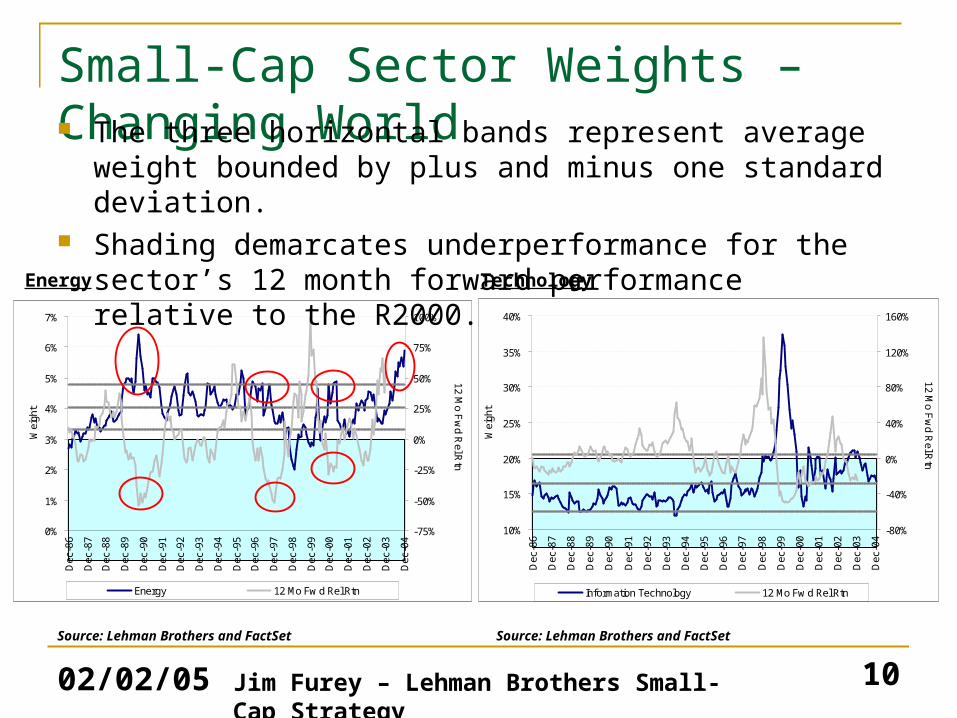
Small-Cap Sector Weights – Changing World
WEIGHT PROFILESector Decile
vs. Self History
BEARISH
0%
1%
2%
3%
4%
5%
6%
7%
Dec
-86
Dec
-87
Dec
-88
Dec
-89
Dec
-90
Dec
-91
Dec
-92
Dec
-93
Dec
-94
Dec
-95
Dec
-96
Dec
-97
Dec
-98
Dec
-99
Dec
-00
Dec
-01
Dec
-02
Dec
-03
Dec
-04
Wei
ght
-75%
-50%
-25%
0%
25%
50%
75%
100%
12 Mo F
wd R
el Rtn
Energy 12 Mo Fw d Rel Rtn
WEIGHT PROFILESector Decile
vs. Self History
No Signal
10%
15%
20%
25%
30%
35%
40%
Dec
-86
Dec
-87
Dec
-88
Dec
-89
Dec
-90
Dec
-91
Dec
-92
Dec
-93
Dec
-94
Dec
-95
Dec
-96
Dec
-97
Dec
-98
Dec
-99
Dec
-00
Dec
-01
Dec
-02
Dec
-03
Dec
-04
Wei
ght
-80%
-40%
0%
40%
80%
120%
160%
12 Mo F
wd R
el Rtn
Information Technology 12 Mo Fw d Rel Rtn
The three horizontal bands represent average weight bounded by plus and minus one standard deviation.
Shading demarcates underperformance for the sector’s 12 month forward performance relative to the R2000.
Energy Technology
Source: Lehman Brothers and FactSet Source: Lehman Brothers and FactSet

11Jim Furey – Lehman Brothers Small-Cap Strategy
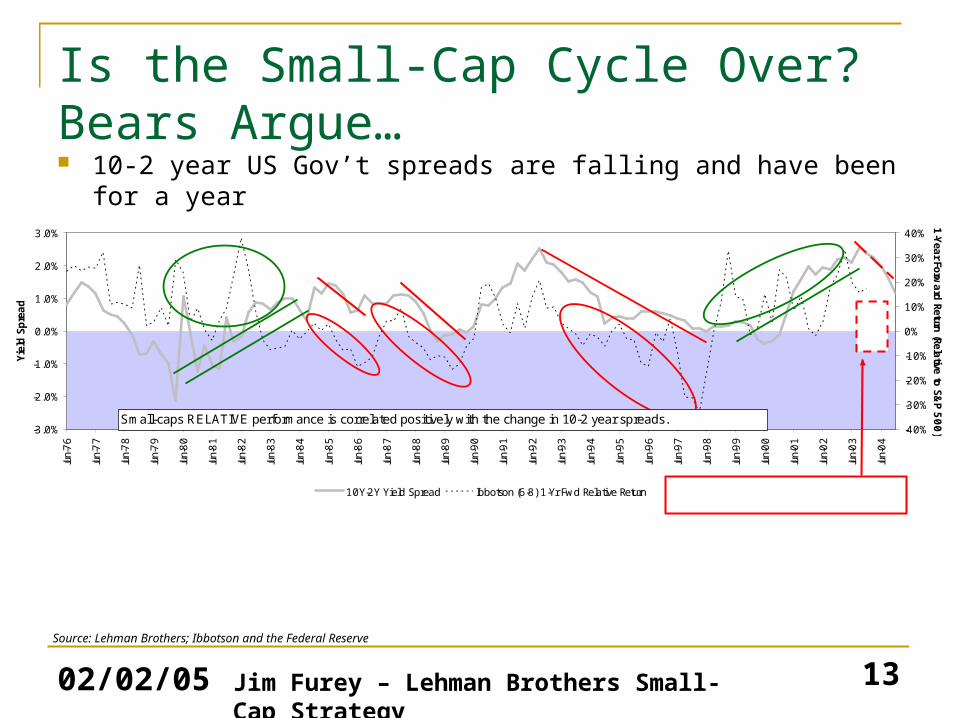
Is the Small-Cap Cycle Over?

02/02/05 12Jim Furey – Lehman Brothers Small-Cap Strategy
Is the Small-Cap Cycle Over? Bears Argue… Is it “Simply Irresistible” to Short Small-Caps & Go Long Large?
What the Small-Cap Bears are saying Monetary policy, 10-2 year US Government spreads, Real Fed Funds, Small-cap nominal valuation (P/S, P/B, P/E) & relative (P/E)
02/02/05 13Jim Furey – Lehman Brothers Small-Cap Strategy
Is the Small-Cap Cycle Over? Bears Argue… 10-2 year US Gov’t spreads are falling and have been for a year
-3.0%
-2.0%
-1.0%
0.0%
1.0%
2.0%
3.0%
Jun-
76
Jun-
77
Jun-
78
Jun-
79
Jun-
80
Jun-
81
Jun-
82
Jun-
83
Jun-
84
Jun-
85
Jun-
86
Jun-
87
Jun-
88
Jun-
89
Jun-
90
Jun-
91
Jun-
92
Jun-
93
Jun-
94
Jun-
95
Jun-
96
Jun-
97
Jun-
98
Jun-
99
Jun-
00
Jun-
01
Jun-
02
Jun-
03
Jun-
04
Yie
ld S
pre
ad
-40%
-30%
-20%
-10%
0%
10%
20%
30%
40%
1-Yea
r Forward
Return (Relative to S&
P 500)
10Y-2Y Yield Spread Ibbotson (6-8) 1-Yr Fwd Relative Return
Small-caps RELATIVE performance is correlated positively with the change in 10-2 year spreads.
?
Declining 2-10 spreads are BEARISH for small-caps RELATIVE performance.
Source: Lehman Brothers; Ibbotson and the Federal Reserve

02/02/05 14Jim Furey – Lehman Brothers Small-Cap Strategy
Is the Small-Cap Cycle Over? Bears Argue… Small-cap P/S and P/B are expensive nominally
Mean + 1StD = 1.0x
Mean = 0.8x
Mean - 1StD = 0.6x
0.20x
0.30x
0.40x
0.50x
0.60x
0.70x
0.80x
0.90x
1.00x
1.10x
1.20x
1.30x
1.40x
1/
31/
1985
1/
31/
1986
1/
30/
1987
1/
29/
1988
1/
31/
1989
1/
31/
1990
1/
31/
1991
1/
31/
1992
1/
29/
1993
1/
31/
1994
1/
31/
1995
1/
31/
1996
1/
31/
1997
1/
30/
1998
1/
29/
1999
1/
31/
2000
1/
31/
2001
1/
31/
2002
1/
31/
2003
1/
30/
2004
Pric
e to
Sal
es
(-40)
(-20)
0
20
40
60
80
1-Year Forw
ard Return
LTM P/ S 1-Year Forward Return
Mean + 1StD = 2.3x
Mean = 1.9x
Mean - 1StD = 1.6x
1.00x
1.25x
1.50x
1.75x
2.00x
2.25x
2.50x
2.75x
3.00x
1/
31/
1985
1/
31/
1986
1/
30/
1987
1/
29/
1988
1/
31/
1989
1/
31/
1990
1/
31/
1991
1/
31/
1992
1/
29/
1993
1/
31/
1994
1/
31/
1995
1/
31/
1996
1/
31/
1997
1/
30/
1998
1/
29/
1999
1/
31/
2000
1/
31/
2001
1/
31/
2002
1/
31/
2003
1/
30/
2004
Pric
e to
Boo
k(-40)
(-20)
0
20
40
60
80
1-Y
ear Forw
ard
Return
P/ B 1-Year Forward Return
R2000 P/S w/12mo Fwd Nom Rtn R2000 P/B w/12mo Fwd Nom Rtn
Source: Lehman Brothers and FactSet.
02/02/05 15Jim Furey – Lehman Brothers Small-Cap Strategy
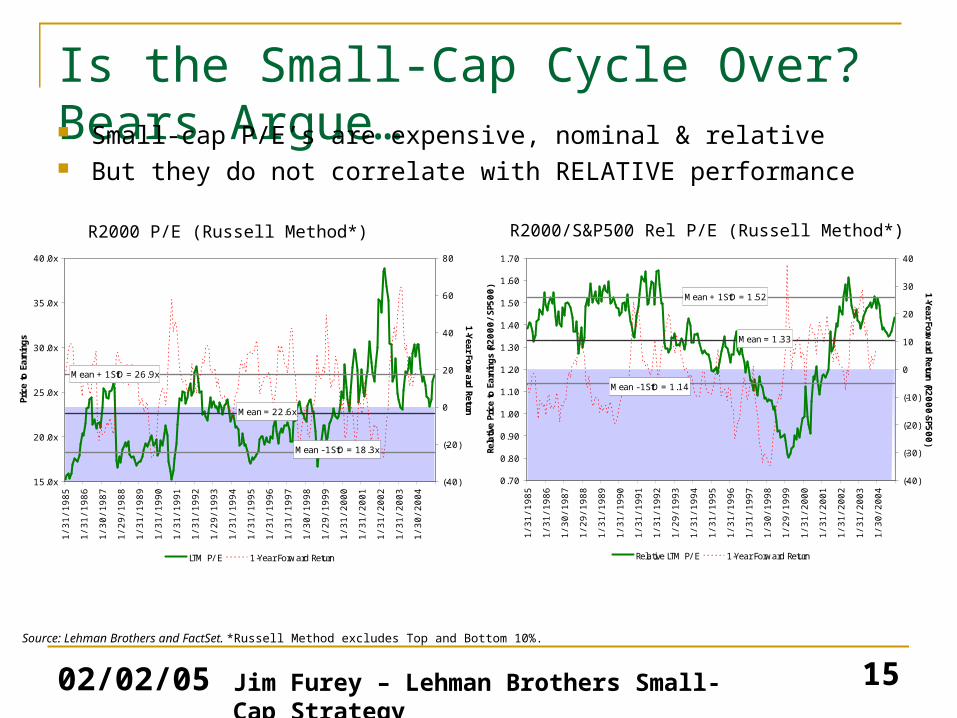
Is the Small-Cap Cycle Over? Bears Argue… Small-cap P/E’s are expensive, nominal & relative But they do not correlate with RELATIVE performance
R2000 P/E (Russell Method*) R2000/S&P500 Rel P/E (Russell Method*)
Mean + 1StD = 26.9x
Mean = 22.6x
Mean - 1StD = 18.3x
15.0x
20.0x
25.0x
30.0x
35.0x
40.0x
1/
31/
1985
1/
31/
1986
1/
30/
1987
1/
29/
1988
1/
31/
1989
1/
31/
1990
1/
31/
1991
1/
31/
1992
1/
29/
1993
1/
31/
1994
1/
31/
1995
1/
31/
1996
1/
31/
1997
1/
30/
1998
1/
29/
1999
1/
31/
2000
1/
31/
2001
1/
31/
2002
1/
31/
2003
1/
30/
2004
Pric
e to
Earn
ings
(-40)
(-20)
0
20
40
60
80
1-Y
ear Forw
ard
Return
LTM P/ E 1-Year Forward Return
Mean + 1StD = 1.52
Mean = 1.33
Mean - 1StD = 1.14
0.70
0.80
0.90
1.00
1.10
1.20
1.30
1.40
1.50
1.60
1.70
1/
31/
1985
1/
31/
1986
1/
30/
1987
1/
29/
1988
1/
31/
1989
1/
31/
1990
1/
31/
1991
1/
31/
1992
1/
29/
1993
1/
31/
1994
1/
31/
1995
1/
31/
1996
1/
31/
1997
1/
30/
1998
1/
29/
1999
1/
31/
2000
1/
31/
2001
1/
31/
2002
1/
31/
2003
1/
30/
2004
Rela
tive
Pric
e to
Ear
ning
s (R
2000/SP
500)
(-40)
(-30)
(-20)
(-10)
0
10
20
30
40
1-Year Forw
ard Return (R2000-SP5
00)
Relative LTM P/ E 1-Year Forward Return
Source: Lehman Brothers and FactSet. *Russell Method excludes Top and Bottom 10%.
02/02/05 16Jim Furey – Lehman Brothers Small-Cap Strategy
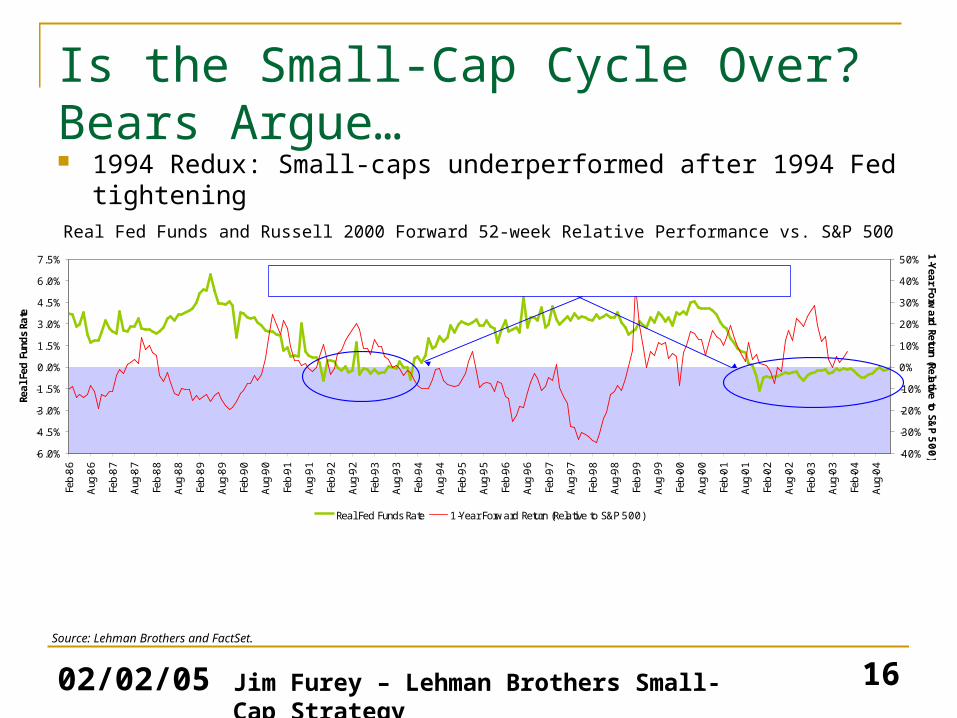
Is the Small-Cap Cycle Over? Bears Argue… 1994 Redux: Small-caps underperformed after 1994 Fed tightening
Real Fed Funds and Russell 2000 Forward 52-week Relative Performance vs. S&P 500
Source: Lehman Brothers and FactSet.
-6.0%
-4.5%
-3.0%
-1.5%
0.0%
1.5%
3.0%
4.5%
6.0%
7.5%
Feb-
86
Aug
-86
Feb-
87
Aug
-87
Feb-
88
Aug
-88
Feb-
89
Aug
-89
Feb-
90
Aug
-90
Feb-
91
Aug
-91
Feb-
92
Aug
-92
Feb-
93
Aug
-93
Feb-
94
Aug
-94
Feb-
95
Aug
-95
Feb-
96
Aug
-96
Feb-
97
Aug
-97
Feb-
98
Aug
-98
Feb-
99
Aug
-99
Feb-
00
Aug
-00
Feb-
01
Aug
-01
Feb-
02
Aug
-02
Feb-
03
Aug
-03
Feb-
04
Aug
-04
Real F
ed F
unds
Rate
-40%
-30%
-20%
-10%
0%
10%
20%
30%
40%
50%
1-Y
ear Forw
ard
Return (Relative to S&
P 500)
Real Fed Funds Rate 1-Year Forward Return (Relative to S&P 500)
Real Fed Funds negative and small-caps 52-week relative performance beats large-caps.

02/02/05 17Jim Furey – Lehman Brothers Small-Cap Strategy
Is the Small-Cap Cycle Over? Bears Argue… Relative price to sales expands when Real Fed Funds are negative
but can contract when Real Fed Funds rise as they did in 1994
Real Fed Funds and Russell 2000 Relative Price to Sales Valuation vs. S&P 500
Source: Lehman Brothers and FactSet.
Source: Lehman Brothers and FactSet Research
-3.0%
-1.5%
0.0%
1.5%
3.0%
4.5%
6.0%
7.5%
Feb-
86
Aug
-86
Feb-
87
Aug
-87
Feb-
88
Aug
-88
Feb-
89
Aug
-89
Feb-
90
Aug
-90
Feb-
91
Aug
-91
Feb-
92
Aug
-92
Feb-
93
Aug
-93
Feb-
94
Aug
-94
Feb-
95
Aug
-95
Feb-
96
Aug
-96
Feb-
97
Aug
-97
Feb-
98
Aug
-98
Feb-
99
Aug
-99
Feb-
00
Aug
-00
Feb-
01
Aug
-01
Feb-
02
Aug
-02
Feb-
03
Aug
-03
Feb-
04
Aug
-04
Real F
ed F
unds
Rate
0.4x
0.5x
0.6x
0.7x
0.8x
0.9x
1.0x
LTM P/
S (Relative to S&
P 500)
Real Fed Funds Rate LTM P/ S (Relative to S&P 500)
Relative price to sales expands when Real Fed Funds are negative but can contract when Real Fed Funds rise as they did in 1994.
Relative valuation inflects negatively when Real Fed Funds cross zero.
02/02/05 18Jim Furey – Lehman Brothers Small-Cap Strategy
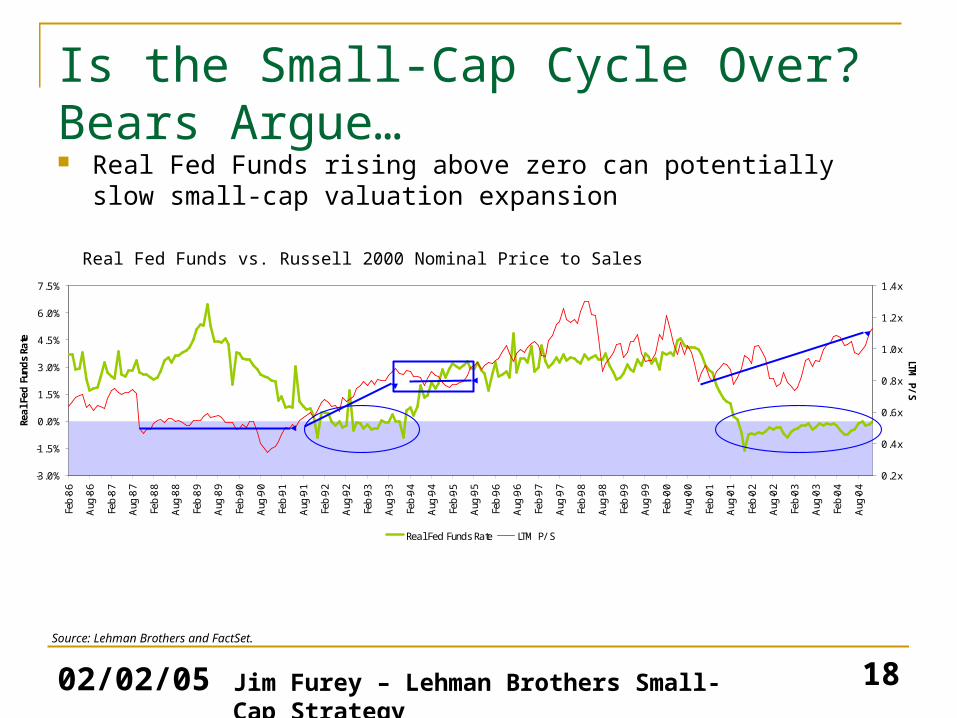
Is the Small-Cap Cycle Over? Bears Argue… Real Fed Funds rising above zero can potentially slow small-cap
valuation expansion
Real Fed Funds vs. Russell 2000 Nominal Price to Sales
Source: Lehman Brothers and FactSet.
Source: Lehman Brothers and FactSet Research
-3.0%
-1.5%
0.0%
1.5%
3.0%
4.5%
6.0%
7.5%
Feb-
86
Aug
-86
Feb-
87
Aug
-87
Feb-
88
Aug
-88
Feb-
89
Aug
-89
Feb-
90
Aug
-90
Feb-
91
Aug
-91
Feb-
92
Aug
-92
Feb-
93
Aug
-93
Feb-
94
Aug
-94
Feb-
95
Aug
-95
Feb-
96
Aug
-96
Feb-
97
Aug
-97
Feb-
98
Aug
-98
Feb-
99
Aug
-99
Feb-
00
Aug
-00
Feb-
01
Aug
-01
Feb-
02
Aug
-02
Feb-
03
Aug
-03
Feb-
04
Aug
-04
Real F
ed F
unds
Rate
0.2x
0.4x
0.6x
0.8x
1.0x
1.2x
1.4x
LTM P/
S
Real Fed Funds Rate LTM P/ S
Rising Real Fed Funds do not necessarily cause valuation compression so much as they cause valuation stagnation.

02/02/05 19Jim Furey – Lehman Brothers Small-Cap Strategy
Is the Small-Cap Cycle Over? Bears Argue… Their “Short Small-cap / Long Large-cap” trade is not a “Go Short
ALONE” strategy Small-caps since 1986 are most often profitable as long as Real Fed
Funds are less than 3.25%.
Real Fed Funds and Forward 52-Week Russell 2000 Nominal Returns
Source: Lehman Brothers and FactSet.
Source: Lehman Brothers and FactSet Research
-3.0%
-1.5%
0.0%
1.5%
3.0%
4.5%
6.0%
7.5%
Feb-
86
Aug
-86
Feb-
87
Aug
-87
Feb-
88
Aug
-88
Feb-
89
Aug
-89
Feb-
90
Aug
-90
Feb-
91
Aug
-91
Feb-
92
Aug
-92
Feb-
93
Aug
-93
Feb-
94
Aug
-94
Feb-
95
Aug
-95
Feb-
96
Aug
-96
Feb-
97
Aug
-97
Feb-
98
Aug
-98
Feb-
99
Aug
-99
Feb-
00
Aug
-00
Feb-
01
Aug
-01
Feb-
02
Aug
-02
Feb-
03
Aug
-03
Feb-
04
Aug
-04
Real F
ed F
unds
Rate
-30%
-15%
0%
15%
30%
45%
60%
75%
1-Yea
r Forward
Nom
inal Return
Real Fed Funds Rate 1-Year Forward Nominal Return
Real Fed Funds and forward 52-week Russell 2000 nominal returns are inveresly correlated. Circled are two periods, including the current one, when Real Fund Funds were less than zero and returns positive. Unless Real Fed Funds are above 3.25% small-caps are typically profitable.

02/02/05 20Jim Furey – Lehman Brothers Small-Cap Strategy
Small-Caps Can Still Outperform. Bulls Argue… “High Productivity, Low Barrier Era” forces likely
Keep REAL and NOMINAL rates low,
Favor “more local” less intellectual property (IP) based small-caps,
Support high valuation.
Investors bearish on small-caps’ RELATIVE performance may be underestimating the “High Productivity, Low Barrier Era” ability to keep rates low, policy stimulative, and investors focused on small-caps where there is less IP .
02/02/05 21Jim Furey – Lehman Brothers Small-Cap Strategy
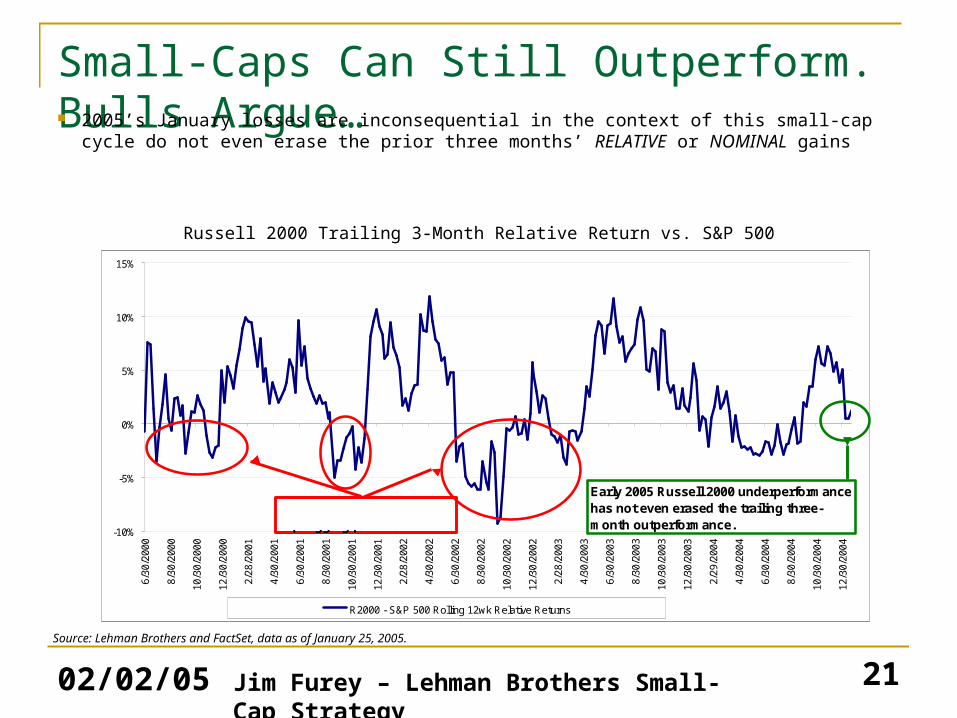
Small-Caps Can Still Outperform. Bulls Argue… 2005’s January losses are inconsequential in the context of this small-cap cycle
do not even erase the prior three months’ RELATIVE or NOMINAL gains
Russell 2000 Trailing 3-Month Relative Return vs. S&P 500
Source: Lehman Brothers and FactSet, data as of January 25, 2005.
-10%
-5%
0%
5%
10%
15%
6/30
/200
0
8/30
/200
0
10/3
0/20
00
12/3
0/20
00
2/28
/200
1
4/30
/200
1
6/30
/200
1
8/30
/200
1
10/3
0/20
01
12/3
0/20
01
2/28
/200
2
4/30
/200
2
6/30
/200
2
8/30
/200
2
10/3
0/20
02
12/3
0/20
02
2/28
/200
3
4/30
/200
3
6/30
/200
3
8/30
/200
3
10/3
0/20
03
12/3
0/20
03
2/29
/200
4
4/30
/200
4
6/30
/200
4
8/30
/200
4
10/3
0/20
04
12/3
0/20
04
R2000 - S&P 500 Rolling 12wk Relative Returns
(post Mar '00 Bubble) Early 2005 Russell 2000 underperformance has not even erased the trailing three-month outperformance.
This cycle has seen small-cap lagging periods.

02/02/05 22Jim Furey – Lehman Brothers Small-Cap Strategy
Small-Caps Can Still Outperform. Bulls Argue… Small-Caps have outperformed in the past dating to 1958 when
Real US Government 10-year rates were less than 2.5%, as is also the case today
Real 10-Year US Gov’t Interest Rates plotted vs. Small-Cap Forward 52-Week Relative Returns
Source: Lehman Brothers; Ibbotson and the Federal Reserve
-10.0%
-8.0%
-6.0%
-4.0%
-2.0%
0.0%
2.0%
4.0%
6.0%
8.0%
10.0%
Mar
-58
Mar
-59
Mar
-60
Mar
-61
Mar
-62
Mar
-63
Mar
-64
Mar
-65
Mar
-66
Mar
-67
Mar
-68
Mar
-69
Mar
-70
Mar
-71
Mar
-72
Mar
-73
Mar
-74
Mar
-75
Mar
-76
Mar
-77
Mar
-78
Mar
-79
Mar
-80
Mar
-81
Mar
-82
Mar
-83
Mar
-84
Mar
-85
Mar
-86
Mar
-87
Mar
-88
Mar
-89
Mar
-90
Mar
-91
Mar
-92
Mar
-93
Mar
-94
Mar
-95
Mar
-96
Mar
-97
Mar
-98
Mar
-99
Mar
-00
Mar
-01
Mar
-02
Mar
-03
Mar
-04
Real 1
0-Y
ear Yi
eld
-40%
-30%
-20%
-10%
0%
10%
20%
30%
40%
1-Y
ear Forw
ard
Return (Relative to S&
P 500)
US Gov't Real 10-Year Yield Ibbotson (6-8) 1-Yr Fwd Relative Return
When Real 10-Yr US rates < 2.5% the avg annual fwd relative return is 10% & SMALL OUTPERFORMS. When real rates > 2.5% the avg annual fwd relative return is 0% & small is not advantaged.
Examples of low Real rates & small-caps lagging.We could be wrong.

02/02/05 23Jim Furey – Lehman Brothers Small-Cap Strategy
Small-Caps Can Still Outperform. Bulls Argue… History supports the view that small-caps outperform when
NOMINAL 10-year US Government rates are below 5.0%
Nominal US Government 10-Year Rates and Forward 52-Week RELATIVE Performance
Source: Lehman Brothers; Ibbotson and the Federal Reserve
-15.0%
-12.0%
-9.0%
-6.0%
-3.0%
0.0%
3.0%
6.0%
9.0%
12.0%
15.0%
Mar
-58
Mar
-59
Mar
-60
Mar
-61
Mar
-62
Mar
-63
Mar
-64
Mar
-65
Mar
-66
Mar
-67
Mar
-68
Mar
-69
Mar
-70
Mar
-71
Mar
-72
Mar
-73
Mar
-74
Mar
-75
Mar
-76
Mar
-77
Mar
-78
Mar
-79
Mar
-80
Mar
-81
Mar
-82
Mar
-83
Mar
-84
Mar
-85
Mar
-86
Mar
-87
Mar
-88
Mar
-89
Mar
-90
Mar
-91
Mar
-92
Mar
-93
Mar
-94
Mar
-95
Mar
-96
Mar
-97
Mar
-98
Mar
-99
Mar
-00
Mar
-01
Mar
-02
Mar
-03
Mar
-04
Nom
10-Y
ear Yie
ld
-40%
-32%
-24%
-16%
-8%
0%
8%
16%
24%
32%
40%
1-Y
ear Forw
ard
Return (Relative to S&
P 500)
Nom US Gov't 10-Year Yld Ibbotson (6-8) 1-Yr Fwd Relative Return
When 10-Year rates < 5.0% the fwd 52-week small-cap relative return is 7.1% and when 10-year rates are > 5.0%, the avg fwd 52-week performance is 3.2%. Our point: low nominal rates may be a positive for small-caps.
02/02/05 24Jim Furey – Lehman Brothers Small-Cap Strategy
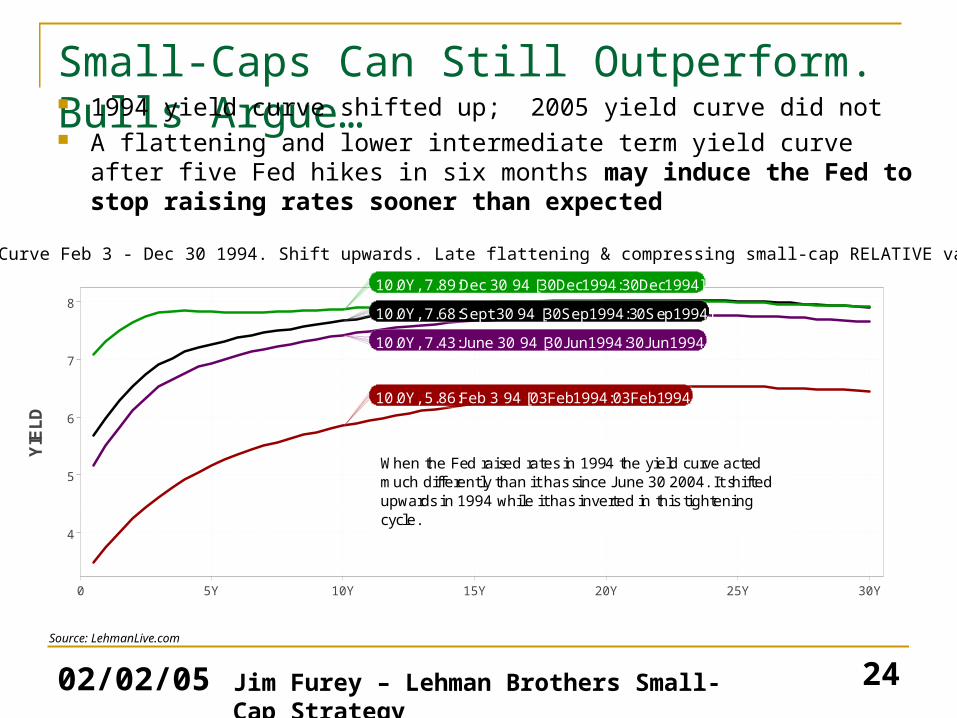
Small-Caps Can Still Outperform. Bulls Argue… 1994 yield curve shifted up; 2005 yield curve did not A flattening and lower intermediate term yield curve after five Fed
hikes in six months may induce the Fed to stop raising rates sooner than expected
Yield Curve Feb 3 - Dec 30 1994. Shift upwards. Late flattening & compressing small-cap RELATIVE valuation
Source: LehmanLive.com
N U G G E T T A G : u s e r N a m e = n u ll& p lo t N a m e = n u ll
4
5
6
7
8
YIE
LD
0 5Y 10Y 15Y 20Y 25Y 30Y
Source: LehmanLive.com
When the Fed raised rates in 1994 the yield curve acted much differently than it has since J une 30 2004. It shifted upwards in 1994 while it has inverted in this tightening cycle.
10.0Y, 7.43:J une 30 94 [30J un1994:30J un1994]
10.0Y, 7.68:Sept 30 94 [30Sep1994:30Sep1994]
10.0Y, 5.86:Feb 3 94 [03Feb1994:03Feb1994]
10.0Y, 7.89:Dec 30 94 [30Dec1994:30Dec1994]

02/02/05 25Jim Furey – Lehman Brothers Small-Cap Strategy
Small-Caps Can Still Outperform. Bulls Argue… The Fed may have to drop their tightening regimen if 10-year rates
keep declining and that will be bullish for small-caps
The Yield Curve from Jun 30, 2004 to Today. Flattening with Risk of Inverting. Sm-Cap Valuation Expands?
Source: LehmanLive.com
N U G G E T T A G : u s e r N a m e = n u ll& p lo t N a m e = n u ll1.5
2.0
2.5
3.0
3.5
4.0
4.5
5.0
5.5
YIE
LD
0 5Y 10Y 15Y 20Y 25Y 30Y
Source: LehmanLive.com
Fed begins hiking June 30 04. Seven months later 10-year rates are 47 bp lower AND small-caps have outperformed by 2.8%, rising 5.2%, even after the J anuary 2005 losses.
The Fed will control small-cap's fate
10.0Y, 4.22:J an 24 05 [Close:24J an2005]
10.0Y, 4.76:J une 30 04 [30J un2004:30J un2004]
10.0Y, 4.26:Sept 30 04 [30Sep2004:30Sep2004]
02/02/05 26Jim Furey – Lehman Brothers Small-Cap Strategy
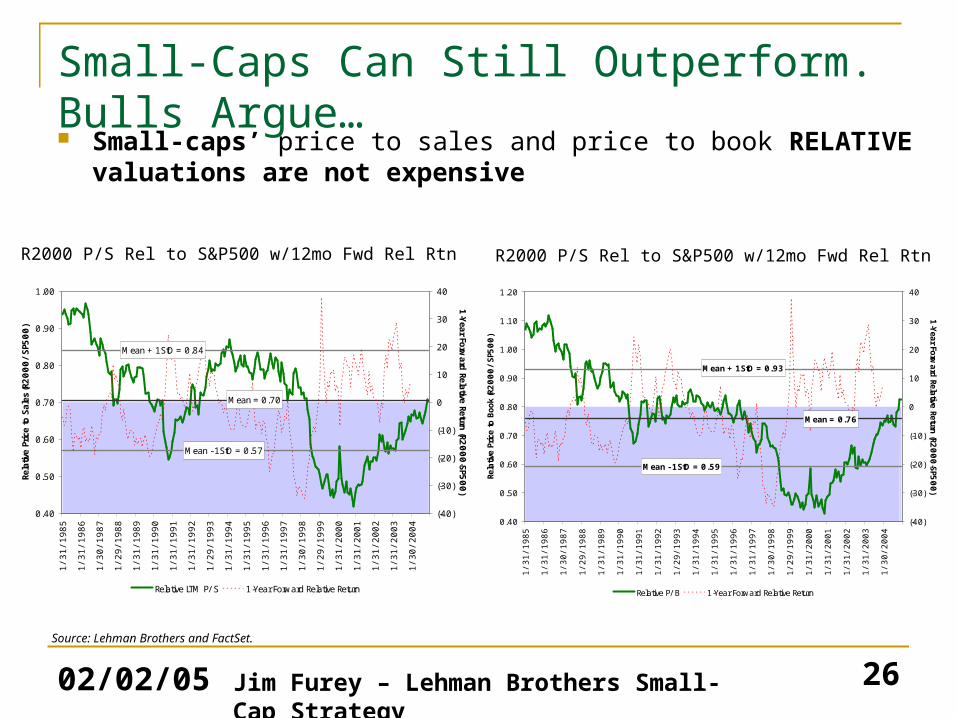
Small-Caps Can Still Outperform. Bulls Argue… Small-caps’ price to sales and price to book RELATIVE valuations
are not expensive
R2000 P/S Rel to S&P500 w/12mo Fwd Rel Rtn
Source: Lehman Brothers and FactSet.
R2000 P/S Rel to S&P500 w/12mo Fwd Rel Rtn
Mean + 1StD = 0.84
Mean = 0.70
Mean - 1StD = 0.57
0.40
0.50
0.60
0.70
0.80
0.90
1.00
1/
31/
1985
1/
31/
1986
1/
30/
1987
1/
29/
1988
1/
31/
1989
1/
31/
1990
1/
31/
1991
1/
31/
1992
1/
29/
1993
1/
31/
1994
1/
31/
1995
1/
31/
1996
1/
31/
1997
1/
30/
1998
1/
29/
1999
1/
31/
2000
1/
31/
2001
1/
31/
2002
1/
31/
2003
1/
30/
2004
Rela
tive
Pric
e to
Sal
es (R2
000/SP
500)
(-40)
(-30)
(-20)
(-10)
0
10
20
30
40
1-Year Forw
ard Relative Return (R2000-SP5
00)
Relative LTM P/ S 1-Year Forward Relative Return
Mean + 1StD = 0.93
Mean = 0.76
Mean - 1StD = 0.59
0.40
0.50
0.60
0.70
0.80
0.90
1.00
1.10
1.20
1/
31/
1985
1/
31/
1986
1/
30/
1987
1/
29/
1988
1/
31/
1989
1/
31/
1990
1/
31/
1991
1/
31/
1992
1/
29/
1993
1/
31/
1994
1/
31/
1995
1/
31/
1996
1/
31/
1997
1/
30/
1998
1/
29/
1999
1/
31/
2000
1/
31/
2001
1/
31/
2002
1/
31/
2003
1/
30/
2004
Rela
tive
Pric
e to
Boo
k (R
2000/SP
500)
(-40)
(-30)
(-20)
(-10)
0
10
20
30
40
1-Y
ear Forw
ard
Relative Return (R2
000-SP5
00)
Relative P/ B 1-Year Forward Relative Return
02/02/05 27Jim Furey – Lehman Brothers Small-Cap Strategy
Small-Caps Can Still Outperform. Bulls Argue… Other factors support further small-cap outperformance
Large-cap Healthcare’s larger weight in the S&P 500 and its struggle with new drug discovery sufficient to replace patent expiration,
Large-cap Technology’s high S&P 500 weight and its vulnerability to “High Productivity, Low Barrier Era” pressures,
Currently bullish tax policy with low favorable capital gains,
Hedge & Quant funds’ affinity for small-caps
Positive 2005 relative earnings strength
Small-caps being “more local and less global”
Real Fed Funds may not turn positive until Fed Funds reach 3.0%, indicating monetary policy remains stimulative

02/02/05 28Jim Furey – Lehman Brothers Small-Cap Strategy
Small-Caps at Risk but Not Rolling Over To Summarize, the Bearish & Bullish Arguments:
The Bearish RELATIVE performance data points Why small-caps may lead another six to 12 months
Chatter that 2005 mirrors 1994 when Real Fed Funds crossed into positive territory
“High Productivity, Low Barrier Era” forces favor small-caps
Large early 2005 nominal and relative small-cap losses 2005 small-cap relative and nominal losses are small in context
The Fed talking more “hawkishly” REAL 10-year US Government rates remain below 2.5%
Declining 10 to 2-year US Government spreads NOMINAL 10-year US Government rates are below 5.0%
Lg-cap relative PEs are at the low end of their historic range Fed may stop raising rates earlier than the consensus believes
Small-caps are expensive nominally Real Fed Funds may not turn positive until Fed Funds reach 3%
P/ S and P/ B RELATIVE valuations are not expensive

29Jim Furey – Lehman Brothers Small-Cap Strategy
Our Approach to Small-Cap Decision Making
02/02/05 30Jim Furey – Lehman Brothers Small-Cap Strategy
Our Approach to Small-Cap Decision Making Quantify:
Sentiment Risk & Reward Earnings Performance & Momentum Technicals
You may agree or disagree with our conclusions BUT our data will likely be the basis for YOUR decisions implicitly or explicitly

02/02/05 31Jim Furey – Lehman Brothers Small-Cap Strategy
Sector Performance/Momentum
Nominal Performance Forced Performance Ranking Nominal Change in Forced Ranking of RankingsINDUSTRY 12 Mo 6 Mo 3 Mo 1 Mo 12 Mo 6 Mo 3 Mo 1 Mo 12 - 6 Mo 6 -3 Mo 3 -1 Mo Perf. ChangeConsumer Discretionary 11.1 9.4 7.3 -5.1 5 10 6 5 -5 4 1 6 8Consumer Staples 20.7 14.9 12.4 -1.0 3 4 2 2 -1 2 0 3 4Energy 56.2 26.3 14.1 2.1 1 1 1 1 0 0 0 1 6Financials 9.2 11.1 3.1 -6.1 6 7 9 6 -1 -2 3 8 7Health Care -0.3 11.5 7.1 -7.2 9 6 7 9 3 -1 -2 9 3Industrials 16.3 14.1 9.3 -6.7 4 5 4 8 -1 1 -4 4 9Information Technology -13.7 9.4 1.1 -10.4 10 9 10 10 1 -1 0 10 5Materials 34.8 17.0 9.0 -6.3 2 2 5 7 0 -3 -2 2 10Telecommunications 0.1 15.9 9.5 -5.1 8 3 3 4 5 0 -1 7 1Utilities 9.0 11.0 5.9 -2.7 7 8 8 3 -1 0 5 5 2
R2000 -- Avg. 6.1 12.4 8.7 -5.9
R2000 -- Med. 3.0 9.3 6.1 -6.0
Russell 2000 Sector Performance and Momentum
Source: Lehman Brothers and Baseline
02/02/05 32Jim Furey – Lehman Brothers Small-Cap Strategy
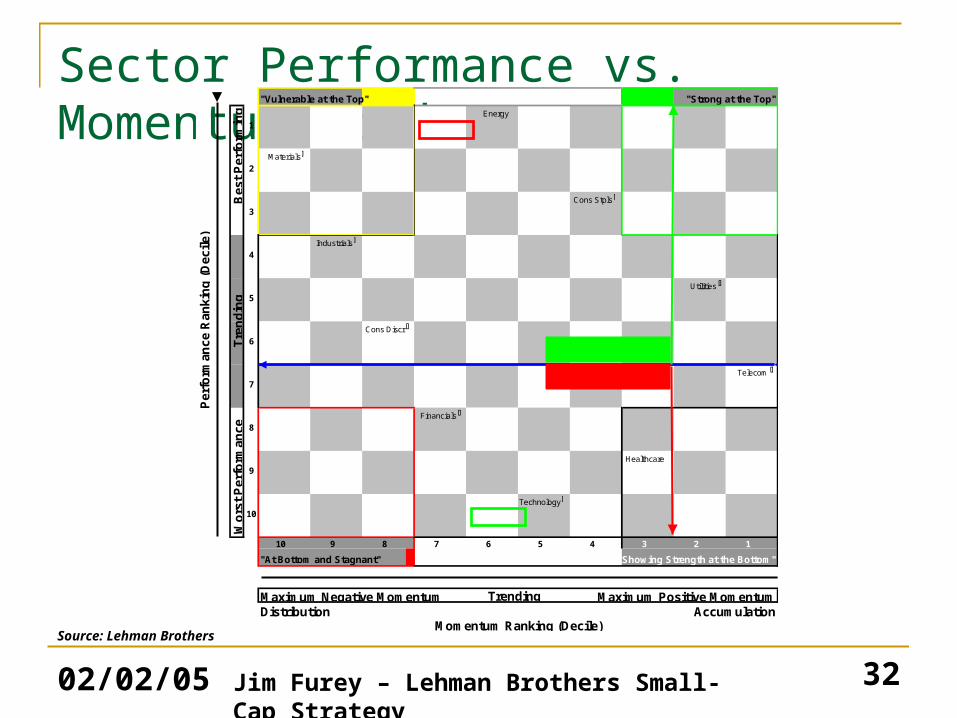
Sector Performance vs. Momentum Grid
"Vulnerable at the Top" "Strong at the Top"
Energy
1
Materialsf
2
Cons Stplsf
3
Industrialsf
4
Utilities f
5
Cons Discr f
6
Telecom f
7
Financials f
8
Healthcare
9
Technologyf
10
10 9 8 7 6 5 4 3 2 1
"At Bottom and Stagnant" "Showing Strength at the Bottom"
Maximum Negative Momentum Maximum Positive MomentumDistribution Accumulation
Momentum Ranking (Decile)
Pe
rfo
rma
nce
Ran
kin
g (
Dec
ile)
Wo
rst
Per
form
ance
Be
st P
erfo
rmin
gT
ren
din
g
Trending
Underperforming
Outperforming
Source: Lehman Brothers
02/02/05 33Jim Furey – Lehman Brothers Small-Cap Strategy
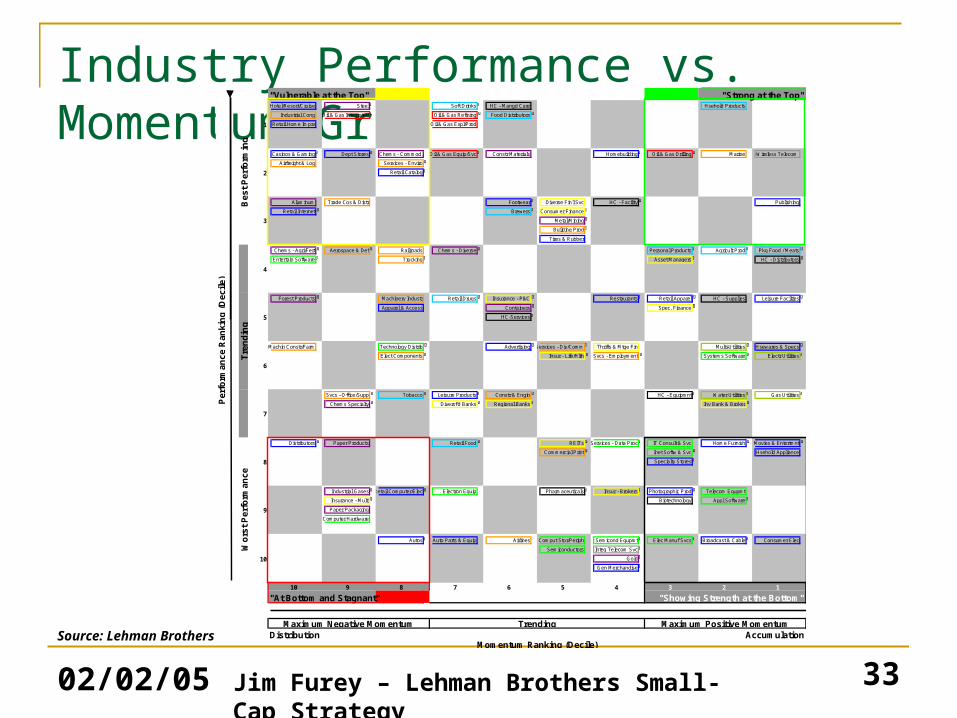
Industry Performance vs. Momentum Grid
"Vulnerable at the Top" "Strong at the Top"Hotel/Resort/Cruise Steel f Soft Drinks f HC - Mangd Care Hsehold Products
Industrial Cong Oil & Gas Integrated f Oil & Gas Refining f Food Distributors f
Retail Home Imprv Oil & Gas Expl/Prod
Casinos & Gaming f Dept Stores f Chems - Commod. Oil & Gas Equip/Svc f Constr Materials Homebuilding f Oil & Gas Drilling f Marine Wireless Telecom
Airfreight & Log Services - Enviro f
Retail Catalog f
Aluminum Trade Cos & Distr Footwear f Diverse Fin'l Svc HC - Facility f Publishing
Retail Internet f Brewers f Consumer Finance f
Metal/Mining f
Building Prod f
Tires & Rubber
Chems - Agri/Fert f Aerospace & Def f Railroads Chems - Diverse f Personal Products f Agricult Prod f Pkg Food / Meats f
Entertain Software f Trucking f Asset Managers f HC - Distributors f
Forest Products f Machinery Industr Retail Drugs f Insurance - P&C f Restaurants f Retail Apparel f HC - Supplies Leisure Facilties f
Apparel & Access Containers f Spec. Finance f
HC-Services f
Machin Constr/Farm Technology Distrib f Advertising f Services - Div/Comm f Thrifts & Mtge Fin Multi-Utilities f Hsewares & Specs f
Elect Components f Insur - Life/Hlth f Svcs - Employment f Systems Software f Electr Utilities f
Svcs - Office/Supp f Tobacco f Leisure Products f Constr & Engin f HC - Equipmnt f Water Utilities f Gas Utilities f
Chems Specialty f Diversf'd Banks f Regional Banks f Inv Bank & Broker f
Distributors f Paper Products Retail Food f REITs f Services - Data Proc f IT Consult & Svc Home Furnish f Movies & Entertmnt f
Commercial Print f Inet Softw & Svc f Hsehold Appliance
Specialty Stores f
Industrial Gases f Retail Computer/Elec f Electron Equip Pharmaceuticals f Insur - Brokers f Photographic Prod f Telecom Equpmt
Insurance - Multi f Biotechnology Appl Software f
Paper Packaging
Computer Hardware
Autos f Auto Parts & Equip Airlines Comput Stor/Periph Semicond Equpmt f Elec Manuf Svcs f Broadcast & Cable f Consumer Elec
Semiconductors Integ Telecom Svc f
Gold f
Gen Merchandise f
10 9 8 7 6 5 4 3 2 1
"At Bottom and Stagnant" "Showing Strength at the Bottom"
Distribution AccumulationTrending Maximum Positive MomentumMaximum Negative Momentum
Momentum Ranking (Decile)
Pe
rfo
rman
ce R
anki
ng
(D
eci
le)
Bes
t P
erfo
rmin
gT
ren
din
gW
ors
t P
erfo
rma
nc
e
2
1
6
5
4
3
10
9
8
7
Source: Lehman Brothers

02/02/05 34Jim Furey – Lehman Brothers Small-Cap Strategy
Assigning Values to Perf. vs. Mom. Grid 1/28/2005
Underweight Neutral Overweight
Information Technology Consumer Discretionary Utilities
Telecommunication Services Financials Energy
Materials Health Care Consumer Staples
Industrials
Index Sector
Consumer Discretionary- Neu 15.1% 100.0%Advertising 0.6% 4.3% Advertising Apparel Accessories & Luxury Goods 0.7% 4.4% Apparel & Lux Gds
Apparel Retail 1.3% 8.4% Apparel RetailAuto Parts & Equipment 0.7% 4.5% Auto Parts & Equipment Automobile Manufacturers 0.3% 2.0% Automobile Manufacturers Broadcasting & Cable TV 0.7% 4.6% Broadcasting & Cable TV Casinos & Gaming 1.2% 7.7% Casinos & GamingCatalog Retail 0.3% 1.8% Catalog RetailComputer & Electronics Retail 0.1% 0.7% Computer & Electronics Retail Consumer Electronics 0.0% 0.1% Consumer Electronics Department Stores 0.0% 0.1% Department StoresDistributors 0.1% 0.9% Distributors Footw ear 0.4% 2.4% Footw earGeneral Merchandise Stores 0.3% 1.7% Home Furnishings 0.4% 2.9% Home Furnishings Home Improvement Retail 0.0% 0.3% Home Improvement RetailHomebuilding 0.8% 5.0% HomebuildingHotels Resorts & Cruise Lines 0.4% 2.7% Hotels Resorts & CruiseHousehold Appliances 0.0% 0.1% Household AppliancesHousew ares & Specialties 0.7% 4.7% Housew ares & SpecialtiesInternet Retail 0.2% 1.4% Internet Retail Leisure Facilities 0.2% 1.1% Leisure FacilitiesLeisure Products 0.7% 4.5% Leisure Products Movies & Entertainment 0.2% 1.1% Movies & EntertainmentPublishing 0.9% 5.7% PublishingRestaurants 1.8% 11.9% RestaurantsSpecialty Stores 1.8% 12.3% Specialty Stores Tires & Rubber 0.4% 2.7% Tires & Rubber
Consumer Staples- OW 2.8% 100.0%Agricultural Products 0.3% 12.3% Agricultural ProductsBrew ers 0.0% 0.7% Brew ersDistillers & Vintners 0.0% 0.2% Drug Retail 0.2% 6.3% Drug Retail Food Distributors 0.3% 12.4% Food DistributorsFood Retail 0.3% 10.7% Food Retail Household Products 0.2% 8.3% Household ProductsPackaged Foods & Meats 0.8% 27.2% Packaged Foods & MeatsPersonal Products 0.4% 13.0% Personal ProductsSoft Drinks 0.0% 1.7% Soft DrinksTobacco 0.2% 7.1% Tobacco
Energy- OW 5.9% 100.0%Integrated Oil & Gas 0.0% 0.5% Integrated Oil & GasOil & Gas Drilling 0.5% 8.9% Oil & Gas DrillingOil & Gas Equipment & Services 1.7% 29.6% Oil & Gas Equip & ServicesOil & Gas Exploration & Production 3.0% 51.1% Oil & Gas Expl & Production
0.6% 9.9% Oil & Gas Refin, Mkt & Transp
Financials- Neu 22.0% 100.0%Asset Management & Custody Banks 0.6% 2.7% Asset ManagementConsumer Finance 0.4% 1.9% Consumer FinanceInsurance Brokers 0.2% 0.7% Insurance Brokers
Investment Banking & Brokerage 0.4% 1.8% Investment Bank & BrokLife & Health Insurance 0.7% 3.2% Life & Health Insurance Multi-line Insurance 0.1% 0.3% Multi-line Insurance Property & Casualty Insurance 1.6% 7.2% Prop & Casualty Insurance Real Estate Investment Trusts 7.0% 32.0% REITs Real Estate Management & Development 0.4% 1.9% Real Estate Mgmt & DevRegional Banks 7.8% 35.5% Regional Banks Reinsurance 0.0% 0.1% Specialized Finance 0.3% 1.2% Specialized FinanceThrifts & Mortgage Finance 2.6% 11.7% Thrifts & Mortgage Finance
Health Care- Neu 12.6% 100.0%Biotechnology 3.3% 26.0% Biotechnology Health Care Distributors 0.2% 1.9% Health Care DistributorsHealth Care Equipment 2.7% 21.8% Health Care Equipment Health Care Facilities 1.1% 9.1% Health Care FacilitiesHealth Care Services 1.7% 13.9% Health Care Services Health Care Supplies 1.1% 8.9% Health Care SuppliesManaged Health Care 0.8% 6.2% Managed Health CarePharmaceuticals 1.6% 12.4% Pharmaceuticals
1 1 1 1 1 1 1 1 1 1
1 1 1 1 1 1 1 1 1 1
1 1 1 1 1 1 1 1 1 1
1 1 1 1 1 1 1 1 1 1
1 1 1 1 1 1 1 1 1 1
-1 -1 -1 1 1 1 1 1 1 1
-1 -1 -1 -1 1 1 1 1 1 1
-1 -1 -1 -1 1 1 1 1 1 1
-1 -1 -1 -1 -1 -1 1 1 1 1
-1 -1 -1 -1 -1 -1 -1 1 1 1
Per
form
ance
MomentumSource: Lehman Brothers

02/02/05 35Jim Furey – Lehman Brothers Small-Cap Strategy
“Voice of the Small-Cap Market”1/28/2005
Underweight Neutral Overweight
Information Technology Consumer Discretionary Utilities
Telecommunication Services Financials Energy
Materials Health Care Consumer Staples
Industrials
Index Sector
Industrials- Neu 14.3% 100.0%Aerospace & Defense 1.5% 10.6% Aerospace & Defense Air Freight & Logistics 0.3% 1.9% Air Freight & LogisticsAirlines 0.5% 3.7% Airlines Building Products 0.9% 6.6% Building ProductsCommercial Printing 0.3% 2.4% Commercial Printing Construction & Engineering 0.7% 4.8% Construction & Engineering Construction & Farm Machinery & Heavy Trucks1.1% 7.7% Constr & Farm Machinery Diversif ied Commercial Services 2.0% 14.0% Divers Commercial Svcs Electrical Components & Equipment 1.2% 8.1% Electrical Components & Eq Employment Services 0.5% 3.7% Employment Services Environmental Services 0.3% 2.1% Environmental ServicesIndustrial Conglomerates 0.2% 1.2% Industrial ConglomeratesIndustrial Machinery 2.2% 15.4% Industrial Machinery Marine 0.3% 1.9% MarineOffice Services & Supplies 0.4% 2.8% Office Services & Supplies Railroads 0.3% 1.9% Railroads Trading Companies & Distributors 0.3% 2.4% Trading Co & DistributorsTrucking 1.3% 8.9% Trucking
Information Technology - UW 16.8% 100.0%Application Softw are 2.5% 15.0% Application Softw are Communications Equipment 2.0% 11.7% Communications Equipment Computer Hardw are 0.4% 2.6% Computer Hardw are Computer Storage & Peripherals 1.3% 7.5% Computer Storage & Periphs
0.6% 3.6% Data Processing Svcs Electronic Equipment Manufacturers 1.5% 9.2% Electronic Equipment Manuf Electronic Manufacturing Services 0.7% 4.1% Electronic Manufacturing Services Home Entertainment Softw are 0.3% 1.7% Internet Softw are & Services 2.3% 13.7% Internet Softw are & Services IT Consulting & Other Services 1.2% 7.0% IT Consulting & Other Services Semiconductor Equipment 1.3% 7.6% Semiconductor Equipment Semiconductors 1.7% 10.2% Semiconductors Systems Softw are 0.7% 4.2% Systems Softw areTechnology Distributors 0.3% 2.1% Technology Distributors
Materials - UW 6.1% 100.0%Aluminum 0.1% 1.3% Aluminum Commodity Chemicals 0.3% 5.1% Commodity ChemicalsConstruction Materials 0.4% 6.2% Construction MaterialsDiversif ied Chemicals 0.4% 7.3% Diversif ied Chemicals Diversif ied Metals & Mining 0.3% 4.1% Diversif ied Metals & Mining
Fertilizers & Agricultural Chemicals 0.2% 3.6% Fertilizers & Agri Chemicals Forest Products 0.0% 0.6% Forest Products Gold 0.0% 0.4% Gold Industrial Gases 0.1% 2.2% Industrial Gases Metal & Glass Containers 0.5% 8.7% Metal & Glass Containers Paper Packaging 0.2% 3.8% Paper Packaging Paper Products 0.3% 5.3% Paper Products Precious Metals & Minerals 0.2% 2.9% Specialty Chemicals 1.5% 25.2% Specialty Chemicals Steel 1.4% 23.3% Steel
Telecommunication Services - UW 1.0% 100.0%Integrated Telecommunication Services 0.5% 48.3% Integrated Telecom Svcs Wireless Telecommunication Services 0.5% 51.7% Wireless Telecom Svcs
Utilities- OW 3.4% 100.0%Electric Utilities 1.2% 34.7% Electric UtilitiesGas Utilities 1.4% 40.1% Gas UtilitiesMulti-Utilities & Unregulated Pow er 0.7% 20.1% Multi-Utilities & Unreg Pow erWater Utilities 0.2% 5.1% Water Utilities
Weight Within:
1 1 1 1 1 1 1 1 1 1
1 1 1 1 1 1 1 1 1 1
1 1 1 1 1 1 1 1 1 1
1 1 1 1 1 1 1 1 1 1
1 1 1 1 1 1 1 1 1 1
-1 -1 -1 1 1 1 1 1 1 1
-1 -1 -1 -1 1 1 1 1 1 1
-1 -1 -1 -1 1 1 1 1 1 1
-1 -1 -1 -1 -1 -1 1 1 1 1
-1 -1 -1 -1 -1 -1 -1 1 1 1
Per
form
ance
Momentum
Source: Lehman Brothers and FactSet

36Jim Furey – Lehman Brothers Small-Cap Strategy
Thank You.
Jim Furey, CFA, Managing DirectorLehman Brothers Small-Cap Strategy
212.526.7715; [email protected]

02/02/05 37Jim Furey – Lehman Brothers Small-Cap Strategy
Analyst CertificationI, James Furey, hereby certify (1) that the views expressed in this research email accurately reflect my personal views about any or all of the subject securities or
issuers referred to in this email and (2) no part of my compensation was, is or will be directly or indirectly related to the specific recommendations or views expressed in this email.
Lehman Brothers does and seeks to do business with companies covered in its research reports. As a result, investors should be aware that the firm may have a conflict of interest that could affect the objectivity of this email communication.
Investors should consider this communication as only a single factor in making their investment decision.
Important Disclosures:
The analysts responsible for preparing this report have received compensation based upon various factors including the Firm’s total revenues, a portion of which is generated by investment banking activities.
Stock price and ratings history charts along with other important disclosures are available on our disclosure website at www.lehman.com/disclosures
And may also be obtained by sending a written request to: LEHMAN BROTHERS CONTROL ROOM , 745 SEVENTH AVENUE, 19TH FLOOR NEW YORK, NY 10019
This material has been prepared and/or issued by Lehman Brothers Inc., member SIPC, and/or one of its affiliates ("Lehman Brothers") and has been approved by Lehman Brothers International (Europe), authorized and regulated by the Financial Services Authority, in connection with its distribution in the European Economic Area. This material is distributed in Japan by Lehman Brothers Japan Inc., and in Hong Kong by Lehman Brothers Asia Limited. This material is distributed in Australia by Lehman Brothers Australia Pty Limited, and in Singapore by Lehman Brothers Inc., Singapore Branch. This material is distributed in Korea by Lehman Brothers International (Europe) Seoul Branch. This document is for information purposes only and it should not be regarded as an offer to sell or as a solicitation of an offer to buy the securities or other instruments mentioned in it. No part of this document may be reproduced in any manner without the written permission of Lehman Brothers. With the exception of disclosures relating to Lehman Brothers, this research report is based on current public information that Lehman Brothers considers reliable, but we make no representation that it is accurate or complete, and it should not be relied on as such. In the case of any disclosure to the effect that Lehman Brothers Inc. or its affiliates beneficially own 1% or more of any class of common equity securities of the subject company, the computation of beneficial ownership of securities is based upon the methodology used to compute ownership under Section 13(d) of the United States' Securities Exchange Act of 1934. In the case of any disclosure to the effect that Lehman Brothers Inc. and/or its affiliates hold a short position of at least 1% of the outstanding share capital of a particular company, such disclosure relates solely to the ordinary share capital of the company. Accordingly, while such calculation represents Lehman Brothers' holdings net of any long position in the ordinary share capital of the company, such calculation excludes any rights or obligations that Lehman Brothers may otherwise have, or which may accrue in the future, with respect to such ordinary share capital. Similarly such calculation does not include any shares held or owned by Lehman Brothers where such shares are held under a wider agreement or arrangement (be it with a client or a counterparty) concerning the shares of such company (e.g. prime broking and/or stock lending activity). Any such disclosure represents the position of Lehman Brothers as of the last business day of the calendar month preceding the date of this report.
This material is provided with the understanding that Lehman Brothers is not acting in a fiduciary capacity. Opinions expressed herein reflect the opinion of Lehman Brothers and are subject to change without notice. The products mentioned in this document may not be eligible for sale in some states or countries, and they may not be suitable for all types of investors. If an investor has any doubts about product suitability, he should consult his Lehman Brothers representative. The value of and the income produced by products may fluctuate, so that an investor may get back less than he invested. Value and income may be adversely affected by exchange rates, interest rates, or other factors. Past performance is not necessarily indicative of future results. If a product is income producing, part of the capital invested may be used to pay that income. © 2005 Lehman Brothers. All rights reserved. Additional information is available on request. Please contact a Lehman Brothers entity in your home jurisdiction.
Lehman Brothers policy for managing conflicts of interest in connection with investment research is available at www.lehman.com/researchconflictspolicy. Ratings, earnings per share forecasts and price targets contained in the Firm's equity research reports covering U.S. companies are available at www.lehman.com/disclosures.