jimma university college of agreculture and … sinaga.pdf · alcohol consumption, khat chewing,...
TRANSCRIPT

JIMMA UNIVERSITY
COLLEGE OF HEALTH SCIENCES
DEPARTMENT OF POPULATION AND FAMILY HEALTH
HUMAN NUTRITION TEAM
ASSOCIATION OF FASTING ANIMAL SOURCE FOODS WITH METABOLIC SYNDROME
AND BODY COMPOSITION AMONG EMPLOYEES OF JIMMA UNIVERSITY
Mr.Melese Sinaga (B.pharm,Msc) ,Prof. Dr.Tefera Belachew (MD, MSc, DLSHTM, PhD) ,Mr Amanuel Tesfaye (Bsc, MPH/RH) &Mrs.Makeda
Sinaga (BSc, MPH/RH, PhD Fellow)
January, 2016
Jimma, Ethiopia
1/16/2016
1

OUTLINE OF PRESENTATION
Introduction
Conceptual framework
Significance of the study
Objectives
Methods and materials
Result and discussion
Conclusion
Recommendation
Strength and limitation of the study
References
Acknowledgments
1/16/2016
2

Introduction
Metabolic syndrome (MetS) is a group of risk factors of
cardiovascular disease (CVD) such as diabetes and impaired
glucose regulation, central obesity, hypertension, and
dyslipidemia (Alberti KG, et al. 2009).
The rapid rise of non communicable diseases (NCDs) is presenting
a formidable challenge in 20th century which is threatening
economic and social development of the world as well as the lives
and health of millions across the globe (Reddy K, et al. Lancet,
2005)
1/16/2016
3

Cont …
NCDs which include Diabetes mellitus and cardiovascular disease
are world’s biggest killer diseases, estimated to cause 3.5millions
death each year, 80% of them are found in the low and middle
income countries ( WHO,2010).
The global prevalence of chronic non communicable diseases (NCDs) is on
the rise, and in sub-Saharan Africa, NCDs are projected to surpass infectious
diseases by 2030 (B. Lu, Y. Yang, X. Song et al.2006).
Consumption of calorie-dense foods, sedentary lifestyle, tobacco
consumption, and use of antiretroviral medications are risk factors for MetS (
Tran A, Gelaye B, Girma B, et al. 2011).
Evidences show that Ethiopia the burden of metabolic syndrome
and mortality from CNCDs that are linked to life styles changes is
increasing. In Addis Ababa, the prevalence of MetS was 14.0% in
men and 24.0% in women (Tefera B. 2014).1/16/2016
4

Cont …
The Mediterranean diet has been shown to have a protective effect (Jordi .M et al, 2014).
Despite these facts, there are no evidences on the association of fasting animal sources foods on the markers of metabolic syndrome in Ethiopian adults.
In Ethiopia, although Orthodox Christians fast animal source food for two consecutive months every year during the lent, association of fasting animal source food with metabolic syndrome has not been evaluated.
This Study involving a larger population was help us to understand association of fasting of animal source foods with metabolic syndrome and body composition and its complications.
1/16/2016
5

Significance of the study
Despite the aforementioned facts, there are no any population level interventions in Ethiopia to address the ever increasing level of metabolic syndrome and chronic non communicable diseases (CNCDs).
There are limited published data on the association of fasting of animal source foods on markers of metabolic syndrome and body composition adults in Sub-Saharan Africa but none in our country.
This study indented to examine the association between fasting animal source foods with metabolic syndrome and body composition among workers Jimma University
1/16/2016
6

Objectives
General objective
To assess the association of fasting animal source foods with
markers of metabolic syndrome and body composition of Jimma
university workers from March to April 2015.
Specific objectives
To determine association between fasting animal source foods with markers of
metabolic syndrome ( fasting on blood pressure, fasting glucose, cholesterol,
triglyceride and high density).
To determine independent effect of fasting animal source foods on metabolic
syndrome.
To measure the independent effect of fasting on body composition (fat mass).
1/16/2016
7

CLIENTS AND METHODS
Study area and period
The study was conducted at Jimma University; the town is located 354 km south west of Addis Ababa .
Study period
From March to April 2015.
Study Design
Comparative Cross sectional design was employed.
1/16/2016
8

Population
Source Population
The source population was all administrative and academic staff of
Jimma University.
Study Population
Workers of Jimma University who was randomly selected to
participate from each college was used as study population.
1/16/2016
9

Inclusion and exclusion Criteria
Inclusion Criteria
All administrative and academic staff of JU
Exclusion Criteria
All administrative and academic staff of JU who have physical
disability including deformity (Kyphosis, Scoliosis), pregnant
women, limb deformity that prevents standing erred was excluded
from inclusion into the study.
Seriously ill staff during the study period was also be excluded.
1/16/2016
10

Sample Size and Sampling Technique
The sample size was calculated using Epi info with the following
assumption: Prevalence of the most common metabolic syndrome
(abdominal obesity) of 19.6% among Ethiopian adults(Tran A,
Gelaye B, Girma B, et al. 2011)
1/16/2016
Power =94%
Ratio non–fasters to fasters=2
P1=19.6% ( expected prevalence of metabolic syndrome in fasters)
P2=32.8( expected prevalence of Metabolic syndrome in non-fasters)
To detect a difference in the metabolic syndrome =13.2
Sample size
Faster =195+ 4%=203
Non-faster =398+4%=406
Total sample size =609
11

Sampling Technique
Simple Random Sample (SRS) was used to select the study participants using proportional to size allocation sampling.
All Jimma University both Academic and Administrative staff wereincluded in the sample have equal chance of being selected into the samples.
Each staff were have the same chance of being generated by the computer (in order to fill the simple random sampling requirement of an equal chance for each individual )
Stratified by their sex
1/16/2016
12

Cont …
1/16/2016
13
All administrative and Academic staff of Jimma University
N=5444
Academic staff N= 1341
AdministrativeN =4103
Male =1205 Female= 136 Male =1844 Female =2259
n =135 n=15 n=206 n=253
n=609
Simple Random Sample (SRS)
Proportional to size allocation
Figure 1: Showing Schematic
presentation of sampling procedure

Measurements
Variables
Dependent variable
Metabolic syndrome and body composition
1/16/2016
14
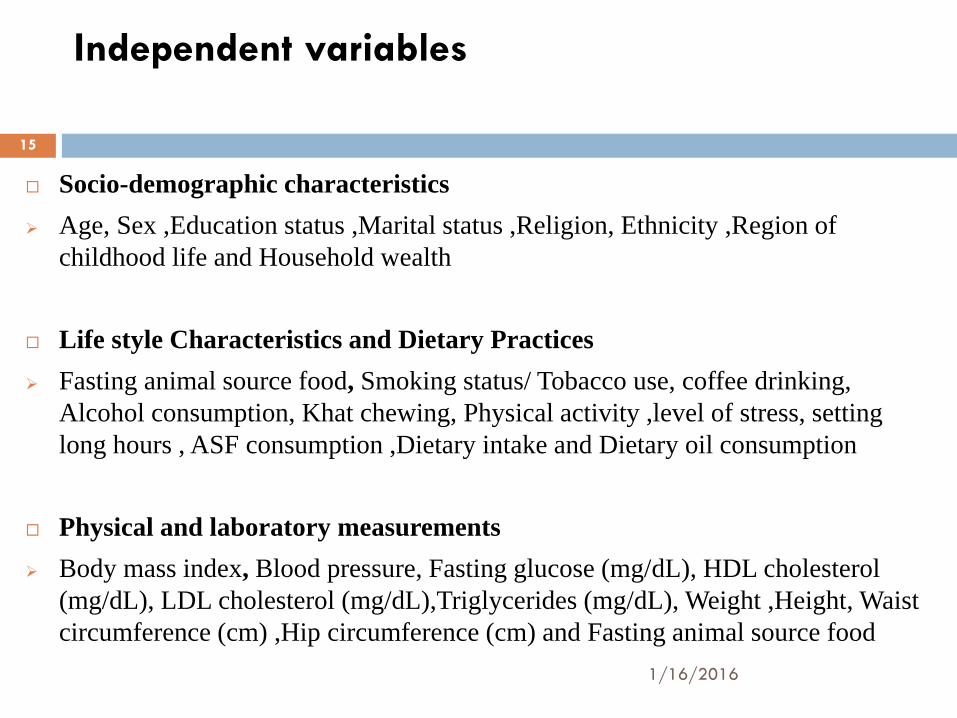
Independent variables
Socio-demographic characteristics
Age, Sex ,Education status ,Marital status ,Religion, Ethnicity ,Region of
childhood life and Household wealth
Life style Characteristics and Dietary Practices
Fasting animal source food, Smoking status/ Tobacco use, coffee drinking,
Alcohol consumption, Khat chewing, Physical activity ,level of stress, setting
long hours , ASF consumption ,Dietary intake and Dietary oil consumption
Physical and laboratory measurements
Body mass index, Blood pressure, Fasting glucose (mg/dL), HDL cholesterol
(mg/dL), LDL cholesterol (mg/dL),Triglycerides (mg/dL), Weight ,Height, Waist
circumference (cm) ,Hip circumference (cm) and Fasting animal source food
1/16/2016
15

Data Collection
This study was conducted in accordance with the WHO's
Stepwise (STEPs) approach for non-communicable disease
(NCD) surveillance (WHO, 2004).
This approach is characterized by the use of questionnaires to gain
information on risk factors (Step 1): simple physical
measurements (Step 2): and biochemical measurements (Step
3) (WHO, 2004).
This study was employed the STEPs questionnaire which was
developed specifically for NCD risk factor surveillance.
1/16/2016
16

Anthropometry measurements
Body Mass Index (BMI)
Waist circumference
Cardiovascular Risk Factors
Blood pressure was measured digitally (Microlife BP A50,
Microlife AG, Switzerland)
The BP was taken using a mercury sphygmomanometer from
the right upper arm after the subject was seated quietly for 5 min
1/16/2016
17

Laboratory Test
Fasting Blood Glucose (GOD-PAP METHOD)
LIPID PROFILE TESTS
After all the specimens are collected the serum is packed with ice
and transported to Hospital laboratory and the lipid profile tests
was done at in Mettu Karl hospital Laboratory with HumaStar
80 (Germany) spectrophotometer.
1/16/2016
18

Cont …
Lipid profiles were analyses in Mettu Karl Hospital Laboratory,
which is star III.
Samples were analyzed using fully automated biochemistry analyzers
by the direct end point enzymatic method.
Total Cholesterol (CHOD-PAP METHOD)
Triglycerides Test (GPO-PAP METHOD)
High density lipoprotein cholesterol test
Body fat percent determined using air displacement
Plethysmography (Gold standard)
1/16/2016
19

Bod Pod

Bod Pod device
Photo courtesy of Life Measurement, Inc.

Statistical methods
Data entered into EPI data version 3.1 were exported to SPSS (Version 20.0) for statistical analysis.
Normality continuous variables was checked using graphic methods (Historgrams with normality curves and QQ-plots)
Models were selected depending on the type of dependent variable (Logistic regression for binary variable, Linear regression for continuous normally distributed variable) and multicollinearitywas checked.
Principal component Analyses (PCA) was done and the household wealth index ranked into tertiles.
1/16/2016
22

Cont …
The probability values are two-sided; a probability value ≤0.05 was considered to indicate statistical significance.
The bivariate analyses were done and all covariate variables which have association with the outcome variables at p-value of 0.25 were selected for multivariate analysis.
Both multivariable logistic and linear regression models were used to isolate independent predictors of metabolic syndrome.
Multivariable Logistic and linear Regression analyses was used to compare components of metabolic syndrome and body composition by fasting status after adjusting for potential confounders
1/16/2016
23

Ethical Consideration
Before stating the research ethical review committee of Jimma University College
of Health Sciences was approved this research project.
And a letter of supports was obtained from the ethical board of Jimma University
College of Health Sciences and given to the head of Jimma university specialized
teaching hospital, Mettu Karl hospital Laboratory and JUCAN.
The nature of the study was fully explained to the study participant. After getting
permission from the study participant, written consent was obtained from each
study participant
Each study participant was informed about the research and if willing he/she was
reassured that confidentiality of information was maintained during data
collection, analysis, interpretation and publication of results.
1/16/2016
24

Result and Discussion
1/16/2016
25

Socio-demographic characteristics
Out of the total of 609 participants in the study 569 underwent all
the study components giving a response rate of 93.4%.
Male= 287(50.4%) and Females = 282(49.6%)
Age range between 20-30 (41.7% ) and 31-40(32.7%)
Ethnicity, 219(38.5%) were Oromo, 153(26.9%) were Amhara
Educational status, Illiterate or informal education accounted for
4(0.7%), while the majority, 565(99.3%) were literate
1/16/2016
26

Table 1:- Socio-demographic characteristics of study participants
from March to April 2015
1/16/2016
27
Characteristics Frequency(n=569) Percent
Sex
Female
Male
282
287
49.6
50.4
Ethnicity
Oromo
Amhara
Gurage
Dawero
Yem
Others(Tigre,Sidama ,Wolaita,Kafa)
219
153
32
47
38
80
38.5
26.9
5.6
8.3
6.7
14.1
Marital status
Married
Single
Divorced
Widowed
357
176
21
15
62.7
30.9
3.7
2.6
Age
20-30
31-40
>40
237
186
146
41.7
32.7
25.7
Household wealth tertiles
Poor
Medium
Rich
188
190
191
33.0
33.4
33.6

Religion
Orthodox
Protestant
Muslim
Others(Catholic,Wakefeta )
312
157
90
10
54.8
27.6
15.8
1.7
Animal source food Fasting
No
Yes
382
187
67.1
32.9
Educational Status
Primary and below
Secondary
Diploma
First degree
Second degrees & above
102
136
140
104
87
17.9
23.9
24.6
18.3
15.3
Main work status
Administrative staff
Academic staff
427
142
75
25
Region of childhood life
Amhara
Oromo
SNNPR
Addis Ababa
Others( Afar,Hararii,DireDawa,Tigray,Somali)
60
364
100
23
22
10.5
64
17.6
4
3.86
1/16/2016
28

Cont …
With regard to animal source food fasting a total of 187(32.9%) participants fasted animal
source food during the lent while the remaining did not.
1/16/2016
29
8.6
10.4
5
38.7
2.3
35.1
0 10 20 30 40 50
All animal source foods but not Fish
All animal source foods only
All animal souce foods but not fish+ allfoods up to lunch
All animal source foods + all foods upto lunch
All anima souce foods but not fish+ Allfoods up to 3:PM
All Animal source foods + Allfoods up to 3:PM
Figure 1:- Type of fasting among employs of Jimma University from March to April 2015

Cont …
There was a significant association between educational status
and fasting animal source foods (ASF) (p=0.005) and household
wealth tertile(p=0.002) and fasting ASF.
However, the study participants are similar in terms of other
variables including sex, age group, and marital status
1/16/2016
30

Table 2:- Socio demographic characteristics of the study participants from March to April
2015
1/16/2016
31
VARIABLES Fasting Animal Source foods P-value
Non-faster(n=382) Faster(n=187)
Educational status
Primary or Illiterate
Secondary
Diploma
Degree
Masters and above
66(17.3%)
75(19.6%)
99(25.9%)
79(20.7%)
63(16.5%)
36(19.3%)
61(32.6%)
41(21.9%)
25(13.4%)
24(12.8%)
0.005
Sex
Female
Male
184(48.2%)
198(51.9%)
98(52.4%)
89(47.6%)
0.342
Age group
20-30
31-40
>40
162(42.4%)
125(32.7%)
95(24.9%)
75(40.3%)
61(32.8%)
50(26.9%)
0.848
Marital Status
Married
Single
Divorced
Widowed
235(61.5%)
124(32.5%)
15(3.9%)
8(3.9%)
122(65.2%)
52(27.8%)
6(3.3%)
7(3.7%)
0.497
Household wealth tertiles
Poor
Medium
Rich
122(31.9%)
114(29.8%)
146(38.2%)
66(35.3%)
76(40.6%)
45(24.1%)
0.002

Table 3:- Life style characteristics of study among employs of
Jimma University by fasting status from a March to April 2015
Life styles Fasting Animal Source foods P-value
Non-faster(n=382) Faster(n=187)
Chewed Khat over the last 12 months
No
Yes
297(77.7%)
85(22.6%)
175(93.6%)
12(6.4%)
<0.0001
Fragmented slip
No
Yes, Some times
Yes, most of the time
157(41.1%)
190(49.7%)
35(9.2%)
67(35.8%)
109(58.3%)
11(5.9%)
0.116
Self rate of stress level in a typical week
No to little stress
Some to moderate stress
High to very high Stress
146(38.2%)
207(54.2%)
29(7.6%)
68(35.8%)
101(54%)
18(7.1%)
0.689
Consumption of alcohol within the past 12 months
No
Yes
251(65.7%)
131(34.3%)
53(28.3%)
134(71.7%)
<0.0001
Consumed of alcohol within the past 30 days
No
Yes
20(15.3%)
111(84.7%)
34(25.4%)
100(74.6%)
0.041
1/16/2016
32

Currently smoke any tobacco products, such as
cigarettes, cigars, shisha or pipes, Gaya
No
Yes
373(97.6%)
9(2.4%)
185(98.9%)
2(1.1%)
0.295
Vigorous physical activity for at least 10 minutes
continuously in a typical week
No
Yes
224(58.6%)
158(41.4%)
82(43.9%)
105(56.1%)
0.001
Consumption of salt or a salty sauce such as soya sauce /
Tomato sauce to your food right before you eat it
Never
Rarely
Some times
Often
Always
48(12.6%)
29(7.6%)
34(8.9%)
44(11.5%)
227(59.4%)
20(10.7%)
10(5.3%)
25(13.4%)
27(14.4%)
105(56.1%)
0.309
Consumption of Salt, salty seasoning or a salty sauce
added in cooking or preparing foods in your household
Never
Rarely
Some times
Often
Always
142(37.2%)
52(13.6%)
55(14.4%)
56(14.7%)
75(19.6%)
57(30.5%)
9(4.8%)
36(19.3%)
25(13.4%)
62(32.1%)
<0.0001
Number of days per week Khat was chwed (Mean ±SD) 2.52(1.78) 1.77(1.423) 0.150
Sleep Hour(Mean ±SD) 7.22(1.452) 7.895(6.1094) 0.035
Sitting Hour(Mean ±SD) 5.669(7.47891) 4.9701(6.613) 0.266
Drinking Coffee
Yes
No
331(86.6%)
51(13.2%)
147(78.6%)
40(21.4%)
0.0141/16/2016
33

Table 4:-Association of Fasting ASF with body measurements ,blood pressure Levels of
serum lipids and blood glucose of study participants from March to April 2015
1/16/2016
34
Variable Fasting
status
N Mean Std.
Deviation
P‐value
Weight Non Faster 382 64.24 12.33 <0.0001*
Faster 187 58.96 11.45
Body Mass Index Non Faster 382 23.63 4.60 <0.0001*
Faster 187 22.24 3.52
Waist Circumference Non Faster 382 83.00 12.41 0.043*
Faster 187 80.59 14.94
Hip Circumference Non Faster 382 96.03 16.18 <0.0001*
Faster 187 91.16 9.35
Systolic blood pressure Non Faster 382 116.52 12.81 0.894
Faster 187 116.36 14.02
Diastolic blood pressure Non Faster 382 77.54 8.89 0.583
Faster 187 77.08 10.44

Fat mass% Non Faster 382 30.60 11.97 0.022*
Faster 187 28.58 8.65
Lean body mass % Non Faster 382 69.22 12.18 0.098
Faster 187 70.82 10.11
Fasting glucose Non Faster 382 145.25 85.12 0.038*
Faster 187 130.07 79.69
High density lipoprotein Non Faster 382 63.28 47.59 0.605
Faster 187 60.97 54.53
Total cholesterol Non Faster 382 178.80 45.90 0.381
Faster 187 174.90 51.46
Low density lipoprotein Non Faster 382 87.01 62.15 0.875
Faster 187 87.92 68.98
Triglyceride Non Faster 382 102.07 36.55 0.015*
Faster 187 96.04 22.02
1/16/2016
35

1/16/201636
39.3%
35.4%
11.2%
22.8%24.6%
29.3%
0
5
10
15
20
25
30
35
40
45
Faster(P<0.0001) Non-Faster(P=0.007)
Male
Female
Total
Figure 2: -Prevalence of metabolic syndrome by sex and ASF fasting status among employees of Jimma University, March to April, 2015
Percent

1/16/201637
9.3%
27.9%
44.0%
16.0%
34.4%
45.3%
0.0%
5.0%
10.0%
15.0%
20.0%
25.0%
30.0%
35.0%
40.0%
45.0%
50.0%
20-30 yrs(P<0.001) 31-40yrs(P<0.001) >40 yrs(P<0.001)
Faster
Non-Faster
Percent
Figure 3:- Proportion study participants with metabolic syndrome by age and fasting
status from March to April 2015

Table 5:-Multivariable logistic regression model predicting Metabolic Syndrome among
Jimma University Employees from March to April 2015
1/16/2016
38
Predictors Metabolic Syndrome COR AOR 95% C.I. P
YES NO Lower Upper
Sex
Female
Male
53(18.8)
105(36.6)
229(81.2)
182(63.4)
1
2.493
1
2.188 1.333 3.589 0.002
Age group
20-30
31-40
>40
33(13.9)
60(32.3)
65(44.8)
204(86.1)
126(67.7)
80(55.2)
1
2.944
5.023
1
3.991
8.566
2.190
4.557
7.273
16.105
<0.0001
<0.0001
Drunk alcohol during
the last 12 months
No
Yes
71(23.4)
87(32.8)
233(76.6)
178(67.2)
1
1.604
1
2.319 1.356 3.964 0.002
Animal Source Food
Fasting
No
Yes
112(29.3)
46(24.6)
270(70.7)
141(75.4)
1
1.271
1
1.984 1.113 3.537 0.020
Household Wealth Tertile
Poor
Middle
Rich
31(16.5)
58(30.5)
69(36.1)
157(83.5)
132(69.5)
122(63.9)
1
2.225
2.864
1
1.467
1.619
0.798
0.845
2.696
3.103
0.217
0.146

Number of times Eating
protein source foods from
animals (mean ± sd)
2.04(1.773) 1.58(1.600) 1.171 1.182 1.026 1.361 0.020
Consumption of solidified
vegetable oil
No
Yes
38(27.7)
120(27.8)
99(72.3)
312(72.2)
1
1.025
1
2.121 1.157 3.889 0.015
Average cups of coffee
drunk per week during the
previous year(mean ± sd)
14.23(9.461) 13.69(9.552) 1.006 1.006 0.982 1.031 0.604
Have fragmented sleep
with multiple wakeup and
falling asleep cycles
No
Yes, sometimes
Yes, most of the time
61(27.2)
84(28.1)
13(28.3)
163(72.8)
215(71.9)
33(71.7)
1
1.044
1.053
1
1.075
1.442
0.658
0.570
1.759
3.649
0.772
0.439
Self reported stress level
No to little
Some to moderate
High to very high
70(32.7)
77(25.0)
11(23.4)
144(67.3)
231(75.0)
36(76.6)
1
0.686
0.629
1
0.706
0.492
0.439
0.191
1.136
1.270
0.151
0.143
1/16/2016
39
Hosmer Lemshow ‘s goodness-of-fit test produce chi-square of 4.163 with p-value of
0.842 and 8 degree of freedom hence the model was good for the data
Cont …
On a multivariable linear regression analyses, after
adjusting for other variables, ASF fasting, age, sex and
wealth index were significantly associated with
metabolic syndrome.
Fasting animal source foods was negatively associated
with fat mass percent(β= -2.226,P= 0.005).
1/16/2016
40

Cont …
Similarly, age(β= 0. 376, P<0.0001) and wealth index (β= 2.044,
P<0.0001) were positively associated with increase in fat mass
percent.
For an increase of age by one year fat mass%
increased by 0.376. Similarly, for an increase in wealth
index fat mass % increased by 2.044
1/16/2016
41

Table 6:- Multivariable linear regression model predicting fat mass percent
(adiposity) among employs of Jimma University March to April 2015
1/16/2016
42
Predictors
Unstandardized
Coefficients
P 95.0% C. I
B Std. Error Lower
Bound
Upper
Bound
ASF Fasting -2.226 0.792 0.005 -3.782 -0.670
Sex
Male -13.320 0.703 <0.0001 -14.759 -11.882
Female(Ref.)
Age(Yrs) 0. 376 0. 037 <0.0001 0.304 0.448
Wealth index 2.044 0.378 <0.0001 1.302 2.786
Alcohol drinking within
the past 12 months
Yes 0.335 0.749 0.655 -1.137 1.807
No(Ref.)
Eating fruit in a typical
week
0.126 0.218 0.564 -0.303 0.554

Eating protein source
foods from animals (beef,
lamb, chicken, fish,
egg)in a typical week,
0.594 0.226 0.009 0.150 1.039
Eating fried oil in a
typical week,
-0.209 0.250 0.402 -0.700 0.281
Hours sleep in a typical
day
-0.001 0.001 0.352 -0.004 0.002
Time spend sitting on a
typical day
0.001 0.001 0.148 0.000 0.003
Chewed Khat over the
last 12 months
Yes -0.465 0.927 0.616 -2.286 1.356
No(Ref.)
1/16/2016
43
Maximum VIF=1.275, Adjusted R2= 0.481,
ASF= Animal Source food.

Result & discussion ….
There was significant difference (P<0.0001) in metabolic syndrome
between fasters of ASF (24.6%) and non-fasters (29.3%)
Similarly, there was a significant difference (P=0.048),the study
done in Helsinki showed that the prevalence of metabolic
syndrome was 35.5% among fully fasted persons and among non-
fasting subjects 39.7%, (Jouko S, Jaana L, et al.2011).
1/16/2016
44

Cont …
Study participants who consume ASF were nearly 2 times
more likely have metabolic syndromes than those
individuals who don’t consume animal source (P= 0.020).
Similar findings were reported from studies in:
India-(Srinath Reddy K, Katan MB,2004) and
Brazil- (Azevedo et al, 2013)
1/16/2016
45

Cont …
The study done in India shows that consumption of animal fats on
the other hand leads to increased risk of metabolic syndrome as
saturated fats from animals and trans fats are incriminated to be the
main causes of metabolic syndrome (Srinath Reddy K, Katan
MB,2004)
A study in São Paulo, SP, Brazil done showed on obese individuals
have shown that intermittent fasting (IF) reduces oxidative stresses
(Azevedo et al, 2013) indicating that fasting animal source foods may
reduce the risk of metabolic syndrome.
1/16/2016
46

Cont …
Our finding showed that, alcohol consumption had statistically
significant association with metabolic syndrome.
Drinking alcohol during the last 12 months was 2.319 times more
likely to be associated metabolic syndrome.
On the contrary , there are published studies also describing
protective effects of alcohol on metabolic syndrome, J-shaped
relation between alcohol drinking and metabolic syndrome has
been reported (O. Clerc, D. Nanchen, J. Cornuz et al.,2010 and
L. L. N. Husemoen, T. Jørgensen,2010)
1/16/2016
47

Cont …
Limitation of the study
Measuring baseline and endline data for before-after comparison of
ASF fasting would have given a longitudinal data and fair
comparison of its effect, however, it could not be done due to time
constraints.
Strength of the study
All biochemical test done in quality instruments and fat mass was
measured by highly precise method (Air displacement
Platysmography).
Laboratory analyses were done in 3-star laboratory of Mettu Karl
Hospital.1/16/2016
48

CONCLUSION
The prevalence of metabolic syndrome high non-faster ASF as
compared to fasters.
Drinking alcohol, age, sex, frequency of ASF consumption in a
typical week and consumption of solidified vegetable oil, were
significant independent predictors of metabolic syndrome.
1/16/2016
49

Cont …
Fasters, as compared to non-faster animal source foods, had decreased
levels of TG, FBS, waist circumference, fat mass percent, hip
circumference and BMI.
Independent predictors of high Body fat Mass percent were:
Positive predictors: Age , ASF fasting, household wealth,
Alcohol drinking in the last 12 months
Negative predictor: Male sex
1/16/2016
50

RECOMMENDATION
Concerning major finding in order to control the problems of
metabolic syndromes among employees of JU the following points
are recommended for
The government
Ministry of health
JUSH, College of Health Sciences
Health Office of Jimma Town and
Other responsible bodies.
As metabolic syndrome is associated with killer diseases,
interventions on decreasing/avoidance of saturated fat and
alcohol consumption targeting males and middle aged adult
population need to be considered.
1/16/2016
51

Cont …
Behavioral change communications(BCC) on life style
modifications including reduction of
ASF consumption,
Alcohol consumption in moderation
Targeting those above 40 years as well as the general
population is very critical to curb the consequences of
metabolic syndrome and consequent chronic degenerative
diseases.
1/16/2016
52

Cont …
JUSH should screen individuals at risk of MetS to focus on
weight management and engage in appropriate physical activity
levels.
Moreover, future interventions by health policy makers and
public health officials ought to focus on the individuals at risk for
MetS who have one or two risk factors in order to control any
potential burden of the syndrome.
For researchers, future research should look in to the effect of
fasting ASF on body fat percent and risk of metabolic syndrome,
using a longitudinal study, quantification of the level of alcohol
intake, chewing khat and smoking practices of the last one
year should be considered.1/16/2016
53

References
1. S. Natarajan, et al. Fasting - a medico historical overview. International refereed journal of reviews and research, 2014; 2 (1): 2348 - 2001
2. Yach D, Hawkes C, Gould CL and Hofman KJ. The global burden of chronic diseases: overcoming impediments to prevention and control. JAMA 2004; 291:2616‐22.
3. WHO. World Health Report. Prevention Chronic Disease: A vital Investment. Geneva, Switzerland 2008.
4. Popkin BM. The nutrition transition in low‐income countries: an emerging crisis. Nutrition reviews 1994;52:285‐98.
5. Tran A, Gelaye B, Girma B, et al. Prevalence of Metabolic Syndrome among Working Adults in Ethiopia. International J. Hypertension, 2011; 193719.
6. Zimmet P, Alberti KG MM, Serrano RM. A new international diabetes federation worldwide definition of the metabolic syndrome: the rationale and the results. Rev Esp Cardiol, 2005; 58(12): 1371-6.
7. Azevedo FR, Ikeoka D, Caramelli B. Effects of intermittent fasting on metabolism in men. Rev Assoc Med Bras. 2013 Mar-Apr;59(2):167-73. doi: 10.1016/j.ramb.2012.09.003.
8. Dunkley AJ, Charles K, Gray LJ, Camosso-Stefinovic J, Davies MJ, Khunti K. Effectiveness of interventions for reducing diabetes and cardiovascular disease risk in people with metabolic syndrome: systematic review and mixed treatment comparison meta-analysis. Diabetes Obis Metab. 2012 Jul;14(7):616-25. doi: 10.1111/j.1463-1326.2012.01571.x. Epub 2012 Feb 21. 1/16/2016
54

ACKNOWLEDGMENTS
My deepest and heartfelt gratitude goes to my advisor for their constrictive
comments and in valuable advice throughout the development of this
research.
I express special thank to my family and entire friends and the study
participants for their willingness and participation in the study,
laboratory workers, research nurses, JUCAN, Metu Karl
hospital and others who participates the study.
Last but not least, I would really like to thank my mother and father who
have always prayed for my health and academic accomplishment.1/16/2016
55

1/16/2016
56