jinhui shipping & transportation limited 2010 presentation · 2010 presentation 25 february...
TRANSCRIPT

Jinhui Shipping & Transportation Limited
2010 Presentation
25 February 2011
Jinhui Shipping & Transportation Limited
2010 Presentation
25 February 2011
1

This presentation may contain forward looking statements. These statements are based upon various assumptions, many of which are based,in turn, upon further assumptions, including the Company’s management's examination of historical operating trends. Although the Companybelieves that these assumptions were reasonable when made, because assumptions are inherently subject to significant uncertainties whichare difficult or impossible to predict and are beyond its control, the Company cannot give assurance that it will achieve or accomplish theseexpectations, beliefs or targets.
Key risk factors that could cause actual results to differ materially from those discussed in this presentation will include but not limited to the wayworld economies, currencies and interest rate environment may evolve going forward, general market conditions including fluctuations incharter rates and vessel values, counterparty risk, changes in demand in the dry bulk market, changes in operating expenses including bunkerprices, crewing costs, drydocking and insurance costs, changes in governmental rules and regulations or actions taken by regulatory authorities,potential liability from pending or future litigation, general domestic and international political conditions, potential disruption of shipping routesdue to accidents, piracy or political events, and other important factors described from time to time in the reports filed by the Company.

• Year 2010 revenue: US$348 million
• Net profit for the year: US$87 million
• Basic earnings per share: US$1.033
• Gearing ratio as at 31 December 2010: 38%
Financial Highlights
• 5 newly built Supramaxes and 2 newly built Post-Panamaxes were delivered to the Group in the Year 2010
Fleet Development
3

Year 2010(Unaudited)
348,276
(74,033)
135,523
92,369
86,831
US$1.033
Year 2009(Audited)
349,340
-
195,522
161,484
153,842
US$1.830
YoY (%)
-0.3%
-
-30.7%
-42.8%
-43.6%
-43.6%
Q4 2010(Unaudited)
93,200
(74,033)
(21,620)
(33,277)
(34,780)
(US$0.414)
Q4 2009(Unaudited)
82,680
-
42,808
33,969
32,826
US$0.391
QoQ (%)
12.7%
-
-150.5%
-198.0%
-206.0%
-206.0%
US$’000
Revenue
Impairment loss on owned vessels and vessels under construction
EBITDA
Operating (loss) profit
Net (loss) profit for the period / year
Basic (loss) earnings per share
4

2010(Unaudited)
1,384,872
12.2%
6.6%
16.7X
24.5X
38.4%
2009(Audited)
1,232,216
26.0%
13.7%
21.1X
25.6X
45.4%
Total assets (US$’000)
Return on average equity (%)
Return on average assets (%)
Interest coverage (X)
EBITDA / Finance costs (X)
Net gearing (%)*
* = Total interest bearing debts – bank balances and cash – marketable securitiesShareholder’s equity
5

(1) As of the end of the specified period(2) Jinhui held 40% interest in 2 vessels
No. of Vessels Owned(1) Key Milestone
2005 Ranked 8th by Marine Money International for outstanding financialperformance in 2004
13
1994 Jinhui Shipping listed on Oslo Stock Exchange4
1991 Parent, Jinhui Holdings listed on Hong Kong Stock Exchange3(2)
Group founded1987 1
1992 Purchased a second-hand Handysize and acquired interests in two otherHandysizes
5
2000 Embarked on tonnage renewal program with newbuilds7
2002 Diversified into panamax class vessels in light of grain demand fromChina
11
2006 Further fleet renewal: Disposed of 5 vessels, (1 old Handymax, 2 oldHandysizes and 2 Panamaxes). Took delivery of 4 additional vessels.
12
2007 1st order in China - 8 Supramaxes from Shanghai Shipyard; Disposed ofa 2001 built Supramax at US$54mm
18
2008 Took delivery of 6 vessels; Disposed of 3 vessels21
2011 Took delivery of a vessel; additional 3 vessels to be delivered35
2010 Took delivery of 7 vessels31
2012 Additional 3 vessels to be delivered38
2009 Took delivery of 8 vessels; Disposed of 5 vessels24
2013 Additional 1 vessel to be delivered39
6

Current Fleet Type Size (dwt) Year Built Shipyard
1 Jin Lang Post-Panamax 93,279 2010 Jiangsu New Yangzi2 Jin Mei Post-Panamax 93,204 2010 Jiangsu New Yangzi3 Jin Rui Panamax 76,583 2009 Imabari4 Jin Han Supramax 60,414 2011 Oshima5 Jin Ming Supramax 61,414 2010 Oshima6 Jin Yang Supramax 57,982 2010 Tsuneishi7 Jin Yue Supramax 56,934 2010 Shanghai Shipyard8 Jin Ao Supramax 56,920 2010 Shanghai Shipyard9 Jin Heng Supramax 55,091 2010 Nantong Kawasaki
10 Jin Gang Supramax 56,927 2009 Shanghai Shipyard11 Jin Ji Supramax 56,913 2009 Shanghai Shipyard12 Jin Wan Supramax 56,897 2009 Shanghai Shipyard13 Jin Jun Supramax 56,887 2009 Shanghai Shipyard14 Jin Mao Supramax 54,768 2009 Oshima15 Jin Shun Supramax 54,768 2009 Oshima16 Jin Sui Supramax 56,968 2008 Shanghai Shipyard17 Jin Tong Supramax 56,952 2008 Shanghai Shipyard18 Jin Yuan Supramax 55,496 2007 Oshima19 Jin Yi Supramax 55,496 2007 Oshima20 Jin Xing Supramax 55,496 2007 Oshima21 Jin Sheng Supramax 52,050 2006 IHI22 Jin Yao Supramax 52,050 2004 IHI23 Jin Cheng Supramax 52,961 2003 Oshima24 Jin Quan Supramax 51,104 2002 Oshima25 Jin Ping Supramax 50,777 2002 Oshima26 Jin Fu Supramax 50,777 2001 Oshima27 Jin Li Supramax 50,777 2001 Oshima28 Jin Zhou Supramax 50,209 2001 Mitsui29 Jin An Supramax 50,786 2000 Oshima30 Jin Hui Supramax 50,777 2000 Oshima31 Jin Rong Supramax 50,236 2000 Mitsui32 Jin Bi Handymax 48,220 2000 Oshima
Total Capacity of Owned Vessels:
1,841,113 dwt
Average Age: 4.72 years
Owned Vessels
7

Chartered-in Vessels
Golden Shui 2009
Scope 2006
Capesize
Capesize
169,333
174,008
May-09
Jul-08
Feb-14
Apr-13
Name of Vessel Type Size (dwt) Year Built Charter in date Expiry
Red Lily 2004Panamax 76,500 Sep-04 Sep-11
Tenmyo Maru 2008
2
1
3
4
5 Aston Trader 2008
Supramax
Supramax
58,470
55,496
Nov-08
Jun-09
Oct-13
May-11
Total Capacity of Chartered-in Vessels: 533,807 dwtAverage Age: 4.0 years
As of 24 February 2011
8

Name Type Built Size (dwt)Expecteddelivery
Total Capacity of Ordered Vessels: 407,748 dwt
Vessels to be Delivered
Builder
As of 24 February 2011
1 Jin Chao Panamax 2011 75,000 Apr 2011 Sasebo
2 Jin Hong Supramax 2011 60,500 Apr 2011 Oshima
3 Jin Feng Supramax 2011 57,700 Jun 2011 STX (Dalian)
4 Jin Ze Supramax 2012 57,948 Mar 2012 Tsuneishi
5 Jin Yu Handysize 2012 38,000 Jun 2012 Naikai Zosen
6 Jin Xiang Supramax 2012 60,500 Sep 2012 Oshima
7 Jin Qing Supramax 2013 58,100 Feb 2013 Tsuneishi
9

-
20.0
40.0
60.0
80.0
100.0
120.0
140.0
2011 2012 2013
95.4
- -
19.2
80.9
-
16.2
27.0
Year
2013 Delivery
2012 Delivery
2011 Delivery
Capital expenditure represented 7 vessels to be delivered to the Group in year 2011 to 2013
1 Supramax
As of 24 Feb 2011,Undrawn credit facilities: US$101 million
Ready cash on hand: US$177 million
1 Panamax2 Supramaxes
1 Handysize2 Supramaxes
10

0
1
2
3
4
5
6
7
8
9
10 2010 2009
* Including steaming coal and coking coal
Cargo Volume by Cargo Types
Million Tonnes
Cargo Volume by Cargo Types2010 vs 2009
0%
20%
40%
60%
80%
100%
49%
28%
11%
3%
2%
6%1%
Alumina
Cement
Fertilizer
Steel Products
Agricultural Products
Coal*
Minerals
11

0
20
40
60
80
100
120
140
US$
in M
illio
n
2010 2009
Chartering Revenue by Loading Port2010 vs 2009
Chartering Revenue by Loading Port
0%
20%
40%
60%
80%
100%
28%
16%
6%5%
9%
8%
26%
2%
OthersSouth AmericaNorth AmericaEuropeChinaAfricaAustraliaAsia excluding China
12

Chartering Revenue by Discharging Port2010 vs 2009
Chartering Revenue by Discharging Port
0%
20%
40%
60%
80%
100%
31%
6%
45%
5%2%6%5%
Others
South America
North America
Europe
China
Africa
Asia excluding China
0
20
40
60
80
100
120
140
160
180
200
US$
in M
illion
2010 2009
13

Supramax / Handymax
- 60% coverage- TCE $27,221
- 33% coverage- TCE $30,784
Capesize*
- 76% coverage- TCE $73,641
- 50% coverage- TCE $51,908
Post-Panamax / Panamax
- 51% coverage- TCE $25,852
- 26% coverage- TCE $38,200
TCE = Daily Time Charter Equivalent Rate
2011
2012
2011 2011
2012 2012
14
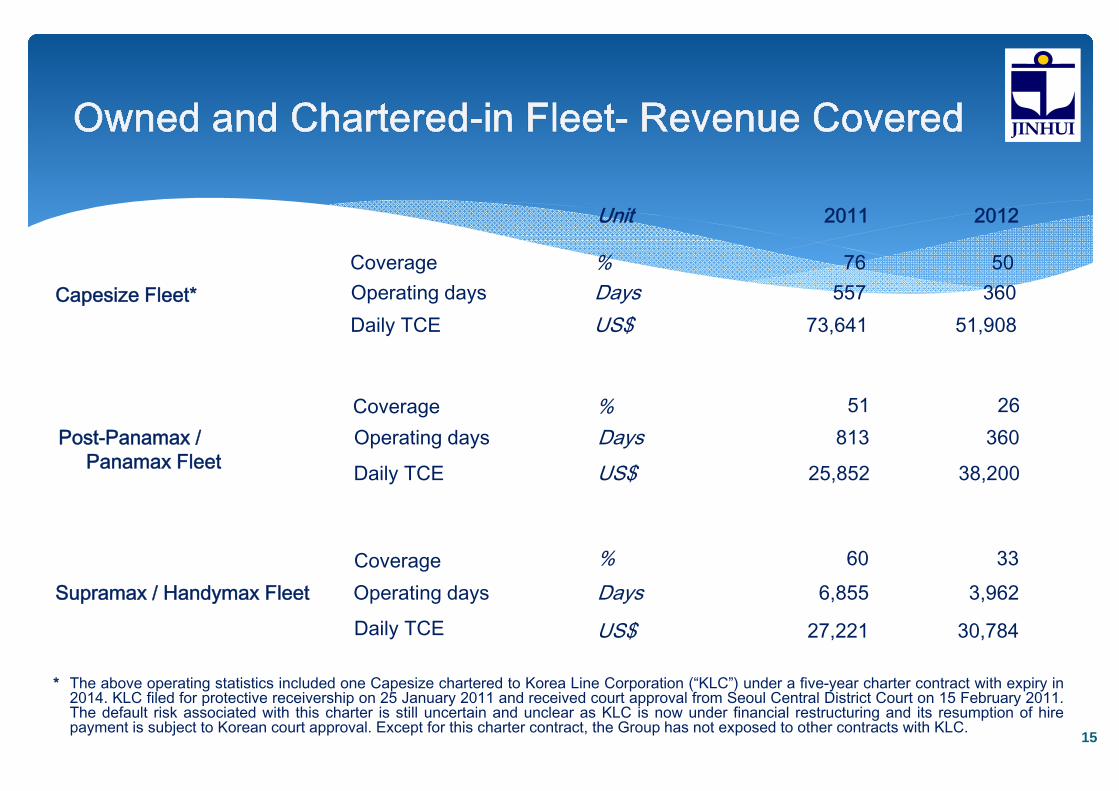
The above operating statistics included one Capesize chartered to Korea Line Corporation (“KLC”) under a five-year charter contract with expiry in2014. KLC filed for protective receivership on 25 January 2011 and received court approval from Seoul Central District Court on 15 February 2011.The default risk associated with this charter is still uncertain and unclear as KLC is now under financial restructuring and its resumption of hirepayment is subject to Korean court approval. Except for this charter contract, the Group has not exposed to other contracts with KLC.
*
30,78427,221US$Daily TCE
Post-Panamax /Panamax Fleet
2012Unit
3,9626,855DaysOperating daysSupramax / Handymax Fleet
38,20025,852US$Daily TCE
360813DaysOperating days
51,90873,641US$Daily TCE360557DaysOperating daysCapesize Fleet*
2011
76 50%Coverage
3360%Coverage
2651%Coverage
15
The above operating statistics included one Capesize chartered to Korea Line Corporation (“KLC”) under a five-year charter contract with expiry in2014. KLC filed for protective receivership on 25 January 2011 and received court approval from Seoul Central District Court on 15 February 2011.The default risk associated with this charter is still uncertain and unclear as KLC is now under financial restructuring and its resumption of hirepayment is subject to Korean court approval. Except for this charter contract, the Group has not exposed to other contracts with KLC.
*

US$5,481 US$5,717
US$3,659US$3,825
US$914 US$541
-
2,000
4,000
6,000
8,000
10,000
12,000
2009 2010
Opex Depreciation Finance Cost
US$ 10,083US$ 10,054
Daily Cost = Operating Expenses + Depreciation + Finance Costs
Operating expenses include crew expenses, insurance, dry-docking written off, consumable stores, spare parts, repairs and maintenance.
Maintaining low cost structure
US$
16

36,00031,680US$Daily TCE cost
366500DaysOperating daysSupramax Fleet
N/A22,500US$Daily TCE cost
N/A259DaysOperating daysPanamax Fleet
40,75040,750US$Daily TCE cost
732730DaysOperating daysCapesize Fleet
20122011Unit
17

• Supply of vessels remains to outpace expected demand
• Asset value under pressure. Further impairment cannot be ruled out
• Increased counterparty risks expected
• Smaller vessels expected to have relative better performance goingforward
• KLC’s situation expected to trigger further volatility in the already feeblefreight market
• Interesting opportunities may surface in S & P market
Overall, we remain to be cautious
18