jk.sv.170510-001 - pt dwikarya sejati utama (bilingual...
TRANSCRIPT

This report is originally issued in Bahasa Indonesia
No. JK/SV/170510-001 10 Mei 2017 No. JK/SV/170510-001 10 May 2017
Kepada Yth. To:
PT GOLDEN ENERGY MINES Tbk Sinar Mas Land Plaza Menara II Lt. 6 Jl. M.H. Thamrin No. 51 Jakarta Pusat 10350
PT GOLDEN ENERGY MINES Tbk Sinar Mas Land Plaza Menara II 6th Floor Jl. M.H. Thamrin No. 51 Jakarta Pusat 10350
U.p. : Direksi Attention to : Director
Hal : Ringkasan Penilaian 100,00% Saham
PT Dwikarya Sejati Utama Subject : Summary of the Valuation of 100.00%
Shares of PT Dwikarya Sejati Utama
Dengan hormat, Dear Sir/Madam,
Kantor Jasa Penilai Publik (selanjutnya disebut “KJPP”) Jennywati, Kusnanto & rekan (selanjutnya disebut “JKR” atau “kami”) mendapat penugasan dari manajemen
PT Golden Energy Mines Tbk (selanjutnya disebut “Perseroan”) untuk memberikan pendapat sebagai
penilai independen atas nilai pasar wajar 100,00% saham PT Dwikarya Sejati Utama (selanjutnya disebut “DSU”).
Penugasan kami tersebut sesuai dengan surat penawaran kami No. JK/170206-003 tanggal 6 Februari 2017 yang telah disetujui oleh manajemen Perseroan.
Kantor Jasa Penilai Publik (hereinafter referred to as "KJPP") Jennywati, Kusnanto & rekan (hereinafter referred to as "JKR" or "we") have been assigned by the management of PT Golden Energy Mines Tbk (hereinafter referred to as the “Company") to give an opinion as independent appraisers, on the fair market value of 100.00% shares of PT Dwikarya Sejati Utama (hereinafter referred to as “DSU”). Our assignment was in accordance to our engagement letter No. JK/170206-003 dated 6 February 2017 which was approved by the Company's management.
Selanjutnya, kami sebagai KJPP resmi berdasarkan Keputusan Menteri Keuangan No. 2.09.0022 tanggal 24 Maret 2009 dan terdaftar sebagai kantor jasa profesi penunjang pasar modal di Badan Pengawas Pasar Modal dan Lembaga Keuangan (selanjutnya disebut “Bapepam-LK”) dengan Surat Tanda Terdaftar Profesi Penunjang
Pasar Modal dari Bapepam-LK No. 05/BL/STTD-P/B/2010 (penilai bisnis), menyatakan bahwa kami telah meneliti dan menilai nilai pasar wajar 100,00% saham DSU (selanjutnya disebut “Obyek Penilaian”) dengan
tujuan untuk mengungkapkan pendapat mengenai nilai pasar wajar Obyek Penilaian pada tanggal 31 Desember 2016.
Therefore, we, as registered KJPP based on the Ministry of Finance Decree No. 2.09.0022 dated 24 March 2009 and listed as a capital market supporting profession of the Capital Market and Financial Institutions Supervisory Agency (hereinafter referred to as "Bapepam-LK") under Registered Letter of Capital Market Supporting Profession of Bapepam-LK No. 05/BL/STTD-P/B/2010 (business appraisers), expressed that we have investigated and performed the valuation of the fair market value of 100.00% shares of DSU (hereinafter referred to as the “Valuation Object”) for the purpose of expressing opinion on the fair market value of the Valuation Object as of 31 December 2016.

This report is originally issued in Bahasa Indonesia
ii
ALASAN DAN LATAR BELAKANG RENCANA AKUISISI REASONS AND BACKGROUND OF THE PROPOSED ACQUISITION
Perseroan merupakan perseroan terbatas berstatus perusahaan terbuka, didirikan dan menjalankan kegiatan usahanya di Indonesia. Ruang lingkup kegiatan Perseroan adalah bergerak dalam bidang pertambangan melalui penyertaan pada entitas anaknya dan perdagangan batubara serta perdagangan lainnya. Perseroan memulai kegiatan komersialnya pada tahun 2010. Pada tanggal 4 Februari 2011, berdasarkan Keputusan Menteri Energi dan Sumber Daya Mineral No. 206.K./30/DJB/2011, Perseroan memperoleh Ijin Usaha Pertambangan Operasi Produksi Khusus untuk Pengangkutan dan Penjualan Batubara untuk jangka waktu 3 tahun dan berdasarkan Keputusan Menteri Energi dan Sumber Daya Mineral No. 358.K/30/DJB/2014 tanggal 7 April 2014, jangka waktu tersebut diperpanjang selama 3 tahun. Perseroan berkantor pusat di Sinar Mas Land Plaza, Menara II Lantai 6, Jalan M.H. Thamrin Kavling 51, Jakarta Pusat 10350 dengan nomor telepon: (021) 50186 888 dan nomor faksimili: (021) 31990 319 serta alamat website: www.goldenenergymines.com.
The Company is a publicly-held limited liability company, established and operates its business in Indonesia. The scope of activities of the Company is engaged in coal mining through its subsidiaries and in coal and other trading activities. The Company started its commercial operations in 2010. On 4 February 2011, based on the Decision of the Ministry of Energy and Mineral Resource No. 206.K./30/DJB/2011, the Company obtained Particular License of IUP Operation Production for Transportation and Trade of Coal which is valid for 3 years and based on the Decision of the Ministry of Energy and Mineral Resource No. 358.K/30/DJB/2014 dated 7 April 2014, the period has been extended for another 3 years. The Company’s main office is located in Jakarta and located at Sinar Mas Land Plaza, Tower II, 6th Floor, Jalan M.H. Thamrin Kavling 51, Jakarta Pusat 10350, with telephone number: (021) 50186 888, faximile number: (021) 31990 319 and website: www.goldenenergymines.com.
Berdasarkan keterangan yang diperoleh dari manajemen Perseroan, pada tanggal 31 Desember 2016, GMR Energy (Netherlands) B.V. (selanjutnya disebut “GEBV”)
dan GMR Infastructure (Overseas) Limited (selanjutnya disebut “GIL”) memiliki beberapa penyertaan saham
dengan rincian sebagai berikut:
Based on the information from the Company’s management, as of 31 December 2016, GMR Energy (Netherlands) B.V. (hereinafter referred to as “GEBV”) dan GMR Infastructure (Overseas) Limited (hereinafter reffered to as “GIL”) has some subsidiaries with the details are as follows:
• GIL dan GEBV memiliki 100,00% dari seluruh modal ditempatkan dan disetor dalam PT Unsoco (selanjutnya disebut “UNSOCO”) dimana sebanyak
99.000 lembar saham atau setara dengan 99,00% dimiliki oleh GEBV dan sisanya sebanyak 1.000 lembar saham atau setara dengan 1,00% dimiliki oleh GIL (selanjutnya disebut “Saham UNSOCO”);
• GIL and GEBV own the 100.00% of the total issued and paid up capital of PT Unsoco (hereinafter referred to as “UNSOCO”) where 99.000 shares or equivalent to 99,00% owned by GEBV and the remaining 1.000 shares or equivalent of 1.00% owned by GIL (hereinafter referred to as “UNSOCO Shares”);
• GIL dan GEBV memiliki 100,00% dari seluruh modal ditempatkan dan disetor dalam DSU dimana sebanyak 999 lembar saham atau setara dengan 99,90% dimiliki oleh GEBV dan sisanya sebanyak 1 lembar saham atau setara dengan 0,10% dimiliki oleh GIL (“Saham DSU”);
• GIL and GEBV own the 100.00% of the total issued and paid up capital of DSU where 999 shares or equivalent to 99,90% owned by GEBV and the remaining 1 share or equivalent of 0.10% owned by GIL (hereinafter referred to as “DSU Shares”);
• GIL dan GEBV melalui DSU memiliki 100,00% dari seluruh modal ditempatkan dan disetor dalam PT Duta Sarana Internusa (selanjutnya disebut “DSI”) dimana sebanyak 990 lembar saham atau
setara dengan 99,00% dimiliki oleh DSU dan sisanya sebanyak 10 lembar saham atau setara dengan 1,00% dimiliki oleh GIL (selanjutnya disebut “Saham DSI”); dan
• GIL and GEBV through DSU own the 100.00% of the total issued and paid up capital of PT Duta Sarana Internusa (hereinafter referred to as “DSI”) where 990 shares or equivalent to 99,00% owned by DSU and the remaining 10 share or equivalent of 1.00% owned by GIL (hereinafter referred to as “DSI Shares”); and

This report is originally issued in Bahasa Indonesia
iii
• GIL dan GEBV melalui DSU, DSI serta UNSOCO memiliki 100,00% dari seluruh modal ditempatkan dan disetor dalam PT Barasentosa Lestari (selanjutnya disebut “BSL”) dimana sebanyak 3.324
lembar saham atau setara dengan 94,97% dimiliki oleh DSI, sebanyak 1 lembar saham atau setara dengan 0,03% dimiliki oleh UNSOCO, dan sisanya sebanyak 175 lembar saham atau setara dengan 5,00% dimiliki oleh GIL (selanjutnya disebut “Saham BSL”).
• GIL and GEBV through DSU, DSI as well as UNSOCO own the 100.00% of the total issued and paid up capital of PT Barasentosa Lestari (hereinafter referred to as ”BSL”) where 3,324 shares or equivalent to 94.97% owned by DSI, 1 share or equivalent to 0.03% owned by UNSOCO, and the remaining 175 shares or equivalent of 5.00% owned by GIL (hereinafter refereed to as “BSL Shares”).
Struktur kepemilikan GIL dan GEBV pada tanggal 31 Desember 2016 adalah sebagai berikut:
The ownership structure of GIL and GEBV as of 31 December 2016 are as follows:
UNSOCO merupakan perseroan terbatas berstatus perusahaan tertutup, didirikan dan menjalankan kegiatan usahanya di Indonesia. Ruang lingkup kegiatan UNSOCO adalah bergerak dalam bidang jasa konsultasi manajemen. Pada tanggal 31 Desember 2016, UNSOCO belum memulai kegiatan operasional.
UNSOCO is a privately-held limited liability company, established and operates its business in Indonesia. The scope of activities of UNSOCO is engaged in management consultant services. As of 31 December 2016, UNSOCO has not commenced its commercial operations.
DSU merupakan perseroan terbatas berstatus perusahaan tertutup, didirikan dan menjalankan kegiatan usahanya di Indonesia. Ruang lingkup kegiatan DSU adalah bergerak dalam bidang modal ventura dan jasa konsultasi manajemen.
DSU is a privately-held limited liability company, established and operates its business in Indonesia. The scope of activities of DSU is engaged in venture capital and management consultant.
DSI merupakan perseroan terbatas berstatus perusahaan tertutup, didirikan dan menjalankan kegiatan usahanya di Indonesia. Ruang lingkup kegiatan DSI adalah bergerak dalam bidang yang meliputi bisnis dan manajemen konsultasi yang meliputi manajemen, jasa konsultasi, saran dan bantuan operasional, perencanaan, pengawasan, evaluasi dan strategi investasi dan pengembangan usaha, analisis dan kelayakan studi layanan bisnis dan kegiatan usaha terkait.
DSI is a privately-held limited liability company, established and operates its business in Indonesia. The scope of activities of DSI is engaged in service industry which covers business and management consultation which cover management, consultation services, advice and operational help, planning, supervising, evaluate and investment and business development strategy, analysis and feasibilities study of business services and related business activities.
99,00% 1,00% 99,90% 0,10%
1,00% 99,00%
0,03% 94,97% 5,00%
GILGEBV
DSI
BSL
UNSOCO DSU

This report is originally issued in Bahasa Indonesia
iv
BSL merupakan perseroan terbatas berstatus perusahaan tertutup, didirikan dan menjalankan kegiatan usahanya di Indonesia. Ruang lingkup kegiatan BSL adalah bergerak dalam bidang pertambangan batubara dan pengembangan pembangkit listrik mulut tambang. Pada tanggal 28 Juli 2010, BSL telah mendapatkan persetujuan tahap konstruksi dari Direktur Jenderal Geologi dan Sumber Daya Mineral No. 449.K/30/DJB/2010. Persetujuan dari tahap konstruksi diberikan untuk KW96PBO159 dengan luas area sebesar 24.385 hektar di Kabupaten Musi Banyuasin dan Musi Rawas, Propinsi Sumatera Selatan untuk periode 30 Juli 2009 sampai dengan 29 Juli 2012. Selanjutnya, berdasarkan Surat Keputusan No 718.K/30/DJB/2011 tanggal 31 Maret 2011, Direktur Jenderal Geologi dan Sumber Daya Mineral telah menyetujui awal tahap produksi yang berlaku selama 30 tahun.
BSL is a privately-held limited liability company, established and operates its business in Indonesia. The scope of activities of BSL is engaged in coal mining and developing a mine-mouth power plant. As of 28 July 2010, BSL has received construction stage approval from Director General of Geology and Mineral Resources No. 449.K/30/DJB/2010. The approval of construction stage is granted for KW96PBO159 area of 24,385 hectares in Musi Banyuasin and Musi Rawas Regencies, South Sumatra Province for the period from 30 July 2009 up to 29 July 2012. Furthermore, based on Decree No. 718.K/30/DJB/2011 dated 31 March 2011, the Director General of Geology and Mineral Resources has approved the beginning of the production phase which is valid for 30 years.
Berdasarkan keterangan manajemen Perseroan, DSU memiliki mandatory convertible bonds kepada GEBV dengan nilai sebesar USD 6,31 juta (selanjutnya disebut “MCB DSU 1”) dan mandatory convertible bonds kepada
GIL dengan nilai sebesar USD 0,06 juta (selanjutnya disebut “MCB DSU 2”). Mandatory convertible bonds
tersebut memberikan hak kepada pemiliknya untuk menukarkan obligasi dengan saham dalam DSU dengan nilai nominal Rp 1.000.000 per lembar saham.
Based on the Company’s management information, DSU has a mandatory convertible bonds owned by GEBV with value of USD 6.31 million (hereinafter referred to as “MCB DSU 1”) and a mandatory convertible bonds owned by GIL with value of USD 0.06 million (hereinafter referred to as “MCB DSU 2”). The mandatory convertible bonds grants the owner the rights to redeem the bonds with shares in the DSU at a nominal value of Rp 1.000.000 per share.
Sejalan dengan rencana strategis Perseroan untuk mengembangkan kegiatan usahanya serta meningkatan sumber daya dan cadangan batubaranya termasuk peningkatan kapasitas produksi yang diharapkan dapat meningkatkan kinerja keuangan Perseroan pada masa mendatang, Perseroan merencanakan untuk melakukan akuisisi atas Saham BSL, Saham DSI, Saham DSU, Saham UNSOCO, MCB DSU 1, dan MCB DSU 2 (selanjutnya disebut “Saham dan MCB”) dari GIL dan
GEBV, pihak yang terafiliasi dengan Perseroan (selanjutnya disebut “Rencana Akuisisi”).
In line with the Company's strategic plan to expand its business activities and increase its coal resources and reserves including increased production capacity which is expected to improve the Company's financial performance in the future, the Company plans to acquired BSL Shares, DSI Shares, DSU Shares, UNSOCO Shares, MCB DSU 1, dan MCB DSU 2 (hereinafter referred to as “Shares and MCB”) from GIL and GEBV, an afilited party with the Company (hereinafter referreed to as “Proposed Acquisition”).
In line with the Company's strategic plan to expand its business activities and increase its coal resources and reserves including increased production capacity which is expected to improve the Company's financial performance in the future, the Company plans to acquired BSL Shares, DSI Shares, DSU Shares, UNSOCO Shares, MCB DSU 1, dan MCB DSU 2 (hereinafter referred to as “Shares and MCB”) from GIL and GEBV, an afilited party with the Company (hereinafter referreed to as “Proposed Acquisition”).
Alasan dilakukannya Rencana Akuisisi adalah sebagai berikut:
Reasons for the Proposed Acquisition are as follows:
• Sejalan dengan rencana strategis Perseroan untuk mengembangkan kegiatan usahanya serta meningkatan sumber daya dan cadangan batubaranya termasuk peningkatan kapasitas produksi yang diharapkan dapat meningkatkan kinerja keuangan Perseroan pada masa mendatang, Perseroan merencanakan untuk melakukan Rencana Akuisisi.
• In line with the Company's strategic plan to expand its business activities and increase its coal resources and reserves including increased production capacity which is expected to improve the Company's financial performance in the future, the Company plans to perform the Proposed Acquisition.

This report is originally issued in Bahasa Indonesia
v
• Dengan dilakukannya Rencana Akuisisi, maka Perseroan berpotensi membukukan pendapatan atas pendapatan BSL melalui UNSOCO dan DSU pada masa mendatang yang diharapkan dapat memberikan kontribusi positif terhadap laporan keuangan konsolidasian Perseroan, dimana setelah Rencana Akuisisi menjadi efektif, Perseroan akan memiliki penyertaan saham pada BSL secara tidak langsung melalui UNSOCO dan DSU dengan kepemilikan efektif sebesar 100,00%.
• With the Proposed Acquisition, the Company has the potential to post earnings on BSL’s revenue through UNSOCO and DSU in the future which is expected to contribute positively to the consolidated financial statements of the Company, whereby after the Proposed Acquisition becomes effective, the Company will have indirect shares participation in BSL through UNSOCO and DSU with the effective ownesrship of 100.00%.
Berdasarkan keterangan yang diperoleh dari manajemen Perseroan, mengingat GIL dan GEBV merupakan pihak yang terafiliasi dengan Perseroan, maka Rencana Akuisisi tersebut merupakan transaksi afiliasi sebagaimana diatur dalam Peraturan Bapepam-LK No. IX.E.1 tentang “Transaksi Afiliasi dan Benturan Kepentingan Transaksi Tertentu” yang dimuat dalam Keputusan Ketua Bapepam-LK No. Kep-412/BL/2009 tanggal 25 November 2009 (selanjutnya disebut “Peraturan IX.E.1”).
Based on the information from the Company’s management, considering GIL and GEBV is an afilited parties with the Company, so the Proposed Acquisition is an affiliated transaction as stipulated in Bapepam-LK Rule No. IX.E.1 concerning "Affiliated and Conflict of Interest in Certain Transaction" as contained in the Decree of the Chairman of Bapepam-LK No. Kep-412/BL/2009 dated 25 November 2009 (hereinafter referred to as "Rule IX.E.1").
Selanjutnya, berdasarkan keterangan yang diperoleh dari manajemen Perseroan, Rencana Akuisisi tersebut merupakan transaksi material, sehingga Perseroan harus memenuhi Peraturan Bapepam-LK No. IX.E.2 tentang “Transaksi Material dan Perubahan Kegiatan Usaha Utama” yang dimuat dalam Keputusan Ketua Bapepam-LK No. Kep-614/BL/2011 tanggal 28 November 2011 (selanjutnya disebut “Peraturan IX.E.2”).
Based on the information from the Company’s management, the Proposed Acquisition is a material transaction that the Company has to comply with Bapepam-LK Rule No. IX.E.2 concerning "Material Transaction and Changes in Core Business Activities" as contained in the Decree of the Chairman of Bapepam-LK No. Kep-614/BL/2011 dated 28 November 2011 (hereinafter referred to as "Rule IX.E.2").
Untuk transaksi yang tergolong dalam kategori transaksi afiliasi dan transaksi material, Peraturan IX.E.1 dan Peraturan IX.E.2 mensyaratkan adanya laporan penilaian atas Obyek Penilaian, yang disiapkan oleh penilai independen.
For transactions categorized as afiliated transaction and material transactions, Rule IX.E.1 dan Rule IX.E.2 requires the valuation report of the Valuation Object, prepared by independent appraisers.
Dengan demikian, dalam rangka pelaksanaan Rencana Akuisisi tersebut, maka manajemen Perseroan menunjuk penilai independen, JKR untuk melakukan penilaian atas Obyek Penilaian.
Therefore, in accordance with the implementation of the Proposed Acquisition, the Company’s management has appointed JKR as independent appraisers to perform the valuation of the Valuation Object.
Mengingat DSU adalah perusahaan tertutup yang sahamnya tidak dapat diperjualbelikan di pasar modal, maka saham DSU bersifat tidak likuid.
Considering that DSU is a privately-held company, whose shares are unable to be traded in the stock market, therefore DSU’s shares are illiquid.
PREMIS PENILAIAN THE VALUATION PREMISE
Kami telah melakukan penilaian atas nilai pasar wajar Obyek Penilaian dengan premis penilaian bahwa DSU adalah sebuah perusahaan yang “going-concern”.
We have performed the valuation on the fair market value of the Valuation Object with the premise that DSU is a "going-concern" company.
This report is originally issued in Bahasa Indonesia
vi
TUJUAN DAN MAKSUD PENILAIAN THE OBJECTIVE AND PURPOSE OF THE VALUATION
Tujuan penilaian adalah untuk memperoleh pendapat yang bersifat independen tentang nilai pasar wajar dari Obyek Penilaian yang dinyatakan dalam mata uang USD dan/atau ekuivalensinya pada tanggal 31 Desember 2016.
The objective of the valuation is to obtain an independent opinion on the fair market value of the Valuation Object stated in USD and/or its equivalency as of 31 December 2016.
Maksud dari penilaian adalah untuk memberikan gambaran tentang nilai pasar wajar dari Obyek Penilaian yang selanjutnya akan digunakan sebagai rujukan dan pertimbangan oleh manajemen Perseroan dalam rangka pelaksanaan Rencana Akuisisi serta untuk memenuhi Peraturan IX.E.1 dan Peraturan IX.E.2.
The purpose of the valuation is to provide an overview on the fair market value of the Valuation Object which would then be used as a reference and consideration by the Company's management in accordance with the implementation of the Proposed Acquisition and to comply with the Rule IX.E.1 and Rule IX.E.2.
Penilaian ini dilaksanakan dengan memenuhi ketentuan-ketentuan dalam Peraturan Bapepam-LK No. VIII.C.3 tentang “Pedoman Penilaian dan Penyajian Laporan Penilaian Usaha di Pasar Modal” yang dimuat dalam Keputusan Ketua Bapepam-LK No. Kep-196/BL/2012 tanggal 19 April 2012 (selanjutnya disebut “Peraturan VIII.C.3”) dan Standar Penilaian Indonesia (selanjutnya disebut “SPI”) 2015.
This valuation was performed in compliance with the provisions of Bapepam-LK Rule No. VIII.C.3 concerning “Guidelines for Valuation and Presentation of Business Valuation Report in Capital Markets” as contained in the Decree of the Chairman of Bapepam-LK No. Kep-196/BL/2012 dated 19 April 2012 (hereinafter referred to as "Rule VIII.C.3") as well as Indonesian Valuation Standards (hereinafter referred to as "SPI") 2015.
DEFINISI NILAI YANG DIGUNAKAN DEFINITION OF THE VALUE USED
Untuk keperluan penilaian Obyek Penilaian, dasar nilai yang sesuai untuk digunakan dalam penilaian Obyek Penilaian ini adalah nilai pasar wajar, dimana berdasarkan Peraturan VIII.C.3, nilai pasar wajar didefinisikan sebagai “perkiraan jumlah uang pada tanggal penilaian (cut-off date) yang dapat diperoleh dari suatu transaksi jual beli obyek penilaian, antara pembeli yang berminat membeli (willing buyer) dan penjual yang berminat menjual (willing seller) dalam suatu transaksi yang bersifat layak dan wajar”.
For the valuation of the Valuation Object, the appropriate value standard to be used in this valuation is fair market value, which is based on Rule VIII.C.3, fair market value is defined as “the estimated amount of money which can be obtained from the sale and purchase transaction of the valuation object on the valuation date (cut-off date), between buyer who is interested in buying (willing buyer) and seller who is interested in selling (willing seller) in a proper and fair transaction”.
INDEPENDENSI PENILAI THE INDEPENDENCY OF APPRAISERS
Dalam mempersiapkan laporan penilaian, JKR bertindak secara independen tanpa adanya benturan kepentingan dan tidak terafiliasi dengan Perseroan dan DSU ataupun pihak-pihak yang terafiliasi dengan Perseroan dan DSU. JKR juga tidak memiliki kepentingan ataupun keuntungan pribadi terkait dengan penugasan ini. Selanjutnya, laporan penilaian ini tidak dilakukan untuk memberikan keuntungan atau merugikan pihak manapun. Imbalan yang kami terima adalah sama sekali tidak dipengaruhi oleh nilai yang dihasilkan dari proses analisa penilaian ini dan JKR hanya menerima imbalan sesuai dengan surat penugasan No. JK/170206-003 tanggal 6 Februari 2017 yang telah disetujui oleh manajemen Perseroan.
In preparing the valuation report, JKR acted independently without any conflict of interests and were not affiliated with the Company and DSU or the parties affiliated with the Company and DSU. JKR also had no interest or personal advantage associated with this assignment. In addition, this valuation report was not performed to advantage or disadvantage any party. The compensation we received was not affected by the value generated from the analysis process of this valuation and JKR only received the compensation in accordance with JKR’s engagement letter No. JK/170206-003 dated 6 February 2017 which was approved by the Company's management.

This report is originally issued in Bahasa Indonesia
vii
TANGGAL EFEKTIF PENILAIAN THE EFFECTIVE DATE OF VALUATION
Nilai pasar wajar Obyek Penilaian dalam penilaian diperhitungkan pada tanggal 31 Desember 2016. Tanggal ini dipilih atas dasar pertimbangan kepentingan dan tujuan penilaian serta dari data keuangan DSU yang kami terima. Data keuangan tersebut berupa laporan keuangan konsolidasian DSU untuk periode sembilan bulan yang berakhir pada tanggal 31 Desember 2016 yang menjadi dasar penilaian ini.
The fair market value of the Valuation Object in the valuation was calculated as of 31 December 2016. This date was selected based on the consideration of interests and the objective of the valuation as well as the financial data of DSU that we have received. The financial data was DSU’s consolidated financial statements for nine months period ended 31 December 2016, which became the basis of this valuation.
JENIS LAPORAN TYPE OF REPORT
Jenis laporan penilaian 100,00% saham PT Dwikarya Sejati Utama ini merupakan laporan terperinci.
The type of the valuation report of 100.00% shares of PT Dwikarya Sejati Utama is detailed report.
KEJADIAN PENTING SETELAH TANGGAL PENILAIAN
(SUBSEQUENT EVENTS) SIGNIFICANT EVENTS AFTER THE DATE OF VALUATION
(SUBSEQUENT EVENTS)
Berdasarkan ketarangan yang diperoleh dari manajemen Perseroan, dari tanggal penilaian, yaitu tanggal 31 Desember 2016, sampai dengan tanggal diterbitkannya laporan penilaian 100,00% saham PT Dwikarya Sejati Utama, tidak terdapat kejadian penting setelah tanggal penilaian (subsequent events) yang secara signifikan dapat mempengaruhi penilaian nilai pasar wajar Obyek Penilaian.
Based on the information from the Company’s management, from the date of valuation, i.e. 31 December 2016, until the date of issuance of the valuation report of 100.00% shares of PT Dwikarya Sejati Utama, there were no significant events after the valuation date (subsequent events) that would significantly affect the fair market value of the Valuation Object.
RUANG LINGKUP SCOPE OF WORKS
Dalam melakukan penilaian untuk memperkirakan nilai pasar wajar Obyek Penilaian, kami telah menelaah, mempertimbangkan, mengacu atau melaksanakan prosedur atas data dan informasi sebagai berikut:
In performing the valuation to estimate the fair market value of the Valuation Object, we have reviewed, considered, referred or performed the procedures on the data and information as follows:
1. Keterbukaan Informasi sehubungan dengan
Rencana Akuisisi yang disusun oleh manajemen Perseroan;
1. Information Disclosure in relation with the Proposed Acquisition prepared by the Company’s management;
2. Laporan keuangan konsolidasian DSU untuk periode
sembilan bulan yang berakhir pada tanggal 31 Desember 2016 yang telah diaudit oleh Kantor Akuntan Publik (selanjutnya disebut “KAP”) Gani Sigiro & Handayani (selanjutnya disebut “GSH”)
sebagaimana tertuang dalam laporannya No. O-001/GSH/17/EA tanggal 6 Februari 2017 dengan pendapat wajar tanpa pengecualian;
2. Consolidated financial statements of DSU for nine months period ended 31 December 2016 audited by Public Accountant Firm (hereinafter referred to as “KAP”) Gani Sigiro & Handayani (hereinafter referred to as “GSH”) as stated in report No. O-001/GSH/17/EA dated 6 February 2017 with an unqualified opinion;
3. Laporan keuangan konsolidasian DSU untuk tahun
yang berakhir pada tanggal 31 Maret 2016 yang telah diaudit oleh KAP GSH sebagaimana tertuang dalam laporannya No. A-142/GSH/16/EA tanggal 15 April 2016 dengan pendapat wajar tanpa pengecualian;
3. Consolidated financial statements of DSU for the year ended 31 March 2016 audited by KAP GSH as stated in report No. A-142/GSH/16/EA dated 15 April 2016 with an unqualified opinion;

This report is originally issued in Bahasa Indonesia
viii
4. Laporan keuangan konsolidasian DSU untuk tahun
yang berakhir pada tanggal 31 Maret 2015 yang telah diaudit oleh KAP GSH sebagaimana tertuang dalam laporannya No. A-152/GSH/15/VTS tanggal 21 April 2015 dengan pendapat wajar tanpa pengecualian;
4. Consolidated financial statements of DSU for the year ended 31 March 2015 audited by KAP GSH as stated in report No. A-152/GSH/15/VTS dated 21 April 2015 with an unqualified opinion;
5. Laporan keuangan konsolidasian DSU untuk tahun
yang berakhir pada tanggal 31 Maret 2014 yang telah diaudit oleh KAP GSH sebagaimana tertuang dalam laporannya No. A-089/GSH/14/CP tanggal 23 April 2014 dengan pendapat wajar tanpa pengecualian;
5. Consolidated financial statements of DSU for the year ended 31 March 2014 audited by KAP GSH as stated in report No. A-089/GSH/14/CP dated 23 April 2014 with an unqualified opinion;
6. Laporan keuangan konsolidasian DSU untuk tahun
yang berakhir pada tanggal 31 Maret 2013 dengan angka perbandingan untuk tahun yang berakhir pada tanggal 31 Maret 2012 yang telah diaudit oleh KAP Gani Mulyadi & Handayani (selanjutnya disebut “GMH”) sebagaimana tertuang dalam laporannya No.
A-084/GMH/13/EA tanggal 15 April 2013 dengan pendapat wajar tanpa pengecualian;
6. Consolidated financial statements of DSU for the year ended 31 March 2013 with the comparable figures for the year ended 31 March 2012 audited by KAP Gani Mulyadi & Handayani (hereinafter referred to as “GMH”) as stated in report No. A-084/GMH/13/EA dated 15 April 2013 with an unqualified opinion;
7. Laporan keuangan konsolidasian DSI untuk periode
sembilan bulan yang berakhir pada tanggal 31 Desember 2016 yang telah diaudit oleh KAP GSH sebagaimana tertuang dalam laporannya No. A-026/GSH/17/EA tanggal 15 Februari 2017 dengan pendapat wajar tanpa pengecualian;
7. Consolidated financial statements of DSI for nine months period ended 31 December 2016 audited by KAP GSH as stated in report No. A-026/GSH/17/EA dated 15 February 2017 with an unqualified opinion;
8. Laporan keuangan BSL untuk periode sembilan
bulan yang berakhir pada tanggal 31 Desember 2016 yang telah diaudit oleh KAP GSH sebagaimana tertuang dalam laporannya No. A-020/GSH/17/EA tanggal 14 Februari 2017 dengan pendapat wajar tanpa pengecualian;
8. Financial statements of BSL for nine months period ended 31 December 2016 audited by KAP GSH as stated in report No. A-020/GSH/17/EA dated 14 February 2017 with an unqualified opinion;
9. Laporan keuangan BSL untuk tahun yang berakhir
pada tanggal 31 Maret 2016 yang telah diaudit oleh KAP GSH sebagaimana tertuang dalam laporannya No. A-140/GSH/16/EA tanggal 13 April 2016 dengan pendapat wajar tanpa pengecualian;
9. Financial statements of BSL for the years ended 31 March 2016 audited by KAP GSH as stated in report No. A-140/GSH/16/EA dated 13 April 2016 with an unqualified opinion;
10. Laporan keuangan BSL untuk tahun yang berakhir
pada tanggal 31 Maret 2015 yang telah diaudit oleh KAP GSH sebagaimana tertuang dalam laporannya No. A-150/GSH/15/VTS tanggal 19 April 2015 dengan pendapat wajar tanpa pengecualian;
10. Financial statements of BSL for the years ended 31 March 2015 audited by KAP GSH as stated in report No. A-150/GSH/15/VTS dated 19 April 2015 with an unqualified opinion;
11. Laporan keuangan BSL untuk tahun yang berakhir
pada tanggal 31 Maret 2014 yang telah diaudit oleh KAP GSH sebagaimana tertuang dalam laporannya No. A-134/GSH/14/CP tanggal 21 April 2014 dengan pendapat wajar tanpa pengecualian;
11. Financial statements of BSL for the years ended 31 March 2014 audited by KAP GSH as stated in report No. A-134/GSH/14/CP dated 21 April 2014 with an unqualified opinion;

This report is originally issued in Bahasa Indonesia
ix
12. Laporan keuangan BSL untuk tahun yang berakhir
pada tanggal 31 Maret 2013 yang telah diaudit oleh KAP GMH sebagaimana tertuang dalam laporannya No. A-082/GMH/13/EA tanggal 15 April 2013 dengan pendapat wajar tanpa pengecualian;
12. Financial statements of BSL for the years ended 31 March 2013 audited by KAP GMH as stated in report No. A-082/GMH/13/EA dated 15 April 2013 with an unqualified opinion;
13. Laporan keuangan BSL untuk tahun yang berakhir
pada tanggal 31 Maret 2012 yang telah diaudit oleh KAP GMH sebagaimana tertuang dalam laporannya No. A-093/GMH/12/EA tanggal 20 April 2012 dengan pendapat wajar tanpa pengecualian;
13. Financial statements of BSL for the years ended 31 March 2012 audited by KAP GMH as stated in report No. A-093/GMH/12/EA dated 20 April 2012 with an unqualified opinion;
14. Proyeksi laporan keuangan BSL untuk tahun yang
berakhir pada tanggal-tanggal 31 Desember 2017 – 2039 yang disusun oleh manajemen BSL;
14. Financial statements projections of BSL for the years ended 31 December 2017 – 2039 prepared by BSL’s management;
15. PT Bara Sentosa Lestari Project – Independent
Qualified Person’s Report South Block – March 2017
sebagaimana tertuang dalam laporannya tanggal 20 Maret 2017;
15. PT Bara Sentosa Lestari Project – Independent Qualified Person’s Report South Block – March 2017 dated 20 March 2017;
16. Anggaran dasar DSU yang terakhir sebagaimana
dinyatakan dalam akta No. 4 tanggal 23 Juli 2008 dari Zulfiah Tenri Abeng, S.H., M.Hum., M.Kn., notaris di Jakarta mengenai perubahan anggaran dasar DSU untuk disesuaikan dengan Undang-Undang No. 40 Tahun 2007 mengenai Perseroan Terbatas;
16. Recent articles of association of DSU as stated in deed No. 4 dated 23 July 2008 Zulfiah Tenri Abeng, S.H., M.Hum., M.Kn., notary in Jakarta regarding the amandment of the DSU articles of association to confirm with Law No. 40 Year 2007 regarding Limited Liability Company;
17. Hasil wawancara dengan pihak manajemen
Perseroan, yaitu Kumar Krishnan dengan posisi sebagai Direktur, mengenai alasan, latar belakang dan hal-hal lain yang terkait dengan Rencana Akuisisi;
17. Interviews with the Company’s management, i.e. Kumar Krishnan as Director, concerning the reasons, background and other matters related to the Proposed Acquisition;
18. Tarif pajak yang diberlakukan atas BSL adalah
berdasarkan laba kena pajak dalam periode yang bersangkutan yang dihitung berdasarkan tarif pajak yang berlaku umum, yaitu sebesar 25,00%;
18. The tax rate applied on BSL is based on taxable income for the period which is calculated based on the applicable general tax rate of Indonesia, i.e. 25.00%;
19. Informasi lain dari pihak manajemen Perseroan dan
DSU serta pihak-pihak lain yang relevan untuk penugasan;
19. Other information from the management of the Company and DSU as well as other parties relevant to the assignment;
20. Data dan informasi industri berdasarkan media cetak
maupun elektronik, antara lain website Aswath Damodaran, website Bank Indonesia, website Bursa Efek Indonesia dan Bloomberg;
20. Industrial data and information based on both newspapers and electronic media, i.e. website of Aswath Damodaran, website of Bank of Indonesia, website of Indonesia Stock Exchange and Bloomberg;
21. Data dan informasi pasar berdasarkan media cetak
maupun elektronik, antara lain website Aswath Damodaran, website Bank Indonesia, website Bursa Efek Indonesia dan Bloomberg;
21. Market data and information based on both newspapers and electronic media, i.e. website of Aswath Damodaran, website of Bank of Indonesia, website of Indonesia Stock Exchange and Bloomberg;

This report is originally issued in Bahasa Indonesia
x
22. Data dan informasi ekonomi berdasarkan media
cetak maupun elektronik, antara lain website Aswath Damodaran, website Bank Indonesia, website Bursa Efek Indonesia dan Bloomberg;
22. Economic data and information based on both newspapers and electronic media, i.e. website of Aswath Damodaran, website of Bank of Indonesia, website of Indonesia Stock Exchange and Bloomberg;
23. Dokumen-dokumen lain yang berhubungan dengan
Rencana Akuisisi; dan 23. Other documents related to the Proposed
Acquisition; and
24. Berbagai sumber informasi baik berdasarkan media cetak maupun elektronik dan hasil analisa lain yang kami anggap relevan.
24. Various relevant sources of information on both newspapers and electronic media and other analysis we considered relevant.
Dalam melaksanakan analisa, kami mengasumsikan dan bergantung pada keakuratan dan kelengkapan dari semua informasi keuangan dan informasi-informasi lain yang diberikan kepada kami oleh Perseroan dan DSU atau yang tersedia secara umum dan kami tidak bertanggung jawab atas kebenaran informasi-informasi tersebut.
In performing the analysis, we assumed and relied on the accuracy and completeness of all financial information and other information provided to us by the Company and DSU or publicly available and we are not responsible for the accuracy of such information.
Kami tidak memberikan pendapat atas dampak perpajakan dari DSU. Jasa-jasa yang kami berikan kepada Perseroan hanya merupakan penilaian atas Obyek Penilaian dan bukan jasa-jasa akuntansi, audit atau perpajakan. Pekerjaan kami yang berkaitan dengan penilaian tidak merupakan dan tidak dapat ditafsirkan merupakan dalam bentuk apapun, suatu penelaahan atau audit atau pelaksanaan prosedur-prosedur tertentu atas informasi keuangan. Pekerjaan tersebut juga tidak dapat dimaksudkan untuk mengungkapkan kelemahan dalam pengendalian internal, kesalahan atau penyimpangan dalam laporan keuangan atau pelanggaran hukum. Selain itu, kami tidak mempunyai kewenangan dan tidak mencoba mendapatkan bentuk transaksi-transaksi lainnya yang dilakukan Perseroan.
We did not give an opinion on the tax impact of DSU. The service we provided to the Company merely was the valuation of the Valuation Object, not accounting services, auditing or taxation. Our work related to the valuation was not and could not be interpreted in any form, a review or an audit or an implementation of certain procedures of financial information. The work was also not intended to reveal weaknesses in internal control, errors or irregularities in the financial statements or violation of law. In addition, we did not have the authority and did not attempt to obtain other forms of transactions performed by the Company.
KONDISI PEMBATAS DAN ASUMSI-ASUMSI POKOK LIMITING CONDITIONS AND MAJOR ASSUMPTIONS
Penilaian ini disusun berdasarkan kondisi pasar dan perekonomian, kondisi umum bisnis dan keuangan serta peraturan-peraturan Pemerintah yang berlaku sampai dengan tanggal penerbitan laporan penilaian ini.
This valuation was prepared based on the market and economic conditions, general business and financial conditions as well as applicable government regulations until the date of issuance of this valuation report.

This report is originally issued in Bahasa Indonesia
xi
Penilaian Obyek Penilaian yang dilakukan dengan metode diskonto pendapatan ekonomi mendatang didasarkan pada proyeksi laporan keuangan BSL yang disusun oleh manajemen BSL. Dalam penyusunan proyeksi laporan keuangan, berbagai asumsi dikembangkan berdasarkan kinerja BSL pada tahun-tahun sebelumnya dan berdasarkan rencana manajemen di masa yang akan datang. Kami telah melakukan penyesuaian terhadap proyeksi laporan keuangan tersebut agar dapat menggambarkan kondisi operasi dan kinerja BSL yang dinilai pada saat penilaian ini dengan lebih wajar. Secara garis besar, tidak ada penyesuaian yang signifikan yang kami lakukan terhadap target kinerja BSL yang dinilai. Kami bertanggung jawab atas pelaksanaan penilaian dan kewajaran proyeksi laporan keuangan berdasarkan kinerja historis BSL dan informasi manajemen BSL terhadap proyeksi laporan keuangan BSL tersebut. Kami juga bertanggung jawab atas laporan penilaian BSL dan kesimpulan nilai akhir.
The valuation of the Valuation Object performed with discounted future economic income method was based on financial statements projections prepared by the management of BSL. In preparing the financial statements projections, various assumptions were developed based on the performance of BSL in previous years and management’s plan for the future. We have made some adjustments to the financial statements projections in order to describe the operating conditions and performance of BSL more fairly during the valuation. Overall, there were not any significant adjustments have been applied to the performance targets of BSL. We are responsible for the valuation and the fairness of the financial statements projections based on historical performance of BSL and the information from the management of BSL to such financial statements projections. We are also responsible for the valuation report of BSL and the final value conclusion.
Dalam penugasan penilaian ini, kami mengasumsikan terpenuhinya semua kondisi dan kewajiban Perseroan. Kami juga mengasumsikan bahwa dari tanggal penilaian sampai dengan tanggal diterbitkannya laporan penilaian tidak terjadi perubahan apapun yang berpengaruh secara material terhadap asumsi-asumsi yang digunakan dalam penilaian. Kami tidak bertanggung jawab untuk menegaskan kembali atau melengkapi, memutakhirkan pendapat kami karena adanya perubahan asumsi dan kondisi serta peristiwa-peristiwa yang terjadi setelah tanggal surat ini.
In the valuation assignment, we assumed the fulfillment of all conditions and obligations of the Company. We also assumed that from the date of the valuation until the date of issuance of the valuation report, there were no changes that could materially affect the assumptions used in the valuation. We are not responsible to reaffirm or to supplement or to update our opinion due to the changes in the assumptions and conditions as well as events occuring after the letter date.
Dalam melaksanakan analisa, kami mengasumsikan dan bergantung pada keakuratan, kehandalan dan kelengkapan dari semua informasi keuangan dan informasi-informasi lain yang diberikan kepada kami oleh Perseroan dan DSU atau yang tersedia secara umum yang pada hakekatnya adalah benar, lengkap dan tidak menyesatkan dan kami tidak bertanggung jawab untuk melakukan pemeriksaan independen terhadap informasi-informasi tersebut. Kami juga bergantung kepada jaminan dari manajemen Perseroan dan DSU bahwa mereka tidak mengetahui fakta-fakta yang menyebabkan informasi-informasi yang diberikan kepada kami menjadi tidak lengkap atau menyesatkan.
In performing the analysis, we assumed and relied on the accuracy, reliability and completeness of all financial information and other information provided to us by the Company and DSU or publicly available which were essentially true, complete and not misleading and we are not responsible to perform an independent investigation of such information. We also relied on assurances from the management of the Company and DSU that they did not know the facts which led to the information given to us to be incomplete or misleading.
Analisa penilaian Obyek Penilaian dipersiapkan menggunakan data dan informasi sebagaimana diungkapkan di atas. Segala perubahan atas data dan informasi tersebut dapat mempengaruhi hasil akhir pendapat kami secara material. Kami tidak bertanggung jawab atas perubahan kesimpulan atas penilaian kami maupun segala kehilangan, kerusakan, biaya ataupun pengeluaran apapun yang disebabkan oleh ketidakterbukaan informasi sehingga data yang kami peroleh menjadi tidak lengkap dan atau dapat disalahartikan.
The valuation analysis of the Valuation Object was prepared using the data and information as disclosed above. Any changes to the data and information may materially affect the outcome of our opinion. We are not responsible for the changes in the conclusions of our valuation as well as any losses, damages, costs or expenses caused by undisclosed information which led the data obtained to be incomplete and/or could be misinterpreted.
This report is originally issued in Bahasa Indonesia
xii
Karena hasil dari penilaian kami sangat tergantung dari data serta asumsi-asumsi yang mendasarinya, perubahan pada sumber data serta asumsi sesuai data pasar akan merubah hasil dari penilaian kami. Oleh karena itu, kami sampaikan bahwa perubahan terhadap data yang digunakan dapat berpengaruh terhadap hasil penilaian dan bahwa perbedaan yang terjadi dapat bernilai material. Walaupun isi dari laporan penilaian ini telah dilaksanakan dengan itikad baik dan dengan cara yang profesional, kami tidak dapat menerima tanggung jawab atas kemungkinan terjadinya perbedaan kesimpulan yang disebabkan oleh adanya analisa tambahan, diaplikasikannya hasil penilaian sebagai dasar untuk melakukan analisa transaksi ataupun adanya perubahan dalam data yang dijadikan sebagai dasar penilaian. Laporan penilaian Obyek Penilaian bersifat non-disclaimer opinion dan merupakan laporan yang terbuka untuk publik kecuali terdapat informasi yang bersifat rahasia, yang dapat mempengaruhi operasional Perseroan dan DSU.
Since the result of our valuation extremely depended on the data and the underlying assumptions, the changes in the data sources and assumptions based on market data would change the result of our valuation. Therefore, we stated that the changes to the data used could affect the result of the valuation and that such differences could be material. Although the content of this valuation report had been prepared in good faith and in a professional manner, we are unable to accept the responsibility for the possibility of the differences in our conclusion caused by additional analysis, the application of the valuation result as a basis to perform the analysis of the transaction or any changes in the data used as the basis of the valuation. The valuation report of the Valuation Object represents a non-disclaimer opinion and is an open-for-public report unless there were confidential information on such report, which might affect the operation of the Company and DSU.
Pekerjaan kami yang berkaitan dengan penilaian Obyek Penilaian tidak merupakan dan tidak dapat ditafsirkan dalam bentuk apapun, suatu penelaahan atau audit atau pelaksanaan prosedur-prosedur tertentu atas informasi keuangan. Pekerjaan tersebut juga tidak dapat dimaksudkan untuk mengungkapkan kelemahan dalam pengendalian internal, kesalahan atau penyimpangan dalam laporan keuangan atau pelanggaran hukum. Selanjutnya, kami juga telah memperoleh informasi atas status hukum DSU berdasarkan anggaran dasar DSU.
Our work related to the valuation of the Valuation Object was not and could not be interpreted in any form, a review or an audit or an implementation of certain procedures of financial information. The work was also not intended to reveal weaknesses in internal control, errors or irregularities in the financial statements or violation of law. Furthermore, we have also obtained the information on the legal status of the Company and DSU based on the articles of association of DSU.
TINGKAT KEDALAMAN INVESTIGASI DEPTH OF INVESTIGATION
Dalam menyusun laporan penilaian Obyek Penilaian, JKR diberikan kesempatan untuk melakukan inspeksi guna mendukung proses penyusunan laporan penilaian Obyek Penilaian.
In preparing the valuation report of Valuation Object, JKR is given an opportunity to conduct inspections to support the process of preparing the valuation report of Valuation Object
PENDEKATAN PENILAIAN YANG DIGUNAKAN THE VALUATION APPROACHES APPLIED
Penilaian Obyek Penilaian didasarkan pada analisa internal dan eksternal. Analisa internal akan berdasarkan pada data yang disediakan oleh manajemen, analisa historis atas laporan posisi keuangan dan laporan laba rugi komprehensif BSL, pengkajian atas kondisi operasi dan manajemen serta sumber daya yang dimiliki BSL. Prospek BSL di masa yang akan datang kami evaluasi berdasarkan rencana usaha serta proyeksi laporan keuangan yang diberikan oleh manajemen yang telah kami kaji kewajaran dan konsistensinya. Analisa eksternal didasarkan pada kajian singkat terhadap faktor-faktor eksternal yang dipertimbangkan sebagai penggerak nilai (value drivers) termasuk juga kajian singkat atas prospek
dari industri yang bersangkutan.
The valuation of the Valuation Object relied on internal and external analysis. Internal analysis was performed based on the data provided by the management, historical analysis on BSL’s statements of financial position and statements of comprehensive income, review of BSL’s operating conditions and management as well as resources. BSL’s prospect in the future was evaluated based on the business plans and financial statements projections provided by the management that we have reviewed the fairness and consistency. External analysis was performed based on brief review on external factors considered as the value drivers, including a brief review on the prospects of the related industry.

This report is originally issued in Bahasa Indonesia
xiii
Dalam mengaplikasikan metode penilaian untuk menentukan indikasi nilai pasar wajar suatu “business interest” perlu beracuan pada laporan keuangan (laporan posisi keuangan dan laporan laba rugi komprehensif) yang representatif, oleh karenanya diperlukan penyesuaian terhadap nilai buku laporan posisi keuangan dan normalisasi keuntungan laporan laba rugi komprehensif yang biasanya disusun oleh manajemen berdasarkan nilai historis. Betapapun nilai buku suatu perusahaan yang direfleksikan dalam laporan posisi keuangan dan laporan laba rugi komprehensif adalah nilai perolehan dan tidak mencerminkan nilai ekonomis yang dapat sepenuhnya dijadikan acuan sebagai nilai pasar wajar saat penilaian tersebut.
In applying the valuation methods to determine the indicative fair market value of a "business interest", it is essential to rely on representative financial statements (statements of financial position and statements of comprehensive income), therefore adjustments are required on the net book value of statements of financial position and the normalization of profit of statements of comprehensive income which are commonly prepared by the management based on historical figures. The company's book value as reflected in statements of financial position and statements of comprehensive income represents the acquisition value and does not reflect the economic value that can be used fully as a reference of the company’s fair market value during the valuation.
METODE PENILAIAN YANG DIGUNAKAN THE VALUATION METHODS APPLIED
Metode penilaian yang digunakan dalam penilaian Obyek Penilaian adalah metode diskonto pendapatan ekonomi mendatang, metode akumulasi aset dan metode pembanding perusahaan terbuka.
The valuation methods applied in the valuation of the Valuation Object were discounted future economic income method, asset accumulation method and guideline publicly traded company method.
Metode diskonto pendapatan ekonomi mendatang dipilih mengingat bahwa kegiatan usaha yang dilaksanakan oleh BSL di masa depan masih akan berfluktuasi sesuai dengan perkiraan atas perkembangan usaha BSL. Dalam melaksanakan penilaian dengan metode ini, operasi BSL diproyeksikan sesuai dengan perkiraan atas perkembangan usaha BSL. Pendapatan ekonomi mendatang yang dihasilkan berdasarkan proyeksi laporan keuangan dikonversi menjadi nilai kini dengan tingkat diskonto yang sesuai dengan tingkat risiko. Indikasi nilai adalah total nilai kini dari pendapatan ekonomi mendatang tersebut.
Discounted future economic income method was used considering that the operations carried out by BSL in the future will still fluctuate according to the estimated BSL’s business development. In performing the valuation through this method, BSL’s operations were projected based on the estimated BSL’s business development. Future cash flows generated by financial statements projections were converted into the present value using an appropriate discount rate to the level of risks. Indicative value was the total present value of future cash flows.
Dalam melaksanakan penilaian dengan metode akumulasi aset, nilai dari semua komponen aset dan liabilitas/utang harus disesuaikan menjadi nilai pasar atau nilai pasar wajarnya, kecuali untuk komponen-komponen yang telah menunjukkan nilai pasarnya (seperti kas/bank atau utang bank). Nilai pasar keseluruhan perusahaan kemudian diperoleh dengan menghitung selisih antara nilai pasar seluruh aset (berwujud maupun tak berwujud) dan nilai pasar liabilitas.
In performing the valuation using asset accumulation method, the value of all components of assets and liabilities should be adjusted to its market value or its fair market value, except for component that has indicated its market value (such as cash/bank or bank loan). Overall market value of the company was then obtained by calculating the difference between the market value of all assets (tangible and intangible) and the market value of liabilities.
Metode pembanding peruahaan terbuka digunakan dalam penilaian ini karena walaupun di pasar saham perusahaan terbuka tidak diperoleh informasi mengenai perusahaan sejenis dengan skala usaha dan aset yang setara, namun diperkirakan data saham perusahaan terbuka yang ada dapat digunakan sebagai data perbandingan atas nilai saham yang dimiliki oleh DSU.
Guideline publicly traded company method was used in the valuation despite the unavailability of information for similar companies with similar business scale and assets in public comapnies stock market, but it is expected that the available public companies stock data could be used as comparative data for the value of shares owned by DSU.

This report is originally issued in Bahasa Indonesia
xiv
Pendekatan dan metode penilaian di atas adalah yang kami anggap paling sesuai untuk diaplikasikan dalam penugasan ini dan telah disepakati oleh pihak manajemen DSU. Tidak tertutup kemungkinan untuk diaplikasikannya pendekatan dan metode penilaian lain yang dapat memberikan hasil yang berbeda.
The approaches and valuation methods above were considered to be the most suitable to be applied in this assignment and had been approved by the management of DSU. It is possible that application of other valuation approaches and methods may give different results.
Selanjutnya, nilai-nilai yang diperoleh dari tiap-tiap metode tersebut direkonsiliasi dengan melakukan pembobotan.
Furthermore, the values obtained from each methods are reconciled by weighting.
RINGKASAN HASIL PENILAIAN THE VALUATION SUMMARIES
Berdasarkan analisa yang telah dilakukan, ringkasan hasil penilaian kami adalah sebagai berikut:
Based on the analysis we have performed, summaries of the results of our valuation are as follows:
I. Nilai Pasar Wajar 100,00% Saham DSU
Berdasarkan Metode Akumulasi Aset I. Fair Market Value of 100.00% Shares of DSU
Based on Assets Accumulation Method
Pada penilaian ini, kami melakukan penilaian atas indikasi nilai pasar wajar penyertaan saham pada entitas anak yang tercatat pada laporan posisi keuangan DSU pada tanggal 31 Desember 2016. Perhitungan indikasi nilai pasar penyertaan saham pada DSI yang tercatat dalam laporan keuangan DSU pada tanggal 31 Desember 2016 dilakukan dengan metode akumulasi aset.
In this valuation, we performed the valuation of indicative market value of investment in subsidiaries recorded in the statements of financial position of DSU as of 31 December 2016. The calculation of indicative fair market value of investment in DSI recorded in the statements of financial position of DSU as of 31 December 2016 was performed by applying asset accumulation method.
Dengan menggunakan metode akumulasi aset, diperoleh hasil bahwa indikasi nilai pasar wajar 100,00% saham DSI adalah sebesar USD 72,17 juta.
By applying asset accumulation method, the indicative fair market value of 100.00% shares of DSI was USD 72.17 million.
Berdasarkan penilaian tersebut, maka indikasi nilai pasar wajar 99,00% saham DSI per tanggal 31 Desember 2016 adalah sebesar USD 71,45 juta. Apabila indikasi nilai pasar wajar penyertaan saham pada entitas anak tersebut direfleksikan dalam laporan posisi keuangan, maka jumlah aset DSU adalah sebesar USD 77,83 juta, sedangkan jumlah liabilitas DSU adalah tetap, yaitu sebesar USD 0,05 juta.
Based on the valuation, indicative fair market value of 99.00% shares of DSI as of 31 December 2016 was USD 71.45 million. If the indicative fair market value of the investment in subsidiaries is reflected to the statements of financial position, total assets of DSU was USD 77.83 million, while total liabilities of DSU is fixed, i.e. was USD 0.05 million.
Indikasi nilai pasar wajar 100,00% saham DSU kemudian diperoleh dengan menghitung selisih antara nilai seluruh aset dan liabilitas. Dengan demikian, pada tanggal 31 Desember 2016, indikasi nilai pasar wajar 100,00% saham DSU sebelum diskon likuiditas pasar adalah sebesar USD 77,78 juta. Dengan diskon likuiditas pasar sebesar 20,00%, maka nilai pasar wajar 100,00% saham DSU adalah sebesar USD 62,23 juta. Dengan demikian, nilai pasar wajar 100,00% saham DSU berdasarkan metode akumulasi aset adalah sebesar USD 62,23 juta.
Indicative fair market value of 100.00% shares of DSU was then obtained by calculating the difference of all assets and liabilities. Therefore, as of 31 December 2016, indicative fair market value of 100.00% shares of DSU was USD 77.78 million. By applying discount for lack of marketabilities of 20.00%, then the fair market value of 100.00% shares of DSU was USD 62.23 million. Therefore, the fair market value of 100.00% shares of DSU based on assets accumulation method was USD 62.23 million.

This report is originally issued in Bahasa Indonesia
xv
II. Nilai Pasar Wajar 100,00% Saham DSU
Berdasarkan Metode Pembanding Perusahaan Terbuka
II. Fair Market Value of 100.00% Shares of DSU Based on Guideline Publicly Traded Company Method
Berdasarkan metode pembanding perusahaan terbuka, diperoleh hasil bahwa indikasi nilai pasar wajar 100,00% saham DSU sebelum diskon likuiditas pasar adalah sebesar USD 68,17 juta. Dengan diskon likuiditas pasar sebesar 20,00%, maka nilai pasar wajar 100,00% saham DSU adalah sebesar USD 54,54 juta. Dengan demikian, nilai pasar wajar 100,00% saham DSU berdasarkan metode pembanding perusahaan terbuka adalah sebesar USD 54,54 juta.
Based on guideline publicly traded company method, the indicative fair market value of 100.00% shares of DSU before discount for lack of marketabilities was USD 68.17 million. By applying discount for lack of marketabilities of 20.00%, therefore the fair market value of 100.00% shares of DSU was USD 54.54 million. Therefore, the fair market value of 100.00% shares of DSU based on guideline publicly traded company method was USD 54.54 million.
III. Rekonsiliasi Nilai III. Value Reconciliation
Untuk mendapatkan nilai pasar wajar yang mewakili nilai dari kedua metode penilaian yang digunakan, dilakukan rekonsiliasi dengan terlebih dahulu melakukan pembobotan terhadap nilai pasar wajar yang dihasilkan dari kedua metode tersebut, masing-masing dengan bobot 90,00% untuk metode akumulasi aset dan 10,00% untuk metode pembanding perusahaan terbuka.
To acquire the fair market value that represents the value of both valuation methods applied, reconciliation was performed by firstly weighting the fair market value resulted from both methods, with a weight of 90.00% for assets accumulation method and 10.00% for guideline publicly traded company method, respectively.
Alasan kami memberikan bobot 90,00% untuk metode akumulasi aset dan 10,00% untuk metode pembanding perusahaan terbuka, yaitu karena data-data dan informasi yang digunakan pada metode akumulasi aset yang kami gunakan untuk menentukan nilai pasar wajar Obyek Penilaian merupakan data-data dan informasi yang memiliki tingkat kehandalan yang lebih memadai dibandingkan dengan data-data dan informasi yang digunakan pada metode pembanding perusahaan terbuka.
The reason we weighted 90.00% for assets accumulation method and 10.00% for guideline publicly traded company method was because the data and information used in assets accumulaton method that we used to determine the fair market value of the Valuation Object was the data and information that represented more adequate level of reliability compared to the data and information used in guideline publicly traded company method.
Berdasarkan hasil rekonsiliasi tersebut, diperoleh hasil bahwa nilai pasar wajar Obyek Penilaian adalah sebesar USD 61,46 juta.
Based on the reconciliation result, the fair market value of the Valuation Object was USD 61.46 million.

This report is originally issued in Bahasa Indonesia
xvi
Sehubungan dengan penilaian ini, kami ingin menekankan bahwa indikasi nilai pasar wajar yang dihitung dengan metode diskonto pendapatan ekonomi mendatang didasarkan atas asumsi-asumsi mengenai tingkat pendapatan, beban dan akun-akun laporan posisi keuangan yang dikembangkan pihak manajemen BSL melalui analisa atas kinerja historis dan pernyataan manajemen BSL mengenai rencana-rencana untuk masa yang akan datang sebelum Rencana Akuisisi. Kami melakukan penelaahan atas asumsi-asumsi tersebut dan menurut pendapat kami, asumsi-asumsi tersebut wajar. Akan tetapi, kami tidak bertanggung jawab atas asumsi-asumsi tersebut. Setiap perubahan dari asumsi-asumsi ini akan mempengaruhi perhitungan nilai pasar wajar Obyek Penilaian. Karena tidak ada kepastian bahwa dasar-dasar dan asumsi-asumsi tersebut akan terealisasi, kami tidak dapat memberikan jaminan bahwa hasil-hasil yang diproyeksikan akan tercapai.
In connection with this valuation, we would like to emphasize that the fair market value calculated using discounted future economic income method relied on the assumptions of the revenues, expenses and accounts of statements of financial position developed by the management of BSL through analysis of historical performance and the statements of BSL’s management concerning future plans before the Proposed Acquisition. We have reviewed those assumptions and in our opinion, those assumptions were reasonable. However, we are not responsible for those assumptions. Any changes to those assumptions would affect the calculation of fair market value of the Valuation Object. Since there is not any certainty that the principles and assumptions would be realized, we could not provide assurance that the projected results would be achieved.
KESIMPULAN PENILAIAN THE VALUATION CONCLUSION
Berdasarkan hasil analisa atas seluruh data dan informasi yang telah kami terima dan dengan mempertimbangkan semua faktor yang relevan yang mempengaruhi penilaian, maka menurut pendapat kami, nilai pasar wajar Obyek Penilaian pada tanggal 31 Desember 2016 adalah sebesar USD 61,46 juta.
Based on the analysis of all data and information that we have received and by considering all relevant factors affecting the valuation, therefore in our opinion, the fair market value of the Valuation Object as of 31 December 2016 was USD 61.46 million.

This report is originally issued in Bahasa Indonesia
xvii
Nilai pasar wajar Obyek Penilaian tersebut kami tentukan berdasarkan data dan informasi yang kami peroleh dari pihak manajemen Perseroan dan DSU serta pihak-pihak lain yang relevan dengan penilaian. Kami menganggap bahwa semua informasi tersebut adalah benar dan bahwa tidak ada keadaan atau hal-hal yang tidak terungkap yang akan mempengaruhi nilai pasar wajar tersebut secara material.
The fair market value of the Valuation Object was determined based on the data and information that we have received from the management of the Company and DSU as well as other parties relevant to the valuation. We assumed that such information was correct and there were no circumstances or events that were not disclosed to us which could materially affect the results of the fair market value.
Kami tidak melakukan penyelidikan dan juga bukan merupakan tanggung jawab kami kemungkinan terjadinya masalah yang berkaitan dengan status hukum kepemilikan, kewajiban utang dan/atau sengketa atas DSU. Kami tegaskan pula bahwa kami tidak memperoleh manfaat atau keuntungan apapun baik saat ini maupun di masa datang dan imbalan jasa yang telah disetujui atas penilaian DSU tidak tergantung pada nilai yang dilaporkan.
We did not perform an investigation and were not responsible for the possibility of problems related to the legal status of ownership, debt obligations and/or disputes over DSU. We also emphasized that we did not acquire any benefit or advantage either in present or in the future and the approved fees for valuation of DSU did not depend on the reported value.
DISTRIBUSI PENILAIAN DISTRIBUTION OF THE VALUATION
Penilaian ini hanya ditujukan untuk kepentingan Direksi Perseroan dalam kaitannya dengan Rencana Akuisisi serta tidak dapat digunakan atau dikutip untuk tujuan lain tanpa adanya ijin tertulis dari JKR dan/atau tidak untuk digunakan oleh pihak lain.
This valuation was intended for the interest of the Company’s Directors in connection with the Proposed Acquisition and could not be used or cited for other purposes without written permission from JKR and/or not to be used by other party.
Penilaian ini juga disusun berdasarkan kondisi pasar dan perekonomian, kondisi umum bisnis dan keuangan serta peraturan yang ada pada saat ini. Kami tidak bertanggung jawab untuk menegaskan kembali atau melengkapi pendapat kami karena peristiwa-peristiwa yang terjadi setelah tanggal surat ini. Walaupun demikian, kami memiliki hak untuk, jika diperlukan, merubah atau melengkapi hasil dari laporan ini jika terdapat tambahan informasi yang relevan setelah tanggal laporan ini yang kami anggap dapat berpengaruh secara signifikan terhadap hasil penilaian kami. Laporan penilaian ini hanya dipersiapkan untuk dapat dipergunakan sesuai dengan tujuan yang telah disebutkan di atas dan tidak dapat dipergunakan untuk tujuan lainnya.
This valuation was also prepared based on the market and economic conditions, general business and financial as well as the current existing regulations. We are not responsible to confirm or to supplement our opinion for the events occurring after the date of this letter date. Nevertheless, we have the authority, if necessary, to amend or to supplement the results of this report due to additional relevant information after the date of this report that we consider could significantly affect the results of our valuation. This valuation report was merely prepared to be used in accordance with the objectives mentioned above and could not be used for other purposes.

This report is originally issued in Bahasa Indonesia
xviii
Pendapat yang kami sampaikan di sini harus dipandang sebagai satu kesatuan bersama dengan laporan lengkap yang telah kami siapkan. Penggunaan sebagian analisa dan informasi tanpa mempertimbangkan keseluruhan informasi dan analisa dapat menyebabkan pandangan yang menyesatkan.
The opinion we stated here should be viewed as a whole together with the full report that we have prepared. The use of partial analysis and information without considering the whole information and analysis may cause a misleading view.
Penilaian ini tidak sah apabila tidak dibubuhi tanda tangan pihak yang berwenang dan stempel perusahaan dari KJPP Jennywati, Kusnanto & rekan.
This valuation is not legitimate without authorized signature and corporate seal from KJPP Jennywati, Kusnanto & rekan.
Hormat kami, Very Truly Yours, KJPP JENNYWATI, KUSNANTO & REKAN
Willy D. Kusnanto Rekan/Partner
Izin Penilai B-1.09.00153 Appraiser License STTD 05/BL/STTD-P/B/2010 STTD Klasifikasi Izin Penilai Bisnis/Business Appraiser License Classification MAPPI 06-S-01996 MAPPI

This report is originally issued in Bahasa Indonesia
xix
ASUMSI DAN SYARAT PEMBATAS LIMITING ASSUMPTIONS AND CONDITIONS
1. JKR sama sekali tidak memiliki kepentingan keuangan atau apapun terhadap DSU untuk sekarang dan masa yang akan datang.
1. JKR did not have any financial or any other interest to DSU in the present and in the future.
2. Biaya untuk penilaian ini tidak tergantung pada
besarnya nilai yang diperoleh atau yang tercantum dalam laporan.
2. The costs for this valuation did not depend on the values acquired or stated in the report.
3. Nilai dicantumkan dalam mata uang USD dan/atau
ekuivalensinya atas permintaan pemberi tugas. 3. The value was presented in USD and/or its
equivalency as requested by the assignor.
4. Laporan disajikan hanya untuk maksud dan tujuan seperti tertulis di dalam laporan serta ditujukan terbatas kepada klien dimaksud.
4. The report was presented merely for the purposes and objectives as written in the report and addressed limitedly to the referred client.
5. Baik seluruh maupun sebagian dari isi laporan ini
tidak diijinkan untuk dipublikasikan melalui iklan atau media lainnya tanpa seijin dari KJPP Jennywati, Kusnanto & rekan.
5. Both all and part of the contents of this report are not allowed to be published through advertising or other media without permission from KJPP Jennywati, Kusnanto & rekan.
6. Laporan penilaian ini tidak sah apabila tidak dibubuhi
tanda tangan JKR dan stempel perusahaan dari KJPP Jennywati, Kusnanto & rekan.
6. This valuation report is not legitimate without authorized signature and corporate seal from KJPP Jennywati, Kusnanto & rekan.
This report is originally issued in Bahasa Indonesia
xx
PERNYATAAN INDEPENDENSI PENILAI INDEPENDENCY STATEMENTS OF THE
APPRAISERS
1. JKR tidak memiliki benturan kepentingan dan tidak terafiliasi dengan perusahaan yang dinilai.
1. JKR did not have any conflicts of interest and were not affiliated with the company being assessed.
2. JKR tidak memiliki kepentingan atau keuntungan
pribadi terkait dengan usaha/saham perusahaan yang dinilai.
2. JKR did not have any interest or personal gain associated with the business/shares of the company being assessed.
3. JKR tidak memiliki pinjaman dengan perusahaan
yang dinilai. 3. JKR did not have any debt with the company being
assessed.
4. Laporan penilaian ini tidak dilakukan untuk memberikan keuntungan atau merugikan pihak manapun.
4. This valuation report was not performed to advantage or disadvantage any party.
5. JKR hanya menerima imbalan jasa sesuai dengan
surat penugasan JKR. 5. JKR only received remuneration according to JKR’s
engagement letter.
Tim Penilai Valuation Team
Willy D. Kusnanto Izin Penilai B-1.09.00153 Appraiser License STTD 05/BL/STTD-P/B/2010 STTD Klasifikasi Izin Penilai Bisnis/Business Appraiser License Classification MAPPI 06-S-01996 MAPPI
Andi Wijaya Izin Penilai B-1.13.00382 Appraiser License STTD 02/PM.223/STTD-P/B/2014 STTD Klasifikasi Izin Penilai Usaha/Business Appraiser License Classification MAPPI 08-S-02223 MAPPI
Erric Reynaldi MAPPI 13-A-04625 MAPPI
Andry Steven MAPPI 14-P-04891 MAPPI

This report is originally issued in Bahasa Indonesia
xxi
SURAT PERNYATAAN STATEMENTS OF THE APPRAISERS
Dalam batas kemampuan dan keyakinan kami sebagai penilai, kami yang bertanda tangan di bawah ini menerangkan bahwa:
At the limit of our abilities and confidence as appraisers, we the undersigned explained that:
1. Pernyataan dalam laporan ini, yang menjadi dasar
dari analisa, pendapat dan kesimpulan yang diuraikan di dalamnya adalah benar. Laporan ini menjelaskan semua syarat-syarat pembatasan yang mempengaruhi analisa, pendapat dan kesimpulan yang tertera dalam laporan ini dan laporan ini telah disusun sesuai dengan dan tunduk pada ketentuan-ketentuan dari Peraturan Bapepam-LK No. VIII.C.3 tentang “Pedoman Penilaian dan Penyajian Laporan Penilaian Usaha di Pasar Modal” yang dimuat dalam Keputusan Ketua Bapepam-LK No. Kep-196/BL/2012 tanggal 19 April 2012 dan Standar Penilaian Indonesia (SPI) 2015 serta telah dibuat dengan memenuhi Kode Etik Penilai Indonesia (KEPI).
1. The statements in this report, which became the basis of the analysis, opinion and conclusion described therein were correct. This report explained all restricted terms that affected the analysis, opinion and conclusion stated in this report and this report has been prepared in accordance with and subject to the provisions of Bapepam-LK Rule No. VIII.C.3 concerning “Guidelines for Valuation and Presentation of Business Valuation Report in Capital Markets” as contained in the Decree of the Chairman of Bapepam-LK No. Kep-196/BL/2012 dated 19 April 2012 and Indonesian Valuation Standards (SPI) 2015 as well as prepared in compliance with Indonesia Code of Ethics of Appraisers (KEPI).
2. JKR bertanggung jawab atas laporan penilaian. 2. JKR were responsible for valuation report.
3. Semua pernyataan dan data yang tercantum dalam
laporan adalah benar adanya dan sesuai dengan pengetahuan dan itikad baik JKR.
3. All statements and data stated in the report were correct and in accordance with the knowledge and good faith of JKR.
4. Penugasan penilaian profesional telah dilakukan
terhadap DSU pada tanggal penilaian yang ditentukan, yaitu 31 Desember 2016.
4. The professional valuation engagement has been performed on DSU on the determined date of valuation, i.e. 31 December 2016.
5. Penugasan penilaian profesional telah dilaksanakan
sesuai dengan peraturan perundang-undangan yang berlaku.
5. Professional valuation assignment has been performed in accordance with applicable laws and regulations.
6. Analisa telah dilakukan untuk tujuan sebagaimana
diungkapkan dalam laporan penilaian. 6. The analysis has been performed for the purposes
as disclosed in the valuation report.
7. Perkiraan nilai yang dihasilkan dalam penugasan
penilaian profesional telah disajikan sebagai kesimpulan nilai.
7. The estimated value generated in the professional valuation engagement has been presented as a conclusion of value.
8. JKR tidak memiliki kepentingan pribadi atau
kecenderungan untuk berpihak berkenaan dengan subyek dari laporan ini maupun pihak-pihak yang terlibat di dalamnya.
8. JKR did not have any personal interest or tendency to take side on the subject of this report or the parties involved in it.
9. JKR telah memenuhi pendidikan profesional yang
ditentukan dan/atau diselenggarakan oleh Asosiasi Penilai yang diakui oleh Pemerintah.
9. JKR have fulfilled the required professional education and/or organized by the Association of Appraisers approved by the Government.
10. Lingkup pekerjaan dan data yang dianalisa telah
diungkapkan. 10. The scope of works and analyzed data has been
disclosed.
11. JKR telah memiliki pemahaman mengenai Obyek
Penilaian yang dinilai. 11. JKR have had an understanding of the Valuation
Object being assessed.
This report is originally issued in Bahasa Indonesia
xxii
12. Imbalan jasa yang diterima oleh JKR tidak
dipengaruhi oleh nilai yang dihasilkan dari proses analisa Obyek Penilaian.
12. The remuneration received by JKR was not affected by the generated value from the analysis of the Valuation Object.
13. Analisa dan kesimpulan nilai telah sesuai dengan
asumsi-asumsi dan kondisi pembatas. 13. Analysis and conclusion was in accordance with the
assumptions and limiting conditions.
14. Data ekonomi dan industri dalam laporan penilaian
ini diperoleh dari berbagai sumber yang diyakini JKR dapat dipertanggungjawabkan.
14. The economic and industrial data in the valuation report was obtained from various sources that JKR believed to be accounted.
15. Tidak seorangpun selain yang disebutkan dalam
laporan penilaian ini telah menyediakan bantuan profesional dalam menyiapkan laporan penilaian ini.
15. No one other than those mentioned in this valuation report has been providing professional assistance in preparing this valuation report.
16. JKR telah melakukan inspeksi dan wawancara
dengan manajemen Perseroan terkait dengan operasional, kinerja dan prospek dari DSU.
16. JKR have performed interviews with the Company’s management in relation to DSU’s operations, performance and prospects.
Tim Penilai Valuation Team
Willy D. Kusnanto Izin Penilai B-1.09.00153 Appraiser License STTD 05/BL/STTD-P/B/2010 STTD Klasifikasi Izin Penilai Bisnis/Business Appraiser License Classification MAPPI 06-S-01996 MAPPI
Andi Wijaya Izin Penilai B-1.13.00382 Appraiser License STTD 02/PM.223/STTD-P/B/2014 STTD Klasifikasi Izin Penilai Usaha/Business Appraiser License Classification MAPPI 08-S-02223 MAPPI
Erric Reynaldi MAPPI 13-A-04625 MAPPI
Andry Steven MAPPI 14-P-04891 MAPPI

This report is originally issued in Bahasa Indonesia
xxiii
DAFTAR ISI TABLE OF CONTENTS
Halaman/Page
OPINI i OPINION
ASUMSI DAN SYARAT PEMBATAS xix LIMITING ASSUMPTIONS AND CONDITIONS
PERNYATAAN INDEPENDENSI PENILAI xx INDEPENDENCY STATEMENTS OF THE
APPRAISERS
SURAT PERNYATAAN xxi STATEMENTS OF THE APPRAISERS
DAFTAR ISI xiii TABLE OF CONTENTS
DAFTAR TABEL xxvi LIST OF TABLES
DAFTAR GRAFIK xxx LIST OF CHARTS
LAMPIRAN xxxi EXHIBITS
I. RINGKASAN EKSEKUTIF I. EXECUTIVE SUMMARY
A. Alasan dan Latar Belakang 1 A. Reasons and Background B. Obyek serta Tujuan dan Maksud Penilaian 5 B. The Valuation Object as well as the
Objective and Purpose of the Valuation
C. Premis Penilaian 6 C. The Valuation Premise D. Independensi Penilai 6 D. The Independency of Appraisers E. Tanggal Efektif Penilaian 7 E. The Effective Date of Valuation F. Profil PT Dwikarya Sejati Utama 7 F. Profile of PT Dwikarya Sejati Utama
G. Definisi Nilai yang Digunakan 8 G. Definition of the Value Used H. Pendekatan Penilaian yang Digunakan 8 H. The Valuation Approaches Applied I. Metode Penilaian yang Digunakan 9 I. The Valuation Methods Applied J. Ringkasan Hasil Penilaian 10 J. The Valuation Summaries K. Kesimpulan Penilaian 12 K. The Valuation Conclusion
II. DESKRIPSI PENUGASAN II. DESCRIPTIONS OF THE ASSIGNMENT
A. Alasan dan Latar Belakang 14 A. Reasons and Background
B. Tujuan dan Maksud Penilaian 17 B. The Objective and Purpose of the Valuation
C. Definisi Nilai yang Digunakan 18 C. Definition of the Value Used D. Tanggal Efektif Penilaian 18 D. The Effective Date of Valuation
E. Data dan Informasi yang Digunakan dalam Penilaian
18 E. Data and Information Used in the Valuation
F. Informasi Non-Keuangan 22 F. Non-Financial Information G. Kondisi Pembatas dan Asumsi-Asumsi
Pokok 25 G. Limiting Conditions and Major
Assumptions H. Distribusi Penilaian 27 H. Distribution of the Valuation I. Jenis Laporan 28 I. Type of Report J. Kejadian Penting Setelah Tanggal
Penilaian (Subsequent Events) 28 J. Significant Events After the Date of
Valuation (Subsequent Events)

This report is originally issued in Bahasa Indonesia
xxiv
Halaman/Page
III. PENJELASAN SINGKAT MENGENAI PT
DWIKARYA SEJATI UTAMA III. BRIEF DESCRIPTIONS OF PT DWIKARYA
SEJATI UTAMA
A. Latar Belakang PT Dwikarya Sejati Utama 29 A. Background of PT Dwikarya Sejati Utama
B. Kegiatan Usaha 29 B. Business Activities C. Manajemen 29 C. Management D. Kepemilikan Saham 30 D. Share Ownership E. Data Keuangan Historis 30 E. Historical Financial Data
F. Penjelasan Singkat Mengenai Entitas Anak PT Dwikarya Sejati Utama
32 F. Brief Description of Subsidiaries of PT Dwikarya Sejati Utama
IV. KONDISI DAN TINJAUAN EKONOMI IV. ENONOMIC CONDITIONS AND OVERVIEW
A. Tinjauan Ekonomi Dunia 35 A. World Economic Overview B. Tinjauan Ekonomi Indonesia 39 B. Indonesian Economic Overview C. Proyeksi Ekonomi Indonesia 40 C. Indonesian Economic Projection
D. Tingkat Suku Bunga 41 D. Interest Rate E. Inflasi 43 E. Inflation F. Nilai Tukar Rupiah 45 F. Rupiah Exchange Rate
V. TINJAUAN INDUSTRI BATUBARA V. COAL INDUSTRY OVERVIEW
A. Tinjauan Industri Batubara di Dunia 47 A. Global Coal Industry Overview B. Tinjauan Industri Batubara di Indonesia 55 B. Indonesian Coal Industry Overview
VI. ANALISA LAPORAN KEUANGAN
KONSOLIDASIAN HISTORIS VI. HISTORICAL ANALYSIS OF
CONSOLIDATED FINANCIAL STATEMENTS
A. PT Dwikarya Sejati Utama 58 A. PT Dwikarya Sejati Utama B. Analisa atas Common Size PT Dwikarya
Sejati Utama 71 B. Common Size Analysis of PT Dwikarya
Sejati Utama C. Analisa Common Size Industri Batubara 72 C. Common Size Analysis of Coal Indystry
VII. ANALISA RISIKO VII. RISKS ANALYSIS
A. Risiko Penurunan Harga Batubara dan
Kelangkaan Batubara 81 A. Risk of Coal Price Reduction and Coal
Rarity
B. Risiko Permintaan Pasar Terhadap Batubara
81 B. Risk of Market Demand Against Coal
C. Risiko Kebijakan Pemerintah 82 C. Risk of Government Policy D. Risiko Pencemaran Lingkungan 82 D. Risk of Environment Pollution
E. Risiko Bencana Alam 83 E. Risk of Natural Disaster
VIII. METODE PENILAIAN VIII. THE VALUATION METHODS
A. Metode-Metode Penilaian 84 A. The Valuation Methods B. Metode Penilaian yang Digunakan 86 B. The Valuation Methods Applied C. Premis Penilaian 88 C. The Valuation Premise D. Aplikasi Diskon dan Premi 88 D. Application of Discounts and Premiums
E. Prosedur Penilaian 88 E. The Valuation Procedures F. Independensi Penilai 89 F. The Independency of Appraisers

This report is originally issued in Bahasa Indonesia
xxv
Halaman/Page
IX. PENILAIAN IX. THE VALUATION
A. Premi Pengendalian, Diskon
Pengendalian dan Diskon Likuiditas Pasar 90 A. Premium for Control, Discount for Lack of
Control and Discount for Lack of Marketabilities
B. Nilai Pasar Wajar Obyek Penilaian 91 B. The Fair Market Value of The Valuation Object
C. PT Duta Sarana Internusa 97 C. PT Duta Sarana Internusa
D. PT Barasentosa Lestari 103 D. PT Barasentosa Lestari E. Kesimpulan Penilaian 127 E. The Valuation Conclusion

This report is originally issued in Bahasa Indonesia
xxvi
DAFTAR TABEL LIST OF TABLES
Halaman/Page
Tabel 1 Daftar Kepemilikan dan Struktur
Pemegang Saham 7 Table 1 Details of Shareholders and Share
Ownership Structure
PT Dwikarya Sejati Utama PT Dwikarya Sejati Utama
Tabel 2 Pesaing Usaha 11 Table 2 Business Competitors
Tabel 3 Daftar Kepemilikan dan Struktur Pemegang Saham
30 Table 3 Details of Shareholders and Share Ownership Structure
PT Dwikarya Sejati Utama PT Dwikarya Sejati Utama
Tabel 4 Laporan Posisi Keuangan 30 Table 4 Statements of Financial Position PT Dwikarya Sejati Utama PT Dwikarya Sejati Utama Per 31 Desember 2016 dan 31 Maret 2012 – 2016
As of 31 December 2016 and 31 March 2012 – 2016
Tabel 5 Laporan Laba Rugi Komprehensif 31 Table 5 Statements of Comprehensive Income
PT Dwikarya Sejati Utama PT Dwikarya Sejati Utama untuk periode sembilan bulan yang berakhir pada tanggal 31 Desember 2016 dan untuk tahun yang berakhir pada tanggal-tanggal 31 Maret 2012 – 2016
for nine months ended 31 December 2016 and for the years ended 31 March 2012 – 2016
Tabel 6 Daftar Kepemilikan dan Struktur
Pemegang Saham 33 Table 6 Details of Shareholders and Share
Ownership Structure PT Duta Sarana Internusa PT Duta Sarana Internusa
Tabel 7 Daftar Kepemilikan dan Struktur
Pemegang Saham 34 Table 7 Details of Shareholders and Share
Ownership Structure PT Barasentosa Lestari PT Barasentosa Lestari
Tabel 8 Pertumbuhan Produk Domestik Bruto
Dunia 37 Table 8 Global Gross Domestic Product Growth
Tabel 9 Pertumbuhan Inflasi 38 Table 9 Inflation Growth
Tabel 10 Pertumbuhan Suku Bunga Bank Sentral 39 Table 10 Central Bank Interest Rate Growth
Tabel 11 Kontributor Inflasi Terbesar Berdasarkan
Provinsi 44 Table 11 Largest Inflation Contributor by Province
Tabel 13 Produksi Batubara Dunia 49 Table 13 Global Coal Production
Tabel 14 Proyeksi Produksi Batubara Dunia 53 Table 14 Global Coal Production Projection
Tabel 15 Laporan Posisi Keuangan 58 Table 15 Statements of Financial Position
PT Dwikarya Sejati Utama PT Dwikarya Sejati Utama Per 31 Desember 2016 dan 31 Maret 2012 – 2016
As of 31 December 2016 and 31 March 2012 – 2016
Tabel 16 Laporan Laba Rugi Komprehensif 63 Table 16 Statements of Comprehensive Income
PT Dwikarya Sejati Utama PT Dwikarya Sejati Utama
untuk periode sembilan bulan yang berakhir pada tanggal 31 Desember 2016 dan untuk tahun yang berakhir pada tanggal-tanggal 31 Maret 2012 – 2016
for nine months ended 31 December 2016 and for the years ended 31 March 2012 – 2016

This report is originally issued in Bahasa Indonesia
xxvii
Halaman/Page
Tabel 17 Laporan Arus Kas 65 Table 17 Statements of Cash Flows
PT Dwikarya Sejati Utama PT Dwikarya Sejati Utama untuk periode sembilan bulan yang berakhir pada tanggal 31 Desember 2016 dan untuk tahun yang berakhir pada tanggal-tanggal 31 March 2012 – 2016
for nine months ended 31 December 2016 and for the years ended 31 March 2012 – 2016
Tabel 18 Rasio-rasio Keuangan 69 Table 18 Financial Ratios
PT Dwikarya Sejati Utama PT Dwikarya Sejati Utama Per 31 Desember 2016 dan 31 Maret 2012 – 2016
As of 31 December 2016 and 31 March 2012 – 2016
Tabel 19 Analisa Common Size Laporan Posisi
Keuangan 71 Table 19 Common Size Analysis of Statements of
Financial Position PT Dwikarya Sejati Utama PT Dwikarya Sejati Utama Per 31 Desember 2016 dan 31 Maret 2012 – 2016
As of 31 December 2016 and 31 March 2012 – 2016
Tabel 20 Analisa Common Size Laporan Posisi
Keuangan 73 Table 20 Common Size Analysis of Statements of
Financial Position
PT Adaro Energy Tbk dan entitas anak PT Adaro Energy Tbk and subsidiaries Per 31 Desember 2012 – 2016 As of 31 December 2012 – 2016
Tabel 21 Analisa Common Size Laporan Laba Rugi
Komprehensif 75 Table 21 Common Size Analysis of Statements of
Consolidated Comprehensive Income PT Adaro Energy Tbk dan entitas anak PT Adaro Energy Tbk and subsidiaries untuk tahun yang berakhir pada tanggal-tanggal 31 Desember 2012 -2016
for the years ended 31 December 2012- 2016
Tabel 22 Analisa Common Size Laporan Posisi
Keuangan 76 Table 22 Common Size Analysis of Statements of
Financial Position PT Baramulti Suksessarana Tbk dan entitas anak
PT Baramulti Suksessarana Tbk and subsidiaries
Per 31 Desember 2012 – 2016 As of 31 December 2012 – 2016
Tabel 23 Analisa Common Size Laporan Laba Rugi Komprehensif
78 Table 23 Common Size Analysis of Statements of Consolidated Comprehensive Income
PT Baramulti Suksessarana Tbk dan entitas anak
PT Baramulti Suksessarana Tbk and subsidiaries
untuk tahun yang berakhir pada tanggal-tanggal 31 Desember 2012 -2016
for the years ended 31 December 2012- 2016
Tabel 24 Analisa Common Size Laporan Posisi
Keuangan 78 Table 24 Common Size Analysis of Statements of
Financial Position PT Toba Bara Sejahtera Tbk dan entitas anak
PT Toba Bara Sejahtera Tbk and subsidiaries
Per 31 Desember 2012 – 2016 As of 31 December 2012 – 2016
Tabel 25 Analisa Common Size Laporan Laba Rugi Komprehensif
80 Table 25 Common Size Analysis of Statements of Consolidated Comprehensive Income
PT Toba Bara Sejahtra Tbk dan entitas anak
PT Toba Bara Sejahtra Tbk and subsidiaries
untuk tahun yang berakhir pada tanggal-tanggal 31 Desember 2012 -2016
for the years ended 31 December 2012- 2016

This report is originally issued in Bahasa Indonesia
xxviii
Halaman/Page
Tabel 26 Nilai Pasar Wajar 100,00% Saham 93 Table 26 Fair Market Value of 100.00% Shares
PT Dwikarya Sejati Utama PT Dwikarya Sejati Utama Metode Akumulasi Aset Assets Accumulation Method Per 31 Desember 2016 As of 31 December 2016
Tabel 27 Data Angka Pengali Perusahaan
Pembanding 94 Table 27 Multiplier Data of Comparison Companies
PT Dwikarya Sejati Utama PT Dwikarya Sejati Utama
Tabel 28 Nilai Pasar Wajar 100,00% Saham 96 Table 28 Fair Market Value of 100.00% Shares
PT Dwikarya Sejati Utama PT Dwikarya Sejati Utama Metode Pembanding Perusahaan Terbuka
Guideline Publicly Traded Company Method
Per 31 Desember 2016 As of 31 December 2016
Tabel 29 Rekonsiliasi Nilai 97 Table 29 Value Reconciliation
PT Dwikarya Sejati Utama PT Dwikarya Sejati Utama Per 31 Desember 2016 As of 31 December 2016
Tabel 30 Indikasi Nilai Pasar Wajar 100,00%
Saham 99 Table 30 Indicative Fair Market Value of 100.00%
Shares PT Duta Sarana Internusa PT Duta Sarana Internusa Metode Akumulasi Aset Assets Accumulation Method Per 31 Desember 2016 As of 31 December 2016
Tabel 31 Data Angka Pengali Perusahaan
Pembanding 101 Table 31 Multiplier Data of Comparison Companies
PT Duta Sarana Internusa PT Duta Sarana Internusa
Tabel 32 Indikasi Nilai Pasar Wajar 100,00%
Saham 102 Table 32 Indicative Fair Market Value of 100.00%
Shares PT Duta Sarana Internusa PT Duta Sarana Internusa Metode Pembanding Perusahaan Terbuka
Guideline Publicly Traded Company Method
Per 31 Desember 2016 As of 31 December 2016
Tabel 33 Rekonsiliasi Nilai 103 Table 33 Value Reconciliation
PT Duta Sarana Internusa PT Duta Sarana Internusa Per 31 Desember 2016 As of 31 December 2016
Tabel 34 Proyeksi Laporan Laba Rugi
Komprehensif 107 Table 34 Statements of Comprehensive Income
Projections PT Barasentosa Lestari PT Barasentosa Lestari untuk periode tiga bulan yang berakhir pada tanggal 31 Maret 2017 dan untuk tahun yang berakhir pada tanggal-tanggal 31 Maret 2018 – 2039
for three months period ended 31 March 2017 and for the years ended 31 March 2018 – 2039
Tabel 35 Proyeksi Laporan Posisi Keuangan 110 Table 35 Statements of Financial Position
Projections PT Barasentosa Lestari PT Barasentosa Lestari Per 31 Maret 2017 – 2039 As of 31 March 2017 – 2039

This report is originally issued in Bahasa Indonesia
xxix
Halaman/Page
Tabel 36 Proyeksi Arus Kas Bersih 116 Table 36 Statements of Cash Flows Projections
PT Barasentosa Lestari PT Barasentosa Lestari untuk periode tiga bulan yang berakhir pada tanggal 31 Maret 2017 dan untuk tahun yang berakhir pada tanggal-tanggal 31 Maret 2018 – 2039
for three months period ended 31 March 2017 and for the years ended 31 March 2018 – 2039
Tabel 37 Indikasi Nilai Kini Operasi 121 Table 37 Indicative Operating Present Value
PT Barasentosa Lestari PT Barasentosa Lestari Per 31 Desember 2016 As of 31 December 2016
Tabel 38 Indikasi Nilai Pasar Wajar 100,00%
Saham 123 Table 38 Indicative of Fair Market Value of 100.00%
Shares PT Barasentosa Lestari PT Barasentosa Lestari Metode Diskonto Pendapatan Ekonomi Mendatang
Discounted Future Economic Income Method
Per 31 Desember 2016 As of 31 December 2016
Tabel 39 Indikasi Nilai Pasar Wajar 100,00% Saham
125 Table 39 Indicative of Fair Market Value of 100.00% Shares
PT Barasentosa Lestari PT Barasentosa Lestari Metode Akumulasi Aset Assets Accumulation Method Per 31 Desember 2016 As of 31 December 2016
Tabel 40 Rekonsiliasi Nilai 126 Table 40 Value Reconciliation
PT Barasentosa Lestari PT Barasentosa Lestari Per 31 Desember 2016 As of 31 December 2016

This report is originally issued in Bahasa Indonesia
xxx
DAFTAR GRAFIK LIST OF CHARTS
Halaman/Page
Grafik 1 Perkembangan Suku Bunga Bank
Indonesia 42 Chart 1 Development of Bank of Indonesia Interest
Rate
Grafik 2 Perkembangan Inflasi Berdasarkan
Indeks Harga Konsumen di Indonesia 43 Chart 2 Development of Inflation Based on
Consumer Price Index in Indonesia
Grafik 3 Perkembangan Nilai Tukar Rupiah Terhadap Mata Uang Asing
45 Chart 3 Development of Rupiah Exchange Rate Against Foreign Currencies
Grafik 4 Harga Batubara Dunia 47 Chart 4 Global Coal Prices
Grafik 5 Disitribusi Cadangan Batubara Dunia
Tahun 2015 51 Chart 5 The Distribution of Global Coal Reserve in
2015
Grafik 6 Proyeksi Harga Batubara Dunia 52 Chart 6 Global Coal Prices Projection
Grafik 7 Proyeksi Konsumsi Batubara Dunia 54 Chart 7 Global Coal Consumption Projection
Grafik 8 Rata-rata Harga Batubara Acuan di Indonesia
56 Chart 8 Average Reference Coal Price in Indonesia
Grafik 9 Proyeksi Penjualan Tahun 2017 – 2039 105 Chart 9 Sales Projections for 2017 – 2039
PT Barasentosa Lestari PT Barasentosa Lestari
Grafik 10 Proyeksi Beban Pokok Penjualan Tahun 2017 – 2039
106 Chart 10 Cost of Sales Projections for 2017 – 2039
PT Barasentosa Lestari PT Barasentosa Lestari

This report is originally issued in Bahasa Indonesia
xxxi
LAMPIRAN EXHIBITS
Halaman/Page
Lampiran A Nilai Pasar Wajar 100,00% Saham 128 Exhibit A Fair Market Value of 100.00% Shares
PT Dwikarya Sejati Utama PT Dwikarya Sejati Utama
Metode Akumulasi Aset Assets Accumulation Method Per 31 Desember 2016 As of 31 December 2016
Lampiran B Nilai Pasar Wajar 100,00% Saham 129 Exhibit B Fair Market Value of 100.00% Shares
PT Dwikarya Sejati Utama PT Dwikarya Sejati Utama Metode Pembanding Perusahaan Terbuka
Guideline Publicly Traded Company Method
Per 31 Desember 2016 As of 31 December 2016
Lampiran C Rekonsiliasi Nilai 130 Exhibit C Value Reconciliation
PT Dwikarya Sejati Utama PT Dwikarya Sejati Utama Per 31 Desember 2016 As of 31 December 2016
Lampiran D Indikasi Nilai Pasar Wajar 100,00%
Saham 131 Exhibit D Indicative Fair Market Value of 100.00%
Shares PT Duta Sarana Internusa PT Duta Sarana Internusa
Metode Akumulasi Aset Assets Accumulation Method Per 31 Desember 2016 As of 31 December 2016
Lampiran E Indikasi Nilai Pasar Wajar 100,00%
Saham 132 Exhibit E Indicative Fair Market Value of 100.00%
Shares PT Duta Sarana Internusa PT Duta Sarana Internusa Metode Pembanding Perusahaan Terbuka
Guideline Publicly Traded Company Method
Per 31 Desember 2016 As of 31 December 2016
Lampiran F Rekonsiliasi Nilai 133 Exhibit F Value Reconciliation PT Duta Sarana Internusa PT Duta Sarana Internusa Per 31 Desember 2016 As of 31 December 2016
Lampiran G Indikasi Nilai Pasar Wajar 100,00%
Saham 134 Exhibit G Indicative of Fair Market Value of 100.00%
Shares PT Barasentosa Lestari PT Barasentosa Lestari
Metode Diskonto Pendapatan Ekonomi Mendatang
Discounted Future Economic Income Method
Per 31 Desember 2016 As of 31 December 2016
Lampiran H Indikasi Nilai Pasar Wajar 100,00% Saham
135 Exhibit H Indicative of Fair Market Value of 100.00% Shares
PT Barasentosa Lestari PT Barasentosa Lestari Metode Akumulasi Aset Assets Accumulation Method
Per 31 Desember 2016 As of 31 December 2016
Lampiran I Rekonsiliasi Nilai 136 Exhibit I Value Reconciliation PT Barasentosa Lestari PT Barasentosa Lestari
Per 31 Desember 2016 As of 31 December 2016

This report is originally issued in Bahasa Indonesia
1
I. RINGKASAN EKSEKUTIF I. EXECUTIVE SUMMARY
I.A. Alasan dan Latar Belakang I.A. Reasons and Background
PT Golden Energy Mines Tbk (selanjutnya disebut “Perseroan”) merupakan perseroan
terbatas berstatus perusahaan terbuka, didirikan dan menjalankan kegiatan usahanya di Indonesia. Ruang lingkup kegiatan Perseroan adalah bergerak dalam bidang pertambangan melalui penyertaan pada entitas anaknya dan perdagangan batubara serta perdagangan lainnya. Perseroan memulai kegiatan komersialnya pada tahun 2010. Pada tanggal 4 Februari 2011, berdasarkan Keputusan Menteri Energi dan Sumber Daya Mineral No. 206.K./30/DJB/2011, Perseroan memperoleh Ijin Usaha Pertambangan Operasi Produksi Khusus untuk Pengangkutan dan Penjualan Batubara untuk jangka waktu 3 tahun dan berdasarkan Keputusan Menteri Energi dan Sumber Daya Mineral No. 358.K/30/DJB/2014 tanggal 7 April 2014, jangka waktu tersebut diperpanjang selama 3 tahun. Perseroan berkantor pusat di Sinar Mas Land Plaza, Menara II Lantai 6, Jalan M.H. Thamrin Kavling 51, Jakarta Pusat 10350 dengan nomor telepon: (021) 50186 888 dan nomor faksimili: (021) 31990 319 serta alamat website: www.goldenenergymines.com.
PT Golden Energy Mines Tbk (hereinafter referred to as “the Company”) is a publicly-held limited liability company, established and operates its business in Indonesia. The scope of activities of the Company is engaged in coal mining through its subsidiaries and in coal and other trading activities. The Company started its commercial operations in 2010. On 4 February 2011, based on the Decision of the Ministry of Energy and Mineral Resource No. 206.K./30/DJB/2011, the Company obtained Particular License of IUP Operation Production for Transportation and Trade of Coal which is valid for 3 years and based on the Decision of the Ministry of Energy and Mineral Resource No. 358.K/30/DJB/2014 dated 7 April 2014, the period has been extended for another 3 years. The Company’s main office is located in Jakarta and located at Sinar Mas Land Plaza, Tower II, 6th Floor, Jalan M.H. Thamrin Kavling 51, Jakarta Pusat 10350, with telephone number: (021) 50186 888, faximile number: (021) 31990 319 and website: www.goldenenergymines.com.
Berdasarkan keterangan yang diperoleh dari manajemen Perseroan, pada tanggal 31 Desember 2016, GMR Energy (Netherlands) B.V. (selanjutnya disebut “GEBV”) dan GMR
Infastructure (Overseas) Limited (selanjutnya disebut “GIL”) memiliki beberapa penyertaan
saham dengan rincian sebagai berikut:
Based on the information from the Company’s management, as of 31 December 2016, GMR Energy (Netherlands) B.V. (hereinafter referred to as “GEBV”) dan GMR Infastructure (Overseas) Limited (hereinafter reffered to as “GIL”) has some subsidiaries with the details are as follows:
• GIL dan GEBV memiliki 100,00% dari seluruh modal ditempatkan dan disetor dalam PT Unsoco (selanjutnya disebut “UNSOCO”) dimana sebanyak 99.000
lembar saham atau setara dengan 99,00% dimiliki oleh GEBV dan sisanya sebanyak 1.000 lembar saham atau setara dengan 1,00% dimiliki oleh GIL (selanjutnya disebut “Saham UNSOCO”);
• GIL and GEBV own the 100.00% of the total issued and paid up capital of PT Unsoco (hereinafter referred to as “UNSOCO”) where 99.000 shares or equivalent to 99,00% owned by GEBV and the remaining 1.000 shares or equivalent of 1.00% owned by GIL (hereinafter referred to as “UNSOCO Shares”);
• GIL dan GEBV memiliki 100,00% dari seluruh modal ditempatkan dan disetor dalam PT Dwikarya Sejati Utama (selanjutnya disebut “DSU”) dimana
sebanyak 999 lembar saham atau setara dengan 99,90% dimiliki oleh GEBV dan sisanya sebanyak 1 lembar saham atau setara dengan 0,10% dimiliki oleh GIL (“Saham DSU”);
• GIL and GEBV own the 100.00% of the total issued and paid up capital of PT Dwikarya Sejati Utama (hereinafter referred to as “DSU”) where 999 shares or equivalent to 99,90% owned by GEBV and the remaining 1 share or equivalent of 0.10% owned by GIL (hereinafter referred to as “DSU Shares”);

This report is originally issued in Bahasa Indonesia
2
• GIL dan GEBV melalui DSU memiliki 100,00% dari seluruh modal ditempatkan dan disetor dalam PT Duta Sarana Internusa (selanjutnya disebut “DSI”)
dimana sebanyak 990 lembar saham atau setara dengan 99,00% dimiliki oleh DSU dan sisanya sebanyak 10 lembar saham atau setara dengan 1,00% dimiliki oleh GIL (selanjutnya disebut “Saham DSI”);
dan
• GIL and GEBV through DSU own the 100.00% of the total issued and paid up capital of PT Duta Sarana Internusa (hereinafter referred to as “DSI”) where 990 shares or equivalent to 99,00% owned by DSU and the remaining 10 share or equivalent of 1.00% owned by GIL (hereinafter referred to as “DSI Shares”); and
• GIL dan GEBV melalui DSU, DSI serta UNSOCO memiliki 100,00% dari seluruh modal ditempatkan dan disetor dalam PT Barasentosa Lestari (selanjutnya disebut “BSL”) dimana sebanyak 3.324 lembar
saham atau setara dengan 94,97% dimiliki oleh DSI, sebanyak 1 lembar saham atau setara dengan 0,03% dimiliki oleh UNSOCO, dan sisanya sebanyak 175 lembar saham atau setara dengan 5,00% dimiliki oleh GIL (selanjutnya disebut “Saham BSL”).
• GIL and GEBV through DSU, DSI as well as UNSOCO own the 100.00% of the total issued and paid up capital of PT Barasentosa Lestari (hereinafter referred to as ”BSL”) where 3,324 shares or equivalent to 94.97% owned by DSI, 1 share or equivalent to 0.03% owned by UNSOCO, and the remaining 175 shares or equivalent of 5.00% owned by GIL (hereinafter refereed to as “BSL Shares”).
Struktur kepemilikan GIL dan GEBV pada tanggal 31 Desember 2016 adalah sebagai berikut:
The ownership structure of GIL and GEBV as of 31 December 2016 are as follows:
99,00% 1,00% 99,90% 0,10%
1,00% 99,00%
0,03% 94,97% 5,00%
GILGEBV
DSI
BSL
UNSOCO DSU

This report is originally issued in Bahasa Indonesia
3
UNSOCO merupakan perseroan terbatas berstatus perusahaan tertutup, didirikan dan menjalankan kegiatan usahanya di Indonesia. Ruang lingkup kegiatan UNSOCO adalah bergerak dalam bidang jasa konsultasi manajemen. Pada tanggal 31 Desember 2016, UNSOCO belum memulai kegiatan operasional.
UNSOCO is a privately-held limited liability company, established and operates its business in Indonesia. The scope of activities of UNSOCO is engaged in management consultant services. As of 31 December 2016, UNSOCO has not commenced its commercial operations.
DSU merupakan perseroan terbatas berstatus perusahaan tertutup, didirikan dan menjalankan kegiatan usahanya di Indonesia. Ruang lingkup kegiatan DSU adalah bergerak dalam bidang modal ventura dan jasa konsultasi manajemen.
DSU is a privately-held limited liability company, established and operates its business in Indonesia. The scope of activities of DSU is engaged in venture capital and management consultant.
DSI merupakan perseroan terbatas berstatus perusahaan tertutup, didirikan dan menjalankan kegiatan usahanya di Indonesia. Ruang lingkup kegiatan DSI adalah bergerak dalam bidang yang meliputi bisnis dan manajemen konsultasi yang meliputi manajemen, jasa konsultasi, saran dan bantuan operasional, perencanaan, pengawasan, evaluasi dan strategi investasi dan pengembangan usaha, analisis dan kelayakan studi layanan bisnis dan kegiatan usaha terkait.
DSI is a privately-held limited liability company, established and operates its business in Indonesia. The scope of activities of DSI is engaged in service industry which covers business and management consultation which cover management, consultation services, advice and operational help, planning, supervising, evaluate and investment and business development strategy, analysis and feasibilities study of business services and related business activities.
BSL merupakan perseroan terbatas berstatus perusahaan tertutup, didirikan dan menjalankan kegiatan usahanya di Indonesia. Ruang lingkup kegiatan BSL adalah bergerak dalam bidang pertambangan batubara dan pengembangan pembangkit listrik mulut tambang. Pada tanggal 28 Juli 2010, BSL telah mendapatkan persetujuan tahap konstruksi dari Direktur Jenderal Geologi dan Sumber Daya Mineral No. 449.K/30/DJB/2010. Persetujuan dari tahap konstruksi diberikan untuk KW96PBO159 dengan luas area sebesar 24.385 hektar di Kabupaten Musi Banyuasin dan Musi Rawas, Propinsi Sumatera Selatan untuk periode 30 Juli 2009 sampai dengan 29 Juli 2012. Selanjutnya, berdasarkan Surat Keputusan No 718.K/30/DJB/2011 tanggal 31 Maret 2011, Direktur Jenderal Geologi dan Sumber Daya Mineral telah menyetujui awal tahap produksi yang berlaku selama 30 tahun.
BSL is a privately-held limited liability company, established and operates its business in Indonesia. The scope of activities of BSL is engaged in coal mining and developing a mine-mouth power plant. As of 28 July 2010, BSL has received construction stage approval from Director General of Geology and Mineral Resources No. 449.K/30/DJB/2010. The approval of construction stage is granted for KW96PBO159 area of 24,385 hectares in Musi Banyuasin and Musi Rawas Regencies, South Sumatra Province for the period from 30 July 2009 up to 29 July 2012. Furthermore, based on Decree No. 718.K/30/DJB/2011 dated 31 March 2011, the Director General of Geology and Mineral Resources has approved the beginning of the production phase which is valid for 30 years.

This report is originally issued in Bahasa Indonesia
4
Berdasarkan keterangan manajemen Perseroan, DSU memiliki mandatory convertible bonds kepada GEBV dengan nilai sebesar USD 6,31 juta (selanjutnya disebut “MCB DSU 1”) dan mandatory convertible
bonds kepada GIL dengan nilai sebesar USD 0,06 juta (selanjutnya disebut “MCB DSU 2”). Mandatory convertible bonds tersebut memberikan hak kepada pemiliknya untuk menukarkan obligasi dengan saham dalam DSU dengan nilai nominal Rp 1.000.000 per lembar saham.
Based on the Company’s management information, DSU has a mandatory convertible bonds owned by GEBV with value of USD 6.31 million (hereinafter referred to as “MCB DSU 1”) and a mandatory convertible bonds owned by GIL with value of USD 0.06 million (hereinafter referred to as “MCB DSU 2”). The mandatory convertible bonds grants the owner the rights to redeem the bonds with shares in the DSU at a nominal value of Rp 1.000.000 per share.
Sejalan dengan rencana strategis Perseroan untuk mengembangkan kegiatan usahanya serta meningkatan sumber daya dan cadangan batubaranya termasuk peningkatan kapasitas produksi yang diharapkan dapat meningkatkan kinerja keuangan Perseroan pada masa mendatang, Perseroan merencanakan untuk melakukan akuisisi atas Saham BSL, Saham DSI, Saham DSU, Saham UNSOCO, MCB DSU 1, dan MCB DSU 2 (selanjutnya disebut “Saham dan MCB”) dari GIL dan GEBV, pihak
yang terafiliasi dengan Perseroan (selanjutnya disebut “Rencana Akuisisi”).
In line with the Company's strategic plan to expand its business activities and increase its coal resources and reserves including increased production capacity which is expected to improve the Company's financial performance in the future, the Company plans to acquired BSL Shares, DSI Shares, DSU Shares, UNSOCO Shares, MCB DSU 1, dan MCB DSU 2 (hereinafter referred to as “Shares and MCB”) from GIL and GEBV, an afilited party with the Company (hereinafter referreed to as “Proposed Acquisition”).
In line with the Company's strategic plan to expand its business activities and increase its coal resources and reserves including increased production capacity which is expected to improve the Company's financial performance in the future, the Company plans to acquired BSL Shares, DSI Shares, DSU Shares, UNSOCO Shares, MCB DSU 1, dan MCB DSU 2 (hereinafter referred to as “Shares and MCB”) from GIL and GEBV, an afilited party with the Company (hereinafter referreed to as “Proposed Acquisition”).
Alasan dilakukannya Rencana Akuisisi adalah sebagai berikut:
Reasons for the Proposed Acquisition are as follows:
• Sejalan dengan rencana strategis Perseroan untuk mengembangkan kegiatan usahanya serta meningkatan sumber daya dan cadangan batubaranya termasuk peningkatan kapasitas produksi yang diharapkan dapat meningkatkan kinerja keuangan Perseroan pada masa mendatang, Perseroan merencanakan untuk melakukan Rencana Akuisisi.
• In line with the Company's strategic plan to expand its business activities and increase its coal resources and reserves including increased production capacity which is expected to improve the Company's financial performance in the future, the Company plans to perform the Proposed Acquisition.
• Dengan dilakukannya Rencana Akuisisi, maka Perseroan berpotensi membukukan pendapatan atas pendapatan BSL melalui UNSOCO dan DSU pada masa mendatang yang diharapkan dapat memberikan kontribusi positif terhadap laporan keuangan konsolidasian Perseroan, dimana setelah Rencana Akuisisi menjadi efektif, Perseroan akan memiliki penyertaan saham pada BSL secara tidak langsung melalui UNSOCO dan DSU dengan kepemilikan efektif sebesar 100,00%.
• With the Proposed Acquisition, the Company has the potential to post earnings on BSL’s revenue through UNSOCO and DSU in the future which is expected to contribute positively to the consolidated financial statements of the Company, whereby after the Proposed Acquisition becomes effective, the Company will have indirect shares participation in BSL through UNSOCO and DSU with the effective ownesrship of 100.00%.

This report is originally issued in Bahasa Indonesia
5
Berdasarkan keterangan yang diperoleh dari manajemen Perseroan, mengingat GIL dan GEBV merupakan pihak yang terafiliasi dengan Perseroan, maka Rencana Akuisisi tersebut merupakan transaksi afiliasi sebagaimana diatur dalam Peraturan Bapepam-LK No. IX.E.1 tentang “Transaksi Afiliasi dan Benturan Kepentingan Transaksi Tertentu” yang dimuat dalam Keputusan Ketua Bapepam-LK No. Kep-412/BL/2009 tanggal 25 November 2009 (selanjutnya disebut “Peraturan IX.E.1”).
Based on the information from the Company’s management, considering GIL and GEBV is an afilited parties with the Company, so the Proposed Acquisition is an affiliated transaction as stipulated in Bapepam-LK Rule No. IX.E.1 concerning "Affiliated and Conflict of Interest in Certain Transaction" as contained in the Decree of the Chairman of Bapepam-LK No. Kep-412/BL/2009 dated 25 November 2009 (hereinafter referred to as "Rule IX.E.1").
Selanjutnya, berdasarkan keterangan yang diperoleh dari manajemen Perseroan, Rencana Akuisisi tersebut merupakan transaksi material, sehingga Perseroan harus memenuhi Peraturan Bapepam-LK No. IX.E.2 tentang “Transaksi Material dan Perubahan Kegiatan Usaha Utama” yang dimuat dalam Keputusan Ketua Bapepam-LK No. Kep-614/BL/2011 tanggal 28 November 2011 (selanjutnya disebut “Peraturan IX.E.2”).
Based on the information from the Company’s management, the Proposed Acquisition is a material transaction that the Company has to comply with Bapepam-LK Rule No. IX.E.2 concerning "Material Transaction and Changes in Core Business Activities" as contained in the Decree of the Chairman of Bapepam-LK No. Kep-614/BL/2011 dated 28 November 2011 (hereinafter referred to as "Rule IX.E.2").
Untuk transaksi yang tergolong dalam kategori transaksi afiliasi dan transaksi material, Peraturan IX.E.1 dan Peraturan IX.E.2 mensyaratkan adanya laporan penilaian atas Obyek Penilaian, yang disiapkan oleh penilai independen.
For transactions categorized as afiliated transaction and material transactions, Rule IX.E.1 dan Rule IX.E.2 requires the valuation report of the Valuation Object, prepared by independent appraisers.
Dengan demikian, dalam rangka pelaksanaan Rencana Akuisisi tersebut, maka manajemen Perseroan menunjuk penilai independen, JKR untuk melakukan penilaian atas Obyek Penilaian.
Therefore, in accordance with the implementation of the Proposed Acquisition, the Company’s management has appointed JKR as independent appraisers to perform the valuation of the Valuation Object.
Mengingat DSU adalah perusahaan tertutup yang sahamnya tidak dapat diperjualbelikan di pasar modal, maka saham DSU bersifat tidak likuid.
Considering that DSU is a privately-held company, whose shares are unable to be traded in the stock market, therefore DSU’s shares are illiquid.
I.B. Obyek serta Tujuan dan Maksud Penilaian I.B. The Valuation Object as well as The
Objective And Purpose Of The Valuation
Obyek yang dinilai dalam penilaian ini adalah nilai pasar wajar atas 100,00% saham DSU (selanjutnya disebut “Obyek Penilaian”).
The valuation object in this valuation is the fair market value of 100.00% shares of DSU (hereinafter referred to as the “Valuation Object”).
Tujuan penilaian adalah untuk memperoleh pendapat yang bersifat independen tentang nilai pasar wajar dari Obyek Penilaian yang dinyatakan dalam mata uang USD dan/atau ekuivalensinya pada tanggal 31 Desember 2016.
The objective of the valuation is to obtain an independent opinion on the fair market value of the Valuation Object stated in USD and/or its equivalency as of 31 December 2016.

This report is originally issued in Bahasa Indonesia
6
Maksud dari penilaian adalah untuk memberikan gambaran tentang nilai pasar wajar dari Obyek Penilaian yang selanjutnya akan digunakan sebagai rujukan dan pertimbangan oleh manajemen Perseroan dalam rangka pelaksanaan Rencana Akuisisi serta untuk memenuhi Peraturan IX.E.1 dan Peraturan IX.E.2.
The purpose of the valuation is to provide an overview on the fair market value of the Valuation Object which would then be used as a reference and consideration by the Company's management in accordance with the implementation of the Proposed Acquisition and to comply with the Rule IX.E.1 and Rule IX.E.2.
Penilaian ini dilaksanakan dengan memenuhi ketentuan-ketentuan dalam Peraturan Bapepam-LK No. VIII.C.3 tentang “Pedoman Penilaian dan Penyajian Laporan Penilaian Usaha di Pasar Modal” yang dimuat dalam Keputusan Ketua Bapepam-LK No. Kep-196/BL/2012 tanggal 19 April 2012 (selanjutnya disebut “Peraturan VIII.C.3”) dan
Standar Penilaian Indonesia (selanjutnya disebut “SPI”) 2015.
This valuation was performed in compliance with the provisions of Bapepam-LK Rule No. VIII.C.3 concerning “Guidelines for Valuation and Presentation of Business Valuation Report in Capital Markets” as contained in the Decree of the Chairman of Bapepam-LK No. Kep-196/BL/2012 dated 19 April 2012 (hereinafter referred to as "Rule VIII.C.3") as well as Indonesian Valuation Standards (hereinafter referred to as "SPI") 2015.
I.C. Premis Penilaian I.C. The Valuation Premise
Kami telah melakukan penilaian atas nilai pasar wajar Obyek Penilaian dengan premis penilaian bahwa DSU adalah sebuah perusahaan yang “going-concern”.
We have performed the valuation on the fair market value of the Valuation Object with the premise that DSU is a "going-concern" company.
I.D. Independensi Penilai I.D. The Independency of Appraisers
Dalam mempersiapkan laporan penilaian, JKR bertindak secara independen tanpa adanya benturan kepentingan dan tidak terafiliasi dengan Perseroan dan DSU ataupun pihak-pihak yang terafiliasi dengan Perseroan dan DSU. JKR juga tidak memiliki kepentingan ataupun keuntungan pribadi terkait dengan penugasan ini. Selanjutnya, laporan penilaian ini tidak dilakukan untuk memberikan keuntungan atau merugikan pihak manapun. Imbalan yang kami terima adalah sama sekali tidak dipengaruhi oleh nilai yang dihasilkan dari proses analisa penilaian ini dan JKR hanya menerima imbalan sesuai dengan surat penugasan No. JK/170206-003 tanggal 6 Februari 2017 yang telah disetujui oleh manajemen Perseroan.
In preparing the valuation report, JKR acted independently without any conflict of interests and were not affiliated with the Company and DSU or the parties affiliated with the Company and DSU. JKR also had no interest or personal advantage associated with this assignment. In addition, this valuation report was not performed to advantage or disadvantage any party. The compensation we received was not affected by the value generated from the analysis process of this valuation and JKR only received the compensation in accordance with JKR’s engagement letter No. JK/170206-003 dated 6 February 2017 which was approved by the Company's management.

This report is originally issued in Bahasa Indonesia
7
I.E. Tanggal Efektif Penilaian I.E. The Effective Date of Valuation
Nilai pasar wajar Obyek Penilaian dalam penilaian diperhitungkan pada tanggal 31 Desember 2016. Tanggal ini dipilih atas dasar pertimbangan kepentingan dan tujuan penilaian serta dari data keuangan DSU yang kami terima. Data keuangan tersebut berupa laporan keuangan konsolidasian DSU untuk periode sembilan bulan yang berakhir pada tanggal 31 Desember 2016 yang menjadi dasar penilaian ini.
The fair market value of the Valuation Object in the valuation was calculated as of 31 December 2016. This date was selected based on the consideration of interests and the objective of the valuation as well as the financial data of DSU that we have received. The financial data was DSU’s consolidated financial statements for nine months period ended 31 December 2016, which became the basis of this valuation.
I.F. Profil PT Dwikarya Sejati Utama I.F. Profile of PT Dwikarya Sejati Utama
DSU didirikan berdasarkan akta notaris No. 40 tanggal 9 Maret 2007 oleh Notaris Sugito Tedjamulja, S.H., notaris di Jakarta. Akta ini telah mendapat persetujuan dari Menteri Kehakiman Republik Indonesia berdasarkan Surat Keputusan No. W7-03628 HT.01.01-TH.2007 tanggal 5 April 2007.
DSU was established based on notarial deed No. 40 dated 9 March 2007 by Notary Sugito Tedjamulja, S.H., notary in Jakarta. This establishment deed was approved by the Minister of Justice of the Republic of Indonesia under Decision Letter No. W7-03628 HT.01.01-TH.2007 dated 5 April 2007.
Anggaran dasar DSU telah mengalami beberapa kali perubahan. Perubahan terakhir berdasarkan akta notaris No. 4 tanggal 23 Juli 2008 oleh Notaris Zulfiah Tenri Abeng, S.H., M.Hum., M.Kn., notaris di Jakarta sehubungan dengan perubahan anggaran dasar DSU untuk disesuaikan dengan Undang-Undang No. 40 Tahun 2007 mengenai Perseroan Terbatas, yang telah disetujui oleh Menteri Kehakiman Republik Indonesia melalui Surat Keputusan No. AHU-63256.AH.01.02 Tahun 2008 tanggal 15 September 2008.
DSU articles of incorporation have been amended several times. The latest amandment based on notarial deed No. 4 dated 23 July 2008 by Notary Zulfiah Tenri Abeng, S.H., M.Hum., M.Kn., notary in Jakarta according to the change of DSU articles of incorporation to conform with Law No. 40 Year 2007 of Limited Liability Company, which has been approved by the Minister of Justice of the Republic Indonesia under Decision Letter No. AHU-63256.AH.01.02 Year 2008 dated 15 September 2008.
I.F.1. Struktur Permodalan I.F.1. Capital Structure
Susunan pemegang saham DSU berikut dengan kepemilikannya pada tanggal 31 Desember 2016 adalah sebagai berikut:
DSU’s shareholders and share ownership structure as of 31 December 2016 were as folows:
Tabel 1 Table 1
PT Dwikarya Sejati Utama PT Dwikarya Sejati Utama
Daftar Kepemilikan dan Struktur Pemegang Saham Details of Shareholders and Share Ownership Structure
(Dalam USD) (In USD )
GMR Energy (Netherlands) B.V. 999 99,90% 108.883 GMR Energy (Netherlands) B.V.
GMR Infrastructure (Overseas) GMR Infrastructure (Overseas)
Limited 1 0,10% 109 Limited
Jumlah 1.000 100,00% 108.992 Total
Pemegang Saham
Jumlah Saham/
Number of
Shares
Persentase
Kepemilikan/
Percentage of
Ownership
Jumlah Modal/
Amount of
Capital
Shareholders

This report is originally issued in Bahasa Indonesia
8
I.F.2. Struktur Pengurus I.F.2. Management Structure
Susunan Komisaris dan Direksi DSU pada tanggal 31 Desember 2016 adalah sebagai berikut:
The of Commisioner and Directors of DSU as of 31 December 2016 were as follows:
Komisaris Avinash Ramakant Shah Commisoner
Direktur Utama Chenna Kesava Reddy Bidala President Director Direktur Venkata Satyanarayana Kollapudi Director
I.F.3. Kegiatan Usaha I.F.3. Business Activities
Kegiatan usaha DSU adalah bergerak dalam bidang modal usaha dan jasa konsultasi manajemen.
The scope of activities of DSU is engaged in venture capital and management consultant.
I.G. Definisi Nilai yang Digunakan I.G. Definition of the Value Used
Untuk keperluan penilaian Obyek Penilaian, dasar nilai yang sesuai untuk digunakan dalam penilaian Obyek Penilaian ini adalah nilai pasar wajar, dimana berdasarkan Peraturan VIII.C.3, nilai pasar wajar didefinisikan sebagai “perkiraan jumlah uang pada tanggal penilaian (cut-off date) yang
dapat diperoleh dari suatu transaksi jual beli obyek penilaian, antara pembeli yang berminat membeli (willing buyer) dan penjual yang berminat menjual (willing seller) dalam
suatu transaksi yang bersifat layak dan wajar”.
For the valuation of the Valuation Object, the appropriate value standard to be used in this valuation is fair market value, which is based on Rule VIII.C.3, fair market value is defined as “the estimated amount of money which can be obtained from the sale and purchase transaction of the valuation object on the valuation date (cut-off date), between buyer who is interested in buying (willing buyer) and seller who is interested in selling (willing seller) in a proper and fair transaction”.
I.H. Pendekatan Penilaian yang Digunakan I.H. The Valuation Approaches Applied
Penilaian Obyek Penilaian didasarkan pada analisa internal dan eksternal. Analisa internal akan berdasarkan pada data yang disediakan oleh manajemen, analisa historis atas laporan posisi keuangan dan laporan laba rugi komprehensif BSL, pengkajian atas kondisi operasi dan manajemen serta sumber daya yang dimiliki BSL. Prospek BSL di masa yang akan datang kami evaluasi berdasarkan rencana usaha serta proyeksi laporan keuangan yang diberikan oleh manajemen yang telah kami kaji kewajaran dan konsistensinya. Analisa eksternal didasarkan pada kajian singkat terhadap faktor-faktor eksternal yang dipertimbangkan sebagai penggerak nilai (value drivers) termasuk juga kajian singkat atas prospek dari industri yang bersangkutan.
The valuation of the Valuation Object relied on internal and external analysis. Internal analysis was performed based on the data provided by the management, historical analysis on BSL’s statements of financial position and statements of comprehensive income, review of BSL’s operating conditions and management as well as resources. BSL’s prospect in the future was evaluated based on the business plans and financial statements projections provided by the management that we have reviewed the fairness and consistency. External analysis was performed based on brief review on external factors considered as the value drivers, including a brief review on the prospects of the related industry.

This report is originally issued in Bahasa Indonesia
9
Dalam mengaplikasikan metode penilaian untuk menentukan indikasi nilai pasar wajar suatu “business interest” perlu beracuan pada laporan keuangan (laporan posisi keuangan dan laporan laba rugi komprehensif) yang representatif, oleh karenanya diperlukan penyesuaian terhadap nilai buku laporan posisi keuangan dan normalisasi keuntungan laporan laba rugi komprehensif yang biasanya disusun oleh manajemen berdasarkan nilai historis. Betapapun nilai buku suatu perusahaan yang direfleksikan dalam laporan posisi keuangan dan laporan laba rugi komprehensif adalah nilai perolehan dan tidak mencerminkan nilai ekonomis yang dapat sepenuhnya dijadikan acuan sebagai nilai pasar wajar saat penilaian tersebut.
In applying the valuation methods to determine the indicative fair market value of a "business interest", it is essential to rely on representative financial statements (statements of financial position and statements of comprehensive income), therefore adjustments are required on the net book value of statements of financial position and the normalization of profit of statements of comprehensive income which are commonly prepared by the management based on historical figures. The company's book value as reflected in statements of financial position and statements of comprehensive income represents the acquisition value and does not reflect the economic value that can be used fully as a reference of the company’s fair market value during the valuation.
I.I. Metode Penilaian yang Digunakan I.I. The Valuation Methods Applied
Metode penilaian yang digunakan dalam penilaian Obyek Penilaian adalah metode diskonto pendapatan ekonomi mendatang, metode akumulasi aset dan metode pembanding perusahaan terbuka.
The valuation methods applied in the valuation of the Valuation Object were discounted future economic income method, asset accumulation method and guideline publicly traded company method.
Metode diskonto pendapatan ekonomi mendatang dipilih mengingat bahwa kegiatan usaha yang dilaksanakan oleh BSL di masa depan masih akan berfluktuasi sesuai dengan perkiraan atas perkembangan usaha BSL. Dalam melaksanakan penilaian dengan metode ini, operasi BSL diproyeksikan sesuai dengan perkiraan atas perkembangan usaha BSL. Pendapatan ekonomi mendatang yang dihasilkan berdasarkan proyeksi laporan keuangan dikonversi menjadi nilai kini dengan tingkat diskonto yang sesuai dengan tingkat risiko. Indikasi nilai adalah total nilai kini dari pendapatan ekonomi mendatang tersebut.
Discounted future economic income method was used considering that the operations carried out by BSL in the future will still fluctuate according to the estimated BSL’s business development. In performing the valuation through this method, BSL’s operations were projected based on the estimated BSL’s business development. Future cash flows generated by financial statements projections were converted into the present value using an appropriate discount rate to the level of risks. Indicative value was the total present value of future cash flows.
Dalam melaksanakan penilaian dengan metode akumulasi aset, nilai dari semua komponen aset dan liabilitas/utang harus disesuaikan menjadi nilai pasar atau nilai pasar wajarnya, kecuali untuk komponen-komponen yang telah menunjukkan nilai pasarnya (seperti kas/bank atau utang bank). Nilai pasar keseluruhan perusahaan kemudian diperoleh dengan menghitung selisih antara nilai pasar seluruh aset (berwujud maupun tak berwujud) dan nilai pasar liabilitas.
In performing the valuation using asset accumulation method, the value of all components of assets and liabilities should be adjusted to its market value or its fair market value, except for component that has indicated its market value (such as cash/bank or bank loan). Overall market value of the company was then obtained by calculating the difference between the market value of all assets (tangible and intangible) and the market value of liabilities.

This report is originally issued in Bahasa Indonesia
10
Metode pembanding peruahaan terbuka digunakan dalam penilaian ini karena walaupun di pasar saham perusahaan terbuka tidak diperoleh informasi mengenai perusahaan sejenis dengan skala usaha dan aset yang setara, namun diperkirakan data saham perusahaan terbuka yang ada dapat digunakan sebagai data perbandingan atas nilai saham yang dimiliki oleh DSU.
Guideline publicly traded company method was used in the valuation despite the unavailability of information for similar companies with similar business scale and assets in public comapnies stock market, but it is expected that the available public companies stock data could be used as comparative data for the value of shares owned by DSU.
Pendekatan dan metode penilaian di atas adalah yang kami anggap paling sesuai untuk diaplikasikan dalam penugasan ini dan telah disepakati oleh pihak manajemen DSU. Tidak tertutup kemungkinan untuk diaplikasikannya pendekatan dan metode penilaian lain yang dapat memberikan hasil yang berbeda.
The approaches and valuation methods above were considered to be the most suitable to be applied in this assignment and had been approved by the management of DSU. It is possible that application of other valuation approaches and methods may give different results.
Selanjutnya, nilai-nilai yang diperoleh dari tiap-tiap metode tersebut direkonsiliasi dengan melakukan pembobotan.
Furthermore, the values obtained from each methods are reconciled by weighting.
I.J. Ringkasan Hasil Penilaian I.J. The Valuation Summaries
Berdasarkan analisa yang telah dilakukan, ringkasan hasil penilaian kami adalah sebagai berikut:
Based on the analysis we have performed, summaries of the results of our valuation are as follows:
I. Nilai Pasar Wajar 100,00% Saham DSU
Berdasarkan Metode Akumulasi Aset I. Fair Market Value of 100.00% Shares of
DSU Based on Assets Accumulation Method
Pada penilaian ini, kami melakukan penilaian atas indikasi nilai pasar wajar penyertaan saham pada entitas anak yang tercatat pada laporan posisi keuangan DSU pada tanggal 31 Desember 2016. Perhitungan indikasi nilai pasar penyertaan saham pada DSI yang tercatat dalam laporan keuangan DSU pada tanggal 31 Desember 2016 dilakukan dengan metode akumulasi aset.
In this valuation, we performed the valuation of indicative market value of investment in subsidiaries recorded in the statements of financial position of DSU as of 31 December 2016. The calculation of indicative fair market value of investment in DSI recorded in the statements of financial position of DSU as of 31 December 2016 was performed by applying asset accumulation method.
Dengan menggunakan metode akumulasi aset, diperoleh hasil bahwa indikasi nilai pasar wajar 100,00% saham DSI adalah sebesar USD 72,17 juta.
By applying asset accumulation method, the indicative fair market value of 100.00% shares of DSI was USD 72.17 million.

This report is originally issued in Bahasa Indonesia
11
Berdasarkan penilaian tersebut, maka indikasi nilai pasar wajar 99,00% saham DSI per tanggal 31 Desember 2016 adalah sebesar USD 71,45 juta. Apabila indikasi nilai pasar wajar penyertaan saham pada entitas anak tersebut direfleksikan dalam laporan posisi keuangan, maka jumlah aset DSU adalah sebesar USD 77,83 juta, sedangkan jumlah liabilitas DSU adalah tetap, yaitu sebesar USD 0,05 juta.
Based on the valuation, indicative fair market value of 99.00% shares of DSI as of 31 December 2016 was USD 71.45 million. If the indicative fair market value of the investment in subsidiaries is reflected to the statements of financial position, total assets of DSU was USD 77.83 million, while total liabilities of DSU is fixed, i.e. was USD 0.05 million.
Indikasi nilai pasar wajar 100,00% saham DSU kemudian diperoleh dengan menghitung selisih antara nilai seluruh aset dan liabilitas. Dengan demikian, pada tanggal 31 Desember 2016, indikasi nilai pasar wajar 100,00% saham DSU sebelum diskon likuiditas pasar adalah sebesar USD 77,78 juta. Dengan diskon likuiditas pasar sebesar 20,00%, maka nilai pasar wajar 100,00% saham DSU adalah sebesar USD 62,23 juta. Dengan demikian, nilai pasar wajar 100,00% saham DSU berdasarkan metode akumulasi aset adalah sebesar USD 62,23 juta.
Indicative fair market value of 100.00% shares of DSU was then obtained by calculating the difference of all assets and liabilities. Therefore, as of 31 December 2016, indicative fair market value of 100.00% shares of DSU was USD 77.78 million. By applying discount for lack of marketabilities of 20.00%, then the fair market value of 100.00% shares of DSU was USD 62.23 million. Therefore, the fair market value of 100.00% shares of DSU based on assets accumulation method was USD 62.23 million.
II. Nilai Pasar Wajar 100,00% Saham DSU
Berdasarkan Metode Pembanding Perusahaan Terbuka
II. Fair Market Value of 100.00% Shares of DSU Based on Guideline Publicly Traded Company Method
Berdasarkan metode pembanding perusahaan terbuka, diperoleh hasil bahwa indikasi nilai pasar wajar 100,00% saham DSU sebelum diskon likuiditas pasar adalah sebesar USD 68,17 juta. Dengan diskon likuiditas pasar sebesar 20,00%, maka nilai pasar wajar 100,00% saham DSU adalah sebesar USD 54,54 juta. Dengan demikian, nilai pasar wajar 100,00% saham DSU berdasarkan metode pembanding perusahaan terbuka adalah sebesar USD 54,54 juta.
Based on guideline publicly traded company method, the indicative fair market value of 100.00% shares of DSU before discount for lack of marketabilities was USD 68.17 million. By applying discount for lack of marketabilities of 20.00%, therefore the fair market value of 100.00% shares of DSU was USD 54.54 million. Therefore, the fair market value of 100.00% shares of DSU based on guideline publicly traded company method was USD 54.54 million.
III. Rekonsiliasi Nilai III. Value Reconciliation
Untuk mendapatkan nilai pasar wajar yang mewakili nilai dari kedua metode penilaian yang digunakan, dilakukan rekonsiliasi dengan terlebih dahulu melakukan pembobotan terhadap nilai pasar wajar yang dihasilkan dari kedua metode tersebut, masing-masing dengan bobot 90,00% untuk metode akumulasi aset dan 10,00% untuk metode pembanding perusahaan terbuka.
To acquire the fair market value that represents the value of both valuation methods applied, reconciliation was performed by firstly weighting the fair market value resulted from both methods, with a weight of 90.00% for assets accumulation method and 10.00% for guideline publicly traded company method, respectively.

This report is originally issued in Bahasa Indonesia
12
Alasan kami memberikan bobot 90,00% untuk metode akumulasi aset dan 10,00% untuk metode pembanding perusahaan terbuka, yaitu karena data-data dan informasi yang digunakan pada metode akumulasi aset yang kami gunakan untuk menentukan nilai pasar wajar Obyek Penilaian merupakan data-data dan informasi yang memiliki tingkat kehandalan yang lebih memadai dibandingkan dengan data-data dan informasi yang digunakan pada metode pembanding perusahaan terbuka.
The reason we weighted 90.00% for assets accumulation method and 10.00% for guideline publicly traded company method was because the data and information used in assets accumulaton method that we used to determine the fair market value of the Valuation Object was the data and information that represented more adequate level of reliability compared to the data and information used in guideline publicly traded company method.
Berdasarkan hasil rekonsiliasi tersebut, diperoleh hasil bahwa nilai pasar wajar Obyek Penilaian adalah sebesar USD 61,46 juta.
Based on the reconciliation result, the fair market value of the Valuation Object was USD 61.46 million.
Sehubungan dengan penilaian ini, kami ingin menekankan bahwa indikasi nilai pasar wajar yang dihitung dengan metode diskonto pendapatan ekonomi mendatang didasarkan atas asumsi-asumsi mengenai tingkat pendapatan, beban dan akun-akun laporan posisi keuangan yang dikembangkan pihak manajemen BSL melalui analisa atas kinerja historis dan pernyataan manajemen BSL mengenai rencana-rencana untuk masa yang akan datang sebelum Rencana Akuisisi. Kami melakukan penelaahan atas asumsi-asumsi tersebut dan menurut pendapat kami, asumsi-asumsi tersebut wajar. Akan tetapi, kami tidak bertanggung jawab atas asumsi-asumsi tersebut. Setiap perubahan dari asumsi-asumsi ini akan mempengaruhi perhitungan nilai pasar wajar Obyek Penilaian. Karena tidak ada kepastian bahwa dasar-dasar dan asumsi-asumsi tersebut akan terealisasi, kami tidak dapat memberikan jaminan bahwa hasil-hasil yang diproyeksikan akan tercapai.
In connection with this valuation, we would like to emphasize that the fair market value calculated using discounted future economic income method relied on the assumptions of the revenues, expenses and accounts of statements of financial position developed by the management of BSL through analysis of historical performance and the statements of BSL’s management concerning future plans before the Proposed Acquisition. We have reviewed those assumptions and in our opinion, those assumptions were reasonable. However, we are not responsible for those assumptions. Any changes to those assumptions would affect the calculation of fair market value of the Valuation Object. Since there is not any certainty that the principles and assumptions would be realized, we could not provide assurance that the projected results would be achieved.
I.K. Kesimpulan Penilaian I.K. The Valuation Conclusion
Berdasarkan hasil analisa atas seluruh data dan informasi yang telah kami terima dan dengan mempertimbangkan semua faktor yang relevan yang mempengaruhi penilaian, maka menurut pendapat kami, nilai pasar wajar Obyek Penilaian pada tanggal 31 Desember 2016 adalah sebesar USD 61,46 juta.
Based on the analysis of all data and information that we have received and by considering all relevant factors affecting the valuation, therefore in our opinion, the fair market value of the Valuation Object as of 31 December 2016 was USD 61.46 million.

This report is originally issued in Bahasa Indonesia
13
Nilai pasar wajar Obyek Penilaian tersebut kami tentukan berdasarkan data dan informasi yang kami peroleh dari pihak manajemen Perseroan dan DSU serta pihak-pihak lain yang relevan dengan penilaian. Kami menganggap bahwa semua informasi tersebut adalah benar dan bahwa tidak ada keadaan atau hal-hal yang tidak terungkap yang akan mempengaruhi nilai pasar wajar tersebut secara material.
The fair market value of the Valuation Object was determined based on the data and information that we have received from the management of the Company and DSU as well as other parties relevant to the valuation. We assumed that such information was correct and there were no circumstances or events that were not disclosed to us which could materially affect the results of the fair market value.
Kami tidak melakukan penyelidikan dan juga bukan merupakan tanggung jawab kami kemungkinan terjadinya masalah yang berkaitan dengan status hukum kepemilikan, kewajiban utang dan/atau sengketa atas DSU. Kami tegaskan pula bahwa kami tidak memperoleh manfaat atau keuntungan apapun baik saat ini maupun di masa datang dan imbalan jasa yang telah disetujui atas penilaian DSU tidak tergantung pada nilai yang dilaporkan.
We did not perform an investigation and were not responsible for the possibility of problems related to the legal status of ownership, debt obligations and/or disputes over DSU. We also emphasized that we did not acquire any benefit or advantage either in present or in the future and the approved fees for valuation of DSU did not depend on the reported value.

This report is originally issued in Bahasa Indonesia
14
II. DESKRIPSI PENUGASAN II. DESCRIPTIONS OF THE ASSIGNMENT
II.A. Alasan dan Latar Belakang II.A. Reasons and Background
Perseroan merupakan perseroan terbatas berstatus perusahaan terbuka, didirikan dan menjalankan kegiatan usahanya di Indonesia. Ruang lingkup kegiatan Perseroan adalah bergerak dalam bidang pertambangan melalui penyertaan pada entitas anaknya dan perdagangan batubara serta perdagangan lainnya. Perseroan memulai kegiatan komersialnya pada tahun 2010. Pada tanggal 4 Februari 2011, berdasarkan Keputusan Menteri Energi dan Sumber Daya Mineral No. 206.K./30/DJB/2011, Perseroan memperoleh Ijin Usaha Pertambangan Operasi Produksi Khusus untuk Pengangkutan dan Penjualan Batubara untuk jangka waktu 3 tahun dan berdasarkan Keputusan Menteri Energi dan Sumber Daya Mineral No. 358.K/30/DJB/2014 tanggal 7 April 2014, jangka waktu tersebut diperpanjang selama 3 tahun. Perseroan berkantor pusat di Sinar Mas Land Plaza, Menara II Lantai 6, Jalan M.H. Thamrin Kavling 51, Jakarta Pusat 10350 dengan nomor telepon: (021) 50186 888 dan nomor faksimili: (021) 31990 319 serta alamat website: www.goldenenergymines.com.
The Company is a publicly-held limited liability company, established and operates its business in Indonesia. The scope of activities of the Company is engaged in coal mining through its subsidiaries and in coal and other trading activities. The Company started its commercial operations in 2010. On 4 February 2011, based on the Decision of the Ministry of Energy and Mineral Resource No. 206.K./30/DJB/2011, the Company obtained Particular License of IUP Operation Production for Transportation and Trade of Coal which is valid for 3 years and based on the Decision of the Ministry of Energy and Mineral Resource No. 358.K/30/DJB/2014 dated 7 April 2014, the period has been extended for another 3 years. The Company’s main office is located in Jakarta and located at Sinar Mas Land Plaza, Tower II, 6th Floor, Jalan M.H. Thamrin Kavling 51, Jakarta Pusat 10350, with telephone number: (021) 50186 888, faximile number: (021) 31990 319 and website: www.goldenenergymines.com.
Berdasarkan keterangan yang diperoleh dari manajemen Perseroan, pada tanggal 31 Desember 2016, GEBV dan GIL memiliki beberapa penyertaan saham dengan rincian sebagai berikut:
Based on the information from the Company’s management, as of 31 December 2016, GEBV dan GIL has some subsidiaries with the details are as follows:
• GIL dan GEBV memiliki Saham UNSOCO;
• GIL and GEBV own the UNSOCO Shares;
• GIL dan GEBV memiliki Saham DSU; • GIL and GEBV own the DSU Shares;
• GIL dan GEBV melalui DSU memiliki Saham DSI; dan
• GIL and GEBV through DSU own the DSI Shares; and
• GIL dan GEBV melalui DSU, DSI serta UNSOCO memiliki Saham BSL.
• GIL and GEBV through DSU, DSI as well as UNSOCO own the BSL Shares.
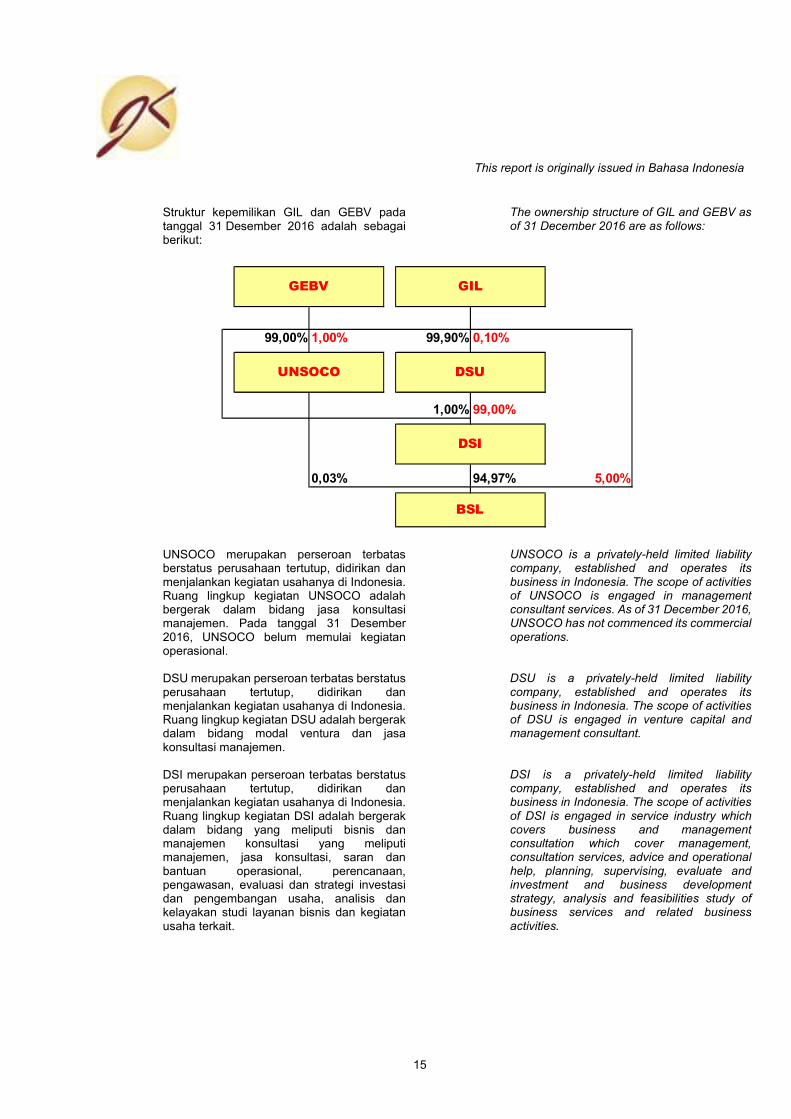
This report is originally issued in Bahasa Indonesia
15
Struktur kepemilikan GIL dan GEBV pada tanggal 31 Desember 2016 adalah sebagai berikut:
The ownership structure of GIL and GEBV as of 31 December 2016 are as follows:
UNSOCO merupakan perseroan terbatas berstatus perusahaan tertutup, didirikan dan menjalankan kegiatan usahanya di Indonesia. Ruang lingkup kegiatan UNSOCO adalah bergerak dalam bidang jasa konsultasi manajemen. Pada tanggal 31 Desember 2016, UNSOCO belum memulai kegiatan operasional.
UNSOCO is a privately-held limited liability company, established and operates its business in Indonesia. The scope of activities of UNSOCO is engaged in management consultant services. As of 31 December 2016, UNSOCO has not commenced its commercial operations.
DSU merupakan perseroan terbatas berstatus perusahaan tertutup, didirikan dan menjalankan kegiatan usahanya di Indonesia. Ruang lingkup kegiatan DSU adalah bergerak dalam bidang modal ventura dan jasa konsultasi manajemen.
DSU is a privately-held limited liability company, established and operates its business in Indonesia. The scope of activities of DSU is engaged in venture capital and management consultant.
DSI merupakan perseroan terbatas berstatus perusahaan tertutup, didirikan dan menjalankan kegiatan usahanya di Indonesia. Ruang lingkup kegiatan DSI adalah bergerak dalam bidang yang meliputi bisnis dan manajemen konsultasi yang meliputi manajemen, jasa konsultasi, saran dan bantuan operasional, perencanaan, pengawasan, evaluasi dan strategi investasi dan pengembangan usaha, analisis dan kelayakan studi layanan bisnis dan kegiatan usaha terkait.
DSI is a privately-held limited liability company, established and operates its business in Indonesia. The scope of activities of DSI is engaged in service industry which covers business and management consultation which cover management, consultation services, advice and operational help, planning, supervising, evaluate and investment and business development strategy, analysis and feasibilities study of business services and related business activities.
99,00% 1,00% 99,90% 0,10%
1,00% 99,00%
0,03% 94,97% 5,00%
GILGEBV
DSI
BSL
UNSOCO DSU
This report is originally issued in Bahasa Indonesia
16
BSL merupakan perseroan terbatas berstatus perusahaan tertutup, didirikan dan menjalankan kegiatan usahanya di Indonesia. Ruang lingkup kegiatan BSL adalah bergerak dalam bidang pertambangan batubara dan pengembangan pembangkit listrik mulut tambang. Pada tanggal 28 Juli 2010, BSL telah mendapatkan persetujuan tahap konstruksi dari Direktur Jenderal Geologi dan Sumber Daya Mineral No. 449.K/30/DJB/2010. Persetujuan dari tahap konstruksi diberikan untuk KW96PBO159 dengan luas area sebesar 24.385 hektar di Kabupaten Musi Banyuasin dan Musi Rawas, Propinsi Sumatera Selatan untuk periode 30 Juli 2009 sampai dengan 29 Juli 2012. Selanjutnya, berdasarkan Surat Keputusan No 718.K/30/DJB/2011 tanggal 31 Maret 2011, Direktur Jenderal Geologi dan Sumber Daya Mineral telah menyetujui awal tahap produksi yang berlaku selama 30 tahun.
BSL is a privately-held limited liability company, established and operates its business in Indonesia. The scope of activities of BSL is engaged in coal mining and developing a mine-mouth power plant. As of 28 July 2010, BSL has received construction stage approval from Director General of Geology and Mineral Resources No. 449.K/30/DJB/2010. The approval of construction stage is granted for KW96PBO159 area of 24,385 hectares in Musi Banyuasin and Musi Rawas Regencies, South Sumatra Province for the period from 30 July 2009 up to 29 July 2012. Furthermore, based on Decree No. 718.K/30/DJB/2011 dated 31 March 2011, the Director General of Geology and Mineral Resources has approved the beginning of the production phase which is valid for 30 years.
Berdasarkan keterangan manajemen Perseroan, DSU memiliki MCB DSU 1 dan MCB DSU 2. Mandatory convertible bonds tersebut memberikan hak kepada pemiliknya untuk menukarkan obligasi dengan saham dalam DSU dengan nilai nominal Rp 1.000.000 per lembar saham.
Based on the Company’s management information, DSU has a MCB DSU 1 and a MCB DSU 2. The mandatory convertible bonds grants the owner the rights to redeem the bonds with shares in the DSU at a nominal value of Rp 1.000.000 per share.
Sejalan dengan rencana strategis Perseroan untuk mengembangkan kegiatan usahanya serta meningkatan sumber daya dan cadangan batubaranya termasuk peningkatan kapasitas produksi yang diharapkan dapat meningkatkan kinerja keuangan Perseroan pada masa mendatang, Perseroan merencanakan untuk melakukan Rencana Akuisisi.
In line with the Company's strategic plan to expand its business activities and increase its coal resources and reserves including increased production capacity which is expected to improve the Company's financial performance in the future, the Company plans to acquired BSL Shares, DSI Shares, DSU Shares, UNSOCO Shares, MCB DSU 1, dan MCB DSU 2 (hereinafter referred to as “Shares and MCB”) from GIL and GEBV, an afilited party with the Company (hereinafter referreed to as “Proposed Acquisition”).
In line with the Company's strategic plan to expand its business activities and increase its coal resources and reserves including increased production capacity which is expected to improve the Company's financial performance in the future, the Company plans to conduct Proposed Acquisition.
Alasan dilakukannya Rencana Akuisisi adalah sebagai berikut:
Reasons for the Proposed Acquisition are as follows:
• Sejalan dengan rencana strategis Perseroan untuk mengembangkan kegiatan usahanya serta meningkatan sumber daya dan cadangan batubaranya termasuk peningkatan kapasitas produksi yang diharapkan dapat meningkatkan kinerja keuangan Perseroan pada masa mendatang, Perseroan merencanakan untuk melakukan Rencana Akuisisi.
• In line with the Company's strategic plan to expand its business activities and increase its coal resources and reserves including increased production capacity which is expected to improve the Company's financial performance in the future, the Company plans to perform the Proposed Acquisition.

This report is originally issued in Bahasa Indonesia
17
• Dengan dilakukannya Rencana Akuisisi, maka Perseroan berpotensi membukukan pendapatan atas pendapatan BSL melalui UNSOCO dan DSU pada masa mendatang yang diharapkan dapat memberikan kontribusi positif terhadap laporan keuangan konsolidasian Perseroan, dimana setelah Rencana Akuisisi menjadi efektif, Perseroan akan memiliki penyertaan saham pada BSL secara tidak langsung melalui UNSOCO dan DSU dengan kepemilikan efektif sebesar 100,00%.
• With the Proposed Acquisition, the Company has the potential to post earnings on BSL’s revenue through UNSOCO and DSU in the future which is expected to contribute positively to the consolidated financial statements of the Company, whereby after the Proposed Acquisition becomes effective, the Company will have indirect shares participation in BSL through UNSOCO and DSU with the effective ownesrship of 100.00%.
Berdasarkan keterangan yang diperoleh dari manajemen Perseroan, mengingat GIL dan GEBV merupakan pihak yang terafiliasi dengan Perseroan, maka Rencana Akuisisi tersebut merupakan transaksi afiliasi sebagaimana diatur dalam Peraturan IX.E.1.
Based on the information from the Company’s management, considering GIL and GEBV is an afilited parties with the Company, so the Proposed Acquisition is an affiliated transaction as stipulated in Rule IX.E.1.
Selanjutnya, berdasarkan keterangan yang diperoleh dari manajemen Perseroan, Rencana Akuisisi tersebut merupakan transaksi material, sehingga Perseroan harus memenuhi Peraturan IX.E.2.
Based on the information from the Company’s management, the Proposed Acquisition is a material transaction that the Company has to comply with Rule IX.E.2.
Untuk transaksi yang tergolong dalam kategori transaksi afiliasi dan transaksi material, Peraturan IX.E.1 dan Peraturan IX.E.2 mensyaratkan adanya laporan penilaian atas Obyek Penilaian, yang disiapkan oleh penilai independen.
For transactions categorized as afiliated transaction and material transactions, Rule IX.E.1 dan Rule IX.E.2 requires the valuation report of the Valuation Object, prepared by independent appraisers.
Dengan demikian, dalam rangka pelaksanaan Rencana Akuisisi tersebut, maka manajemen Perseroan menunjuk penilai independen, JKR untuk melakukan penilaian atas Obyek Penilaian.
Therefore, in accordance with the implementation of the Proposed Acquisition, the Company’s management has appointed JKR as independent appraisers to perform the valuation of the Valuation Object.
Mengingat DSU adalah perusahaan tertutup yang sahamnya tidak dapat diperjualbelikan di pasar modal, maka saham DSU bersifat tidak likuid.
Considering that DSU is a privately-held company, whose shares are unable to be traded in the stock market, therefore DSU’s shares are illiquid.
II.B. Tujuan dan Maksud Penilaian II.B. The Objective and Purpose of the
Valuation
Tujuan penilaian adalah untuk memperoleh pendapat yang bersifat independen tentang nilai pasar wajar dari Obyek Penilaian yang dinyatakan dalam mata uang USD dan/atau ekuivalensinya pada tanggal 31 Desember 2016.
The objective of the valuation is to obtain an independent opinion on the fair market value of the Valuation Object stated in USD and/or its equivalency as of 31 December 2016.

This report is originally issued in Bahasa Indonesia
18
Maksud dari penilaian adalah untuk memberikan gambaran tentang nilai pasar wajar dari Obyek Penilaian yang selanjutnya akan digunakan sebagai rujukan dan pertimbangan oleh manajemen Perseroan dalam rangka pelaksanaan Rencana Akuisisi serta untuk memenuhi Peraturan IX.E.1 dan Peraturan IX.E.2.
The purpose of the valuation is to provide an overview on the fair market value of the Valuation Object which would then be used as a reference and consideration by the Company's management in accordance with the implementation of the Proposed Acquisition and to comply with the Rule IX.E.1 and Rule IX.E.2.
Penilaian ini dilaksanakan dengan memenuhi ketentuan-ketentuan dalam Peraturan VIII.C.3 dan SPI 2015.
This valuation was performed in compliance with the provisions of Rule VIII.C.3 as well as SPI 2015.
II.C. Definisi Nilai yang Digunakan II.C. Definition of the Value Used
Untuk keperluan penilaian Obyek Penilaian, dasar nilai yang sesuai untuk digunakan dalam penilaian Obyek Penilaian ini adalah nilai pasar wajar, dimana berdasarkan Peraturan VIII.C.3, nilai pasar wajar didefinisikan sebagai “perkiraan jumlah uang pada tanggal penilaian (cut-off date) yang
dapat diperoleh dari suatu transaksi jual beli obyek penilaian, antara pembeli yang berminat membeli (willing buyer) dan penjual yang berminat menjual (willing seller) dalam
suatu transaksi yang bersifat layak dan wajar”.
For the valuation of the Valuation Object, the appropriate value standard to be used in this valuation is fair market value, which is based on Rule VIII.C.3, fair market value is defined as “the estimated amount of money which can be obtained from the sale and purchase transaction of the valuation object on the valuation date (cut-off date), between buyer who is interested in buying (willing buyer) and seller who is interested in selling (willing seller) in a proper and fair transaction”.
II.D. Tanggal Efektif Penilaian II.D. The Effective Date of Valuation
Nilai pasar wajar Obyek Penilaian dalam penilaian diperhitungkan pada tanggal 31 Desember 2016. Tanggal ini dipilih atas dasar pertimbangan kepentingan dan tujuan penilaian serta dari data keuangan DSU yang kami terima. Data keuangan tersebut berupa laporan keuangan konsolidasian DSU untuk periode sembilan bulan yang berakhir pada tanggal 31 Desember 2016 yang menjadi dasar penilaian ini.
The fair market value of the Valuation Object in the valuation was calculated as of 31 December 2016. This date was selected based on the consideration of interests and the objective of the valuation as well as the financial data of DSU that we have received. The financial data was DSU’s consolidated financial statements for nine months period ended 31 December 2016, which became the basis of this valuation.
II.E. Data dan Informasi yang Digunakan Dalam
Penilaian II.E. Data and Information Used in the Valuation
Dalam melakukan penilaian untuk memperkirakan nilai pasar wajar Obyek Penilaian, kami telah menelaah, mempertimbangkan, mengacu atau melaksanakan prosedur atas data dan informasi sebagai berikut:
In performing the valuation to estimate the fair market value of the Valuation Object, we have reviewed, considered, referred or performed the procedures on the data and information as follows:
1. Keterbukaan Informasi sehubungan
dengan Rencana Akuisisi yang disusun oleh manajemen Perseroan;
1. Information Disclosure in relation with the Proposed Acquisition prepared by the Company’s management;

This report is originally issued in Bahasa Indonesia
19
2. Laporan keuangan konsolidasian DSU
untuk periode sembilan bulan yang berakhir pada tanggal 31 Desember 2016 yang telah diaudit oleh Kantor Akuntan Publik (selanjutnya disebut “KAP”) Gani
Sigiro & Handayani (selanjutnya disebut “GSH”) sebagaimana tertuang dalam
laporannya No. O-001/GSH/17/EA tanggal 6 Februari 2017 dengan pendapat wajar tanpa pengecualian;
2. Consolidated financial statements of DSU for nine months period ended 31 December 2016 audited by Public Accountant Firm (hereinafter referred to as “KAP”) Gani Sigiro & Handayani (hereinafter referred to as “GSH”) as stated in report No. O-001/GSH/17/EA dated 6 February 2017 with an unqualified opinion;
3. Laporan keuangan konsolidasian DSU
untuk tahun yang berakhir pada tanggal 31 Maret 2016 yang telah diaudit oleh KAP GSH sebagaimana tertuang dalam laporannya No. A-142/GSH/16/EA tanggal 15 April 2016 dengan pendapat wajar tanpa pengecualian;
3. Consolidated financial statements of DSU for the year ended 31 March 2016 audited by KAP GSH as stated in report No. A-142/GSH/16/EA dated 15 April 2016 with an unqualified opinion;
4. Laporan keuangan konsolidasian DSU
untuk tahun yang berakhir pada tanggal 31 Maret 2015 yang telah diaudit oleh KAP GSH sebagaimana tertuang dalam laporannya No. A-152/GSH/15/VTS tanggal 21 April 2015 dengan pendapat wajar tanpa pengecualian;
4. Consolidated financial statements of DSU for the year ended 31 March 2015 audited by KAP GSH as stated in report No. A-152/GSH/15/VTS dated 21 April 2015 with an unqualified opinion;
5. Laporan keuangan konsolidasian DSU untuk tahun yang berakhir pada tanggal 31 Maret 2014 yang telah diaudit oleh KAP GSH sebagaimana tertuang dalam laporannya No. A-089/GSH/14/CP tanggal 23 April 2014 dengan pendapat wajar tanpa pengecualian;
5. Consolidated financial statements of DSU for the year ended 31 March 2014 audited by KAP GSH as stated in report No. A-089/GSH/14/CP dated 23 April 2014 with an unqualified opinion;
6. Laporan keuangan konsolidasian DSU
untuk tahun yang berakhir pada tanggal 31 Maret 2013 dengan angka perbandingan untuk tahun yang berakhir pada tanggal 31 Maret 2012 yang telah diaudit oleh KAP Gani Mulyadi & Handayani (selanjutnya disebut “GMH”)
sebagaimana tertuang dalam laporannya No. A-084/GMH/13/EA tanggal 15 April 2013 dengan pendapat wajar tanpa pengecualian;
6. Consolidated financial statements of DSU for the year ended 31 March 2013 with the comparable figures for the year ended 31 March 2012 audited by KAP Gani Mulyadi & Handayani (hereinafter referred to as “GMH”) as stated in report No. A-084/GMH/13/EA dated 15 April 2013 with an unqualified opinion;
7. Laporan keuangan konsolidasian DSI
untuk periode sembilan bulan yang berakhir pada tanggal 31 Desember 2016 yang telah diaudit oleh KAP GSH sebagaimana tertuang dalam laporannya No. A-026/GSH/17/EA tanggal 15 Februari 2017 dengan pendapat wajar tanpa pengecualian;
7. Consolidated financial statements of DSI for nine months period ended 31 December 2016 audited by KAP GSH as stated in report No. A-026/GSH/17/EA dated 15 February 2017 with an unqualified opinion;
This report is originally issued in Bahasa Indonesia
20
8. Laporan keuangan BSL untuk periode
sembilan bulan yang berakhir pada tanggal 31 Desember 2016 yang telah diaudit oleh KAP GSH sebagaimana tertuang dalam laporannya No. A-020/GSH/17/EA tanggal 14 Februari 2017 dengan pendapat wajar tanpa pengecualian;
8. Financial statements of BSL for nine months period ended 31 December 2016 audited by KAP GSH as stated in report No. A-020/GSH/17/EA dated 14 February 2017 with an unqualified opinion;
9. Laporan keuangan BSL untuk tahun yang
berakhir pada tanggal 31 Maret 2016 yang telah diaudit oleh KAP GSH sebagaimana tertuang dalam laporannya No. A-140/GSH/16/EA tanggal 13 April 2016 dengan pendapat wajar tanpa pengecualian;
9. Financial statements of BSL for the year ended 31 March 2016 audited by KAP GSH as stated in report No. A-140/GSH/16/EA dated 13 April 2016 with an unqualified opinion;
10. Laporan keuangan BSL untuk tahun yang
berakhir pada tanggal 31 Maret 2015 yang telah diaudit oleh KAP GSH sebagaimana tertuang dalam laporannya No. A-150/GSH/15/VTS tanggal 19 April 2015 dengan pendapat wajar tanpa pengecualian;
10. Financial statements of BSL for the year ended 31 March 2015 audited by KAP GSH as stated in report No. A-150/GSH/15/VTS dated 19 April 2015 with an unqualified opinion;
11. Laporan keuangan BSL untuk tahun yang
berakhir pada tanggal 31 Maret 2014 yang telah diaudit oleh KAP GSH sebagaimana tertuang dalam laporannya No. A-134/GSH/14/CP tanggal 21 April 2014 dengan pendapat wajar tanpa pengecualian;
11. Financial statements of BSL for the year ended 31 March 2014 audited by KAP GSH as stated in report No. A-134/GSH/14/CP dated 21 April 2014 with an unqualified opinion;
12. Laporan keuangan BSL untuk tahun yang
berakhir pada tanggal 31 Maret 2013 yang telah diaudit oleh KAP GMH sebagaimana tertuang dalam laporannya No. A-082/GMH/13/EA tanggal 15 April 2013 dengan pendapat wajar tanpa pengecualian;
12. Financial statements of BSL for the year ended 31 March 2013 audited by KAP GMH as stated in report No. A-082/GMH/13/EA dated 15 April 2013 with an unqualified opinion;
13. Laporan keuangan BSL untuk tahun yang
berakhir pada tanggal 31 Maret 2012 yang telah diaudit oleh KAP GMH sebagaimana tertuang dalam laporannya No. A-093/GMH/12/EA tanggal 20 April 2012 dengan pendapat wajar tanpa pengecualian;
13. Financial statements of BSL for the year ended 31 March 2012 audited by KAP GMH as stated in report No. A-093/GMH/12/EA dated 20 April 2012 with an unqualified opinion;
14. Proyeksi laporan keuangan BSL untuk
tahun yang berakhir pada tanggal-tanggal 31 Desember 2017 – 2039 yang disusun oleh manajemen BSL;
14. Financial statements projections of BSL for the years ended 31 December 2017 – 2039 prepared by BSL’s management;
15. PT Bara Sentosa Lestari Project –
Independent Qualified Person’s Report South Block – March 2017 sebagaimana tertuang dalam laporannya tanggal 20 Maret 2017;
15. PT Bara Sentosa Lestari Project – Independent Qualified Person’s Report South Block – March 2017 dated 20 March 2017;
This report is originally issued in Bahasa Indonesia
21
16. Anggaran dasar DSU yang terakhir
sebagaimana dinyatakan dalam akta No. 4 tanggal 23 Juli 2008 dari Zulfiah Tenri Abeng, S.H., M.Hum., M.Kn., notaris di Jakarta mengenai perubahan anggaran dasar DSU untuk disesuaikan dengan Undang-Undang No. 40 Tahun 2007 mengenai Perseroan Terbatas;
16. Recent articles of association of DSU as stated in deed No. 4 dated 23 July 2008 Zulfiah Tenri Abeng, S.H., M.Hum., M.Kn., notary in Jakarta regarding the amandment of the DSU articles of association to confirm with Law No. 40 Year 2007 regarding Limited Liability Company;
17. Hasil wawancara dengan pihak
manajemen Perseroan, yaitu Kumar Krishnan dengan posisi sebagai Direktur, mengenai alasan, latar belakang dan hal-hal lain yang terkait dengan Rencana Akuisisi;
17. Interviews with the Company’s management, i.e. Kumar Krishnan as Director, concerning the reasons, background and other matters related to the Proposed Acquisition;
18. Tarif pajak yang diberlakukan atas BSL
adalah berdasarkan laba kena pajak dalam periode yang bersangkutan yang dihitung berdasarkan tarif pajak yang berlaku umum, yaitu sebesar 25,00%;
18. The tax rate applied on BSL is based on taxable income for the period which is calculated based on the applicable general tax rate of Indonesia, i.e. 25.00%;
19. Informasi lain dari pihak manajemen
Perseroan dan DSU serta pihak-pihak lain yang relevan untuk penugasan;
19. Other information from the management of the Company and DSU as well as other parties relevant to the assignment;
20. Data dan informasi industri berdasarkan
media cetak maupun elektronik, antara lain website Aswath Damodaran, website Bank Indonesia, website Bursa Efek
Indonesia dan Bloomberg;
20. Industrial data and information based on both newspapers and electronic media, i.e. website of Aswath Damodaran, website of Bank of Indonesia, website of Indonesia Stock Exchange and Bloomberg;
21. Data dan informasi pasar berdasarkan
media cetak maupun elektronik, antara lain website Aswath Damodaran, website Bank Indonesia, website Bursa Efek Indonesia dan Bloomberg;
21. Market data and information based on both newspapers and electronic media, i.e. website of Aswath Damodaran, website of Bank of Indonesia, website of Indonesia Stock Exchange and Bloomberg;
22. Data dan informasi ekonomi berdasarkan
media cetak maupun elektronik, antara lain website Aswath Damodaran, website Bank Indonesia, website Bursa Efek Indonesia dan Bloomberg;
22. Economic data and information based on both newspapers and electronic media, i.e. website of Aswath Damodaran, website of Bank of Indonesia, website of Indonesia Stock Exchange and Bloomberg;
23. Dokumen-dokumen lain yang
berhubungan dengan Rencana Akuisisi; dan
23. Other documents related to the Proposed Acquisition; and
24. Berbagai sumber informasi baik
berdasarkan media cetak maupun elektronik dan hasil analisa lain yang kami anggap relevan.
24. Various relevant sources of information on both newspapers and electronic media and other analysis we considered relevant.

This report is originally issued in Bahasa Indonesia
22
Dalam melaksanakan analisa, kami mengasumsikan dan bergantung pada keakuratan dan kelengkapan dari semua informasi keuangan dan informasi-informasi lain yang diberikan kepada kami oleh Perseroan dan DSU atau yang tersedia secara umum dan kami tidak bertanggung jawab atas kebenaran informasi-informasi tersebut.
In performing the analysis, we assumed and relied on the accuracy and completeness of all financial information and other information provided to us by the Company and DSU or publicly available and we are not responsible for the accuracy of such information.
Kami tidak memberikan pendapat atas dampak perpajakan dari DSU. Jasa-jasa yang kami berikan kepada Perseroan hanya merupakan penilaian atas Obyek Penilaian dan bukan jasa-jasa akuntansi, audit atau perpajakan. Pekerjaan kami yang berkaitan dengan penilaian tidak merupakan dan tidak dapat ditafsirkan merupakan dalam bentuk apapun, suatu penelaahan atau audit atau pelaksanaan prosedur-prosedur tertentu atas informasi keuangan. Pekerjaan tersebut juga tidak dapat dimaksudkan untuk mengungkapkan kelemahan dalam pengendalian internal, kesalahan atau penyimpangan dalam laporan keuangan atau pelanggaran hukum. Selain itu, kami tidak mempunyai kewenangan dan tidak mencoba mendapatkan bentuk transaksi-transaksi lainnya yang dilakukan Perseroan.
We did not give an opinion on the tax impact of DSU. The service we provided to the Company merely was the valuation of the Valuation Object, not accounting services, auditing or taxation. Our work related to the valuation was not and could not be interpreted in any form, a review or an audit or an implementation of certain procedures of financial information. The work was also not intended to reveal weaknesses in internal control, errors or irregularities in the financial statements or violation of law. In addition, we did not have the authority and did not attempt to obtain other forms of transactions performed by the Company.
II.F. Informasi Non-Keuangan II.F. Non-Financial Information
II.F.1. Produk dan/atau Jasa yang Dihasilkan II.F.1. Products and/or Services Generated
Ruang lingkup kegiatan DSU adalah bergerak dalam bidang modal usaha dan jasa konsultasi manajemen.
The scope of activities of DSU is engaged in venture capital and management consultant
Berdasarkan keterangan yang diperoleh dari manajemen Perseroan, pada tanggal 31 Desember 2016, DSU memiliki penyertaan saham secara tidak langsung atas BSL melalui DSI dengan kepemilikan sebesar 94,97%.
Based on the information from the Company’s management, as of 31 December 2016, DSU has indirect shareholding of BSL through DSI with an ownership of 94.97%.
This report is originally issued in Bahasa Indonesia
23
Ruang lingkup kegiatan BSL adalah bergerak dalam bidang pertambangan batubara dan pengembangan pembangkit listrik mulut tambang. Pada tanggal 28 Juli 2010, BSL telah mendapatkan persetujuan tahap konstruksi dari Direktur Jenderal Geologi dan Sumber Daya Mineral No. 449.K/30/DJB/2010. Persetujuan dari tahap konstruksi diberikan untuk KW96PBO159 dengan luas area sebesar 24.385 hektar di Kabupaten Musi Banyuasin dan Musi Rawas, Propinsi Sumatera Selatan untuk periode 30 Juli 2009 sampai dengan 29 Juli 2012. Selanjutnya, berdasarkan Surat Keputusan No. 718.K/30/DJB/2011 tanggal 31 Maret 2011, Direktur Jenderal Geologi dan Sumber Daya Mineral telah menyetujui awal tahap produksi yang berlaku selama 30 tahun.
The scope of activities of BSL is engaged in coal mining and developing a mine-mouth power plant. As of 28 July 2010, BSL has received construction stage approval from Director General of Geology and Mineral Resources No. 449.K/30/DJB/2010. The approval of construction stage is granted for KW96PBO159 area of 24,385 hectares in Musi Banyuasin and Musi Rawas Regencies, South Sumatra Province for the period from 30 July 2009 up to 29 July 2012. Furthermore, based on Decree No. 718.K/30/DJB/2011 dated 31 March 2011, the Director General of Geology and Mineral Resources has approved the beginning of the production phase which is valid for 30 years.
II.F.2. Pasar Geografis II.F.2. Geographic Markets
Berdasarkan keterangan yang diperoleh dari manajemen Perseroan, pada tanggal 31 Desember 2016, kegiatan usaha pertambangan BSL masih dalam tahap eksplorasi. Dengan demikian, pada tanggal 31 Desember 2016, BSL belum memiliki lokasi geografis untuk memasarkan hasil produksi batubaranya.
Based on the information from the Company’s management, as of 31 December 2016, the mining activities of BSL are still in exploration stage. Thus, as of 31 December 2016, BSL does not yet have a geographical location to market its coal production.
II.F.3. Pemasok dan Pelanggan Kunci II.F.3. Key Suppliers and Customers
Dalam melakukan kegiatan usahanya di bidang pertambangan batubara dan pengembangan pembangkit listrik mulut tambang, pemasok utama BSL adalah PT Bintang Kartika Segara dan PT Energate Prima Indonesia.
In conducting its business activities in coal mining and development of mine mouth power plant, the main suppliers of BSL are PT Bintang Kartika and PT Energate Prima Indonesia.
Selanjutnya, dalam melakukan kegiatan usahanya di bidang pertambangan batubara dan pengembangan pembangkit listrik mulut tambang, pelanggan kunci BSL adalah PT PLN (Persero).
Furthermore, in conducting its business activities in coal mining and development of mine mouth power plant, the key customers of BSL is PT PLN (Persero).

This report is originally issued in Bahasa Indonesia
24
II.F.4. Pesaing Usaha II.F.4. Business Competitors
Dalam menjalankan kegiatan usahanya di bidang pertambangan batubara dan pengembangan pembangkit listrik mulut tambang, pesaing usaha BSL adalah sebagai berikut:
In conducting its business activities in coal mining and development of mine mouth power plant, BSL’s business competitors are as folows:
II.F.5. Strategi dan Rencana Masa Depan (Business Plan)
II.F.5. Future Strategies and Plans (Business Plans)
Dalam menjalankan kegiatan operasionalnya di bidang pertambangan batubara dan pengembangan pembangkit listrik mulut tambang, BSL memiliki beberapa strategi dan rencana masa depan. Beberapa strategi dan rencana masa depan tersebut adalah sebagai berikut:
In developing its business activities in coal mining and mine mouth power plant, BSL has several strategies and business plans. That strategies and business plans are as follows:
• Senantiasa meningkatkan jumlah produksi batubara tahunannya secara progresif sehingga hal ini diharapkan dapat memberikan kontribusi yang besar terhadap kinerja keuangan BSL;
• Always increase the annual production of coal progressively so that it is expected to contribute greatly to financial performance of BSL;
• Terus melakukan evaluasi pertambangan batubara secara berkala terhadap kondisi pasar sehingga setiap kegiatan operasional yang dilakukan dapat berjalan efisien dan menguntungkan;
• Continue to conduct periodic coal mining evaluations of market conditions so that every operational activity undertaken can run efficiently and profitability;
• Mengembangkan jaringan pemasaran untuk area domestik dan internasional;
• Develop marketing network for domestic and international area;
• Terus meningkatkan kegiatan eksplorasi dan pengeboran, dimana aktivitas eksplorasi akan berfokus pada area dengan batubara yang memiliki kandungan kalori yang besar; dan
• Continue to increase exploration and drilling activities, where exploration activities will focus on areas with large calorie-containing coal; and
Tabel 2 Table 2
Pesaing Usaha Business Competitors
PT Bukit Asam Banko
PT Satria Bahana Sarana
PT Primanaya Energi
PT Adi Coal Resources
PT Pendopo Energi Batubara
Pesaing Usaha/
Business Competitors
PT Batubara Bukit Kendi

This report is originally issued in Bahasa Indonesia
25
• Senantiasa melakukan pelatihan dan pendidikan bagi seluruh manajemen kunci dan staff sehingga hal ini diharapkan dapat membantu BSL untuk mencapai rencana jangka panjang bagi masa yang akan datang.
• Always conduct training and education for all key management and staff so that it is expected to assist BSL to achieve long-term plans for the future.
II.G. Kondisi Pembatas dan Asumsi-Asumsi
Pokok II.G. Limiting Conditions and Major
Assumptions
Penilaian ini disusun berdasarkan kondisi pasar dan perekonomian, kondisi umum bisnis dan keuangan serta peraturan-peraturan Pemerintah yang berlaku sampai dengan tanggal penerbitan laporan penilaian ini.
This valuation was prepared based on the market and economic conditions, general business and financial conditions as well as applicable government regulations until the date of issuance of this valuation report.
Penilaian Obyek Penilaian yang dilakukan dengan metode diskonto pendapatan ekonomi mendatang didasarkan pada proyeksi laporan keuangan BSL yang disusun oleh manajemen BSL. Dalam penyusunan proyeksi laporan keuangan, berbagai asumsi dikembangkan berdasarkan kinerja BSL pada tahun-tahun sebelumnya dan berdasarkan rencana manajemen di masa yang akan datang. Kami telah melakukan penyesuaian terhadap proyeksi laporan keuangan tersebut agar dapat menggambarkan kondisi operasi dan kinerja BSL yang dinilai pada saat penilaian ini dengan lebih wajar. Secara garis besar, tidak ada penyesuaian yang signifikan yang kami lakukan terhadap target kinerja BSL yang dinilai. Kami bertanggung jawab atas pelaksanaan penilaian dan kewajaran proyeksi laporan keuangan berdasarkan kinerja historis BSL dan informasi manajemen BSL terhadap proyeksi laporan keuangan BSL tersebut. Kami juga bertanggung jawab atas laporan penilaian BSL dan kesimpulan nilai akhir.
The valuation of the Valuation Object performed with discounted future economic income method was based on financial statements projections prepared by the management of BSL. In preparing the financial statements projections, various assumptions were developed based on the performance of BSL in previous years and management’s plan for the future. We have made some adjustments to the financial statements projections in order to describe the operating conditions and performance of BSL more fairly during the valuation. Overall, there were not any significant adjustments have been applied to the performance targets of BSL. We are responsible for the valuation and the fairness of the financial statements projections based on historical performance of BSL and the information from the management of BSL to such financial statements projections. We are also responsible for the valuation report of BSL and the final value conclusion.
Dalam penugasan penilaian ini, kami mengasumsikan terpenuhinya semua kondisi dan kewajiban Perseroan. Kami juga mengasumsikan bahwa dari tanggal penilaian sampai dengan tanggal diterbitkannya laporan penilaian tidak terjadi perubahan apapun yang berpengaruh secara material terhadap asumsi-asumsi yang digunakan dalam penilaian. Kami tidak bertanggung jawab untuk menegaskan kembali atau melengkapi, memutakhirkan pendapat kami karena adanya perubahan asumsi dan kondisi serta peristiwa-peristiwa yang terjadi setelah tanggal surat ini.
In the valuation assignment, we assumed the fulfillment of all conditions and obligations of the Company. We also assumed that from the date of the valuation until the date of issuance of the valuation report, there were no changes that could materially affect the assumptions used in the valuation. We are not responsible to reaffirm or to supplement or to update our opinion due to the changes in the assumptions and conditions as well as events occuring after the letter date.
This report is originally issued in Bahasa Indonesia
26
Dalam melaksanakan analisa, kami mengasumsikan dan bergantung pada keakuratan, kehandalan dan kelengkapan dari semua informasi keuangan dan informasi-informasi lain yang diberikan kepada kami oleh Perseroan dan DSU atau yang tersedia secara umum yang pada hakekatnya adalah benar, lengkap dan tidak menyesatkan dan kami tidak bertanggung jawab untuk melakukan pemeriksaan independen terhadap informasi-informasi tersebut. Kami juga bergantung kepada jaminan dari manajemen Perseroan dan DSU bahwa mereka tidak mengetahui fakta-fakta yang menyebabkan informasi-informasi yang diberikan kepada kami menjadi tidak lengkap atau menyesatkan.
In performing the analysis, we assumed and relied on the accuracy, reliability and completeness of all financial information and other information provided to us by the Company and DSU or publicly available which were essentially true, complete and not misleading and we are not responsible to perform an independent investigation of such information. We also relied on assurances from the management of the Company and DSU that they did not know the facts which led to the information given to us to be incomplete or misleading.
Analisa penilaian Obyek Penilaian dipersiapkan menggunakan data dan informasi sebagaimana diungkapkan di atas. Segala perubahan atas data dan informasi tersebut dapat mempengaruhi hasil akhir pendapat kami secara material. Kami tidak bertanggung jawab atas perubahan kesimpulan atas penilaian kami maupun segala kehilangan, kerusakan, biaya ataupun pengeluaran apapun yang disebabkan oleh ketidakterbukaan informasi sehingga data yang kami peroleh menjadi tidak lengkap dan atau dapat disalahartikan.
The valuation analysis of the Valuation Object was prepared using the data and information as disclosed above. Any changes to the data and information may materially affect the outcome of our opinion. We are not responsible for the changes in the conclusions of our valuation as well as any losses, damages, costs or expenses caused by undisclosed information which led the data obtained to be incomplete and/or could be misinterpreted.
Karena hasil dari penilaian kami sangat tergantung dari data serta asumsi-asumsi yang mendasarinya, perubahan pada sumber data serta asumsi sesuai data pasar akan merubah hasil dari penilaian kami. Oleh karena itu, kami sampaikan bahwa perubahan terhadap data yang digunakan dapat berpengaruh terhadap hasil penilaian dan bahwa perbedaan yang terjadi dapat bernilai material. Walaupun isi dari laporan penilaian ini telah dilaksanakan dengan itikad baik dan dengan cara yang profesional, kami tidak dapat menerima tanggung jawab atas kemungkinan terjadinya perbedaan kesimpulan yang disebabkan oleh adanya analisa tambahan, diaplikasikannya hasil penilaian sebagai dasar untuk melakukan analisa transaksi ataupun adanya perubahan dalam data yang dijadikan sebagai dasar penilaian. Laporan penilaian Obyek Penilaian bersifat non-disclaimer opinion dan merupakan laporan yang terbuka untuk publik kecuali terdapat informasi yang bersifat rahasia, yang dapat mempengaruhi operasional Perseroan dan DSU.
Since the result of our valuation extremely depended on the data and the underlying assumptions, the changes in the data sources and assumptions based on market data would change the result of our valuation. Therefore, we stated that the changes to the data used could affect the result of the valuation and that such differences could be material. Although the content of this valuation report had been prepared in good faith and in a professional manner, we are unable to accept the responsibility for the possibility of the differences in our conclusion caused by additional analysis, the application of the valuation result as a basis to perform the analysis of the transaction or any changes in the data used as the basis of the valuation. The valuation report of the Valuation Object represents a non-disclaimer opinion and is an open-for-public report unless there were confidential information on such report, which might affect the operation of the Company and DSU.

This report is originally issued in Bahasa Indonesia
27
Pekerjaan kami yang berkaitan dengan penilaian Obyek Penilaian tidak merupakan dan tidak dapat ditafsirkan dalam bentuk apapun, suatu penelaahan atau audit atau pelaksanaan prosedur-prosedur tertentu atas informasi keuangan. Pekerjaan tersebut juga tidak dapat dimaksudkan untuk mengungkapkan kelemahan dalam pengendalian internal, kesalahan atau penyimpangan dalam laporan keuangan atau pelanggaran hukum. Selanjutnya, kami juga telah memperoleh informasi atas status hukum DSU berdasarkan anggaran dasar DSU.
Our work related to the valuation of the Valuation Object was not and could not be interpreted in any form, a review or an audit or an implementation of certain procedures of financial information. The work was also not intended to reveal weaknesses in internal control, errors or irregularities in the financial statements or violation of law. Furthermore, we have also obtained the information on the legal status of the Company and DSU based on the articles of association of DSU.
II.H. Distribusi Penilaian II.H. Distribution of the Valuation
Penilaian ini hanya ditujukan untuk kepentingan Direksi Perseroan dalam kaitannya dengan Rencana Akuisisi serta tidak dapat digunakan atau dikutip untuk tujuan lain tanpa adanya ijin tertulis dari JKR dan/atau tidak untuk digunakan oleh pihak lain.
This valuation was intended for the interest of the Company’s Directors in connection with the Proposed Acquisition and could not be used or cited for other purposes without written permission from JKR and/or not to be used by other party.
Penilaian ini juga disusun berdasarkan kondisi pasar dan perekonomian, kondisi umum bisnis dan keuangan serta peraturan yang ada pada saat ini. Kami tidak bertanggung jawab untuk menegaskan kembali atau melengkapi pendapat kami karena peristiwa-peristiwa yang terjadi setelah tanggal surat ini. Walaupun demikian, kami memiliki hak untuk, jika diperlukan, merubah atau melengkapi hasil dari laporan ini jika terdapat tambahan informasi yang relevan setelah tanggal laporan ini yang kami anggap dapat berpengaruh secara signifikan terhadap hasil penilaian kami. Laporan penilaian ini hanya dipersiapkan untuk dapat dipergunakan sesuai dengan tujuan yang telah disebutkan di atas dan tidak dapat dipergunakan untuk tujuan lainnya.
This valuation was also prepared based on the market and economic conditions, general business and financial as well as the current existing regulations. We are not responsible to confirm or to supplement our opinion for the events occurring after the date of this letter date. Nevertheless, we have the authority, if necessary, to amend or to supplement the results of this report due to additional relevant information after the date of this report that we consider could significantly affect the results of our valuation. This valuation report was merely prepared to be used in accordance with the objectives mentioned above and could not be used for other purposes.
Pendapat yang kami sampaikan di sini harus dipandang sebagai satu kesatuan bersama dengan laporan lengkap yang telah kami siapkan. Penggunaan sebagian analisa dan informasi tanpa mempertimbangkan keseluruhan informasi dan analisa dapat menyebabkan pandangan yang menyesatkan.
The opinion we stated here should be viewed as a whole together with the full report that we have prepared. The use of partial analysis and information without considering the whole information and analysis may cause a misleading view.

This report is originally issued in Bahasa Indonesia
28
II.I. Jenis Laporan II.I. Type of Report
Jenis laporan penilaian 100,00% saham PT Dwikarya Sejati Utama ini merupakan laporan terperinci.
The type of the valuation report of 100.00% shares of PT Dwikarya Sejati Utama is detailed report.
II.J. Kejadian Penting Setelah Tanggal
Penilaian (Subsequent Events) II.J. Significant Events After the Date of
Valuation (Subsequents Events)
Berdasarkan ketarangan yang diperoleh dari manajemen Perseroan, dari tanggal penilaian, yaitu tanggal 31 Desember 2016, sampai dengan tanggal diterbitkannya laporan penilaian 100,00% saham PT Dwikarya Sejati Utama, tidak terdapat kejadian penting setelah tanggal penilaian (subsequent events) yang secara signifikan dapat mempengaruhi penilaian nilai pasar wajar Obyek Penilaian.
Based on the information from the Company’s management, from the date of valuation, i.e. 31 December 2016, until the date of issuance of the valuation report of 100.00% shares of PT Dwikarya Sejati Utama, there were no significant events after the valuation date (subsequent events) that would significantly affect the fair market value of the Valuation Object.

This report is originally issued in Bahasa Indonesia
29
III. PENJELASAN SINGKAT MENGENAI
PT DWIKARYA SEJATI UTAMA III. BRIEF DESCRIPTIONS OF PT DWIKARYA
SEJATI UTAMA
III.A. Latar Belakang PT Dwikarya Sejati Utama III.A. Background of PT Dwikarya Sejati Utama
DSU didirikan berdasarkan akta notaris No. 40 tanggal 9 Maret 2007 oleh Notaris Sugito Tedjamulja, S.H., notaris di Jakarta. Akta ini telah mendapat persetujuan dari Menteri Kehakiman Republik Indonesia berdasarkan Surat Keputusan No. W7-03628 HT.01.01-TH.2007 tanggal 5 April 2007.
DSU was established based on notarial deed No. 40 dated 9 March 2007 by Notary Sugito Tedjamulja, S.H., notary in Jakarta. This establishment deed was approved by the Minister of Justice of the Republic of Indonesia under Decision Letter No. W7-03628 HT.01.01-TH.2007 dated 5 April 2007.
Anggaran dasar DSU telah mengalami beberapa kali perubahan. Perubahan terakhir berdasarkan akta notaris No. 4 tanggal 23 Juli 2008 oleh Notaris Zulfiah Tenri Abeng, S.H., M.Hum., M.Kn., notaris di Jakarta sehubungan dengan perubahan anggaran dasar DSU untuk disesuaikan dengan Undang-Undang No. 40 Tahun 2007 mengenai Perseroan Terbatas, yang telah disetujui oleh Menteri Kehakiman Republik Indonesia melalui Surat Keputusan No. AHU-63256.AH.01.02 Tahun 2008 tanggal 15 September 2008.
DSU articles of incorporation have been amended several times. The latest amandment based on notarial deed No. 4 dated 23 July 2008 by Notary Zulfiah Tenri Abeng, S.H., M.Hum., M.Kn., notary in Jakarta according to the change of DSU articles of incorporation to conform with Law No. 40 Year 2007 of Limited Liability Company, which has been approved by the Minister of Justice of the Republic Indonesia under Decision Letter No. AHU-63256.AH.01.02 Year 2008 dated 15 September 2008.
III.B. Kegiatan Usaha III.B. Business Activities
Kegiatan usaha DSU adalah bergerak dalam bidang modal usaha dan jasa konsultasi manajemen.
The scope of activities of DSU is engaged in venture capital and management consultant.
III.C. Manajemen III.C. Management
Susunan Komisaris dan Direksi DSU pada tanggal 31 Desember 2016 adalah sebagai berikut:
The Commisioner and Directors of DSU as of 31 December 2016 were as follows:
Komisaris Avinash Ramakant Shah Commisoner
Direktur Utama Chenna Kesava Reddy Bidala President Director Direktur Venkata Satyanarayana Kollapudi Director

This report is originally issued in Bahasa Indonesia
30
III.D. Kepemilikan Saham III.D. Share Ownership
Susunan pemegang saham DSU berikut dengan kepemilikannya pada tanggal 31 Desember 2016 adalah sebagai berikut:
DSU’s shareholders and share ownership structure as of 31 December 2016 were as folows:
III.E. Data Keuangan Historis III.E. Historical Financial Data
Laporan keuangan konsolidasian DSU untuk periode sembilan bulan yang berakhir pada tanggal 31 Desember 2016 dan untuk tahun yang berakhir pada tanggal-tanggal 31 Maret 2016, 2015 dan 2014 telah diaudit oleh KAP GSH masing-masing dengan pendapat wajar tanpa pengecualian. Laporan keuangan konsolidasian DSU untuk tahun yang berakhir pada tanggal-tanggal 31 Maret 2013 dan 2012 telah diaudit oleh KAP GMH masing-masing dengan pendapat wajar tanpa pengecualian.
DSU’s consolidated financial statements for nine months period ended 31 December 2016 and for the years ended 31 March 2016, 2015 and 2014 were audited by KAP GSH with an unqualified opinion, respectively. DSU’s consolidated financial statements for the years ended 31 March 2013 and 2012 were audited by KAP GMH with an unqualified opinion, respectively.
Ikhtisar data keuangan penting DSU adalah sebagai berikut:
The summary of key financial data of DSU are as follows:
Tabel 3 Table 3
PT Dwikarya Sejati Utama PT Dwikarya Sejati Utama
Daftar Kepemilikan dan Struktur Pemegang Saham Details of Shareholders and Share Ownership Structure
(Dalam USD) (In USD )
GMR Energy (Netherlands) B.V. 999 99,90% 108.883 GMR Energy (Netherlands) B.V.
GMR Infrastructure (Overseas) GMR Infrastructure (Overseas)
Limited 1 0,10% 109 Limited
Jumlah 1.000 100,00% 108.992 Total
Pemegang Saham
Jumlah Saham/
Number of
Shares
Persentase
Kepemilikan/
Percentage of
Ownership
Jumlah Modal/
Amount of
Capital
Shareholders
Tabel 4 Table 4
PT Dwikarya Sejati Utama PT Dwikarya Sejati Utama
Laporan Posisi Keuangan Statements of Financial Position
Per 31 Desember 2016 dan 31 Maret 2012 - 2016 As of 31 December 2016 and 31 March 2012 - 2016
(Dalam ribuan USD) (In thousand USD)
A S E T A S S E T S
ASET LANCAR CURRENT ASSETS
Kas dan setara kas 81 266 6.359 78 138 769 Cash and cash equivalents
Persediaan - 426 405 - - - Inventories
Uang muka 645 1.031 769 367 94 127 Advance payments
Biaya dibayar di muka 5 52 55 49 51 109 Prepayments
Pajak dibayar di muka 0 0 0 0 0 - Prepaid taxes
Piutang lain-lain - 2 2 5 26 9 Other receivables
Jumlah Aset Lancar 731 1.777 7.590 500 308 1.013 Total Current Assets
ASET TIDAK LANCAR NON-CURRENT ASSETS
Aset tetap 13.403 13.551 12.929 7.690 7.493 7.085 Fixed assets
Deposit jaminan 16 13 13 11 8 6 Refundable deposits
Dana yang dibatasi penggunaannya 424 398 1.719 1.410 57 - Restricted deposits
Aset pajak tangguhan - - - 8 40 39 Deferred tax assets
Biaya eksplorasi dan pengembangan Deferred exploration and development
ditangguhkan 66.640 62.341 54.689 47.010 39.409 33.379 expenditures
Jumlah Aset Tidak Lancar 80.483 76.303 69.350 56.129 47.006 40.509 Total Non-Current Assets
JUMLAH ASET 81.214 78.080 76.940 56.629 47.315 41.522 TOTAL ASSETS
Descriptions31/03/13Keterangan 31/12/16 31/03/16 31/03/15 31/03/14 31/03/12
This report is originally issued in Bahasa Indonesia
31
(Dalam ribuan USD) (In thousand USD)
LIABILITAS DAN EKUITAS LIABILITIES AND EQUITY
LIABILITAS LIABILITIES
LIABILITAS JANGKA PENDEK CURRENT LIABILITIES
Biaya yang masih harus dibayar 2.465 1.556 1.975 1.518 1.011 1.474 Accrued expenses
Utang pajak 312 188 54 47 27 44 Taxes payable
Utang lain-lain 28.593 167 15.984 5.477 229 104 Other payables
Uang muka pelanggan 13 7.385 7.529 2.385 5.810 - Advance from customers
Uang muka dari pemasok 7.675 26.515 4.500 - - - Security deposit feom vendor
Jumlah Liabilitas Jangka Pendek 39.057 35.811 30.042 9.427 7.077 1.622 Total Current Liabilities
LIABILITAS JANGKA PANJANG NON-CURRENT LIABILITIES
Pinjaman jangka panjang - - - - 898 9.096 Long term loan
Utang bank 40.000 40.000 40.000 40.000 - - Bank loan
Obligasi konversi - - 4.400 4.400 - - Convertible bonds
Liabilitas imbalan kerja karyawan 291 479 508 622 530 362 Post-employment benefit obligation
Liabilitas pajak tangguhan 12 2 49 - - - Deferred tax liabilities
Jumlah Liabilitas Jangka Panjang 40.302 40.481 44.957 45.022 1.428 9.458 Total Non-Current Liabilities
JUMLAH LIABILITAS 79.360 76.292 74.998 54.449 8.505 11.080 TOTAL LIABILITIES
EKUITAS EQUITY
Modal saham 109 109 109 109 109 109 Capital stock
Selisih perbedaan nilai tukar pada modal Foreign exchange difference in capital
saham 1 1 1 1 1 1 stock
Obligasi wajib konversi 6.481 6.481 6.481 6.481 42.608 33.492 Mandatory convertible bonds
Komponen ekuitas lainnya - - 100 100 86 373 Other contributed capital
Tambahan modal disetor 45 45 45 45 45 - Additional paid in capital
Akumulasi laba aktuaria 157 103 263 98 - - Accumulated actuarial gain
Saldo defisit (4.939) (4.951) (5.057) (4.655) (4.039) (3.533) Accumulated deficits
JUMLAH EKUITAS 1.854 1.788 1.942 2.179 38.810 30.442 TOTAL EQUITY
JUMLAH LIABILITAS DAN EKUITAS 81.214 78.080 76.940 56.629 47.315 41.522 TOTAL LIABILITIES AND EQUITY
Descriptions31/03/12Keterangan 31/12/16 31/03/16 31/03/15 31/03/14 31/03/13
Tabel 5 Table 5
PT Dwikarya Sejati Utama PT Dwikarya Sejati Utama
Laporan Laba Rugi Komprehensif Statements of Comprehensive Income
untuk periode sembilan bulan yang berakhir pada for nine months period ended
tanggal 31 Desember 2016 dan 31 December 2016 and
untuk tahun yang berakhir pada for the years ended
tanggal-tanggal 31 Maret 2012 - 2016 31 March 2012 - 2016
(Dalam ribuan USD) (In thousand USD)
31/12/16 31/03/16 31/03/15 31/03/14 31/03/13 31/03/12
(9 Bulan)/ (1 Tahun)/ (1 Tahun)/ (1 Tahun)/ (1 Tahun)/ (1 Tahun)/
(9 Months) (1 Year) (1 Year) (1 Year) (1 Year) (1 Year)
Pendapatan usaha - - - - - - Revenues
Beban pokok pendapatan - - - - - - Cost of revenues
Laba kotor - - - - - - Gross profit
Beban usaha (215) (311) (384) (536) (519) (522) Operating expense
Rugi usaha (215) (311) (384) (536) (519) (522) Loss from operation
Penghasilan (beban) lain-lain 219 423 (16) (81) 12 (283) Other income (expense)
Laba (rugi) sebelum manfaat (beban)
pajak penghasilan 4 112 (400) (617) (507) (806) Profit (loss) before tax
Manfaat (beban) pajak penghasilan 8 (6) (2) 1 1 23 Tax benefit (expense)
Laba (rugi) bersih tahun berjalan 13 106 (402) (616) (506) (783) Profit (loss) for the period
Pendapatan (beban) komprehensif lainnya 54 (160) 165 - - - Other comprehensice income (expense)
Jumlah laba (rugi) komprehensif tahun Total comprehensive income (loss) for
berjalan 66 (54) (238) (616) (506) (783) the period
DescriptionsKeterangan
This report is originally issued in Bahasa Indonesia
32
III.F. Penjelasan Singkat Mengenai Entitas
PT Dwikarya Sejati Utama III.F. Brief Description of Subsidiaries of
PT Dwikarya Sejati Utama
III.F.1. PT Duta Sarana Internusa III.F.1. PT Duta Sarana Internusa
III.F.1.a. Latar Belakang DSI III.F.1.a. Background of DSI
DSI didirikan berdasarkan akta notaris No. 12 tanggal 5 Desember 2006 oleh Notaris Darmawan Tjoa, S.H., S.E., notaris di Jakarta. Akta ini telah mendapat persetujuan dari Kementrian Hukum dan Hak Asasi Manusia Republik Indonesia berdasarkan Surat Keputusan No. W7-00631 HT.01.01-TH.2007 tanggal 17 Januari 2007 dan telah diumumkan dalam Berita Negara No. 43, Tambahan No. 5264/2007 tanggal 29 Mei 2007.
DSI was established based on notarial deed No. 29 dated 5 December 2006 by Notary Darmawan Tjoa, S.H., S.E., notary in Jakarta. This establishment deed has been approved by the Ministry of Law and Human Rights of the Republic of Indonesia under Decision Letter No. W7-00631 HT.01.01-TH.2007 dated 17 January 2007 and had been published in state gazette No. 43, Supplement No. 5264/2007 dated 29 May 2007.
Anggaran dasar DSI telah mengalami beberapa kali perubahan. Perubahan terakhir berdasarkan akta notaris No. 1 tanggal 16 Oktober 2008 oleh Notaris Zulfiah Tenri Abeng, S.H., M.Hum., M.Kn., notaris di Jakarta sehubungan dengan perubahan status DSI dari perusahaan umum menjadi perusahaan penanaman modal asing sehingga merubah anggaran dasar DSI untuk disesuaikan dengan Undang-Undang No. 25 Tahun 2007 mengenai modal investasi. Perubahan anggaran dasar ini telah disetujui oleh Kementrian Hukum dan Hak Asasi Manusia Republik Indonesia melalui Surat Keputusan No. AHU-82582.AH.01.02 Tahun 2008 tanggal 6 November 2008.
DSI’s articles of incorporation have been amended several times. The latest amendment was made based upon notarial deed No. 1 dated 16 October 2008 by Notary Zulfiah Tenri Abeng, S.H., M.Hum., M.Kn., notary in Jakarta regarding the changes in change DSI status from general corporation into foreign capital investment and therefore change the expose stated in DSI’s article of incorporation to conform with Law No. 25 Year 2007 regarding capital investment. This change of article association has been approved by the Ministry of Law and Human Rights of the Republic of the Indonesia under Decision Letter No. AHU-82582.AH.01.02.Year 2008 dated 6 November 2008.
III.F.1.b. Kegiatan Usaha III.F.1.b. Business Activities
Kegiatan usaha DSI adalah bergerak dalam bidang industri jasa yang meliputi konsultasi bisnis dan manajemen yang meliputi manajemen, jasa konsultasi, bantuan nasihat dan operasional, perencanaan, pengawasan, evaluasi dan investasi and strategi pengembangan bisnis, analisis dan studi kelayakan atas bisnis dan aktivitas yang berhubungan dengan bisnis.
The scope of activities of DSI is engaged in service industry which covers business and management consultation which cover management, consultation services, advice and operational help, planning, supervising, evaluate and investment and business development strategy, analysis and feasibilities study of business services and related business activities.
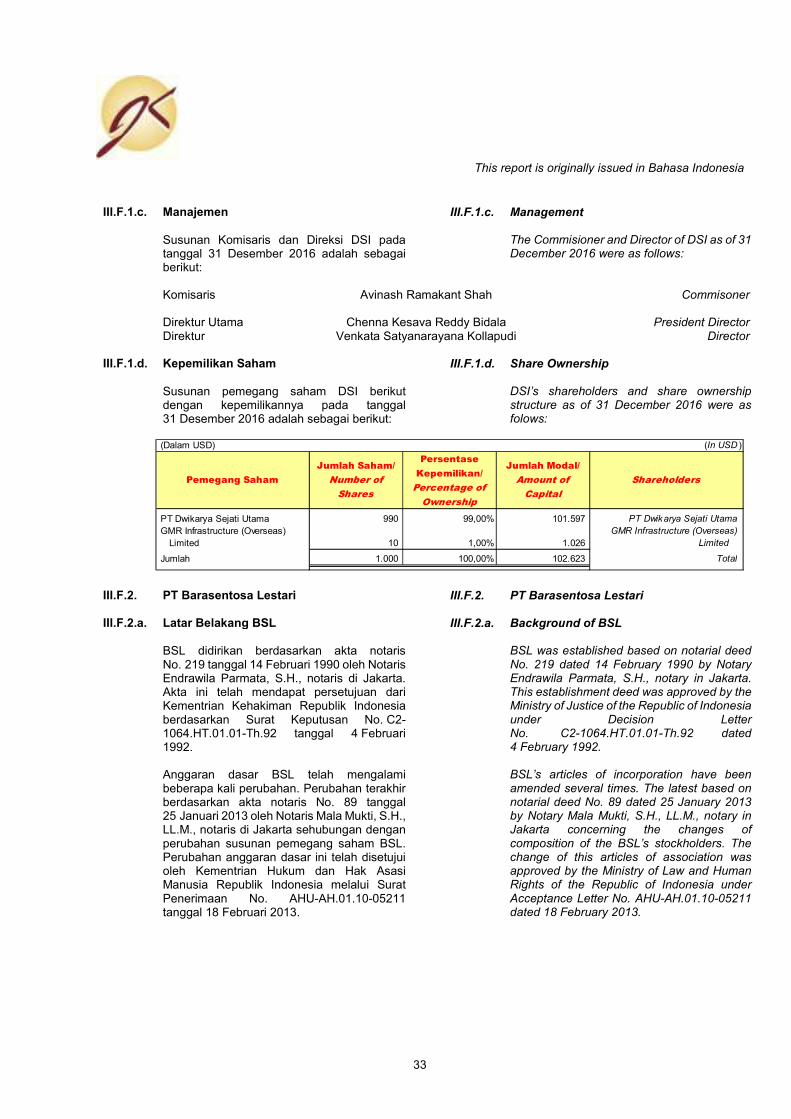
This report is originally issued in Bahasa Indonesia
33
III.F.1.c. Manajemen III.F.1.c. Management
Susunan Komisaris dan Direksi DSI pada tanggal 31 Desember 2016 adalah sebagai berikut:
The Commisioner and Director of DSI as of 31 December 2016 were as follows:
Komisaris Avinash Ramakant Shah Commisoner
Direktur Utama Chenna Kesava Reddy Bidala President Director Direktur Venkata Satyanarayana Kollapudi Director
III.F.1.d. Kepemilikan Saham III.F.1.d. Share Ownership
Susunan pemegang saham DSI berikut dengan kepemilikannya pada tanggal 31 Desember 2016 adalah sebagai berikut:
DSI’s shareholders and share ownership structure as of 31 December 2016 were as folows:
III.F.2. PT Barasentosa Lestari III.F.2. PT Barasentosa Lestari
III.F.2.a. Latar Belakang BSL III.F.2.a. Background of BSL
BSL didirikan berdasarkan akta notaris No. 219 tanggal 14 Februari 1990 oleh Notaris Endrawila Parmata, S.H., notaris di Jakarta. Akta ini telah mendapat persetujuan dari Kementrian Kehakiman Republik Indonesia berdasarkan Surat Keputusan No. C2-1064.HT.01.01-Th.92 tanggal 4 Februari 1992.
BSL was established based on notarial deed No. 219 dated 14 February 1990 by Notary Endrawila Parmata, S.H., notary in Jakarta. This establishment deed was approved by the Ministry of Justice of the Republic of Indonesia under Decision Letter No. C2-1064.HT.01.01-Th.92 dated 4 February 1992.
Anggaran dasar BSL telah mengalami beberapa kali perubahan. Perubahan terakhir berdasarkan akta notaris No. 89 tanggal 25 Januari 2013 oleh Notaris Mala Mukti, S.H., LL.M., notaris di Jakarta sehubungan dengan perubahan susunan pemegang saham BSL. Perubahan anggaran dasar ini telah disetujui oleh Kementrian Hukum dan Hak Asasi Manusia Republik Indonesia melalui Surat Penerimaan No. AHU-AH.01.10-05211 tanggal 18 Februari 2013.
BSL’s articles of incorporation have been amended several times. The latest based on notarial deed No. 89 dated 25 January 2013 by Notary Mala Mukti, S.H., LL.M., notary in Jakarta concerning the changes of composition of the BSL’s stockholders. The change of this articles of association was approved by the Ministry of Law and Human Rights of the Republic of Indonesia under Acceptance Letter No. AHU-AH.01.10-05211 dated 18 February 2013.
(Dalam USD) (In USD )
PT Dwikarya Sejati Utama 990 99,00% 101.597 PT Dwikarya Sejati Utama
GMR Infrastructure (Overseas) GMR Infrastructure (Overseas)
Limited 10 1,00% 1.026 Limited
Jumlah 1.000 100,00% 102.623 Total
Jumlah Modal/
Amount of
Capital
Shareholders
Jumlah Saham/
Number of
Shares
Pemegang Saham
Persentase
Kepemilikan/
Percentage of
Ownership

This report is originally issued in Bahasa Indonesia
34
III.F.2.b. Kegiatan Usaha III.F.2.b. Business Activities
Kegiatan usaha BSL adalah bergerak dalam bidang pertambangan batubara dan pengembangan pembangkit listrik mulut tambang. Pada tanggal 28 Juli 2010, BSL telah mendapatkan persetujuan tahap konstruksi dari Direktur Jenderal Geologi dan Sumber Daya Mineral No. 449.K/30/DJB/2010. Persetujuan dari tahap konstruksi diberikan untuk KW96PBO159 dengan luas area sebesar 24.385 hektar di Kabupaten Musi Banyuasin dan Musi Rawas, Propinsi Sumatera Selatan untuk periode 30 Juli 2009 sampai dengan 29 Juli 2012. Selanjutnya, berdasarkan Surat Keputusan No. 718.K/30/DJB/2011 tanggal 31 Maret 2011, Direktur Jenderal Geologi dan Sumber Daya Mineral telah menyetujui awal tahap produksi yang berlaku selama 30 tahun.
The scope of activities of BSL is engaged in coal mining and developing a mine-mouth power plant. As of 28 July 2010, BSL has received construction stage approval from Director General of Geology and Mineral Resources No. 449.K/30/DJB/2010. The approval of construction stage is granted for KW96PBO159 area of 24,385 hectares in Musi Banyuasin and Musi Rawas Regencies, South Sumatra Province for the period from 30 July 2009 up to 29 July 2012. Furthermore, based on Decree No. 718.K/30/DJB/2011 dated 31 March 2011, the Director General of Geology and Mineral Resources has approved the beginning of the production phase which is valid for 30 years.
III.F.2.c. Manajemen III.F.2.c. Management
Susunan Komisaris dan Direksi BSL pada tanggal 31 Desember 2016 adalah sebagai berikut:
The Commisioner and Director of BSL as of 31 December 2016 were as follows:
Komisaris Avinash Ramakant Shah Commisoner
Direktur Utama Chenna Kesava Reddy Bidala President Director Direktur Venkata Satyanarayana Kollapudi Director
III.F.2.d. Kepemilikan Saham III.F.2.d. Share Ownership
Susunan pemegang saham BSL berikut dengan kepemilikannya pada tanggal 31 Desember 2016 adalah sebagai berikut:
BSL’s shareholders and share ownership structure as of 31 December 2016 were as folows:
Tabel 7 Table 7
PT Barasentosa Lestari PT Barasentosa Lestari
Daftar Kepemilikan dan Struktur Pemegang Saham Details of Shareholders and Share Ownership Structure
(Dalam USD) (In USD )
PT Duta Sarana Internusa 3.324 94,97% 853.540 PT Duta Sarana Internusa
PT GMR Infrastructure (Overseas) PT GMR Infrastructure (Overseas)
Limited 175 5,00% 44.937 Limited
PT Unsoco 1 0,03% 257 PT Unsoco
Jumlah 3.500 100,00% 898.734 Total
Jumlah Saham/
Number of
Shares
Persentase
Kepemilikan/
Percentage of
Ownership
Jumlah Modal/
Amount of
Capital
Pemegang Saham Shareholders

This report is originally issued in Bahasa Indonesia
35
IV. KONDISI DAN TINJAUAN EKONOMI IV. ENONOMIC CONDITIONS AND OVERVIEW
IV.A. Tinjauan Ekonomi Dunia IV.A. World Economic Overview
Pada tahun 2016, perekonomian global diwarnai dengan pertumbuhan ekonomi yang tidak merata dan pasar keuangan yang diliputi ketidakpastian. Namun di tahun 2017 perekonomian dunia diperkirakan membaik didukung oleh ekonomi Amerika Serikat (AS) dan Tiongkok meskipun diliputi oleh sejumlah risiko yang perlu dicermati.
In 2016, the global economic recovery is characterized by uneven economic growth and uncertainty financial market. But, in 2017 global economic is expected to improved supported by United States (US) and China’s economy although covered by a number of risks that need to be observed.
Perbaikan ekonomi AS didorong oleh peningkatan konsumsi dan meningkatnya investasi nonresidensial. Konsumsi menjadi penopang pertumbuhan ekonomi, tercermin dari meningkatnya kontribusi Personal Consumption Expenditures (PCE) terhadap Produk Domestik Bruto (PDB) AS. Tren peningkatan konsumsi AS tersebut didukung oleh kondisi ketenagakerjaan yang membaik. Sementara itu, investasi juga mencatat kontribusi positif terhadap PDB AS, utamanya didorong oleh meningkatnya investasi nonresidensial.
The US economic recovery driven by increased of consumption and nonresidential investment rising. Consumption become the backbone of economic growth, reflected in the increasing contribution of the Personal Consumption Expenditures (PCE) to Gross Domestic Product (GDP). The upward trend in US consumption is supported by an improving labor conditions. Meanwhile, the investment also recorded a positive contribution to the US GDP, mainly driven by the nonresidential investment.
Kondisi ketenagakerjaan AS membaik, tercermin dari tingkat pengangguran AS yang berada pada level rendah. Tingkat pengangguran AS pada Desember 2016 tercatat cukup rendah sebesar 4,7%. Di sisi harga, inflasi AS pada tahun 2016 dalam tren meningkat seiring dengan masih berlanjutnya tren kenaikan harga minyak WTI, termasuk ekspektasi inflasi Consensus Forecast 2017 yang juga naik mencapai 2,4%. Kenaikan ekspektasi inflasi tersebut utamanya didorong oleh ekspektasi kebijakan fiskal AS yang diperkirakan akan mendorong defisit fiskal. Selain itu, kenaikan gaji dan ekspektasi pemulihan ekonomi menjadi kondisi full employment juga merupakan faktor yang berperan dalam kenaikan ekspektasi inflasi.
US employment conditions improve, reflected in the US unemployment rate is at a low level. The US unemployment rate in December 2016 was recorded fairly low at 4.7%. In terms of prices, US inflation in 2016 on an upward trend in line with the ongoing increases trend of WTI oil price, including inflation expectations of Consensus Forecast 2017 also rose to 2.4%. The increase in inflation expectations is primarily driven by expectations of US fiscal policy is expected to push the fiscal deficit. In addition, salary increases and expectations of economic recovery into a state of full employment is also a contributing factor in the rise in inflation expectations.

This report is originally issued in Bahasa Indonesia
36
Perekonomian Tiongkok juga membaik, tercermin pada peningkatan penjualan eceran dan investasi swasta. Meningkatnya penjualan eceran mengindikasikan perkembangan konsumsi yang juga sejalan dengan membaiknya indikator tenaga kerja. Penjualan eceran pada bulan November 2016 mengalami peningkatan menjadi 10,8% dengan kenaikan yang terjadi pada hampir semua komponen. Membaiknya perekonomian Tiongkok juga tercermin dari peningkatan investasi swasta yang didorong oleh peningkatan keterlibatan swasta pada Private Public Partnership.
China's economy is also improved, as reflected in an increase in retail sales and private investment. Increased retail sales indicate that consumption growth is also in line with the improvement in labor indicators. Retail sales in November 2016 increased to 10.8% with the rise in almost all components. The improvement in the China economy is also reflected in an increase in private investment driven by the increased involvement of the private sector in Public Private Partnership.
Di sisi lain, pertumbuhan ekonomi negara berkembang, terutama India dan Tiongkok, diperkirakan dapat menjadi sumber pendorong pertumbuhan ekonomi global dan perbaikan sejumlah harga komoditas. Pertumbuhan ekonomi India pada tahun 2016 bersumber dari konsumsi swasta dan investasi. Kenaikan konsumsi swasta tercermin dari tren kenaikan penjualan kendaraan yang relatif lebih tinggi dibandingkan tahun sebelumnya. Sementara itu, kegiatan produksi diperkirakan membaik, tercermin dari tren kenaikan Purchasing Manager Index Manufaktur.
On the other hand, economic growth in developing countries especially India and China is expected to be the source of global economic growth driver and improvement of some comodity price. India economic growh in 2016 came from private consumption and investment. The increase in private consumption reflected by the rising trend in vehicle sales which relative higher than previous year. Production activities are expected to improve, reflected from the rising of Purchasing Manager Index Manufacturing.
Di pasar komoditas, harga minyak dunia diperkirakan dalam tren meningkat. Harga minyak pada tahun 2017 diperkirakan lebih tinggi, didorong oleh realisasi harga minyak pada Desember 2016. Meningkatnya harga minyak dunia juga didorong oleh implementasi kesepakatan Organization of Petroleum Exporting Countries (OPEC) serta 10 negara non-OPEC untuk melakukan production cut. Harga minyak naik sebesar 12% pasca kesepakatan OPEC dan 10 negara non-OPEC untuk memangkas produksi 1,8 mbpd (2,00% dari total supply) yang berlaku pada Januari hingga Juni 2017.
In commodity market, world oil price on an upward trend. Oil price in 2017 is estimated to be higher, driven by the oil price in December 2016. The increase in world oil price was also driven by implementation of the Organization of Petroleum Exporting Countries (OPEC) and 10 non-OPEC countries agreement to cut production. Oil price rose 12,00% post agreeement of OPEC and 10 non-OPEC countries to cut production 1,80 mbpd (2,00% of total supplies) valid from January to June 2017.
Ke depan, sejumlah risiko global tetap perlu diwaspadai, antara lain berasal dari dampak kebijakan fiskal dan perdagangan internasional AS, kenaikan Fed Fund Rate (FFR) yang berpotensi meningkatkan cost of borrowing di pasar keuangan global, proses penyesuaian ekonomi dan keuangan Tiongkok, serta berbagai risiko geopolitik yang masih belum teridentifikasi.
Onwards, a number of global risks still need to watch out for, among others, comes from the effects of fiscal policy and AS international trade, the increase in the Fed Funds Rate (FFR) which could increase the cost of borrowing on global financial markets, the adjustment process of the economy and finance of China, as well as the various risks geopolitical still not been identified.

This report is originally issued in Bahasa Indonesia
37
IV.A.1. Produk Domestik Bruto IV.A.1 Gross Domestic Product
Salah satu indikator pertumbuhan ekonomi adalah PDB. Berdasarkan data yang diperoleh dari Bloomberg, pada tahun 2016, pertumbuhan PDB secara global mengalami penurunan sebesar 0,10%, dimana penurunan PDB terbesar berasal dari Amerika Serikat dengan penurunan PDB sebesar 1,00% dan kelompok negara berkembang yaitu Hongkong dan Malaysia dengan penurunan PDB masing-masing sebesar 0,90%.
One of the economic growth indicators is GDP. Based on the data obtained from Bloomberg, in 2016, global growth of GDP decreased by 0.10%, where the biggest decline in GDP came from USA with GDP decline of 1,00% and developing country, Hongkong and Malaysia with GDP decline respectively 0,90%.
Sementara itu, kawasan Euro mengalami penurunan sebesar 0,30% menjadi 1,70% di tahun 2016. PDB kawasan Euro tahun 2017 diperkirakan mengalami penurunan sebesar 0,10% menjadi 1,60%.
Meanwhile, in 2016 the Euro Area decreased by 0.30% to 1.70%. Euro Area’s GDP in 2017 is expected decreased by 0.10% to 1.60%.
Pertumbuhan ekonomi negara berkembang seperti India dan Tiongkok diperkirakan dapat menjadi sumber pendorong pertumbuhan ekonomi global dan perbaikan harga sejumlah komoditas. Hal ini tercermin dari kenaikan PDB India sebesar 0,70% menjadi 7,90% di tahun 2016.
Economic growth in developing countries i.e. India and China are expected to be the source of global economic growth driver and improvement of some comodity price. It’s reflected by the rise of India’s GDP by 0.70% to 7.90% in 2016.
PDB di beberapa negara berkembang mengalami kenaikan antara lain Korea Selatan, Indonesia dan Taiwan dengan kenaikan masing-masing sebesar 0,10%, 0,10% dan 0,70%.
GDP in some developing countries has increased i.e. South Korea, Indonesia and Taiwan with each increment of 0.10%; 0.10% and 0.70%
Secara keseluruhan, pertumbuhan ekonomi dunia pada tahun 2017 diperkirakan akan sebesar 3,20%. Pertumbuhan tersebut akan terus mengalami peningkatan hingga menjadi 3,40% di tahun 2018.
Overall, global economic growth in 2017 is expected by 3.20%. The growth will continue increase up reaching 3.40% in 2018.
Tabel 8 Table 8
Pertumbuhan Produk Domestik Bruto Dunia Global Gross Domestic Product Growth
(Dalam %) (In %)
2012 2013 2014 2015 2016 2017 2018
Dunia 3,50 3,30 3,40 3,20 3,10 3,20 3,40 World
Negara Maju Developed Country
Amerika Serikat 2,20 1,70 2,40 2,60 1,60 2,30 2,30 United States of America
Kawasan Euro (0,90) (0,30) 1,20 2,00 1,70 1,60 1,60 Euro Area
Jepang 1,50 2,00 0,30 1,20 1,00 1,00 0,90 Japan
Inggris 1,30 1,90 3,10 2,20 2,00 1,30 1,30 United Kingdom
Kanada 1,80 2,50 2,60 0,90 1,30 1,90 1,90 Canada
Negara Berkembang Developing Country
Tiongkok 7,90 7,80 7,30 6,90 6,70 6,50 6,20 China
Hong Kong 1,70 3,10 2,70 2,40 1,50 1,80 2,00 Hong Kong
India 4,80 4,70 6,50 7,20 7,90 6,80 7,40 India
Indonesia 6,00 5,60 5,00 4,90 5,00 5,30 5,50 Indonesia
Korea Selatan 2,30 2,90 3,30 2,60 2,70 2,50 2,60 South Korea
Malaysia 5,50 4,70 6,00 5,00 4,10 4,30 4,40 Malaysia
Singapura 3,70 4,70 3,30 2,00 1,70 1,50 2,00 Singapore
Taiwan 2,10 2,20 4,00 0,70 1,40 1,90 2,00 Taiwan
Keterangan DescriptionsAktual/Actual Proyeksi/Projection
Sumber: Bloomberg Source: Bloomberg

This report is originally issued in Bahasa Indonesia
38
IV.A.2. Inflasi IV.A.2. Inflation
Inflasi merupakan salah satu indikator pertumbuhan ekonomi yang juga memegang peranan penting dalam menentukan perekonomian suatu negara. Besarnya inflasi mencerminkan mekanisme pasar suatu negara yang menyebabkan peningkatan harga-harga secara umum dan terus menerus.
Inflation is one of economic growth indicators that hold an important role in determining a country’s economy. The level of inflation reflects one’s market mechanism which caused the increase in price generally and continuously.
Dalam beberapa tahun terakhir, inflasi berbagai kawasan di dunia mengalami fluktuasi. Secara keseluruhan, inflasi dunia pada tahun 2016 mengalami kenaikan sebesar 0,10% dibandingkan dengan tahun sebelumnya sebesar 2,80%.
In recent years, inflation in various regions of the world has fluctuated. Overall global inflation in the world in 2016 increased by 0.10% compared to previous year at 2.80%.
Pada tahun 2016, inflasi dunia mengalami kenaikan 0,10% menjadi sebesar 2,90%. Inflasi dunia pada tahun 2017 diperkirakan akan mengalami kenaikan sebesar 0,20% menjadi 3,10% dan pada tahun 2018 diperkirakan inflasi mengalami kenaikan sebesar 0,10% menjadi 3,20%. Tren kenaikan tersebut dipicu oleh pertumbuhan inflasi negara-negara yang berada di kawasan Asia.
In 2016, world inflation increase by 0,10% to 2.90%. Global inflation in 2017 is expected to increase by 0.20% to 3.10% and in 2018 the inflation rate is expected to increase by 0.10% to 3.20%. The rising trend in inflation will be driven by inflation growth on countries in Asian region.
Pada negara-negara berkembang, inflasi diperkirakan akan mengalami kenaikan. Perubahan inflasi tertinggi pada tahun 2017 diperkirakan akan terjadi di Singapura dan Indonesia dengan kenaikan masing-masing sebesar 1,50% dan 0,70%. Sementara itu, negara dengan perubahan inflasi terbesar pada tahun 2017 diperkirakan akan terjadi di Inggris dengan kenaikan inflasi sebesar 1,80%.
In developing countries, inflation is forecasted to increase. The highest inflation changes in 2017 is expected to occur in Singapore and Indonesia, with increase respectively of 1.50% and 0.70%. Meanwhile, country with the highest inflation in 2017 is expected to occur in United Kingdom with rising inflation of 1.80%.
Tabel 9 Table 9
Pertumbuhan Inflasi Inflation Growth
(Dalam %) (In %)
2012 2013 2014 2015 2016 2017 2018
Dunia 4,10 3,70 3,20 2,80 2,90 3,10 3,20 World
Negara Maju Developed Country
Amerika Serikat 2,10 1,50 1,60 0,10 1,30 2,40 2,40 United States of America
Kawasan Euro 2,50 1,40 0,40 - 0,20 1,70 1,50 Euro Area
Jepang - 0,30 2,70 0,80 (0,10) 0,60 1,00 Japan
Inggris 2,80 2,60 1,50 - 0,70 2,50 2,60 United Kingdom
Kanada 1,50 0,90 1,90 1,10 1,40 1,90 2,00 Canada
Negara Berkembang Developing Country
Tiongkok 2,70 2,60 2,00 1,40 2,00 2,20 2,30 China
Hong Kong 4,10 4,30 4,40 3,00 2,40 2,50 2,50 Hong Kong
India 9,30 10,90 6,40 5,90 5,00 4,70 5,00 India
Indonesia 4,00 6,40 6,40 6,40 3,50 4,20 4,40 Indonesia
Korea Selatan 2,20 1,30 1,30 0,70 1,30 1,70 1,90 South Korea
Malaysia 1,70 2,10 3,20 2,10 2,10 2,70 2,50 Malaysia
Singapura 4,60 2,40 1,00 (0,05) (0,50) 1,00 1,40 Singapore
Taiwan 1,90 0,80 1,20 (0,30) 1,30 1,40 1,30 Taiwan
Aktual/ActualKeterangan Descriptions
Proyeksi/Projection
Sumber: Bloomberg Source: Bloomberg

This report is originally issued in Bahasa Indonesia
39
IV.A.3. Suku Bunga IV.A.3. Interest Rate
Pada tahun 2016, Kanada dan Tiongkok tetap mempertahankan suku bunga bank sentralnya masing-masing sebesar 0,50% dan 4,35%. Negara dengan suku bunga tertinggi adalah Indonesia, dengan suku bunga sebesar 6,50%, yang selanjutnya diikuti oleh India dan Tiongkok masing-masing sebesar 6,25% dan 4,35%.
In 2016, Canada and China keep central bank interest rate respectively at 0.50% and 4.35%. The countries with the highest interest rate is Indonesia with interest rate of 6.50%, followed by India and China respectively at 6.25% and 4.35%.
Berdasarkan data Bloomberg, suku bunga bank sentral negara berkembang di tahun 2017 diprediksi mengalami penurunan. Negara yang diperkirakan akan mengalami penurunan suku bunga bank sentral terbesar adalah Indonesia sebesar 0,50% menjadi 6,00%, diikuti dengan India sebesar 0,35% menjadi 5,90%.
Based on Bloomberg, central bank interest rate in 2017 is predicted to decrease. Countries that are expected to have the largest decrease in central bank rate are Indonesia by 0.50% to 6.00%, followed by India by 0.35% to 5.90%.
IV.B. Tinjauan Ekonomi Indonesia IV.B. Indonesian Economic Overview
Perekonomian global diwarnai dengan pertumbuhan ekonomi yang tidak merata dan pasar keuangan yang diliputi ketidakpastian. Pemulihan ekonomi dunia masih lemah sejalan dengan pertumbuhan ekonomi negara-negara maju yang berjalan lambat, kecuali ekonomi AS perlahan mengalami perbaikan. Berdasarkan laporan yang dikeluarkan oleh Bank Indonesia yang berjudul Tinjauan Kebijakan Moneter pada bulan Desember 2016, pertumbuhan ekonomi Indonesia menunjukkan kinerja yang membaik ditopang oleh permintaan domestik yang tetap terjaga.
The global economic recovery is characterized by uneven economic growth and uncertainty financial market. The world economy recovery is still weak in line with economic growth from developed countries slow unless US growth which slowly improves. According to a report issued by Bank Indonesia entitled Tinjauan Kebijakan Moneter in December 2016, Indonesia’s economic growth had improved, sustained by well maintained domestic demand.
Tabel 10 Table 10
Pertumbuhan Suku Bunga Bank Sentral Central Bank Interest Rate Growth
(Dalam %) (In %)
2013 2014 2015 2016 2017
Negara Maju Developed Country
Amerika Serikat 0,25 0,25 0,50 0,75 1,35 United States of America
Kawasan Euro 0,25 0,05 0,05 - - Euro Area
Jepang 0,10 0,10 - (0,10) (0,10) Japan
Inggris 0,50 0,50 0,50 0,25 0,25 United Kingdom
Kanada 1,00 1,00 0,50 0,50 0,50 Canada
Negara Berkembang Developing Country
Tiongkok 6,00 5,60 4,35 4,35 4,30 China
Hong Kong 0,50 0,50 0,75 1,00 N/A Hong Kong
India 7,75 8,00 6,75 6,25 5,90 India
Indonesia 7,50 7,75 7,50 6,50 6,00 Indonesia
Korea Selatan 2,50 2,00 1,50 1,25 1,15 South Korea
Malaysia 2,99 3,23 3,05 3,00 2,95 Malaysia
Thailand 2,25 2,00 1,50 1,50 1,50 Thailand
Taiwan 1,88 1,88 1,63 1,38 1,35 Taiwan
Proyeksi/
ProjectionAktual/Actual
Keterangan Descriptions
Sumber: Bloomberg Source: Bloomberg

This report is originally issued in Bahasa Indonesia
40
Berdasarkan laporan yang dikeluarkan oleh Bank Indonesia yang berjudul Tinjauan Kebijakan Moneter pada bulan Desember 2016, pertumbuhan ekonomi Indonesia yang membaik tersebut didukung oleh konsumsi dan investasi, khususnya bangunan. Sementara itu, ekspor masih mengalami kontraksi, meskipun mulai membaik pada triwulan IV/2016.
According to a report issued by Bank Indonesia entitled Tinjauan Kebijakan Moneter in December 2016, Indonesia’s improving economy growth was supported by consumption and investation, especially construction. Meanwhile, export still having contractions, although it started to improve in the Q4/2016.
Pada tahun 2017, perekonomian domestik memasuki fase pemulihan ditandai dengan kondisi sektor korporasi yang membaik dan dukungan pembiayaan yang diperkirakan kembali meningkat, baik dari kredit perbankan maupun pembiayaan pasar modal. Dengan perkembangan tersebut, pertumbuhan ekonomi diperkirakan meningkat pada kisaran 5,00% – 5,40% ditopang oleh permintaan domestik yang tetap kuat dan pulihnya kinerja ekspor sejalan dengan membaiknya harga–harga komoditas ekspor Indonesia.
In 2017, the economy domestic enters a recovery phase indicated by improving corporation sector and financial support which is expected to increase, both from banking credit and capital market financing. With these improvements, economic growth is expected increase in the range of 5,00% – 5,40% supported by strong domestic demand and a recovery in export performance with the improvement in the price of Indonesia’s export commodities.
IV.C. Proyeksi Ekonomi Indonesia IV.C. Indonesian Economic Projection
Pada tahun 2016, Bank Indonesia memperkirakan bahwa pertumbuhan ekonomi Indonesia mengalami kenaikan menjadi 5,00% (yoy). Konsumsi rumah tangga diperkirakan tumbuh cukup kuat sehingga menopang pertumbuhan ekonomi. Pertumbuhan konsumsi rumah tangga hingga tahun 2016 diperkirakan lebih tinggi dari tahun sebelumnya yang tercermin dari meningkatnya tren penjualan kendaraan bermotor.
In 2016, Bank Indonesia forecasts that Indonesian economic growth increased t0 5.0% (yoy). Household consumption was expected to growth strong enough to support economic growth. Growth in household consumption in 2016 is estimated to be higher than the previous year as reflected in the increasing trend of motor vehicles sales.
Perkembangan investasi untuk tahun 2016 diperkirakan masih cukup baik terutama bersumber dari investasi bangunan yang tercermin pada peningkatan volume impor sejumlah bahan bangunan seperti keramik dan kaca. Di sisi lain, kinerja investasi non-bangunan tahun 2016 diperkirakan tumbuh melambat dibandingkan tahun 2015. Hal ini tercermin pada investasi barang modal sejalan dengan terbatasnya minat swasta untuk melakukan ekspansi. Namun demikian, perlambatan investasi nonbangunan tersebut tertahan oleh perbaikan investasi alat angkutan serta perbaikan impor suku cadang dan perlengkapan untuk barang modal.
The development of investment in 2016 is expected to remain well, mainly from construction investment which is reflected in the increased of import volume of some building material such as ceramics and glass. On the other hand, non-construction investment performance in 2016 is expected to grow slower than 2015. This is reflected in capital goods investment in line with the limited of private investment for expansion. However, the slowdown in non-construction investment is retained by the improvement of transport equipment investment and the improvement of imported spare parts and supplies for capital goods.

This report is originally issued in Bahasa Indonesia
41
Secara sektoral, perbaikan ekonomi antara lain ditopang oleh membaiknya pertumbuhan sektor pertambangan, sektor industri pengolahan dan sektor konstruksi. Harga beberapa komoditas global yang meningkat signifikan pada penghujung tahun 2016 berdampak pada kenaikan ekspor barang tambang. Sementara itu, sektor industri pengolahan yang membaik didukung oleh ekspor barang manufaktur yang meningkat. Selain itu, perbaikan ekonomi bersumber dari belanja infrastruktur pemerintah yang terus berlanjut.
By sector, conomic improvements is supported by improved growth in the mining sector, the manufacturing sector and construction sector. Global prices for some commodities increased significantly at the end of 2016 resulted in increased of exports mining products. Meanwhile, the manufacturing sector is improving supported by increasing exports of goods manufactured. In addition, the economy improvement resulted from continuously government infrastructure spending.
Selanjutnya, pada tahun 2017, perekonomian domestik mulai memasuki fase pemulihan. Fase ini ditandai dengan kondisi sektor korporasi yang membaik dan dukungan pembiayaan yang diperkirakan kembali meningkat, baik dari kredit perbankan maupun pembiayaan pasar modal. Dengan perkembangan tersebut, pertumbuhan ekonomi diperkirakan meningkat pada kisaran 5,00% – 5,40% ditopang oleh permintaan domestik yang tetap kuat dan pulihnya kinerja ekspor sejalan dengan membaiknya harga-harga komoditas ekspor Indonesia.
Hereinafter, in 2017, the economy domestic enters a recovery phase. This phase is indicated by improving corporation sector and financial support which is expected to increase, both from banking credit and capital market financing. With these improvements, economic growth is expected increase in the range of 5,00% – 5,40% supported by strong domestic demand and a recovery in export performance with the improvement in the price of Indonesia’s export commodities.
IV.D. Tingkat Suku Bunga IV.D. Interest Rate
Suku bunga Pasar Uang Antar Bank (PUAB) Overnight (O/N) mengalami penurunan sepanjang tahun 2016 seiring dengan adanya pelonggaran kebijakan moneter yaitu penurunan suku bunga, pada November 2016 tercatat sebesar 4,17% atau mengalami penurunan sebesar 3,28% dibandingkan dengan Desember 2015. Secara nominal, volume rata-rata PUAB total 2016 (ytd) tercatat mengalami kenaikan menjadi sebesar Rp 11,83 triliun dibandingkan dengan tahun sebelumnya sebesar Rp 11,65 triliun. Kenaikan volume PUAB total lebih dikontribusi oleh naiknya volume PUAB tenor O/N menjadi Rp 7,25 triliun.
Overnight Interbank Money Market Interest rates (PUAB O/N) decreased in 2016 in line with the easing of monetary policy which is decreased of interest rates in November 2016 was recorded at 4.17% or decreased by 3.28% compared to Desember 2015. By nominal, average volume of total PUAB in 2016 (ytd) was recorded an increase to Rp 11.83 trilion, compared to previous year amounting Rp 11.65 trillion. The increase in total PUAB volume is mainly contributed by raising volume of PUAB tenor O/N to Rp 7.25 trilion.

This report is originally issued in Bahasa Indonesia
42
Suku bunga deposito dan suku bunga kredit terus menurun sepanjang 2016, meskipun dengan magnitude yang berbeda. Penurunan suku bunga deposito selama tahun 2016 merupakan kelanjutan dari penurunan suku bunga deposito dari tahun sebelumnya dan seiring dengan pelonggaran kebijakan moneter yang tercermin pada penurunan giro wajib minimum dan policy rate. Penurunan
suku bunga Lembaga Penjamin Simpanan (LPS rate) dan penyesuaian capping suku bunga deposito oleh OJK juga mempengaruhi suku bunga deposito.
Deposit interest rates and credit interest rate continously decreased throughout 2016, although with different mangitude. The decrease of deposit interest rate during 2016 is a continuation from decreased of deposit interest credit rate from previous year and along with easing of monetary policy as reflected by the decrease in the minimum reserve requirement and policy rate. The decrease of LPS rate and adjustment of capping deposit interest rates by Financial Service Authority (FSA) also affected deposit interest rates.
Menurut jenisnya, suku bunga kredit modal kerja dan kredit investasi lebih responsif dibandingkan dengan suku bunga kredit konsumsi. Suku bunga kredit modal kerja dan kredit investasi turun sebesar -87 bps dan -78 bps, sementara kredit konsumsi hanya turun -20 bps.
By type, working capital interest rate and investment credit is more responsive than consumption credit interest rate. Working capital and investment credit interest rate is decrease by -87 bps and -78 bps, while consumption credit just decrease by -20 bps.
Berdasarkan jenis penggunaannya, penurunan suku bunga kredit terutama terjadi pada suku bunga kredit modal kerja. Sementara itu penurunan suku bunga kredit konsumsi relatif lambat sejalan dengan karakteristik kredit konsumsi yang tidak didukung oleh agunan memadai seperti kredit modal kerja dan kredit investasi.
Based on the type, decrease in credit interest rates mainly occur in working capital. While the decrease in consumption credit interest rate is relatively slow in line with the characteristics of consumption credit loans which is not supported by adequate collateral such as working capital loan and investment credit.
Grafik 1 Chart 1 Perkembangan Suku Bunga Bank Indonesia
Development of Bank of Indonesia Interest Rate
6,50% 6,50%6,00%
5,75%
7,50% 7,75%
7,50%
6,50%6,00%
0,00%
2,00%
4,00%
6,00%
8,00%
10,00%
2009 2010 2011 2012 2013 2014 2015 2016 2017*
* Proyeksi
Sumber: Bloomberg
* Projections
Source: Bloomberg

This report is originally issued in Bahasa Indonesia
43
Berdasarkan data yang diperoleh dari Bloomberg, suku bunga BI pada akhir tahun 2016 mencapai 6,50%, mengalami penurunan sebesar 1,00% dibandingkan dengan tahun 2015 sebesar 7,50%. Pada tahun 2017, suku bunga BI diproyeksikan mengalami penurunan sebesar 0,50% dibandingkan dengan tahun 2016 menjadi sebesar 6,00%.
Based on data from Bloomberg, BI rate at the end 2016 reached 6.50%, decreased by 1.00% compared to 2015 at 7.50%. In 2017, BI rate is forecasted to decrease by 0.50% compared to 2016 amounted to 6.00%.
IV.E. Inflasi IV.E. Inflation
Inflasi tahun 2016 secara keseluruhan dari bulan Januari hingga Desember tercatat sebesar 3,02% (yoy). Hal ini berada di batas bawah kisaran sasaran yang telah ditetapkan sebelumya sebesar 4%±1,00%. Pada bulan Desember 2016, realisasi inflasi tercatat sebesar 0,42% (mtm), sedikit lebih rendah dari bulan sebelumnya yang sebesar 3,02% (mtm). Penyebab terjaganya kestabilan inflasi juga tidak terlepas dari konsistensi kebijakan Bank Indonesia dalam menjaga stabilitas nilai tukar dan mengarahkan ekspektasi inflasi.
In 2016, inflation from January to December stood at 3.02% (yoy).It was estimated to be lower than the target range that set previously by 4%±1.00%. In December 2016, the inflation was recorded by 0.42% (mtm), slightly lower than the previous month, which is 3.02% (mtm). The stable in the inflation was also affected by consistency Bank Indonesia policy in maintaining stability of exchange rate and inflation guide expectations.
Sementara itu, Inflasi inti pada Desember 2016 tercatat sebesar 0,23%, sehingga secara tahunan sebesar 3,07% (yoy), rendahnya inflasi inti tersebut dipengaruhi oleh masih terbatasnya permintaan domestik, lemahnya tekanan eksternal dan membaiknya ekspektasi inflasi.
Meanwhile, core inflation in December 2016 was recorded at 0.23%, resulting in annual terms amounted to 3.07% (yoy), low core inflation was influenced by the limited domestic demand, lack of external pressure and improving inflation expectations.
Grafik 2 Chart 2 Perkembangan Inflasi Berdasarkan Indeks Harga Konsumen di Indonesia
Development of Inflation Based on Consumer Price Index in Indonesia
4,90% 5,10%5,40%
4,00%
6,40% 6,40%
6,40%
3,50%
4,30% 4,50%
4,50%
0,00%
1,00%
2,00%
3,00%
4,00%
5,00%
6,00%
7,00%
2009 2010 2011 2012 2013 2014 2015 2016 2017* 2018* 2019*
* Proyeksi
Sumber: Bloomberg
* Projections
Source: Bloomberg

This report is originally issued in Bahasa Indonesia
44
Berdasarkan data yang diperoleh dari Bloomberg, inflasi pada tahun 2016 mencapai 3,50%, lebih rendah dibandingkan inflasi pada tahun 2015 sebesar 6,40%. Pencapaian sasaran Inflasi tersebut didukung oleh inflasi volatile food yang 5,92% (yoy) dan administered prices yang mengalami inflasi yang rendah 0,21% (yoy). inflasi volatile food pada tahun 2016 disebabkan oleh komoditas yang terkendala produksi di beberapa daerah sebagai dampak dari La Nina.
Based on the data from Bloomberg, inflation in 2016 reached 3.50%, it was lower than the inflation rate in 2015 amounted to 6,40%. The inflation target achievement was supported by volatile food inflation by 5.92% (yoy) and administered prices that have low inflation 0.21% (yoy). The inflation of volatile food in 2016 due to the constrained commodity production in some areas as a result of La Nina .
Kontributor inflasi bulanan terbesar pada Desember 2016 berada di daerah Sumatera Utara dan Sumatera Barat dengan inflasi masing-masing sebesar 6,30% dan 4,90%. Kenaikan inflasi yang lebih tinggi di wilayah Sumatera antara lain dipengaruhi oleh kenaikan harga beberapa beberapa komoditas hortikultura, khususnya cabai merah yang cukup signifikan paruh kedua tahun 2016.
The largest contributor to monthly inflation in December 2016 was in the area of North Sumatra and West Sumatra respectively with inflation of 6.30% and 4.90%. The increase in inflation was higher in the area of Sumatra, due to influenced by price increase for several commodities, especially red chili in which quite significant in second quarter year 2016
Tabel 11 Table 11
Kontributor Inflasi Terbesar Largest Inflation Contributor
Berdasarkan Provinsi By Province
(Dalam %, mtm) (In %, mtm)
1. Sumatera Utara 6,30% North Sumatera
2. Aceh 4,00% Aceh
3. Riau 4,00% Riau
4. Sumatera Barat 4,90% West Sumatera
5. Sulawesi Tengah 1,50% Central Sulawesi
6. Papua Barat 3,60% West Papua
7. Banten 2,90% Banten
8. Sulawesi Barat 2,20% West Sulawesi
9. Sulawesi Selatan 2,90% South Sulawesi
10. Kepulauan Riau 4,00% Kepulauan Riau
DescriptionsKeteranganNo. Inflasi
Sumber: Tinjauan Kebijakan Moneter,
Bank Indonesia
Source: Tinjauan Kebijakan Moneter,
Bank of Indonesia

This report is originally issued in Bahasa Indonesia
45
IV.F. Nilai Tukar Rupiah IV.F. Rupiah Exchange Rate
Peningkatan volatilitas Rupiah yang cukup tinggi sempat terjadi pada pertengahan bulan Desember 2016 jelang Federal Open Market Committee (FOMC) meeting, namun volatilitas Rupiah kembali menurun setelah kenaikan FFR, dengan demikian sepanjang tahun 2016, volatilitas Rupiah lebih rendah dari tahun 2015 dan masih lebih rendah dibandingkan rata-rata voatilitas Real Brasil, Rand Afrika Selatan, Lira Turki, Ringgit Malaysia, Won Korea Selatan, serta rata-rata volatilitas mata uang negara kawasan.
Increased volatility in the rupiah that is quite high, had occurred in the mid-December 2016 ahead of the FOMC meeting, but the volatility of the rupiah declined after an increase FFR, thus throughout the year 2016, the volatility of the rupiah lower than in 2015 and is still lower than the average volatility of Real Brasil , Rand South African, Lira Turkish, Ringgit Malaysian, Won South Korean, and the average volatility of the currency countries in the region.
Penguatan nilai tukar rupiah tersebut sejalan dengan peningkatan aliran dana masuk terutama di Surat Utang Negara (SUN). Sementara itu, outflow yang terjadi di pasar saham berkurang setelah kenaikan FFR dan bahkan mendorong inflow di akhir Desember 2016. Selama tahun 2016, secara point to point Rupiah telah menguat sebesar 2,32% (ytd) terutama didukung oleh persepsi positif investor terhadap perekonomian domestik yang mendorong aliran dana masuk.
The strengthening of the exchange rate throughout 2016 was in line with the increase of the capital inflows, especially in state bonds (SUN). Meanwhile, the outflow that occurred in the stock market reduced after the increase in FFR and even encourage the inflow at the end of December 2016. During 2016, as a point to point Rupiah has appreciated by 2.32% (ytd) mainly supported by positive investor perceptions of the domestic economy which encourages fund inflows.
Grafik 3 Chart 3 Perkembangan Nilai Tukar Rupiah Terhadap Mata Uang Asing
Development of Rupiah Exchange Rate Against Foreign Currencies
Q1/2017* Q2/2017* Q3/2017* Q4/2017* 2018* 2019* 2020* 2021*
EUR 14.170 14.193 14.490 14.490 15.785 15.640 15.517 17.352
SGD 9.332 9.438 9.388 9.388 9.631 9.577 9.427 10.000
USD 13.625 13.780 13.800 13.800 14.350 13.600 13.150 14.400
-
2.000
4.000
6.000
8.000
10.000
12.000
14.000
16.000
18.000
20.000
* Proyeksi * Projection
Sumber: Bloomberg Source: Bloomberg

This report is originally issued in Bahasa Indonesia
46
Proyeksi nilai tukar Rupiah terhadap Euro pada Q1/2017 – 2021 secara berturut-turut diperkirakan sebesar Rp 14.170, Rp 14.193, Rp 14.490, Rp 14.490, Rp 15.785, Rp 15.640, Rp 15.517 dan Rp 17.352.
Projection of Rupiah exchange rate against Euro in Q1/2017 – 2021, respectively were Rp 14.170, Rp 14.193, Rp 14.490, Rp 14.490, Rp 15.785, Rp 15.640, Rp 15.517 dan Rp 17.352.
Proyeksi nilai tukar Rupiah terhadap SGD pada Q1/2017 – 2021 secara berturut-turut diperkirakan sebesar Rp 9.332, Rp 9.438, Rp 9.388, Rp 9.388, Rp 9.631, Rp 9.577, Rp 9.427 dan Rp 10.000.
Projection Rupiah exchange rate against SGD in Q1/2017 – 2021 respectively were Rp 9.332, Rp 9.438, Rp 9.388, Rp 9.388, Rp 9.631, Rp 9.577, Rp 9.427 dan Rp 10.000.
Proyeksi nilai tukar Rupiah terhadap USD berfluktuatif pada Q1/2017 – 2021 diperkirakan sebesar Rp 13.625, Rp 13.780, Rp 13.800, Rp 13.800, Rp 14.350, Rp 13.600, Rp 13.150 dan Rp 14.400.
Projection Rupiah exchange rate against USD in Q1/2017 – 2021 respectively were Rp 13.625, Rp 13.780, Rp 13.800, Rp 13.800, Rp 14.350, Rp 13.600, Rp 13.150 dan Rp 14.400.

This report is originally issued in Bahasa Indonesia
47
V. TINJAUAN INDUSTRI BATUBARA V. COAL INDUSTRY OVERVIEW
V.A. Tinjauan Industri Batubara di Dunia V.A. World Coal Industry Overview
Batubara merupakan salah satu sumber energi terbesar di dunia saat ini selain sumber energi dan mineral lainnya, seperti minyak bumi, gas alam, emas, perak dan berbagai jenis logam lainnya. Selain itu, batubara juga merupakan jenis komoditas dunia yang paling banyak diminati dalam perdagangan global. Pada saat ini, batubara memiliki banyak fungsi selain sebagai barang komoditas. Batubara pada masa kini banyak digunakan sebagai sumber energi untuk pembangkit tenaga listrik, khususnya pembangkit listrik tenaga uap. Beberapa negara maju dan negara berkembang di dunia pada saat ini sedang berupaya mengembangkan sumber tenaga listrik tenaga uap yang menggunakan batubara sebagai sumber bahan bakarnya.
Coal is one of the largest sources of energy in the world today as well as other energy and mineral resources, such as petroleum, natural gas, gold, silver and various other metals. In addition, coal is also a type of world commodity most in demand in global trade. At present, coal has many functions other than as commodity goods. Coal today is widely used as a source of energy for power generation, especially steam power plants. Several developed and developing countries in the world are currently working to develop a steam power source that uses coal as a fuel source.
Grafik 4 Chart 4 Harga Batubara Dunia Global Coal Prices (Dalam USD per Ton) (In USD per Tonnes)
NorthwestEuropeMarker
US CentralAppalachian
Coal
JapanCooking Coal
Japan SteamCoal Import
CIFAsian Marker
2011 121,52 87,38 229,12 136,21 125,74
2012 92,50 72,06 191,46 133,61 105,50
2013 81,69 71,39 140,45 111,16 90,90
2014 75,38 69,00 114,41 97,65 77,89
2015 56,64 53,59 93,85 79,47 63,52
-
50,00
100,00
150,00
200,00
250,00
Sumber: BP Statistical Review of Energy 2016 Source: BP Statistical Review of Energy 2016

This report is originally issued in Bahasa Indonesia
48
Berdasarkan laporan yang dibuat oleh British Petroleum (BP) yang berjudul BP Statistical Review, harga batubara yang paling tinggi pada tahun 2011 adalah harga batubara jenis Japan Cooking Coal yang mencapai USD
229,12 per ton. Selanjutnya, pada tahun 2012, harga batubara jenis Japan Cooking Coal mengalami penurunan sebesar USD 37,66 per ton atau setara dengan 16,44% dibandingkan dengan tahun 2011. Sementara itu, jenis batubara yang mengalami penurunan harga paling rendah pada tahun 2012 adalah jenis batubara Japan Steam Coal Import CIF,
dimana jenis batubara tersebut mengalami penurunan sebesar USD 2,60 per ton atau setara dengan 1,91% dibandingkan dengan tahun 2011.
Based on a report by the British Petroleum (BP) entitled BP Statistical Review, the highest coal price in 2011 was the price of Japan Cooking Coal which reached USD 229.12 per ton. Furthermore, in 2012, the price of Japan Cooking Coal has decreased by USD 37.66 per ton or equivalent to 16.44% compared to 2011. Meanwhile, the type of coal that suffer the lowest price decline in 2012 is the type of Japan Steam Coal Import CIF, where that type of coal has decreased by USD 2.60 per ton or equivalent to 1.91% compared to 2011.
Selanjutnya, pada tahun 2013, harga batubara jenis Japan Cooking Coal kembali mengalami penurunan sebesar USD 51,01 per ton atau setara dengan 26,64% dari sebelumnya sebesar USD 191,46 per ton menjadi sebesar USD 140,45 per ton pada tahun 2013. Pada tahun 2013, jenis batubara yang mengalami penurunan harga paling rendah adalah jenis batubara US Central Appalachian Coal, yaitu turun sebesar USD 0,67 per ton atau setara dengan 0,93% dari sebelumnya sebesar USD 72,06 per ton pada tahun 2012 menjadi sebesar USD 71,39 per ton.
Furthermore, in 2013, the price of Japan Cooking Coal declined again by USD 51.01 per ton or equivalent to 26.64% from USD 191.46 per ton to USD 140.45 per ton in 2013. In 2013, the lowest price of coal was the US Central Appalachian Coal, which decreased by USD 0.67 per ton or equivalent to 0.93% from USD 72.06 per ton in 2012 to USD 71.39 per ton.
Pada tahun 2014 sampai dengan tahun 2015, jenis batubara Northwest Europe Marker, US Central Appalachian Coal, Japan Cooking Coal, Japan Steam Coal Import CIF dan Asian Marker terus mengalami penurunan yang cukup signifikan. Pada tahun 2015, seluruh jenis batubara tersebut mengalami rata-rata penurunan harga sebesar USD 17,45 per ton atau setara dengan 20,45% dibandingkan dengan tahun 2014. Penurunan harga yang paling tinggi terjadi pada jenis batubara Japan Cooking Coal dan Northwest Europe Marker masing-masing mengalami penurunan sebesar USD 20,56 per ton dan USD 18,74 per ton.
From 2014 to 2015, Northwest Europe Marker, US Central Appalachian Coal, Japan Cooking Coal, Japan Steam Coal Import CIF and Asian Marker continue to suffer significant decline. In 2015, all types of coal suffer an average price reduction of USD 17.45 per ton or equivalent to 20.45% compared to 2014. The highest price drop occured in the type of coal Japan Cooking Coal and Northwest Europe Marker decreased by USD 20.56 per ton and USD 18.74 per ton, respectively.
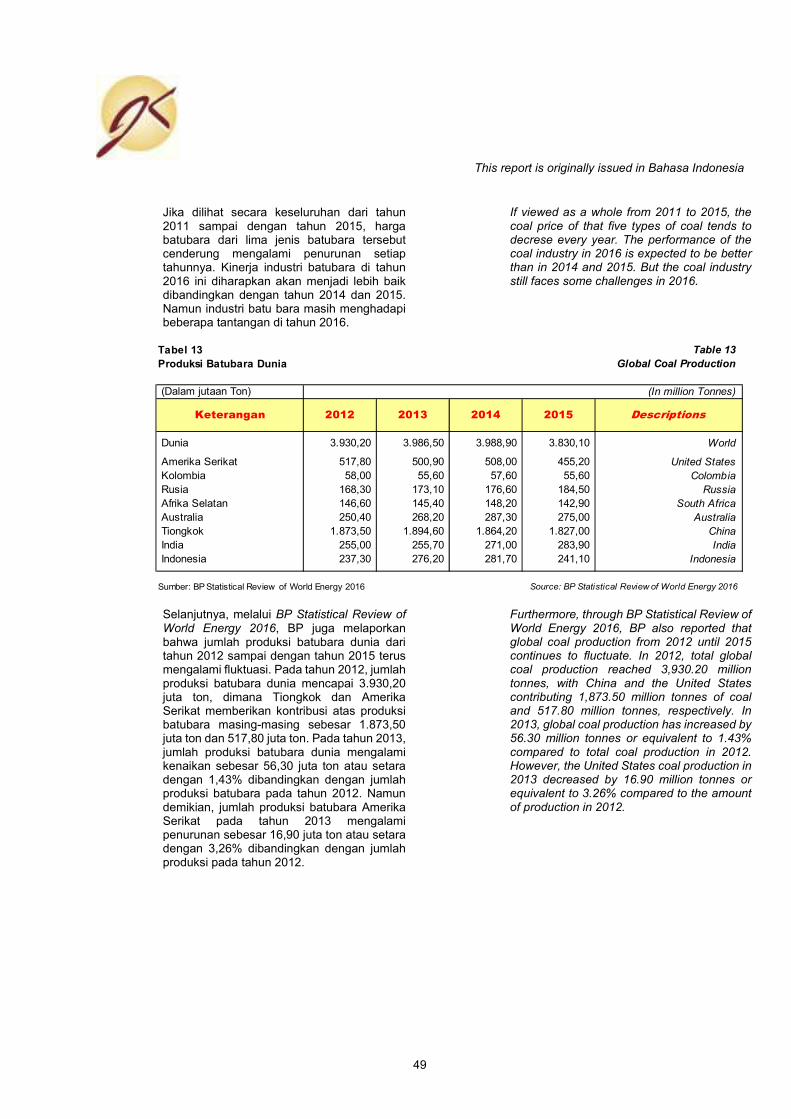
This report is originally issued in Bahasa Indonesia
49
Jika dilihat secara keseluruhan dari tahun 2011 sampai dengan tahun 2015, harga batubara dari lima jenis batubara tersebut cenderung mengalami penurunan setiap tahunnya. Kinerja industri batubara di tahun 2016 ini diharapkan akan menjadi lebih baik dibandingkan dengan tahun 2014 dan 2015. Namun industri batu bara masih menghadapi beberapa tantangan di tahun 2016.
If viewed as a whole from 2011 to 2015, the coal price of that five types of coal tends to decrese every year. The performance of the coal industry in 2016 is expected to be better than in 2014 and 2015. But the coal industry still faces some challenges in 2016.
Selanjutnya, melalui BP Statistical Review of World Energy 2016, BP juga melaporkan bahwa jumlah produksi batubara dunia dari tahun 2012 sampai dengan tahun 2015 terus mengalami fluktuasi. Pada tahun 2012, jumlah produksi batubara dunia mencapai 3.930,20 juta ton, dimana Tiongkok dan Amerika Serikat memberikan kontribusi atas produksi batubara masing-masing sebesar 1.873,50 juta ton dan 517,80 juta ton. Pada tahun 2013, jumlah produksi batubara dunia mengalami kenaikan sebesar 56,30 juta ton atau setara dengan 1,43% dibandingkan dengan jumlah produksi batubara pada tahun 2012. Namun demikian, jumlah produksi batubara Amerika Serikat pada tahun 2013 mengalami penurunan sebesar 16,90 juta ton atau setara dengan 3,26% dibandingkan dengan jumlah produksi pada tahun 2012.
Furthermore, through BP Statistical Review of World Energy 2016, BP also reported that global coal production from 2012 until 2015 continues to fluctuate. In 2012, total global coal production reached 3,930.20 million tonnes, with China and the United States contributing 1,873.50 million tonnes of coal and 517.80 million tonnes, respectively. In 2013, global coal production has increased by 56.30 million tonnes or equivalent to 1.43% compared to total coal production in 2012. However, the United States coal production in 2013 decreased by 16.90 million tonnes or equivalent to 3.26% compared to the amount of production in 2012.
Tabel 13 Table 13
Produksi Batubara Dunia Global Coal Production
(Dalam jutaan Ton) (In million Tonnes)
Dunia 3.930,20 3.986,50 3.988,90 3.830,10 World
Amerika Serikat 517,80 500,90 508,00 455,20 United States
Kolombia 58,00 55,60 57,60 55,60 Colombia
Rusia 168,30 173,10 176,60 184,50 Russia
Afrika Selatan 146,60 145,40 148,20 142,90 South Africa
Australia 250,40 268,20 287,30 275,00 Australia
Tiongkok 1.873,50 1.894,60 1.864,20 1.827,00 China
India 255,00 255,70 271,00 283,90 India
Indonesia 237,30 276,20 281,70 241,10 Indonesia
DescriptionsKeterangan 2012 2013 2014 2015
Sumber: BP Statistical Review of World Energy 2016 Source: BP Statistical Review of World Energy 2016

This report is originally issued in Bahasa Indonesia
50
Sementara itu, pada tahun 2014, jumlah produksi batubara dunia kembali mengalami kenaikan sebesar 2,40 juta ton atau setara dengan 0,06% dibandingkan dengan jumlah produksi pada tahun 2013. Pada tahun 2014, jumlah produksi batubara Tiongkok mengalami penurunan yang cukup signifikan dibandingkan dengan jumlah produksi pada tahun 2013, yaitu turun sebesar 30,40 juta ton atau setara dengan 1,60%. Selanjutnya, pada tahun 2015, jumlah produksi batubara dunia mengalami penurunan sebesar 158,80 juta ton atau setara dengan 3,98% dibandingkan dengan jumlah produksi pada tahun 2014. Hal ini terutama dipicu oleh menurunnya jumlah produksi batubara di beberapa negara penghasil batubara utama di dunia, seperti Amerika Serikat, Kolombia, Afrika Selatan, Australia, Tiongkok dan Indonesia.
Meanwhile, in 2014, global coal production in 2014 increased again by 2.40 million tonnes or equivalent to 0.06% compared with the amount of production in 2013. In 2014, the amount of coal production in China decreased significantly compared to total production in 2013, which decreased by 30.40 million tonnes or equivalent to 1.60%. Furthermore, in 2015, global total coal production has decreased by 158.80 million tonnes or equivalent to 3.98% compared to the total production in 2014. This is mainly trigerred by the declining number of coal production in some major coal producing countries in the world, such as the United States, Colombia, South Africa, Australia, China and Indonesia.
Permintaan batubara yang cenderung mengalami penurunan yang disertai dengan penurunan produksi batubara menyebabkan turunnya harga batubara dunia, dimana harga batubara dunia dalam beberapa tahun terakhir terus mengalami fluktuasi. Pada tahun 2015, harga batubara mengalami penurunan yang cukup signifikan dibandingkan dengan harga batubara pada beberapa tahun sebelumnya.
Demand for coal which tends to decline along with the decline in coal production causes the decline in world coal prices, where global coal prices i recent years continue to fluctuate. In 2015, coal prices declined significantly compared to coal prices in previous years.
Selain itu, beberapa negara di benua Eropa serta Amerika Serikat telah menekan pemanfaatan energi berbasis fosil. Hal ini sudah terlihat dari adanya penutupan beberapa pembangkit listrik berbasis batubara di beberapa negara di benua Eropa dan Amerika Serikat. Kesadaran masyarakat global untuk mengurangi emisi karbon akan berpengaruh pada permintaan batu bara di masa mendatang. Dalam pertemuan Conference of Parties yang diselenggarakan di Paris pada akhir tahun 2015 mendorong negara-negara peserta untuk mengurangi suhu global di bawah 2⁰C. Salah satu caranya adalah dengan menekan konsumsi energi berbasis fosil yaitu energi yang dihasilkan dari batu bara.
In addition, several countries in continental Europe and the United States have suppressed the use of fossil-based energy. This is evident from the closure of several coal-based power plants in several countries in contiental Europe and the United States. Global public awareness to reduce carbon emissions will affect future demand for coal. In the Conference of Parties meeting held in Paris at the end of 2015 encourage participating countries to reduce global temperatures below 20C. One way is to suppress the consumption of fossil-based energy that is energy generated from coal.

This report is originally issued in Bahasa Indonesia
51
Grafik 5 Chart 5 Distribusi Cadangan Batubara Dunia Tahun 2015
The Distribution of Global Coal Reserve In 2015
Selanjutnya, berdasarkan BP Statistical of World Energy 2016, jumlah cadangan batubara terbesar berada di kawasan Eropa dan Eurasia yang mencapai 34,80% dari total jumlah cadangan batubara dunia. Selanjutnya, kawasan dengan jumlah cadangan batubara terbesar kedua adalah kawasan Asia Pasifik yang mencapai 32,30%. Kawasan dengan jumlah cadangan batubara terbesar ketiga di dunia adalah kawasan Amerika Utara dengan jumlah cadangan batubara yang mencapai 27,50% dari total jumlah cadangan batubara dunia.
Furthermore, based on BP Statistical of World Energy 2016, the largest amount of coal reserves in Europe and Eurasia reach 34.80% of the total global coal reserves. Furthermore, the region with the second largest coal reserves is the Asia Pacific region which reached 32.30%. The region with the third largest coal reserve in the world is North America with a reserve of coal reserves of 27.50% of the global total coal reserves.
34,80%
32,30%
27,50%
3,70%1,60%
Eropa & Eurasia
Asia Pasifik
Amerika Utara
Timur Tengah & Afrika
Amerika Selatan & Amerika
Tengah
Sumber: BP Statistical Review of World Energy 2016 Source: BP Statistical Review of World Energy 2016

This report is originally issued in Bahasa Indonesia
52
Grafik 6 Chart 6 Proyeksi Harga Batubara Dunia Global Coal Prices Projection (dalam USD per Ton) (in USD per Tonnes)
Berdasarkan data yang diperoleh dari Bloomberg, proyeksi harga batubara jenis Coal CIF ARA dan Steam Coal FOB Newcastle pada akhir tahun 2016 diperkirakan masing-masing sebesar USD 81,70 per ton dan USD 96,43 per ton. Selanjutnya, pada tahun 2017, harga batubara jenis Coal CIF ARA dan Steam Coal FOB Newcastle diperkirakan akan mengalami penurunan masing-masing sebesar USD 14,04 per ton dan USD 22,31 per ton atau masing-masing setara dengan 17,18% dan 23,14% dibandingkan dengan harga batubara pada tahun 2016. Selanjutnya, pada tahun 2018 sampai dengan tahun 2020 harga batubara jenis Coal CIF ARA dan Steam Coal FOB Newcastle cenderung mengalami penurunan. Harga batubara jenis Coal CIF ARA dan Steam Coal FOB Newcastle dari tahun 2018
sampai dengan tahun 2020 rata-rata mengalami penurunan sebesar USD 2,45 per ton dan USD 2,47 per ton atau setara dengan 3,66% dan 3,36%.
Bsed on data obtained from Bloomberg, the coal price projection of Coal CIF ARA and Steam Coal FOB Newcastle at the end of 2016 is estimated at USD 81.70 per ton and USD 96.43 per ton, respectively. Furthermore, in 2017, Coal CIF ARA and Steam Coal FOB Newcastle prices are expected to decrease by USD 14.04 per ton and USD 22.31 per ton, respectively or equivalent to 17.18% and 23.14% compared to the price of coal in 2016. Furthermore, in 2018 to 2020 the prices of Coal CIF ARA and Steam Coal FOB Newcastle tend to decrease. The average prices of Coal CIF ARA and Steam Coal FOB Newcastle from 2018 to 2020 decreased by USD 2.45 per ton and USD 2.47 per ton equivalent to 3.66% and 3.36%.
2016 2017 2018 2019 2020
Coal CIF ARA 81,70 67,66 60,99 60,00 60,30
Steam Coal FOB Newcastle 96,43 74,12 67,24 66,15 66,70
-
20,00
40,00
60,00
80,00
100,00
120,00
Sumber: Bloomberg Source: Bloomberg
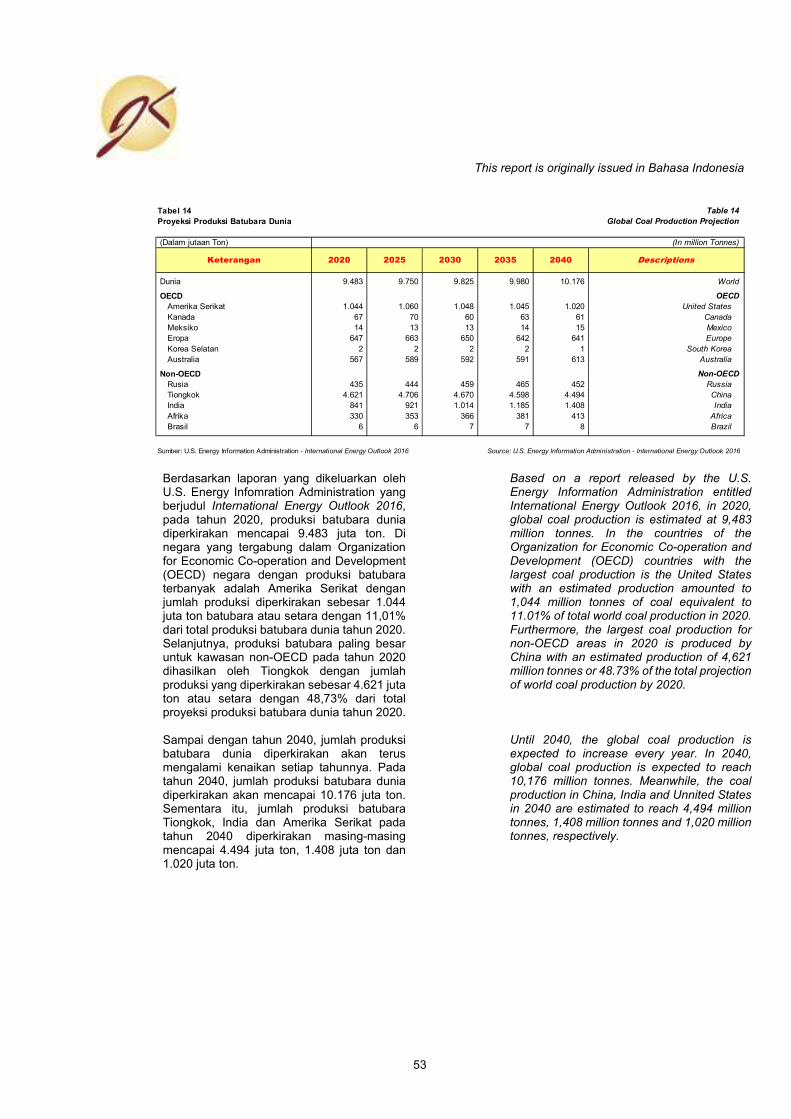
This report is originally issued in Bahasa Indonesia
53
Berdasarkan laporan yang dikeluarkan oleh U.S. Energy Infomration Administration yang berjudul International Energy Outlook 2016, pada tahun 2020, produksi batubara dunia diperkirakan mencapai 9.483 juta ton. Di negara yang tergabung dalam Organization for Economic Co-operation and Development (OECD) negara dengan produksi batubara terbanyak adalah Amerika Serikat dengan jumlah produksi diperkirakan sebesar 1.044 juta ton batubara atau setara dengan 11,01% dari total produksi batubara dunia tahun 2020. Selanjutnya, produksi batubara paling besar untuk kawasan non-OECD pada tahun 2020 dihasilkan oleh Tiongkok dengan jumlah produksi yang diperkirakan sebesar 4.621 juta ton atau setara dengan 48,73% dari total proyeksi produksi batubara dunia tahun 2020.
Based on a report released by the U.S. Energy Information Administration entitled International Energy Outlook 2016, in 2020, global coal production is estimated at 9,483 million tonnes. In the countries of the Organization for Economic Co-operation and Development (OECD) countries with the largest coal production is the United States with an estimated production amounted to 1,044 million tonnes of coal equivalent to 11.01% of total world coal production in 2020. Furthermore, the largest coal production for non-OECD areas in 2020 is produced by China with an estimated production of 4,621 million tonnes or 48.73% of the total projection of world coal production by 2020.
Sampai dengan tahun 2040, jumlah produksi batubara dunia diperkirakan akan terus mengalami kenaikan setiap tahunnya. Pada tahun 2040, jumlah produksi batubara dunia diperkirakan akan mencapai 10.176 juta ton. Sementara itu, jumlah produksi batubara Tiongkok, India dan Amerika Serikat pada tahun 2040 diperkirakan masing-masing mencapai 4.494 juta ton, 1.408 juta ton dan 1.020 juta ton.
Until 2040, the global coal production is expected to increase every year. In 2040, global coal production is expected to reach 10,176 million tonnes. Meanwhile, the coal production in China, India and Unnited States in 2040 are estimated to reach 4,494 million tonnes, 1,408 million tonnes and 1,020 million tonnes, respectively.
Tabel 14 Table 14
Proyeksi Produksi Batubara Dunia Global Coal Production Projection
(Dalam jutaan Ton) (In million Tonnes)
Dunia 9.483 9.750 9.825 9.980 10.176 World
OECD OECD
Amerika Serikat 1.044 1.060 1.048 1.045 1.020 United States
Kanada 67 70 60 63 61 Canada
Meksiko 14 13 13 14 15 Mexico
Eropa 647 663 650 642 641 Europe
Korea Selatan 2 2 2 2 1 South Korea
Australia 567 589 592 591 613 Australia
Non-OECD Non-OECD
Rusia 435 444 459 465 452 Russia
Tiongkok 4.621 4.706 4.670 4.598 4.494 China
India 841 921 1.014 1.185 1.408 India
Afrika 330 353 366 381 413 Africa
Brasil 6 6 7 7 8 Brazil
2040Keterangan 2020 2025 2030 2035 Descriptions
Sumber: U.S. Energy Information Administration - International Energy Outlook 2016 Source: U.S. Energy Information Administration - International Energy Outlook 2016

This report is originally issued in Bahasa Indonesia
54
Grafik 7 Chart 7 Proyeksi Konsumsi Batubara Dunia Global Coal Consumption Projection (dalam kuadriliun British Thermal Unit/Btu) (in quadrilion British Thermal Unnit/BTU)
Berdasarkan International Energy Outlook 2016, pada tahun 2020, Amerika Serikat merupakan konsumen batubara terbesar di antara negara OECD lainnya. Jumlah konsumsi batubara Amerika Serikat pada tahun 2020 diperkirakan sebesar 20,33 kuadriliun British Thermal Unit (Btu) atau setara dengan 46,51% dari total konsumsi negara OECD di tahun 2020. Selanjutnya, untuk kawasan OECD Eropa dan OECD Asia, jumlah konsumsi batubara di kawasan tersebut masing-masing diperkirakan sebesar 13,16 kuadriliun Btu dan 10,23 kuadriliun Btu atau setara dengan 30,09% dan 23,41% dari total konsumsi batubara negara-negara OECD.
Based on International Energy Outlook 2016, in 2020, the United States is the largest coal consumer among the other OECD countries. The amount of United States coal consumption in 2020 is estimated at 20.33 quadrillion British Thermal Unit (Btu) or equivalent to 46.51% of the total consumption of OECD countries in 2020. Furthermore, for the OECD region of Europe and OECD Asia, the amount of coal consumption inn each area is estimated at 13.16 quadrillion Btu and 10.23 quadrillion Btu or equivalent to 30.09% and 23.41% of the total coal consumption of OECD countries.
Dengan semakin meningkatnya jumlah produksi dan konsumsi batubara sampai dengan tahun 2040, maka kelangsungan industri batubara dapat dipastikan memiliki prospek yang positif. Selain itu, dengan semakin banyaknya industri yang menggunakan batubara sebagai sumber energi, maka jumlah perdagangan batubara sebagai komoditas perdagangan global akan terus meningkat setiap tahunnya.
With the increasing number of coal production and consumption up to 2040, the continuity of the coal industry can certainly have a positive outlook. In addition, as more and more industries use coal as an energy source, the amount of coal trading as a global commodity trade will continue to increase every year.
Amerika
OECD
Amerika
OECD
dengan
PP
Eropa
OECDAsia OECD
Eropa dan
Eurasia
Non-
OECD
Non-
OECD
lainnya
Non-
OECD Asia
Total
OECD
2020 20,33 16,26 13,16 10,23 9,38 6,32 109,20 43,72
2040 20,00 15,39 12,62 10,11 9,60 8,33 119,53 42,73
0,00
20,00
40,00
60,00
80,00
100,00
120,00
140,00
Sumber: U.S. Energy Information Administration - International Energy Outlook 2016 Source: U.S. Energy Information Administration - International Energy Outlook 2016

This report is originally issued in Bahasa Indonesia
55
V.B. Tinjauan Industri Batubara di Indonesia V.B. Indonesian Coal Industry Overview
Sub-sektor pertambangan batubara pada pendapatan domestik bruto (PDB) nasional mengalami penurunan pada tahun 2015 sebagai akibat dari menurunnya harga batubara dan jumlah produksi. Pada tahun 2015 pertumbuhan sub-sektor pertambangan batubara dan lignit mengalami penurunan yang disebabkan oleh penurunan harga rata-rata batubara sebesar 16,90% pada tahun 2015 dibandingkan dengan tahun 2014 serta penurunan jumlah produksi batubara sebesar 392 juta ton atau setara dengan 14,40% pada tahun 2015 dibandingkan dengan tahun 2014 yang mencapai 458 juta ton.
The coal mining sub-sector of national gross domestic product (GDP) has decreased in 2015 as a result of declining coal prices and production quantities. In 2015, the growth of the coal and lignite mining sub-sectors decreased due to the decrease of the average price of coal by 16.90% in 2015 compared to 2014 and the decrease of coal production amounted to 392 million tonnes or equivalent to 14.40% in 2015 compared to 2014 which reached 458 million tonnes.
Selanjutnya, volume ekspor batu bara Indonesia pada tahun 2015 mengalami penurunan sebesr 8,20% year-on-year (yoy) akibat permintaan yang mengalami penurunan di negara tujuan ekspor utama yaitu India, Tiongkok, Jepang dan Korea Selatan. Selain itu, batubara Indonesia kalah bersaing dengan batubara dari Australia dengan alasan kandungan kalori dalam batubara Indonesia lebih rendah dibandingkan dengan batubara Australia. Disamping itu, Tiongkok mulai selektif dalam mengimpor batubara, hanya batubara dengan kualitas baik yang boleh diimpor dengan alasan lingkungan.
Furthermore, Indonesia’s coal export volume in 2015 decreased by 8.20% year-on-year (yoy) due to declining demand in major export destinations of India, China, Japan and South Korea. In addition, Indonesia’s coal is less competitive than coal from Australia on the grounds that calorie content in Indonesia coal is lower than that of Australian coal. In addition, China began to be selective in importing coal, only good quality coal that can be imported for environmental reasons.
Selanjutnya, berdasarkan laporan yang berjudul BP Statistical Review of World Energy 2016, jumlah cadangan batubara di Indonesia pada tahun 2015 adalah sebesar 28.017 juta ton. Sementara itu, jumlah produksi batubara Indonesia pada tahun 2015 adalah sebesar 241 juta ton atau mengalami penurunan sebesar 14,41% dibandingkan dengan jumlah produksi batubara pada tahun 2014. Selanjutnya, jumlah konsumsi batubara di Indonesia pada tahun 2015 meningkat sebesar 80 juta ton atau setara dengan 15,00% dibandingkan dengan jumlah konsumsi pada tahun 2014.
Furthermore, based on a report entitled BP Statistical Review of World Energy 2016, the amount of coal reserves in Indonesia in 2015 amounted to 28,017 million tonnes. Meanwhile, Indonesia’s coal production in 2015 amounted to 241 million tonnes or decreased by 14.41% compared to total coal production in 2014. Furthermore, the amount of Indonesia’s coal consumption in 2015 increased by 80 million tonnes or equivalent to 15.00% compared to the amount of consumption in 2014.

This report is originally issued in Bahasa Indonesia
56
Grafik 8 Chart 8 Rata-rata Harga Batubara Acuan di Indonesia
Average Reference Coal Price in Indonesia
(dalam USD per Ton) (in USD per Ton)
Berdasarkan data yang dibuat oleh Asosiasi Pertambangan Batubara Indonesia (APBI), rata-rata harga batubara acuan (HBA) pada tahun 2012 adalah sebesar USD 95,48 per ton. Pada tahun 2013, rata-rata HBA kembali mengalami penurunan menjadi sebesar USD 82,92 per ton. Selanjutnya, pada tahun 2014 sampai dengan tahun 2015, rata-rata HBA terus mengalami penurunan, masing-masing menjadi sebesar USD 72,62 per ton pada tahun 2014 dan USD 60,13 per ton pada tahun 2015. Pada tahun 2016, rata-rata HBA sampai dengan bulan November 2016 mencapai USD 58,21 per ton. Jumlah ini mengalami penurunan dibandingkan sebesar USD 1,92 per ton atau setara dengan 3,19% dibandingkan dengan rata-rata HBA pada tahun 2015.
Based on data made by the Indonesian Coal Mining Association (APBI), the average price of reference coal (HBA) in 2012 is USD 95.48 per ton. In 2013, the HBA average decreased to USD 82.92 per ton. Furthermore, in 2014 until 2015, the HBA average continues to decline, each to USD 72.62 per ton in 2014 and USD 60.13 per ton in 2015. In 2016, the average HBA until November 2016 reached USD 58.21 per ton. This amount decreased compared to USD 1.92 per ton or equivalent to 3.19% compared to the average HBA in 2015.
95,48
82,92
72,62
60,13 58,21
0
20
40
60
80
100
120
2012 2013 2014 2015 2016*
Sumber: Asosiasi Pertambangan Batubara Indonesia Source: Indonesian Coal Mining Association
* sampai dengan bulan November 2016 * until November 2016

This report is originally issued in Bahasa Indonesia
57
Menurut APBI, Indonesia berpotensi mengalami krisis batubara pada periode 2035 yang diperkirakan karena habisnya cadangan batubara di Indonesia. Hal itu mengakibatkan Indonesia harus melakukan impor batubara dari negara tetangga, khususnya Australia.
According to APBI, Indonesia has the potential to sustain a coal crisis in the period of 2035 which is estimated due to the depletion of coal reserves in Indonesia. It causes Indonesia to import coal from near countries, especially Australia.
Selanjutnya, APBI mengungkapkan bahwa cadangan batubara Indonesia pada tahun 2016 diperkirakan mencapai 8 miliar ton, sementara untuk konsumsi batubara domestik diperkirakan sebesar 170 juta ton batubara setiap tahun. Indonesia memiliki cadangan batubara sebesar 30 miliar ton sampai dengan 40 miliar ton yang tersimpan di perut bumi yang dapat memenuhi kebutuhan jangka panjang. Namun demikian, batubara yang dapat dikeruk pada saat ini hanya sebesar 8 milliar ton saja.
Furthermore, APBI revealed that Indonesia’s coal reserves in 2016 is estimated to reach 8 billion tonnes, while for domestic coal consumption is estimated at 170 million tonnes of coal each year. Indonesia has coal reserves of 30 billion tonnes up to 40 billion tonnes stored in the earth that can meet long-term needs. However, coal that can be dredged at present is only 8 billion tonnes.
Dengan perkiraan kondisi tersebut, Indonesia dapat berpotensi menjadi negara pengimpor batubara dari Australia disebabkan karena adanya risiko kehabisan cadangan batubara. Namun demikian, dengan adanya beberapa investor baru baik dari dalam negeri maupun dari luar negeri yang akan menanamkan modalnya dalam industri batubara di Indonesia, maka hal ini diharapakan dapat memberikan peluang terhadap penemuan sumber cadangan batubara yang baru sehingga hal ini dapat memberikan prospek yang positif bagi kelangsungan industri batubara di Indonesia untuk jangka waktu yang sangat lama. Selain itu, kebijakan-kebijakan yang akan diterapkan oleh Pemerintah dalam beberapa tahun yang akan datang diharapkan dapat memberikan kontribusi positif terhadap kelangsungan usaha para pelaku industri pertambangan batubara.
With that prediction, Indonesia could potentially become a coal importing country from Australia due to the risk of running out of coal reserves. However, with some new investors both domestically and abroad who will invest in the coal industry in Indonesia, it is expected to provide opportunities for the discovery of new sources of coal reserves so that this can provide a positive prospect for sustainability of coal industry in Indonesia for a very long period of time. In addition, the policies that will be implemented by the Government in the next few years are expected to contribute positively to the business continuity of coal mining industry players.

This report is originally issued in Bahasa Indonesia
58
VI. ANALISA LAPORAN KEUANGAN
KONSOLIDASIAN HISTORIS VI. HISTORICAL ANALYSIS OF
CONSOLIDATED FINANCIAL STATEMENTS
VI.A. PT Dwikarya Sejati Utama VI.A. PT Dwikarya Sejati Utama
Laporan keuangan konsolidasian DSU untuk periode sembilan bulan yang berakhir pada tanggal 31 Desember 2016 dan untuk tahun yang berakhir pada tanggal-tanggal 31 Maret 2016, 2015 dan 2014 telah diaudit oleh KAP GSH masing-masing dengan pendapat wajar tanpa pengecualian. Laporan keuangan konsolidasian DSU untuk tahun yang berakhir pada tanggal-tanggal 31 Maret 2013 dan 2012 telah diaudit oleh KAP GMH masing-masing dengan pendapat wajar tanpa pengecualian.
DSU’s consolidated financial statements for nine months period ended 31 December 2016 and for the years ended 31 March 2016, 2015 and 2014 were audited by KAP GSH with an unqualified opinion, respectively. DSU’s consolidated financial statements for the years ended 31 March 2013 and 2012 were audited by KAP GMH with an unqualified opinion, respectively.
Ikhtisar data keuangan penting DSU adalah sebagai berikut:
The summary of key financial data of DSU are as follows:
VI.A.1. Laporan Posisi Keuangan VI.A.1. Statements of Financial Position
Tabel 15 Table 15
PT Dwikarya Sejati Utama PT Dwikarya Sejati Utama
Laporan Posisi Keuangan Statements of Financial Position
Per 31 Desember 2016 dan 31 Maret 2012 - 2016 As of 31 December 2016 and 31 March 2012 - 2016
(Dalam ribuan USD) (In thousand USD)
A S E T A S S E T S
ASET LANCAR CURRENT ASSETS
Kas dan setara kas 81 266 6.359 78 138 769 Cash and cash equivalents
Persediaan - 426 405 - - - Inventories
Uang muka 645 1.031 769 367 94 127 Advance payments
Biaya dibayar di muka 5 52 55 49 51 109 Prepayments
Pajak dibayar di muka 0 0 0 0 0 - Prepaid taxes
Piutang lain-lain - 2 2 5 26 9 Other receivables
Jumlah Aset Lancar 731 1.777 7.590 500 308 1.013 Total Current Assets
ASET TIDAK LANCAR NON-CURRENT ASSETS
Aset tetap 13.403 13.551 12.929 7.690 7.493 7.085 Fixed assets
Deposit jaminan 16 13 13 11 8 6 Refundable deposits
Dana yang dibatasi penggunaannya 424 398 1.719 1.410 57 - Restricted deposits
Aset pajak tangguhan - - - 8 40 39 Deferred tax assets
Biaya eksplorasi dan pengembangan Deferred exploration and development
ditangguhkan 66.640 62.341 54.689 47.010 39.409 33.379 expenditures
Jumlah Aset Tidak Lancar 80.483 76.303 69.350 56.129 47.006 40.509 Total Non-Current Assets
JUMLAH ASET 81.214 78.080 76.940 56.629 47.315 41.522 TOTAL ASSETS
Descriptions31/03/13Keterangan 31/12/16 31/03/16 31/03/15 31/03/14 31/03/12

This report is originally issued in Bahasa Indonesia
59
VI.A.2. Aset VI.A.2. Assets
Jumlah aset DSU pada tanggal-tanggal 31 Desember 2016, 31 Maret 2016, 2015, 2014, 2013 dan 2012 masing-masing adalah sebesar USD 81,21 juta, USD 78,08 juta, USD 76,94 juta, USD 56,63 juta, USD 47,32 juta dan USD 41,52 juta.
DSU’s total assets as of 31 December 2016, 31 March 2016, 2015, 2014, 2013 and 2012 were USD 81.21 million, USD 78.08 million, USD 76.94 million, USD 56.63 million, USD 47.32 million and USD 41.52 million, respectively.
Pada tanggal 31 Desember 2016, jumlah aset DSU mengalami kenaikan sebesar USD 3,13 juta atau setara dengan 4,01% dibandingkan dengan jumlah aset pada tanggal 31 Maret 2016. Kenaikan ini terutama disebabkan oleh kenaikan biaya eksplorasi dan pengembangan ditangguhkan sebesar USD 4,30 juta, yang disertai dengan penurunan persediaan, uang muka dan kas dan setara kas masing-masing sebesar USD 0,43 juta, USD 0,39 juta dan USD 0,19 juta.
DSU’s total assets as of 31 December 2016 increased by USD 3.13 million or equivalent to 4.01% compared to total assets as of 31 March 2016. This increase was primarily due to the increase in deferred exploration and development expenditures amounting USD 4.30 million, followed by the decrease in inventories, advance payments and cash and cash equivalents amounting USD 0.43 million, USD 0.39 million and USD 0.19 million, respectively.
(Dalam ribuan USD) (In thousand USD)
LIABILITAS DAN EKUITAS LIABILITIES AND EQUITY
LIABILITAS LIABILITIES
LIABILITAS JANGKA PENDEK CURRENT LIABILITIES
Biaya yang masih harus dibayar 2.465 1.556 1.975 1.518 1.011 1.474 Accrued expenses
Utang pajak 312 188 54 47 27 44 Taxes payable
Utang lain-lain 28.593 167 15.984 5.477 229 104 Other payables
Uang muka pelanggan 13 7.385 7.529 2.385 5.810 - Advance from customers
Uang muka dari pemasok 7.675 26.515 4.500 - - - Security deposit from vendor
Jumlah Liabilitas Jangka Pendek 39.057 35.811 30.042 9.427 7.077 1.622 Total Current Liabilities
LIABILITAS JANGKA PANJANG NON-CURRENT LIABILITIES
Pinjaman jangka panjang - - - - 898 9.096 Long term loan
Utang bank 40.000 40.000 40.000 40.000 - - Bank loan
Obligasi konversi - - 4.400 4.400 - - Convertible bonds
Liabilitas imbalan kerja karyawan 291 479 508 622 530 362 Post-employment benefit obligation
Liabilitas pajak tangguhan 12 2 49 - - - Deferred tax liabilities
Jumlah Liabilitas Jangka Panjang 40.302 40.481 44.957 45.022 1.428 9.458 Total Non-Current Liabilities
JUMLAH LIABILITAS 79.360 76.292 74.998 54.449 8.505 11.080 TOTAL LIABILITIES
EKUITAS EQUITY
Modal saham 109 109 109 109 109 109 Capital stock
Selisih perbedaan nilai tukar pada modal Foreign exchange difference in capital
saham 1 1 1 1 1 1 stock
Obligasi wajib konversi 6.481 6.481 6.481 6.481 42.608 33.492 Mandatory convertible bonds
Komponen ekuitas lainnya - - 100 100 86 373 Other contributed capital
Tambahan modal disetor 45 45 45 45 45 - Additional paid in capital
Akumulasi laba aktuaria 157 103 263 98 - - Accumulated actuarial gain
Saldo defisit (4.939) (4.951) (5.057) (4.655) (4.039) (3.533) Accumulated deficits
JUMLAH EKUITAS 1.854 1.788 1.942 2.179 38.810 30.442 TOTAL EQUITY
JUMLAH LIABILITAS DAN EKUITAS 81.214 78.080 76.940 56.629 47.315 41.522 TOTAL LIABILITIES AND EQUITY
31/03/12Keterangan 31/12/16 31/03/16 31/03/15 31/03/14 31/03/13 Descriptions

This report is originally issued in Bahasa Indonesia
60
Pada tanggal 31 Maret 2016, jumlah aset DSU mengalami kenaikan sebesar USD 1,14 juta atau setara dengan 1,48% dibandingkan dengan jumlah aset pada tanggal 31 Maret 2015. Kenaikan ini terutama disebabkan oleh kenaikan biaya eksplorasi dan pengembangan ditangguhkan, aset tetap dan uang muka masing-masing sebesar USD 7,65 juta, USD 0,62 juta dan USD 0,26 juta, yang disertai dengan penurunan kas dan setara kas dan dana yang dibatasi penggunaannya masing-masing sebesar USD 6,09 juta dan USD 1,32 juta.
DSU’s total assets as of 31 March 2016 increased by USD 1.14 million or equivalent to 1.48% compared to total assets as of 31 March 2015. This increase was primarily due to the increase in deferred exploration and development expenditures, fixed assets and advance payments amounting USD 7.65 million, USD 0.62 million and USD 0.26 million, respectively, followed by the decrease in cash and cash equivalents and restricted deposits amounting USD 6.09 million and USD 1.32 million, respectively.
Pada tanggal 31 Maret 2015, jumlah aset DSU mengalami kenaikan sebesar USD 20,31 juta atau setara dengan 35,87% dibandingkan dengan jumlah aset pada tanggal 31 Maret 2014. Kenaikan ini terutama disebabkan oleh kenaikan biaya eksplorasi dan pengembangan ditangguhkan, kas dan setara kas dan aset tetap masing-masing sebesar USD 7,68 juta, USD 6,28 juta dan USD 5,24 juta.
DSU’s total assets as of 31 March 2015 increased by USD 20.31 million or equivalent to 35,87% compared to total assets as of 31 March 2014. This increase was primarily due to the increase in deferred exploration and development expenditures, cash and cash equivalents and fixed assets amounting USD 7.68 million, USD 6.28 million and USD 5.24 million, respectively.
Pada tanggal 31 Maret 2014, jumlah aset DSU mengalami kenaikan sebesar USD 9,31 juta atau setara dengan 19,69% dibandingkan dengan jumlah aset pada tanggal 31 Maret 2013. Kenaikan ini terutama disebabkan oleh kenaikan biaya eksplorasi dan pengembangan ditangguhkan dan dana yang dibatasi penggunaannya masing-masing sebesar USD 7,60 juta dan USD 1,35 juta.
DSU’s total assets as of 31 March 2014 increased by USD 9.31 million or equivalent to 19.69% compared to total assets as of 31 March 2013. This increase was primarily due to the increase in deferred exploration and development expenditures and restricted cash amounting USD 7.60 million and USD 1.35 million, respectively.
Pada tanggal 31 Maret 2013, jumlah aset DSU mengalami kenaikan sebesar USD 5,79 juta atau setara dengan 13,95% dibandingkan dengan jumlah aset pada tanggal 31 Maret 2012. Kenaikan ini terutama disebabkan oleh kenaikan biaya eksplorasi dan pengembangan ditangguhkan sebesar USD 6,03 juta, yang disertai dengan penurunan kas dan setara kas sebesar USD 0,63 juta.
DSU’s total assets as of 31 March 2013 increased by USD 5.79 million or equivalent to 13.95% compared to total assets as of 31 March 2012. This increase was primarily due to the increase in deferred exploration and development expenditures amounting USD 6.03 million, followed by the decrease in cash and cash equivalents amounting USD 0.63 million.

This report is originally issued in Bahasa Indonesia
61
VI.A.3. Liabilitas VI.A.3. Liabilities
Jumlah liabilitas DSU pada tanggal-tanggal 31 Desember 2016, 31 Maret 2016, 2015, 2014, 2013 dan 2012 masing-masing adalah sebesar USD 79,36 juta, USD 76,29 juta, USD 75,00 juta, USD 54,45 juta, USD 8,51 juta dan USD 11,08 juta.
DSU’s total liabilities as of 31 December 2016, 31 March 2016, 2015, 2014, 2013 and 2012 were USD 79.36 million, USD 76.29 million, USD 75.00 million, USD 54.45 million, USD 8.51 million and USD 11.08 million, respectively.
Pada tanggal 31 Desember 2016, jumlah liabilitas DSU mengalami kenaikan sebesar USD 3,07 juta atau setara dengan 4,02% dibandingkan dengan jumlah liabilitas pada tanggal 31 Maret 2016. Kenaikan ini terutama disebabkan oleh kenaikan utang lain-lain dan biaya yang masih harus dibayar masing-masing sebesar USD 28,43 juta dan USD 0,91 juta, yang disertai dengan penurunan uang muka dari pemasok dan uang muka pelanggan masing-masing sebesar USD 18,84 juta dan USD 7,37 juta.
DSU’s total liabilities as of 31 December 2016 increased by USD 3.07 million or equivalent to 4.02% compared to total assets as of 31 March 2016. This increase was primarily due to the increase in other payables and accrued expenses amounting USD 28.43 million and USD 0.91 million, respectively, followed by the decrease in security deposit from vendor and advance from customers amounting USD 18.84 million and USD 7.37 million, respectively.
Pada tanggal 31 Maret 2016, jumlah liabilitas DSU mengalami kenaikan sebesar USD 1,29 juta atau setara dengan 1,72% dibandingkan dengan jumlah liabilitas pada tanggal 31 Maret 2015. Kenaikan ini terutama disebabkan oleh kenaikan uang muka dari pemasok sebesar USD 22,02 juta, yang disertai dengan penurunan utang lain-lain, obligasi konversi dan biaya yang masih harus dibayar masing-masing sebesar USD 15,82 juta, USD 4,40 juta dan USD 0,42 juta.
DSU’s total liabilities as of 31 March 2016 increased by USD 1.29 million or equivalent to 1.72% compared to total assets as of 31 March 2015. This increase was primarily due to the increase in security deposit from vendor amounting USD 22.02 million, followed by the decrease in other payables, convertible bonds and accrued expenses amounting USD 15.82 million, USD 4.40 million and USD 0.42 million, respectively.
Pada tanggal 31 Maret 2015, jumlah liabilitas DSU mengalami kenaikan sebesar USD 20,55 juta atau setara dengan 37,74% dibandingkan dengan jumlah liabilitas pada tanggal 31 Maret 2014. Kenaikan ini terutama disebabkan oleh kenaikan utang lain-lain, uang muka pelanggan dan uang muka dari pemasok masing-masing sebesar USD 10,51 juta, USD 5,14 juta dan USD 4,50 juta.
DSU’s total liabilities as of 31 March 2015 increased by USD 20.55 million or equivalent to 37.74% compared to total assets as of 31 March 2014. This increase was primarily due to the increase in other payables, advance from customers and security deposit from vendor amounting USD 10.51 million, USD 5.14 million and USD 4.50 million, respectively.
Pada tanggal 31 Maret 2014, jumlah liabilitas DSU mengalami kenaikan sebesar USD 45,94 juta atau setara dengan 540,20% dibandingkan dengan jumlah liabilitas pada tanggal 31 Maret 2013. Kenaikan ini terutama disebabkan oleh kenaikan utang bank, utang lain-lain dan obligasi konversi masing-masing sebesar USD 40,00 juta, USD 5,25 juta dan USD 4,40 juta, yang disertai dengan penurunan uang muka pelanggan dan pinjaman jangka panjang masing-masing sebesar USD 3,43 juta dan USD 0,90 juta.
DSU’s total liabilities as of 31 March 2014 increased by USD 45.94 million or equivalent to 540.20% compared to total assets as of 31 March 2013. This increase was primarily due to the increase in bank loan, other payables and convertible bonds amounting USD 40.00 million, USD 5.25 million and USD 4.40 million, respectively, followed by the decrease in advance from customers and long-term loan amounting USD 3.43 million and USD 0.90 million, respectively.

This report is originally issued in Bahasa Indonesia
62
Pada tanggal 31 Maret 2013, jumlah liabilitas DSU mengalami penurunan sebesar USD 2,58 juta atau setara dengan 23,24% dibandingkan dengan jumlah liabilitas pada tanggal 31 Maret 2012. Penurunan ini terutama disebabkan oleh penurunan pinjaman jangka panjang sebesar USD 8,20 juta, yang disertai dengan kenaikan uang muka pelanggan sebesar USD 5,81 juta.
DSU’s total liabilities as of 31 March 2013 decreased by USD 2.58 million or equivalent to 23.24% compared to total assets as of 31 March 2012. This decrease was primarily due to the decrease in long-term loan amounting USD 8.20 million, followed by the increase in advance from customers amounting USD 5.81 million.
VI.A.4. Ekuitas VI.A.4. Equity
Jumlah ekuitas DSU pada tanggal-tanggal 31 Desember 2016, 31 Maret 2016, 2015, 2014, 2013 dan 2012 masing-masing adalah sebesar USD 1,85 juta, USD 1,79 juta, USD 1,94 juta, USD 2,18 juta, USD 38,81 juta dan USD 30,44 juta.
DSU’s total equity as of 31 December 2016, 31 March 2016, 2015, 2014, 2013 and 2012 were USD 1.85 million, USD 1.79 million, USD 1.94 million, USD 2.18 million, USD 38.81 million and USD 30.44 million, respectively.
Pada tanggal 31 Desember 2016, jumlah ekuitas DSU mengalami kenaikan sebesar USD 0,07 juta atau setara dengan 3,71% dibandingkan dengan jumlah ekuitas pada tanggal 31 Maret 2016. Kenaikan ini terutama disebabkan oleh kenaikan akumulasi laba aktuaria sebesar USD 0,05 juta, yang disertai dengan penurunan saldo defisit sebesar USD 0,01 juta.
DSU’s total equity as of 31 December 2016 increased by USD 0.07 million or equivalent to 3.71% compared to total equity as of 31 March 2016. This increase was primarily due to the increase in accumulated actuarial gain amounting USD 0.05 million, followed by the decrease in accumulated deficits amounting USD 0.01 million.
Pada tanggal 31 Maret 2016, jumlah ekuitas DSU mengalami penurunan sebesar USD 0,15 juta atau setara dengan 7,91% dibandingkan dengan jumlah ekuitas pada tanggal 31 Maret 2015. Penurunan ini terutama disebabkan oleh penurunan akumulasi laba aktuaria, saldo defisit dan komponnen ekuitas lainnya masing-masing sebesar USD 0,16 juta, USD 0,11 juta dan USD 0,10 juta.
DSU’s total equity as of 31 March 2016 decreased by USD 0.15 million or equivalent to 7.91% compared to total equity as of 31 March 2015. This decrease was primarily due to the decrease in accumulated actuarial gain, accumulated deficits and other contributed capital amounting USD 0.16 million, USD 0.11 million and USD 0.10 million.
Pada tanggal 31 Maret 2015, jumlah ekuitas DSU mengalami penurunan sebesar USD 0,24 juta atau setara dengan 10,91% dibandingkan dengan jumlah ekuitas pada tanggal 31 Maret 2014. Penurunan ini terutama disebabkan oleh kenaikan saldo defisit dan akumulasi laba aktuaria masing-masing sebesar USD 0,40 juta dan USD 0,17 juta.
DSU’s total equity as of 31 March 2015 decreased by USD 0.24 million or equivalent to 10.91% compared to total equity as of 31 March 2014. This decrease was primarily due to the increase in accumulated deficits and accumulated actuarial gain amounting USD 0.40 million and USD 0.17 million.

This report is originally issued in Bahasa Indonesia
63
Pada tanggal 31 Maret 2014, jumlah ekuitas DSU mengalami penurunan sebesar USD 36,63 juta atau setara dengan 94,38% dibandingkan dengan jumlah ekuitas pada tanggal 31 Maret 2013. Penurunan ini terutama disebabkan oleh penurunan obligasi wajib konversi sebesar USD 36,13 juta, yang disertai dengan kenaikan saldo defisit sebesar USD 0,62 juta.
DSU’s total equity as of 31 March 2014 decreased by USD 36.63 million or equivalent to 94.38% compared to total equity as of 31 March 2013. This decrease was primarily due to the decrease in mandatory convertible bonds amounting USD 36.13 million, followed by the increase in accumulated deficits amounting USD 0.62 million.
Pada tanggal 31 Maret 2013, jumlah ekuitas DSU mengalami kenaikan sebesar USD 8,37 juta atau setara dengan 27,49% dibandingkan dengan jumlah ekuitas pada tanggal 31 Maret 2012. Kenaikan ini terutama disebabkan oleh kenaikan obligasi wajib konversi dan saldo defisit masing-masing sebesar USD 9,12 juta dan USD 0,51 juta, yang disertai dengan penurunan komponen ekuitas lainnya sebesar USD 0,29 juta.
DSU’s total equity as of 31 March 2013 increased by USD 8.37 million or equivalent to 27.49% compared to total equity as of 31 March 2012. This increase was primarily due to the increase in mandatory convertible bonds amounting and accumulated deficits amounting USD 9.12 million and USD 0.51 million, respectively, followed by the decrease in other contributed capital amounting USD 0.29 million.
VI.A.5. Laporan Laba Rugi Komprehensif VI.A.5. Statements of Comprehensive Income
VI.A.6. Pendapatan Usaha VI.A.6. Revenues
Untuk periode sembilan bulan yang berakhir pada tanggal 31 Desember 2016 dan untuk tahun yang berakhir pada tanggal-tanggal 31 Maret 2016, 2015, 2014, 2013 dan 2012, DSU belum membukukan pendapatan.
For nine months period ended 31 December 2016 and for the years ended 31 March 2016, 2015, 2014, 2013 and 2012, DSU not yet posted revenues.
Tabel 16 Table 16
PT Dwikarya Sejati Utama PT Dwikarya Sejati Utama
Laporan Laba Rugi Komprehensif Statements of Comprehensive Income
untuk periode sembilan bulan yang berakhir pada for nine months period ended
tanggal 31 Desember 2016 dan 31 December 2016 and
untuk tahun yang berakhir pada for the years ended
tanggal-tanggal 31 Maret 2012 - 2016 31 March 2012 - 2016
(Dalam ribuan USD) (In thousand USD)
31/12/16 31/03/16 31/03/15 31/03/14 31/03/13 31/03/12
(9 Bulan)/ (1 Tahun)/ (1 Tahun)/ (1 Tahun)/ (1 Tahun)/ (1 Tahun)/
(9 Months) (1 Year) (1 Year) (1 Year) (1 Year) (1 Year)
Pendapatan usaha - - - - - - Revenues
Beban pokok pendapatan - - - - - - Cost of revenues
Laba kotor - - - - - - Gross profit
Beban usaha (215) (311) (384) (536) (519) (522) Operating expense
Rugi usaha (215) (311) (384) (536) (519) (522) Loss from operation
Penghasilan (beban) lain-lain 219 423 (16) (81) 12 (283) Other income (expense)
Laba (rugi) sebelum manfaat (beban)
pajak penghasilan 4 112 (400) (617) (507) (806) Profit (loss) before tax
Manfaat (beban) pajak penghasilan 8 (6) (2) 1 1 23 Tax benefit (expense)
Laba (rugi) bersih tahun berjalan 13 106 (402) (616) (506) (783) Profit (loss) for the period
Pendapatan (beban) komprehensif lainnya 54 (160) 165 - - - Other comprehensice income (expense)
Jumlah laba (rugi) komprehensif tahun Total comprehensive income (loss) for
berjalan 66 (54) (238) (616) (506) (783) the period
DescriptionsKeterangan

This report is originally issued in Bahasa Indonesia
64
VI.A.7. Laba (Rugi) Bersih Tahun Berjalan VI.A.7. Profit (Loss) for The Period
Laba bersih tahun berjalan DSU untuk periode sembilan bulan yang berakhir pada tanggal 31 Desember 2016 dan untuk tahun yang berakhir pada tanggal 31 Maret 2016 masing-masing adalah sebesar USD 0,01 juta dan USD 0,11 juta. Rugi Bersih tahun berjalan DSU untuk tahun yang berakhir pada tanggal-tanggal 31 Maret 2015, 2014, 2013 dan 2012 masing-masing adalah sebesar USD 0,40 juta, USD 0,62 juta, USD 0,51 juta, USD 0,78 juta.
DSU’s profit for the period for nine months period ended 31 December 2016 and for the years ended 31 March 2016 were USD 0,01 million and USD 0,11 million, respectively. DSU’s loss for the period for the years ended 31 March 2015, 2014, 2013 and 2012 were USD 0.40 million, USD 0.62 million, USD 0.51 million and USD 0.78 million, respectively.
Laba bersih tahun berjalan DSU untuk tahun yang berakhir pada tanggal 31 Maret 2016 mengalami kenaikan sebesar USD 0,51 juta atau setara dengan 126,32% dibandingkan dengan rugi bersih tahun berjalan untuk tahun yang berakhir pada tanggal 31 Maret 2015.
DSU’s profit for the period for the year ended 31 March 2016 increased by USD 0.51 million or equivalent to 126.32% compared to loss for the period for the year ended 31 March 2015.
Rugi bersih tahun berjalan DSU untuk tahun yang berakhir pada tanggal 31 Maret 2015 mengalami penurunan sebesar USD 0,21 juta atau setara dengan 34,72% dibandingkan dengan rugi bersih tahun berjalan untuk tahun yang berakhir pada tanggal 31 Maret 2014.
DSU’s loss for the period for the year ended 31 March 2015 decreased by USD 0.21 million or equivalent to 34.72% compared to loss for the period for the year ended 31 March 2014.
Rugi bersih tahun berjalan DSU untuk tahun yang berakhir pada tanggal 31 Maret 2014 mengalami kenaikan sebesar USD 0,11 juta atau setara dengan 21,75% dibandingkan dengan rugi bersih tahun berjalan untuk tahun yang berakhir pada tanggal 31 Maret 2013.
DSU’s loss for the period for the year ended 31 March 2014 increased by USD 0.11 million or equivalent to 21.75% compared to loss for the period for the year ended 31 March 2013.
Rugi bersih tahun berjalan DSU untuk tahun yang berakhir pada tanggal 31 Maret 2013 mengalami penurunan sebesar USD 0,28 juta atau setara dengan 35,32% dibandingkan dengan rugi bersih tahun berjalan untuk tahun yang berakhir pada tanggal 31 Maret 2012.
DSU’s loss for the period for the year ended 31 March 2013 decreased by USD 0.28 million or equivalent to 35.32% compared to loss for the period for the year ended 31 March 2012.

This report is originally issued in Bahasa Indonesia
65
VI.A.8. Laporan Arus Kas VI.A.8. Statements of Cash Flows
Tabel 17 Table 17
PT Dwikarya Sejati Utama PT Dwikarya Sejati Utama
Laporan Arus Kas Statements of Cash Flows
untuk periode sembilan bulan yang berakhir pada for nine months period ended
tanggal 31 Desember 2016 dan 31 December 2016 and
untuk tahun yang berakhir pada for the years ended
tanggal-tanggal 31 Maret 2012 - 2016 31 March 2012 - 2016
(Dalam ribuan USD) (In thousand USD)
31/12/16 31/03/16 31/03/15 31/03/14 31/03/13 31/03/12
(9 Bulan)/ (1 Tahun)/ (1 Tahun)/ (1 Tahun)/ (1 Tahun)/ (1 Tahun)/
(9 Months) (1 Year) (1 Year) (1 Year) (1 Year) (1 Year)
CASH FLOWS FROM OPERATING
ARUS KAS DARI AKTIVITAS OPERASI ACTIVITIES
Laba (rugi) sebelum pajak panghasilan 4 112 (400) (617) (507) (806) Profit (loss) before income tax
Penyesuaian untuk rekonsiliasi laba Adjustments to reconcile profit (loss)
(kerugian) sebelum pajak penghasilan before income tax to net cash
dalam arus kas dari aktivitas operasi: provided by operating activities:
Biaya imbalan kerja karyawan 45 113 237 161 171 280 Post employment benefit
Laba atas selisih kurs yang belum
terealisasi pada beban imbalan Unrealized foreign exchange gain
kerja karyawan (25) (31) (78) - - - from post employment benefit
Biaya depresiasi aset tetap 126 170 236 371 368 330 Depreciation of fixed assets
Rugi atas penjualan aset 65 12 0 - - - Loss on sale of fixed assets
Amortisasi goodwill - - - - - 109 Amortization of goodwill
Pencadangan atas penurunan nilai - - - - - 1 Allowance for impairment losses
Arus kas operasi sebelum perubahan Operating cash flow before work ing
modal kerja 215 375 (5) (85) 33 (86) capital changes
Penurunan (kenaikan) pada uang muka 386 (262) (401) (274) 33 68 Decrease (increase) in advance payment
Penurunan (kenaikan) pada biaya
dibayar di muka 47 3 (6) 2 58 (43) Decrease (increase) in prepayments
Kenaikan pada pajak dibayar di muka - - (0) (0) (0) - Increase in prepaid taxes
Penurunan (kenaikan) pada piutang
lain-lain 2 - 4 21 (17) 64 Decrease (increase) in other receivables
Penurunan (kenaikan) pada persediaan 426 (21) (405) - - - Decrease (increase) in inventories
Penurunan (kenaikan) pada jaminan Decrease (increase) in refundable
deposit (3) (1) (2) (3) (57) (3) deposits
Penurunan (kenaikan) pada dana yang Decrease (increase) in restricted
dibatasi penggunaannya (26) 1.321 (310) (1.353) (2) - deposits
Kenaikan (penurunan) pada uang muka Increase (decrease) in advence from
pelanggan (7.372) (144) 5.144 (3.425) 5.810 - customers
Kenaikan (penurunan) pada utang Increase (decrease) in other
lain-lain 28.426 (15.817) 10.507 5.247 125 (19) payables
Kenaikan (penurunan) pada jaminan Increase (decrease) in security deposit
dari pemasok (18.840) 22.015 4.500 - - - from vendor
Kenaikan (penurunan) pada biaya - Increase (decrease) in accrued
yang masih harus dibayar 909 (419) 456 508 (464) 644 expenses
Kenaikan (penurunan) pada utang pajak 123 134 7 21 (17) (12) Increase (decrease) in taxes payable
Pembayaran imbalan kerja karyawan (137) (324) (54) (79) (4) - Post employment benefit payment
Kas Bersih Diperoleh dari Aktivitas Net Cash Provided by Operating
Operasi 4.157 6.862 19.435 578 5.499 614 Activities
ARUS KAS DARI AKTIVITAS CASH FLOWS FROM INVESTING
INVESTASI ACTIVITIES
Penambahan beban eksplorasi dan Deferred exploration and development
pengembangan ditangguhkan (4.299) (7.652) (7.680) (7.459) (6.030) (11.561) expenditures
Penambahan aset tetap (44) (819) (5.478) (569) (776) (3.545) Payments to acquire fixed assets
Penjualan aset tetap 1 16 4 - - - Proceed on sale of fixed assets
Kas Bersih Digunakan untuk Aktivitas Net Cash Used in Investing
Operasi (4.342) (8.455) (13.154) (8.027) (6.806) (15.107) Activities
ARUS KAS DARI AKTIVITAS CASH FLOWS FROM FINANCING
PENDANAAN ACTIVITIES
Pinjaman jangka panjang - - - (898) (8.197) (186) Long-term loan
Komponen ekuitas lainnya - - - 14 (288) - Other contributed capital
Obligasi wajib konversi - (4.500) - (31.727) 9.116 14.835 Mandatory convertible bond
Utang bank - - - 40.000 - - Bank loan
Difference in value from restructuring
Selisih atas nilai restrukturisasi transaction of entities under common
transaksi entitas sepengendali - - - - 45 - control
Kas Bersih Diperoleh dari (Digunakan Net Cash Provided by
untuk) Aktivitas Pendanaan - (4.500) - 7.389 676 14.649 (Used in) Financing Activities
KENAIKAN (PENURUNAN) BERSIH NET INCREASE (DECREASE) IN
KAS DAN SETARA KAS (185) (6.093) 6.281 (60) (631) 157 CASH AND CASH EQUIVALENTS
KAS DAN SETARA KAS PADA AWAL CASH AND CASH EQUIVALENT AT
TAHUN 266 6.359 78 138 769 612 BEGINNING OF YEAR
KAS DAN SETARA KAS PADA AKHIR CASH AND CASH EQUIVALENT AT
TAHUN 81 266 6.359 78 138 769 END OF YEAR
Keterangan Descriptions

This report is originally issued in Bahasa Indonesia
66
Arus Kas Dari Aktivitas Operasi Cash Flows From Operating Activities
Arus kas bersih yang diperoleh dari aktivitas operasi DSU untuk periode sembilan bulan yang berakhir pada tanggal 31 Desember 2016 dan untuk tahun yang berakhir pada tanggal-tanggal 31 Maret 2016, 2015, 2014, 2013 dan 2012 masing-masing adalah sebesar USD 4,16 juta, USD 6,86 juta, USD 19,44 juta, USD 0,58 juta, USD 5,50 juta dan USD 0,61 juta.
Net cash flows provided by operating activities of DSU for nine months period ended 31 December 2016 and for the years ended 31 March 2016, 2015, 2014, 2013 and 2012 were USD 4.16 million, USD 6.86 million, USD 19.44 million, USD 0.58 million, USD 5.50 million and USD 0.61 million, respectively.
Arus kas bersih yang diperoleh dari aktivitas operasi DSU untuk periode sembilan bulan yang berakhir pada tanggal 31 Desember 2016 sebesar USD 4,16 juta terutama berasal dari kenaikan pada utang lain-lain, kenaikan pada biaya yang masih harus dibayar dan penurunan pada persediaan masing-masing sebesar USD 28,43 juta, USD 0,91 juta dan USD 0,43 juta disertai dengan penurunan pada jaminan dari pemasok dan penurunan pada uang muka pelanggan masing-masing sebesar USD 18,84 juta dan USD 7,37 juta.
Net cash flows provided by operating activities for nine months period ended 31 December 2016 amounting USD 4.16 million was generated primarily from increase in other payables, increase in accrued expenses and decrease in inventories amounting USD 28.43 million, USD 0.91 million and USD 0.43 million, respectively, followed by decrease in security deposit from vendor and decrease in advance from customers amounting USD 18.81 million and USD 7.37 million, respectively.
Arus kas bersih yang diperoleh dari aktivitas operasi DSU untuk tahun yang berakhir pada tanggal 31 Maret 2016 sebesar USD 6,86 juta terutama berasal dari kenaikan pada jaminan dari pemasok sebesar USD 22,02 juta disertai dengan penurunan pada utang lain-lain sebesar USD 15,82 juta.
Net cash flows provided by operating activities for the year ended 31 March 2016 amounting USD 6.86 million was generated primarily from increase in security deposit from vendor amounting USD 22.02 million followed by decrease in other payables amounting USD 15.82 million.
Arus kas bersih yang diperoleh dari aktivitas operasi DSU untuk tahun yang berakhir pada tanggal 31 Maret 2015 sebesar USD 19,44 juta terutama berasal dari kenaikan pada utang lain-lain, kenaikan pada uang muka pelanggan dan kenaikan pada jaminan dari pemasok masing-masing sebesar USD 10,51 juta, USD 5,14 juta dan USD 4,50 juta disertai dengan kenaikan pada persediaan dan kenaikan pada biaya dibayar di muka masing-masing sebesar USD 0,41 juta dan USD 0,40 juta.
Net cash flows provided by operating activities for the year ended 31 March 2015 amounting USD 19.44 million was generated primarily from increase in other payables, increase in advance from customers and increase in security deposit from vendor amounting USD 10.51 million, USD 5.14 million and USD 4.50 million followed by increase in inventories and increase in prepayments amounting USD 0.41 million and USD 0.40 million, respectively.
Arus kas bersih yang diperoleh dari aktivitas operasi DSU untuk tahun yang berakhir pada tanggal 31 Maret 2014 sebesar USD 0,58 juta terutama berasal dari kenaikan pada utang lain-lain sebesar USD 5,25 juta disertai dengan penurunan pada utang lain-lain dan penurunan pada uang muka pelannggan masing-masing sebesar USD 3,43 juta dan USD 1,35 juta.
Net cash flows provided by operating activities for the year ended 31 March 2014 amounting USD 0.58 million was generated primarily from increase in other payables amounting USD 5.25 million followed by decrease in other payables and decrease in advance from customers amounting USD 3.43 million and USD 1.35 million, respectively.
This report is originally issued in Bahasa Indonesia
67
Arus kas bersih yang diperoleh dari aktivitas operasi DSU untuk tahun yang berakhir pada tanggal 31 Maret 2013 sebesar USD 5,50 juta terutama berasal dari kenaikan pada uang muka pelanggan sebesar USD 5,81 juta disertai dengan penurunan pada biaya yang masih harus dibayar sebesar USD 0,46 juta.
Net cash flows provided by operating activities for the year ended 31 March 2013 amounting USD 5.50 million was generated primarily from increase in advance from customers amounting USD 5.81 million followed by decrease in accrued expenses in USD 0.46 million.
Arus kas bersih yang diperoleh dari aktivitas operasi DSU untuk tahun yang berakhir pada tanggal 31 Maret 2012 sebesar USD 0,61 juta terutama berasal dari kenaikan pada biaya yang masih harus dibayar, biaya depresiasi aset tetap dan biaya imbala kerja karyawan masing-masing sebesar USD 0,64 juta, USD 0,33 juta dan USD 0,28 juta disertai dengan rugi sebelum pajak penghasilan sebesar USD 0,81 juta.
Net cash flows provided by operating activities for the year ended 31 March 2012 amounting USD 0.61 million was generated primarily from increase in accrued expenses, depreciation of fixed assets and post employment benefit amounting USD 0.64 million, USD 0.33 million and USD 0.28 million, followed by loss before income tax amounting USD 0.81 million.
Arus Kas Dari Aktivitas Investasi Cash Flows From Investing Activities
Arus kas bersih yang digunakan untuk aktivitas investasi DSU untuk periode sembilan bulan yang berakhir pada tanggal 31 Desember 2016 dan untuk tahun yang berakhir pada tanggal-tanggal 31 Maret 2016, 2015, 2014, 2013 dan 2012 masing-masing adalah sebesar USD 4,34 juta, USD 8,46 juta, USD 13,15 juta, USD 8,03 juta, USD 6,81 juta dan USD 15,11 juta.
Net cash flows used in investing activities of DSU for nine months period ended 31 December 2016 and for the years ended 31 March 2016, 2015, 2014, 2013 and 2012 were USD 4.34 million, USD 8.46 million, USD 13.15 million, USD 8.03 million, USD 6.81 million and USD 15.11 million.
Arus kas bersih yang digunakan untuk aktivitas investasi DSU untuk periode sembilan bulan yang berakhir pada tanggal 31 Desember 2016 sebesar USD 4,34 juta terutama berasal dari penambahan beban eksplorasi dan pengembangan ditangguhkan dan penambahan aset tetap masing-masing sebesar USD 4,30 juta dan USD 0,04 juta.
Net cash flows used in investing activities for nine months period ended 31 December 2016 amounting USD 4.34 million was generated primarily from deferred exploration and development expenditures and payments to acquire fixed assets amounting USD 4.30 million and USD 0.04 million, respectively.
Arus kas bersih yang digunakan untuk aktivitas investasi DSU untuk tahun yang berakhir pada tanggal 31 Maret 2016 sebesar USD 8,46 juta terutama berasal dari penambahan beban eksplorasi dan pengembangan ditangguhkan dan penambahan aset tetap masing-masing sebesar USD 7,65 juta dan USD 0,82 juta disertai dengan penjualan aset tetap sebesar USD 0,02 juta.
Net cash flows used in investing activities for the year ended 31 March 2016 amounting USD 8.46 million was generated primarily from deferred exploration and development expenditures and payments to acquire fixed assets amounting USD 7.65 million and USD 0.82 million, respectively, followed by proceed on sale of fixed assets amounting USD 0.02 million.

This report is originally issued in Bahasa Indonesia
68
Arus kas bersih yang digunakan untuk aktivitas investasi DSU untuk tahun yang berakhir pada tanggal 31 Maret 2015 sebesar USD 13,15 juta terutama berasal dari penambahan beban eksplorasi dan pengembangan ditangguhkan dan penambahan aset tetap masing-masing sebesar USD 7,68 juta dan USD 5,48 juta.
Net cash flows used in investing activities for the year ended 31 March 2015 amounting USD 13.15 million was generated primarily from deferred exploration and development expenditures and payments to acquire fixed assets amounting USD 7.68 million and USD 5.48 million, respectively.
Arus kas bersih yang digunakan untuk aktivitas investasi DSU untuk tahun yang berakhir pada tanggal 31 Maret 2014 sebesar USD 8,03 juta terutama berasal dari penambahan beban eksplorasi dan pengembangan ditangguhkan dan penambahan aset tetap masing-masing sebesar USD 7,46 juta dan USD 0,57 juta.
Net cash flows used in investing activities for the year ended 31 March 2014 amounting USD 8.03 million was generated primarily from deferred exploration and development expenditures and payments to acquire fixed assets amounting USD 7.46 million and USD 0.57 million, respectively.
Arus kas bersih yang digunakan untuk aktivitas investasi DSU untuk tahun yang berakhir pada tanggal 31 Maret 2013 sebesar USD 6,81 juta terutama berasal dari penambahan beban eksplorasi dan pengembangan ditangguhkan dan penambahan aset tetap masing-masing sebesar USD 6,03 juta dan USD 0,78 juta.
Net cash flows used in investing activities for the year ended 31 March 2013 amounting USD 6.81 million was generated primarily from deferred exploration and development expenditures and payments to acquire fixed assets amounting USD 6.03 million and USD 0.78 million, respectively.
Arus kas bersih yang digunakan untuk aktivitas investasi DSU untuk tahun yang berakhir pada tanggal 31 Maret 2012 sebesar USD 15,11 juta terutama berasal dari penambahan beban eksplorasi dan pengembangan ditangguhkan dan penambahan aset tetap masing-masing sebesar USD 11,56 juta dan USD 3,55 juta.
Net cash flows used in investing activities for the year ended 31 March 2012 amounting USD 15.11 million was generated primarily from deferred exploration and development expenditures and payments to acquire fixed assets amounting USD 11.56 million and USD 3.55 million, respectively.
Arus Kas Dari Aktivitas Pendanaan Cash Flows From Financing Activities
Arus kas bersih yang digunakan untuk aktivitas pendanaan DSU untuk tahun yang berakhir pada tanggal 31 Maret 2016 adalah sebesar USD 4,50 juta. Arus kas bersih DSU yang diperoleh dari aktivitas pendanaan DSU untuk tahun yang berakhir pada tanggal-tanggal 31 Maret 2014, 2013 dan 2012 masing-masing adalah sebesar USD 7,39 juta, USD 0,68 juta dan USD 14,65 juta.
Net cash flows used in financing activities of DSU for the year ended 31 March 2016 amounting USD 4.50 million. Net cash flows provided by financing activities of DSU for the years ended 31 March 2014, 2013 and 2012 amounting USD 7.39 million, USD 0.68 million and USD 14.65 million, respectively.
Arus kas bersih yang digunakan untuk aktivitas pendanaan DSU untuk tahun yang berakhir pada tanggal 31 Maret 2016 sebesar USD 4,50 juta terutama berasal dari obligasi wajib konversi sebesar USD 4,50 juta.
Net cash flows used in financing activities for the year ended 31 March 2016 amounting USD 4.50 million was generated primarily from mandatory convertible bonds amounting USD 4.50 million.
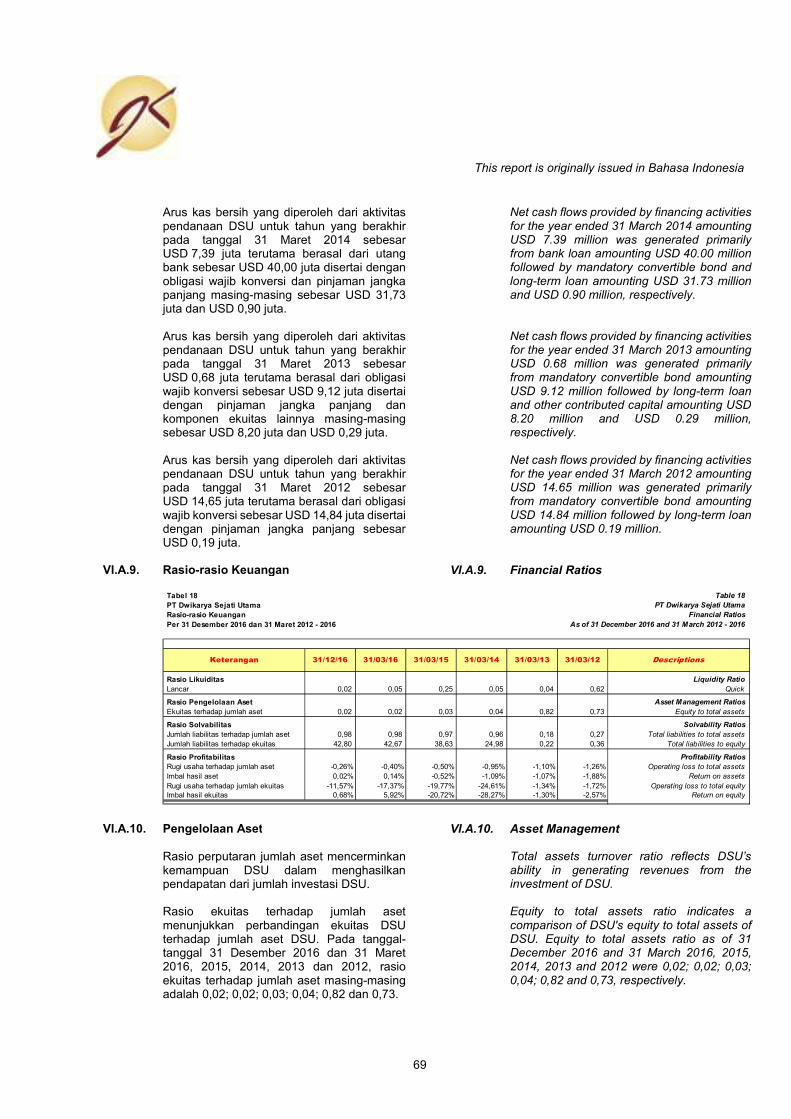
This report is originally issued in Bahasa Indonesia
69
Arus kas bersih yang diperoleh dari aktivitas pendanaan DSU untuk tahun yang berakhir pada tanggal 31 Maret 2014 sebesar USD 7,39 juta terutama berasal dari utang bank sebesar USD 40,00 juta disertai dengan obligasi wajib konversi dan pinjaman jangka panjang masing-masing sebesar USD 31,73 juta dan USD 0,90 juta.
Net cash flows provided by financing activities for the year ended 31 March 2014 amounting USD 7.39 million was generated primarily from bank loan amounting USD 40.00 million followed by mandatory convertible bond and long-term loan amounting USD 31.73 million and USD 0.90 million, respectively.
Arus kas bersih yang diperoleh dari aktivitas pendanaan DSU untuk tahun yang berakhir pada tanggal 31 Maret 2013 sebesar USD 0,68 juta terutama berasal dari obligasi wajib konversi sebesar USD 9,12 juta disertai dengan pinjaman jangka panjang dan komponen ekuitas lainnya masing-masing sebesar USD 8,20 juta dan USD 0,29 juta.
Net cash flows provided by financing activities for the year ended 31 March 2013 amounting USD 0.68 million was generated primarily from mandatory convertible bond amounting USD 9.12 million followed by long-term loan and other contributed capital amounting USD 8.20 million and USD 0.29 million, respectively.
Arus kas bersih yang diperoleh dari aktivitas pendanaan DSU untuk tahun yang berakhir pada tanggal 31 Maret 2012 sebesar USD 14,65 juta terutama berasal dari obligasi wajib konversi sebesar USD 14,84 juta disertai dengan pinjaman jangka panjang sebesar USD 0,19 juta.
Net cash flows provided by financing activities for the year ended 31 March 2012 amounting USD 14.65 million was generated primarily from mandatory convertible bond amounting USD 14.84 million followed by long-term loan amounting USD 0.19 million.
VI.A.9. Rasio-rasio Keuangan VI.A.9. Financial Ratios
VI.A.10. Pengelolaan Aset VI.A.10. Asset Management
Rasio perputaran jumlah aset mencerminkan kemampuan DSU dalam menghasilkan pendapatan dari jumlah investasi DSU.
Total assets turnover ratio reflects DSU’s ability in generating revenues from the investment of DSU.
Rasio ekuitas terhadap jumlah aset menunjukkan perbandingan ekuitas DSU terhadap jumlah aset DSU. Pada tanggal-tanggal 31 Desember 2016 dan 31 Maret 2016, 2015, 2014, 2013 dan 2012, rasio ekuitas terhadap jumlah aset masing-masing adalah 0,02; 0,02; 0,03; 0,04; 0,82 dan 0,73.
Equity to total assets ratio indicates a comparison of DSU's equity to total assets of DSU. Equity to total assets ratio as of 31 December 2016 and 31 March 2016, 2015, 2014, 2013 and 2012 were 0,02; 0,02; 0,03; 0,04; 0,82 and 0,73, respectively.
Tabel 18 Table 18
PT Dwikarya Sejati Utama PT Dwikarya Sejati Utama
Rasio-rasio Keuangan Financial Ratios
Per 31 Desember 2016 dan 31 Maret 2012 - 2016 As of 31 December 2016 and 31 March 2012 - 2016
Rasio Likuiditas Liquidity Ratio
Lancar 0,02 0,05 0,25 0,05 0,04 0,62 Quick
Rasio Pengelolaan Aset Asset Management Ratios
Ekuitas terhadap jumlah aset 0,02 0,02 0,03 0,04 0,82 0,73 Equity to total assets
Rasio Solvabilitas Solvability Ratios
Jumlah liabilitas terhadap jumlah aset 0,98 0,98 0,97 0,96 0,18 0,27 Total liabilities to total assets
Jumlah liabilitas terhadap ekuitas 42,80 42,67 38,63 24,98 0,22 0,36 Total liabilities to equity
Rasio Profitabilitas Profitability Ratios
Rugi usaha terhadap jumlah aset -0,26% -0,40% -0,50% -0,95% -1,10% -1,26% Operating loss to total assets
Imbal hasil aset 0,02% 0,14% -0,52% -1,09% -1,07% -1,88% Return on assets
Rugi usaha terhadap jumlah ekuitas -11,57% -17,37% -19,77% -24,61% -1,34% -1,72% Operating loss to total equity
Imbal hasil ekuitas 0,68% 5,92% -20,72% -28,27% -1,30% -2,57% Return on equity
Descriptions31/03/12Keterangan 31/12/16 31/03/16 31/03/15 31/03/14 31/03/13

This report is originally issued in Bahasa Indonesia
70
VI.A.11. Solvabilitas VI.A.11. Solvability
Solvabilitas menunjukkan kemampuan DSU untuk memenuhi seluruh liabilitasnya, yang diukur dengan menggunakan dua pendekatan, yaitu melalui perbandingan antara jumlah liabilitas dan jumlah aset dan melalui perbandingan antara jumlah liabilitas dengan ekuitas.
Solvability indicates DSU’s ability to meet all its liabilities, measured using two approaches, a comparison between total liabilities and total assets and a comparison between total liabilities and equity.
Pada tanggal-tanggal 31 Desember 2016, 31 Maret 2016, 2015, 2014, 2013 dan 2012, rasio jumlah liabilitas terhadap jumlah aset masing-masing adalah 0,98; 0,98; 0,97; 0,96; 0,18 dan 0,27, sedangkan rasio jumlah liabilitas terhadap ekuitas masing-masing adalah 42,80; 42,67; 38,63; 24,98; 0,22 dan 0,36.
Total liabilities to total assets ratio as of 31 December 2016, 31 March 2016, 2015, 2014, 2013 and 2012 were 0,98; 0,98; 0,97; 0,96; 0,18 and 0,27, respectively, while total liabilities to equity ratio were 42,80; 42,67; 38,63; 24,98; 0,22 and 0,36.
VI.A.12. Profitabilitas VI.A.12. Profitability
Tingkat imbal hasil aset menunjukkan kemampuan DSU dalam menghasilkan laba bersih dari aset yang dimilikinya. Imbal hasil aset DSU untuk periode sembilan bulan yang berakhir pada tanggal 31 Desember 2016 dan untuk tahun yang berakhir pada tanggal 31 Maret 2016 masing-masing adalah sebesar 0,02% dan 0,14%.
Return on assets indicates DSU’s ability in generating net income from its assets. Return on assets for nine months period ended 31 December 2016 and for the year ended 31 March 2016 were 0.02% and 0.14%, respectively.
Tingkat imbal hasil ekuitas menunjukkan kemampuan DSU dalam menghasilkan laba bersih dari ekuitas yang ditanamkan. Imbal hasil ekuitas untuk periode sembilan bulan yang berakhir pada tanggal 31 Desember 2016 dan untuk tahun yang berakhir pada tanggal 31 Maret 2016 masing-masing adalah sebesar 0,68% dan 5,92%.
Return on equity indicates DSU's ability in generating net income from the equity invested. Return on equity for nine months period ended 31 December 2016 and for the year ended 31 March 2016 were 0.68% and 5.92%, respectively.

This report is originally issued in Bahasa Indonesia
71
VI.B. Analisa atas Common Size PT Dwikarya
Sejati Utama VI.B. Common Size Analysis of PT Dwikarya
Sejati Utama
Berikut adalah analisa common size DSU untuk periode sembilan bulan yang berakhir pada tanggal 31 Desember 2016 dan utnuk tahun yang berakhir pada tanggal-tanggal 31 Maret 2016, 2015, 2014, 2013 dan 2012.
Below is common size analysis of DSU for nine months period ended 31 December 2016 and for the years ended 31 March 2016, 2015, 2014, 2013 and 2012.
Ikhtisar common size DSU adalah sebagai berikut:
The summary of common size of DSU are as follows:
Tabel 19 Table 19
PT Dwikarya Sejati Utama PT Dwikarya Sejati Utama
Analisa Common Size Common Size Analysis of
Laporan Posisi Keuangan Statements of Financial Position
Per 31 Desember 2016 dan 31 Maret 2012 - 2016 As of 31 December 2016 and 31 March 2012 - 2016
A S E T A S S E T S-
ASET LANCAR CURRENT ASSETS
Kas dan setara kas 0,10% 0,34% 8,27% 0,14% 0,29% 1,85% Cash and cash equivalents
Persediaan 0,00% 0,55% 0,53% 0,00% 0,00% 0,00% Inventories
Uang muka 0,79% 1,32% 1,00% 0,65% 0,20% 0,31% Advance payments
Biaya dibayar di muka 0,01% 0,07% 0,07% 0,09% 0,11% 0,26% Prepayments
Pajak dibayar di muka 0,00% 0,00% 0,00% 0,00% 0,00% 0,00% Prepaid taxes
Piutang lain-lain 0,00% 0,00% 0,00% 0,01% 0,05% 0,02% Other receivables-
Jumlah Aset Lancar 0,90% 2,28% 9,86% 0,88% 0,65% 2,44% Total Current Assets-
ASET TIDAK LANCAR NON-CURRENT ASSETS
Aset tetap 16,50% 17,35% 16,80% 13,58% 15,84% 17,06% Fixed assets
Deposit jaminan 0,02% 0,02% 0,02% 0,02% 0,02% 0,01% Refundable deposits
Dana yang dibatasi penggunaannya 0,52% 0,51% 2,23% 2,49% 0,12% 0,00% Restricted deposits
Aset pajak tangguhan 0,00% 0,00% 0,00% 0,01% 0,08% 0,09% Deferred tax assets
Biaya eksplorasi dan pengembangan Deferred exploration and development
ditangguhkan 82,05% 79,84% 71,08% 83,01% 83,29% 80,39% expenditures-
Jumlah Aset Tidak Lancar 99,10% 97,72% 90,14% 99,12% 99,35% 97,56% Total Non-Current Assets-
JUMLAH ASET 100,00% 100,00% 100,00% 100,00% 100,00% 100,00% TOTAL ASSETS
31/03/1331/12/16 31/03/15 31/03/14 31/03/1231/03/16 DescriptionsKeterangan
LIABILITAS DAN EKUITAS LIABILITIES AND EQUITY-
LIABILITAS LIABILITIES-
LIABILITAS JANGKA PENDEK CURRENT LIABILITIES
Biaya yang masih harus dibayar 3,03% 1,99% 2,57% 2,68% 2,14% 3,55% Accrued expenses
Utang pajak 0,38% 0,24% 0,07% 0,08% 0,06% 0,10% Taxes payable
Utang lain-lain 35,21% 0,21% 20,77% 9,67% 0,48% 0,25% Other payables
Uang muka pelanggan 0,02% 9,46% 9,79% 4,21% 12,28% 0,00% Advance from customers
Uang muka dari pemasok 9,45% 33,96% 5,85% 0,00% 0,00% 0,00% Security deposit from vendor
Jumlah Liabilitas Jangka Pendek 48,09% 45,86% 39,05% 16,65% 14,96% 3,91% Total Current Liabilities
LIABILITAS JANGKA PANJANG NON-CURRENT LIABILITIES
Pinjaman jangka panjang 0,00% 0,00% 0,00% 0,00% 1,90% 21,91% Long term loan
Utang bank 49,25% 51,23% 51,99% 70,64% 0,00% 0,00% Bank loan
Obligasi konversi 0,00% 0,00% 5,72% 7,77% 0,00% 0,00% Convertible bonds
Liabilitas imbalan kerja karyawan 0,36% 0,61% 0,66% 1,10% 1,12% 0,87% Post-employment benefit obligation
Liabilitas pajak tangguhan 0,01% 0,00% 0,06% 0,00% 0,00% 0,00% Deferred tax liabilities
Jumlah Liabilitas Jangka Panjang 49,62% 51,85% 58,43% 79,50% 3,02% 22,78% Total Non-Current Liabilities-
JUMLAH LIABILITAS 97,72% 97,71% 97,48% 96,15% 17,98% 26,68% TOTAL LIABILITIES-
EKUITAS EQUITY
Modal saham 0,13% 0,14% 0,14% 0,19% 0,23% 0,26% Capital stock
Selisih perbedaan nilai tukar pada modal Foreign exchange difference in capital
saham 0,00% 0,00% 0,00% 0,00% 0,00% 0,00% stock
Obligasi wajib konversi 7,98% 8,30% 8,42% 11,45% 90,05% 80,66% Mandatory convertible bonds
Komponen ekuitas lainnya 0,00% 0,00% 0,13% 0,18% 0,18% 0,90% Other contributed capital
Tambahan modal disetor 0,06% 0,06% 0,06% 0,08% 0,09% 0,00% Additional paid in capital
Akumulasi laba aktuaria 0,19% 0,13% 0,34% 0,17% 0,00% 0,00% Accumulated actuarial gain
Saldo defisit -6,08% -6,34% -6,57% -8,22% -8,54% -8,51% Accumulated deficits-
JUMLAH EKUITAS 2,28% 2,29% 2,52% 3,85% 82,02% 73,32% TOTAL EQUITY-
JUMLAH LIABILITAS DAN EKUITAS 100,00% 100,00% 100,00% 100,00% 100,00% 100,00% TOTAL LIABILITIES AND EQUITY
Keterangan Descriptions31/12/16 31/03/15 31/03/14 31/03/13 31/03/1231/03/16
This report is originally issued in Bahasa Indonesia
72
VI.C. Analisa atas Common Size Industri
Batubara VI.C. Common Size Analysis of Coal Industry
Berikut adalah analisa common size untuk perusahaan sebanding dengan DSU, yaitu PT Adaro Energy Tbk dan entitas anak, PT Baramulti Suksessarana Tbk dan entitas anak dan PT Toba Bara Sejahtra Tbk dan entitas anak untuk tahun yang berakhir pada tanggal-tanggal 31 Desember 2016, 2015, 2014, 2013 dan 2012.
Below are the common size analysis for the comparable companies of DSU, i.e. PT Adaro Energy Tbk and subsidiaries, PT Baramulti Suksessarana Tbk and subsidiaries and PT Toba Bara Sejahtra Tbk and subsidiaries for the years ended 31 December 2016, 2015, 2014, 2013, and 2012.
Ikhtisar common size untuk PT Adaro Energy
Tbk dan entitas anak, PT Baramulti Suksessarana Tbk dan entitas anak dan PT Toba Bara Sejahtra Tbk dan entitas anak adalah sebagai berikut:
The summary of common size for PT Adaro Energy Tbk dan entitas anak, PT Baramulti Suksessarana Tbk dan entitas anak dan PT Toba Bara Sejahtra Tbk and subsidiaries are as follows:

This report is originally issued in Bahasa Indonesia
73
VI.C.1. PT Adaro Energy Tbk dan entitas anak VI.C.1. PT Adaro Energy Tbk and subsidiaries
Tabel 20 Table 20
PT Adaro Energy Tbk dan entitas anak PT Adaro Energy Tbk and subsidiaries
Analisa Common Size Common Size Analysis of
Laporan Posisi Keuangan Statements of Consolidated Financial Position
Per 31 Desember 2012 - 2016 As of 31 December 2012 - 2016
A S E T A S S E T S
ASET LANCAR CURRENT ASSETS
Kas dan setara kas 16,51% 11,79% 11,62% 10,17% 7,52% Cash and cash equivalents
Deposito berjangka yang dibatasi
penggunaannya - bagian lancar 0,00% 0,01% 0,00% 0,01% 0,00% Restricted time deposits - current portion
Piutang usaha 4,61% 3,28% 4,45% 4,62% 7,13% Trade receivables
Persediaan 1,13% 1,22% 1,51% 1,53% 0,97% Inventories
Pajak dibayar dimuka - bagian lancar 1,57% 1,39% 1,25% 2,79% 2,15% Prepaid taxes - current portion
Pajak yang bisa dipulihkan kembali
- bagian lancar 0,16% 0,40% 0,71% 0,16% 1,34% Recoverable taxes
Piutang lain-lain 0,07% 0,04% 0,03% 0,03% 0,17% Other receivables
Pinjaman ke pihak ketiga 0,00% 0,00% 0,00% 0,25% 0,55% Loans to third parties
Pinjaman ke pihak berelasi 0,00% 0,00% 0,00% 0,60% 0,67% Loan to a related party
Instrumen keuangan derivatif 0,06% 0,00% 0,00% 0,02% 0,00% Derivative financial instruments
Uang muka dan biaya dibayar dimuka - Advances and prepayments - current
bagian lancar 0,30% 0,19% 0,24% 0,28% 0,69% portion
Aset lancar lain-lain 0,01% 0,02% 0,01% 0,01% 0,07% Other current assets
Jumlah Aset Lancar 24,42% 18,34% 19,83% 20,47% 21,26% Total Current Assets
ASET TIDAK LANCAR NON-CURRENT ASSETS
Deposito berjangka yang dibatasi Restricted time deposits - non-current
penggunaannya - bagian tidak lancar 0,05% 0,03% 0,02% 0,01% 0,01% portion
Investasi pada entitas asosiasi dan Investment in associates and joint
ventura bersama 0,72% 5,50% 6,17% 6,00% 5,92% ventures
Uang muka dan biaya dibayar dimuka - Advances and prepayments - non-current
bagian tidak lancar 0,57% 0,83% 0,82% 1,02% 1,33% portion
Pinjaman ke pihak ketiga - bagian Loans to third parties - non-current
tidak lancar 0,00% 0,34% 0,00% 0,00% 0,00% portion
Pajak dibayar dimuka - bagian
tidak lancar 0,58% 0,65% 0,74% 0,00% 0,00% Prepaid taxes - non-current portion
Pajak yang bisa dipulihkan kembali -
bagian tidak lancar 0,00% 0,00% 0,00% 0,18% 0,23% Recoverable taxes - non-current portion
Aset eksplorasi dan evaluasi 0,00% 0,00% 0,00% 0,00% 0,01% Exploration and evaluation assets
Properti pertambangan 37,36% 34,02% 32,72% 32,66% 28,99% Mining properties
Aset tetap 23,68% 24,62% 25,20% 25,48% 26,60% Fixed assets
Goodwill 12,17% 15,16% 14,09% 13,74% 15,37% Goodwill
Aset pajak tangguhan 0,06% 0,08% 0,07% 0,13% 0,13% Deferred tax assets
Aset tidak lancar lain-lain 0,40% 0,44% 0,34% 0,30% 0,15% Other on-curret assets
Jumlah Aset Tidak Lancar 75,58% 81,66% 80,17% 79,53% 78,74% Total Non-Current Assets
JUMLAH ASET 100,00% 100,00% 100,00% 100,00% 100,00% TOTAL ASSETS
Keterangan 31/12/16 31/12/15 31/12/14 31/12/13 31/12/12 Descriptions

This report is originally issued in Bahasa Indonesia
74
LIABILITAS DAN EKUITAS LIABILITIES AND EQUITY
LIABILITAS LIABILITIES
LIABILITAS JANGKA PENDEK CURRENT LIABILITIES
Utang usaha 3,19% 3,30% 5,47% 4,88% 5,30% Trade payables
Utang dividen 1,09% 0,59% 0,47% 0,60% 0,53% Dividends payable
Beban yang masih harus dibayar 0,44% 0,48% 0,39% 0,64% 0,53% Accrued expense
Liabilitas imbalan kerja jangka pendek 0,02% 0,03% 0,03% 0,03% 0,00% Short-term employee benefit liabilities
Utang pajak 1,82% 0,22% 0,74% 0,56% 0,61% Taxes payable
Utang royalti 0,64% 0,73% 0,70% 1,75% 1,93% Royalties payable
Bagian lancar atas pinjaman jangka
panjang Current maturity of long-term borrowings
Utang sewa pembiayaan 0,47% 0,49% 0,50% 0,48% 0,48% Finance lease payables
Utang bank 1,88% 1,57% 2,50% 2,32% 4,04% Bank loans
Pinjaman dari pihak ketiga 0,00% 0,00% 0,24% 0,00% 0,00% Loans from a third party
Instrumen keuangan derivatif 0,00% 0,14% 0,96% 0,00% 0,03% Derivative financial instruments
Utang lain-lain 0,32% 0,09% 0,06% 0,29% 0,07% Other liabilities
Jumlah Liabilitas Jangka Pendek 9,88% 7,63% 12,08% 11,55% 13,52% Total Current Liabilities
LIABILITAS JANGKA PANJANG NON-CURRENT LIABILITIES
Pinjaman dari pihak ketiga 0,24% 0,26% 0,00% 0,00% 0,00% Loans from a third party
Pinjaman jangka panjang setelah
dikurangi bagian yang akan jatuh Long-term borrowings, net of current
tempo dalam satu tahun maturities
Utang sewa pembiayaan 0,60% 0,76% 1,16% 0,71% 0,88% Finance lease payables
Utang bank 19,03% 23,22% 25,16% 17,85% 19,52% Bank loans
Senior Notes 0,00% 0,00% 0,00% 11,80% 11,86% Senior notes
Instrumen keuangan derivatif 0,00% 0,00% 0,00% 0,00% 0,01% Derivative financial instruments
Liabilitas pajak tangguhan 10,02% 9,77% 8,98% 9,46% 8,75% Deferred tax liabilities
Utang pihak berelasi non-usaha 0,00% 0,00% 0,00% 0,00% 0,01% Loan to a related party
Liabilitas imbalan pasca kerja 0,76% 0,86% 0,80% 0,56% 0,52% Post-employment benefits liabilities
Provisi rehabilitasi, reklamasi dan Provision for mine rehabilitation,
penutupan tambang 1,43% 1,23% 1,02% 0,60% 0,24% reclamation and closure
Jumlah Liabilitas Jangka Panjang 32,07% 36,10% 37,10% 40,99% 41,79% Total Non-Current Liabilities
JUMLAH LIABILITAS 41,95% 43,73% 49,18% 52,54% 55,31% TOTAL LIABILITIES
EKUITAS EQUITY
Modal saham 5,26% 5,76% 5,35% 5,12% 5,16% Share capital
Tambahan modal disetor 17,70% 19,38% 18,00% 17,24% 17,36% Additional paid-in capital
Selisih transaksi dengan pihak Difference in value from transaction with
non-pengendali 0,11% 0,00% 0,00% 0,00% 0,00% non-controlling interest
Saldo laba 24,95% 23,28% 20,44% 17,92% 15,69% Retained earnings
Peghasilan (rugi) komprehensif lain 0,22% -0,31% -0,63% -0,15% -0,08% Other comprehensive income (loss)
Ekuitas yang dapat diatribusikan kepada Equity attributable to owners of the
pemilik entitas induk 48,24% 48,10% 43,15% 40,13% 38,13% parent entity
Kepentingan non-pengendali 9,80% 8,18% 7,67% 7,32% 6,56% Non-controlling interests
JUMLAH EKUITAS 58,05% 56,27% 50,82% 47,46% 44,69% TOTAL EQUITY
JUMLAH LIABILITAS DAN EKUITAS 100,00% 100,00% 100,00% 100,00% 100,00% TOTAL LIABILITIES AND EQUITY
Keterangan 31/12/16 31/12/15 31/12/14 31/12/13 31/12/12 Descriptions

This report is originally issued in Bahasa Indonesia
75
Tabel 21 Tabel 21
PT Adaro Energy Tbk dan entitas anak PT Adaro Energy Tbk and subsidiaries
Analisa Common Size Common Size Analysis of
Laporan Laba Rugi Komprehensif Konsolidasian Statements of Consolidated Comprehensive Income
untuk tahun yang berakhir pada for the years ended
tanggal-tanggal 31 Desember 2012 - 2016 31 December 2012 - 2016
Pendapatan usaha 100,00% 100,00% 100,00% 100,00% 100,00% Revenue
Beban pokok pendapatan 72,85% 79,76% 78,36% 77,35% 71,99% Cost of revenue
Laba kotor 27,15% 20,24% 21,64% 22,65% 28,01% Gross profit
Beban usaha -5,99% -4,95% -4,91% -5,27% -4,65% Operating expense
Pendapatan (beban) lain-lain 2,12% -2,92% -2,01% -0,97% -0,89% Other income (expense)
Laba usaha 29,27% 17,32% 19,64% 21,68% 27,12% Operating income
Biaya keuangan -1,98% -2,26% -5,71% -3,55% -3,18% Finance costs
Pendapatan keuangan 0,36% 0,44% 0,76% 0,49% 0,30% Finance income
Bagian atas rugi neto entitas asosiasi Share in net loss of associates and joint
dan ventura bersama -0,01% -0,11% -0,11% -0,44% -0,41% ventures
Laba sebelum manfaat (beban)
pajak penghasilan 27,64% 15,38% 14,58% 18,18% 23,82%Profit before income tax benefit (expense)
Manfaat (beban) pajak penghasilan -8,15% -4,80% -4,16% -5,85% -8,88% Income tax benefit (expense)
Laba bersih tahun berjalan 19,49% 10,58% 10,42% 12,33% 14,95% Profit for the year
Pendapatan komprehensif lainnya 1,63% 0,95% -1,05% -0,12% -0,04% Other comprehensive income for the year
Jumlah laba komprehensif tahun berjalan 21,11% 11,53% 9,37% 12,21% 14,90% Total comprehensive income for the year
Laba bersih tahun berjalan yang dapat
diatribusikan kepada: Profit for the year attributable to:
Pemilik entitas induk 19,25% 10,63% 10,26% 12,39% 15,00% Owners of the parent entity
Kepentingan non-pengendali 0,24% -0,05% 0,16% -0,06% -0,05% Non-controlling interests
31/12/13 31/12/12 Descriptions31/12/16 31/12/15 31/12/14Keterangan

This report is originally issued in Bahasa Indonesia
76
VI.C.2. PT Baramulti Suksessarana Tbk dan
entitas anak VI.C.2. PT Baramulti Suksessarana Tbk and
subsidiaries
Tabel 22 Table 22
PT Baramulti Suksessarana Tbk dan entitas anak PT Baramulti Suksessarana Tbk and subsidiaries
Analisa Common Size Common Size Analysis of
Laporan Posisi Keuangan Statements of Consolidated Financial Position
Per 31 Desember 2012 - 2016 As of 31 December 2012 - 2016
A S E T A S S E T S
ASET LANCAR CURRENT ASSETS
Kas 6,60% 8,32% 2,89% 0,52% 22,13% Cash
Piutang usaha Trade receivables
Pihak berelasi 5,28% 4,98% 5,23% 5,38% 18,26% Related parties
Pihak ketiga 13,30% 8,65% 9,04% 2,75% 2,75% Third parties
Piutang lain-lain 0,39% 0,37% 0,28% 1,25% 1,72% Other receivables
Persediaan - bersih 2,85% 3,66% 5,29% 10,64% 11,50% Inventories - net
Uang muka pemasok 0,73% 0,28% 0,07% 0,05% 0,26% Advances
Biaya dibayar di muka 0,31% 0,37% 0,72% 0,21% 0,10% Prepaid expenses
Jumlah Aset Lancar 29,45% 26,64% 23,52% 20,81% 56,72% Total Current Assets
ASET TIDAK LANCAR NON-CURRENT ASSETS
Kas yang dibatasi penggunaannya 1,20% 1,27% 0,74% 0,00% 0,00% Restricted cash
Aset eskplorasi dan evaluasi 0,79% 0,64% 0,55% 3,15% 2,98% Exploration and evaluation assets
Aset pertambangan - bersih 17,57% 18,97% 20,87% 18,47% 16,24% Mine properties - net
Aset tetap - bersih 37,41% 38,21% 37,72% 39,76% 5,50% Fixed assets - net
Goodwill 10,93% 11,56% 12,03% 12,63% 14,43% Goodwill
Aset pajak tangguhan - bersih 0,94% 1,06% 1,77% 1,55% 1,46% Deferred tax assets - net
Tagihan dan keberatan atas hasil Claims for tax refund and tax
pemeriksaan pajak 0,68% 0,43% 1,07% 1,07% 0,18% assessments under appeal
Aset tidak lancar lainnya 1,03% 1,22% 1,74% 2,56% 2,49% Other non-current assets
Jumlah Aset Tidak Lancar 70,55% 73,36% 76,48% 79,19% 43,28% Total Non-Current Assets
JUMLAH ASET 100,00% 100,00% 100,00% 100,00% 100,00% TOTAL ASSETS
31/12/16 31/12/15 31/12/14 31/12/13 31/12/12 DescriptionsKeterangan

This report is originally issued in Bahasa Indonesia
77
LIABILITAS DAN EKUITAS LIABILITIES AND EQUITY
LIABILITAS LIABILITIES
LIABILITAS JANGKA PENDEK CURRENT LIABILITIES
Pinjaman bank jangka pendek 7,79% 5,02% 8,79% 9,20% 9,37% Short-term bank loans
Utang usaha Trade payables
Pihak berelasi 0,23% 0,37% 1,24% 3,36% 9,51% Related parties
Pihak ketiga 6,00% 5,87% 7,11% 8,94% 7,37% Third parties
Utang lain-lain 0,00% 0,05% 0,17% 11,51% 0,38% Other payables
Biaya yang masih harus dibayar 7,50% 11,93% 12,51% 6,64% 3,22% Accrued expenses
Liabilitas imbalan kerja jangka pendek 0,00% 0,00% 0,00% 0,00% 0,10% Short-term employee benefits liability
Utang pajak 1,08% 4,43% 1,72% 1,86% 2,59% Taxes payable
Liabilitas jangka panjang yang jatuh
tempo dalam satu tahun Current maturities of long-term liabilities
Utang pembiayaan konsumen 0,00% 0,00% 0,01% 0,02% 0,24% Consumer finance payables
Utang sewa pembiayaan 0,00% 0,00% 0,21% 0,61% 1,00% Financial lease liabilities
Pinjaman bank 3,98% 4,21% 3,32% 0,00% 0,00% Bank loans
Jumlah Liabilitas Jangka Pendek 26,58% 31,89% 35,08% 42,13% 33,80% Total Current Liabilities
LIABILITAS JANGKA PANJANG NON-CURRENT LIABILITIES
Utang lain-lain - pihak berelasi 0,00% 0,00% 0,00% 0,94% 4,40% Other payables - related parties
Liabilitas jangka panjang - setelah
dikurangi bagian yang jatuh tempo Long-term liabilities - net of current
dalam satu tahun maturities
Utang pembiayaan konsumen 0,00% 0,00% 0,00% 0,00% 0,11% Consumer finance payables
Utang sewa pembiayaan 0,00% 0,00% 0,00% 0,38% 1,13% Financial lease liabilities
Pinjaman bank 1,22% 5,49% 8,64% 0,00% 0,00% Bank loans
Liabilitas pajak tangguhan - bersih 0,00% 0,14% 0,44% 0,20% 0,00% Deferred tax liabilities - net
Liabilitas imbalan kerja 1,48% 1,24% 1,42% 1,18% 0,79% Employee benefits liability
Penyisihan untuk reklamasi dan Provision for mine reclamation and
penutupan tambang 1,51% 0,88% 0,75% 0,53% 0,57% closure
Jumlah Liabilitas Jangka Panjang 4,21% 7,75% 11,25% 3,24% 7,01% Total Non-Current Liabilities
JUMLAH LIABILITAS 30,78% 39,64% 46,34% 45,37% 40,80% TOTAL LIABILITIES
EKUITAS EQUITY
Modal saham 15,47% 16,37% 17,03% 17,88% 20,44% Share capital
Tambahan modal disetor 26,32% 27,85% 28,97% 30,42% 34,77% Additional paid-in capital
Selisih atas akuisisi kepentingan Differences arising from acquisition of
non-pengendali -3,46% -3,67% -3,81% -4,00% -4,58% non-controlling interest
Saldo laba 30,88% 19,80% 11,47% 10,33% 8,57% Retained earnings
Ekuitas yang dapat diatribusikan kepada Equity attributable to the owners of the
pemilik entitas induk 69,22% 60,36% 53,66% 54,62% 59,20% parent
Kepentingan non-pengendali 0,00% 0,00% 0,00% 0,00% 0,00% Non-controlling interest
JUMLAH EKUITAS 69,22% 60,36% 53,66% 54,63% 59,20% TOTAL EQUITY
JUMLAH LIABILITAS DAN EKUITAS 100,00% 100,00% 100,00% 100,00% 100,00% TOTAL LIABILITIES AND EQUITY
31/12/16 31/12/15 31/12/14 31/12/13 31/12/12 DescriptionsKeterangan

This report is originally issued in Bahasa Indonesia
78
VI.C.3. PT Toba Bara Sejahtra Tbk dann entitas anak
VI.C.3. PT Toba Bara Sejahtra Tbk and subsidiaries
Tabel 23 Table 23
PT Baramulti Suksessarana Tbk dan entitas anak PT Baramulti Suksessarana Tbk and subsidiaries
Analisa Common Size Common Size Analysis of
Laporan Laba Rugi Komprehensif Statements of Consolidated Comprehensive Income
untuk tahun yang berakhir pada for the years ended
tanggal-tanggal 31 Desember 2012 - 2016 31 December 2012 - 2016
Pendapatan usaha 100,00% 100,00% 100,00% 100,00% 100,00% Sales
Beban pokok pendapatan 68,18% 65,85% 78,26% 80,24% 59,70% Cost of goods sold
Laba kotor 31,82% 34,15% 21,74% 19,76% 40,30% Gross profit
Beban penjualan dan distribusi -13,55% -14,26% -13,62% -10,12% -26,15% Selling and distribution expense
Beban umum dan administrasi -2,81% -4,85% -5,09% -4,67% -6,27% General and administrative expenses
Pendapatan operasi lain 0,06% 0,00% 0,22% 0,90% 7,05% Other operating income
Beban operasi lain -0,37% -0,51% -0,10% -1,26% -0,74% Other operating expenses
Laba usaha 15,14% 14,53% 3,15% 4,60% 14,18% Operating profit
Pendapatan keuangan 0,04% 0,16% 0,02% 0,16% 0,32% Finance income
Beban keuangan -0,51% -0,60% -0,77% -0,75% -2,65% Finance costs
Laba sebelum pajak 14,67% 14,08% 2,40% 4,02% 11,85% Profit before tax
Beban pajak penghasilan -3,37% -3,90% -1,23% -1,19% -2,87% Income tax expense
Laba tahun berjalan 11,30% 10,18% 1,17% 2,83% 8,98% Income for the year
Penghasilan komprehensif lain -0,01% 0,14% 0,09% 0,00% 0,00% Other comprehensive income
Jumlah penghasilan komprehensif 11,29% 10,33% 1,26% 2,83% 8,98% Total comprehensive income
Laba tahun berjalan yang dapat
diatribusikan kepada: Income for the year attributable to:
Pemilik entitas induk 11,30% 10,18% 1,17% 2,83% 8,98% Owners of the parent
Kepentingan non-pengendali 0,00% 0,00% 0,00% 0,00% 0,00% Non-controlling interest
Keterangan 31/12/16 31/12/15 31/12/14 31/12/13 31/12/12 Descriptions
Tabel 24 Table 24
PT Toba Bara Sejahtra Tbk dan entitas anak PT Toba Bara Sejahtra Tbk and subsidiaries
Analisa Common Size Common Size Analysis of
Laporan Posisi Keuangan Statements of Consolidated Financial Position
Per 31 Desember 2012 - 2016 As of 31 December 2012 - 2016
A S E T A S S E T S
ASET LANCAR CURRENT ASSETS
Kas dan setara kas 14,38% 16,13% 15,91% 20,31% 13,88% Cash and cash equivalents
Piutang usaha Trade receivables
Pihak ketiga 2,94% 7,40% 3,57% 5,33% 5,23% Third parties
Pihak berelasi 0,00% 0,00% 0,19% 0,37% 0,96% Related parties
Piutang lain-lain 1,94% 1,99% 1,98% 2,05% 2,57% Other receivables
Persediaan 5,98% 7,69% 13,95% 10,39% 10,87% Inventories
Pajak dibayar dimuka 0,04% 0,18% 0,00% 2,18% 5,59% Prepaid tax
Biaya dibayar dimuka 0,24% 0,24% 0,46% 0,38% 1,02% Prepaid expense
Uang muka 0,53% 0,47% 0,82% 0,45% 0,57% Advances
Piutang derivatif 0,95% 0,07% 0,18% 0,00% 0,00% Derivative receivables
Aset lancar lain-lain 0,00% 0,00% 0,00% 0,00% 0,03% Other current assets
Jumlah Aset Lancar 27,00% 34,18% 37,07% 41,46% 40,73% Total Current Assets
ASET TIDAK LANCAR NON-CURRENT ASSETS
Piutang lain-lain 11,04% 10,04% 9,85% 9,88% 18,05% Other receivables
Biaya dibayar dimuka 0,45% 0,30% 0,30% 0,31% 0,00% Prepaid expense
Uang muka 3,96% 2,83% 1,51% 0,26% 1,09% Advances
Estimasi tagihan pajak 0,95% 0,22% 0,00% 0,24% 0,00% Estimated claims for tax refund
Tanaman perkebunan Plantations
Tanaman menghasilkan 5,29% 4,98% 5,28% 4,20% 0,00% Mature plantations
Tanaman belum menghasilkan 0,00% 0,02% 0,02% 1,19% 0,00% Immature plantations
Aset tetap 18,12% 17,30% 15,93% 15,73% 13,02% Fixed assets
Aset eksplorasi dan evaluasi 1,85% 1,72% 1,61% 1,55% 3,40% Exploration and evaluations assets
Properti pertambangan 25,80% 24,98% 24,88% 23,07% 22,01% Mine properties - net
Goodwill 1,35% 1,25% 1,17% 1,13% 0,01% Goodwill
Aset pajak tangguhan 2,39% 0,98% 1,13% 0,49% 1,25% Deferred tax assets
Aset tidak lancar lainnya 1,80% 1,20% 1,24% 0,48% 0,44% Other non-current assets
Jumlah Aset Tidak Lancar 73,00% 65,82% 62,93% 58,54% 59,27% Total Non-Current Assets
JUMLAH ASET 100,00% 100,00% 100,00% 100,00% 100,00% TOTAL ASSETS
Descriptions31/12/15 31/12/14 31/12/13Keterangan 31/12/1231/12/16

This report is originally issued in Bahasa Indonesia
79
LIABILITAS DAN EKUITAS LIABILITIES AND EQUITY
LIABILITAS LIABILITIES
LIABILITAS JANGKA PENDEK CURRENT LIABILITIES
Utang usaha Trade payables
Pihak ketiga 10,33% 14,29% 21,31% 22,22% 22,10% Third parties
Pihak berelasi 0,00% 0,00% 0,00% 0,00% 0,21% Related parties
Utang lain-lain 0,01% 0,01% 0,00% 0,00% 0,14% Other payables
Utang deviden 0,10% 0,10% 0,10% 0,09% 1,40% Dividend payables
Beban akrual 1,03% 1,53% 1,64% 1,94% 3,07% Accrued expenses
Utang derivatif 5,44% 0,65% 1,84% 0,00% 0,00% Derivative payables
Liabilitas imbalan kerja jangka pendek 0,92% 1,53% 1,10% 1,10% 2,42% Short-term employee benefits liabilities
Utang pajak 0,32% 0,52% 1,77% 2,32% 1,29% Taxes payable
Uang muka pelanggan 0,57% 0,17% 2,12% 8,00% 4,45% Advances from customers
Bagian liabilitas jangka panjang yang jatuh tempo dalam
waktu satu tahun Current maturities of long-term liabilities
Utang bank 9,06% 5,29% 0,00% 10,77% 18,47% Bank loan
Sewa pembiayaan 0,12% 0,35% 0,32% 0,25% 0,19% Finance leases
Jumlah Liabilitas Jangka Pendek 27,90% 24,42% 30,20% 46,70% 53,74% Total Current Liabilities
LIABILITAS JANGKA PANJANG NON-CURRENT LIABILITIES
Liabilitas jangka panjang - setelah dikurangi bagian yang Non-current liabilities - net of current
jatuh tempo dalam waktu satu tahun maturties
Utang bank 10,41% 16,91% 18,66% 6,48% 0,00% Bank loans
Sewa pembiayaan 0,02% 0,11% 0,35% 0,43% 0,09% Finance leases
Uang muka pelanggan 0,00% 0,00% 0,00% 0,95% 0,00% Advance from customers
Utang lain-lain 1,26% 0,72% 0,75% 0,73% 1,10% Other payables
Provision for mine reclamation and mine
Provisi untuk reklamasi dan penutupan tambang 1,86% 1,52% 1,50% 1,27% 1,69% disclosure
Liabilitas program imbalan pasti 1,72% 1,26% 1,06% 0,57% 0,66% Defined benefit plan liabilities
Liabilitas pajak tangguhan 0,34% 0,14% 0,29% 0,98% 0,30% Deferred tax liabilities
Jumlah Liabilitas Jangka Panjang 15,62% 20,65% 22,60% 11,42% 3,84% Total Non-Current Liabilities
JUMLAH LIABILITAS 43,52% 45,07% 52,80% 58,12% 57,58% TOTAL LIABILITIES
EKUITAS EQUITY
Modal saham 16,85% 15,61% 14,66% 14,14% 16,85% Share capital
Tambahan modal disetor 49,75% 45,99% 43,18% 41,67% 49,66% Additional paid-in capital
Difference arising from transaction with
Selisih transaksi dengan kepentingan non-pengendali -34,26% -31,74% -29,80% -28,76% -34,27% non-controlling interests
Saldo laba 14,14% 12,51% 9,10% 5,99% 0,49% Retained earnings
Komponen ekuitas lainnya -0,60% 0,70% -0,27% 0,47% 0,00% Other components of equity
Ekuitas yang dapat diatribusikan kepada pemilik entitas Equity attributable to the owners of
induk 45,87% 43,07% 36,87% 33,52% 32,73% the parent
Kepentingan non-pengendali 10,61% 11,87% 10,32% 8,37% 9,69% Non-controlling interest
JUMLAH EKUITAS 56,48% 54,93% 47,20% 41,88% 42,42% TOTAL EQUITY
JUMLAH LIABILITAS DAN EKUITAS 100,00% 100,00% 100,00% 100,00% 100,00% TOTAL LIABILITIES AND EQUITY
Descriptions31/12/15 31/12/14 31/12/13Keterangan 31/12/1231/12/16

This report is originally issued in Bahasa Indonesia
80
Tabel 25 Table 25
PT Toba Bara Sejahtra Tbk dan entitas anak PT Toba Bara Sejahtra Tbk and subsidiaries
Analisa Common Size Common Size Analysis of
Laporan Laba Rugi Komprehensif Statements of Consolidated Comprehensive Income
untuk tahun yang berakhir pada for the years ended
tanggal-tanggal 31 Desember 2012 - 2016 31 December 2012 - 2016
Penjualan 100,00% 100,00% 100,00% 100,00% 100,00% Sales
Beban pokok penjualan 79,37% 79,77% 82,76% 81,14% 87,86% Cost of goods sold
Laba kotor 20,63% 20,23% 17,24% 18,86% 12,14% Gross profit
Beban umum dan administrasi -8,94% -7,79% -6,31% -6,80% -7,95% General and adminstrative expenses
Beban penjualan dan pemasaran -0,24% -0,27% -0,07% -0,13% -0,09% Selling and marketing expense
Beban pengalihan kewajiban pemenuhan kebutuhan dalam
negeri 0,00% 0,00% 0,00% 0,00% -0,20% Domestic market obligation
(Rugi) laba selisih kurs 0,06% -0,19% 0,02% -1,95% 0,15% Foreign exchange gain (loss)
Rugi instrumen derivatif -0,03% -0,10% -0,01% 0,16% 1,14% Loss on derivative instruments
Keuntungan atas penyelesaian akun pre-existing Gain on settlement of pre-existing
antar entitas 0,00% 0,00% 0,00% 1,79% 0,00% intercompany account
Pendapatan lain-lain - bersih 0,17% 0,26% 0,28% -0,08% 0,12% Other income - net
Laba usaha 11,64% 12,14% 11,14% 11,86% 5,31% Operating profit
Pendapatan keuangan 0,52% 0,50% 0,53% 0,96% 0,72% Finance income
Pajak final -0,03% -0,09% -0,03% 0,00% 0,00% Final tax
Beban keuangan -2,07% -1,33% -0,93% -0,87% -0,92% Finance costs
Laba sebelum beban pajak 9,57% 10,81% 10,21% 10,98% 4,39% Profit before tax expense
Beban pajak -4,41% -3,84% -3,60% -3,75% -2,10% Tax expense
Laba tahun berjalan 5,15% 6,97% 6,61% 7,24% 2,29% Profit for the year
Penghasilan komprehensif lain -2,99% 1,17% -0,77% 0,36% 0,02% Other comprehensive income
Jumlah penghasilan komprehensif tahun berjalan 2,16% 8,14% 5,83% 7,60% 2,31% Total comprehensive income for the year
Laba tahun berjalan yang dapat diatribusikan kepada: Profit for the year attributable to:
Pemilik entitas induk 0,59% 2,85% 6,60% 7,23% 2,29% Owners of the parent
Kepentingan non-pengendali 4,57% 4,12% 0,00% 0,00% 0,00% Non-controlling interests
DescriptionsKeterangan 31/12/1331/12/1431/12/1531/12/16 31/12/12

This report is originally issued in Bahasa Indonesia
81
VII. ANALISA RISIKO VII. RISKS ANALYSIS
Dalam menjalankan kegiatan usahanya di bidang pertambangan batubara dan pengembangan pembangkit listrik mulut tambang melalui entitas anaknya, yaitu BSL, DSU tidak terlepas dari berbagai risiko usaha yang dihadapi oleh BSL. Analisa risiko usaha terhadap BSL adalah sebagai berikut:
In carrying out its business activities engaged in coal mining and mine mouth power plant through its subsidiaries, BSL, DSU are inseparable from the risks faced by BSL. Risks analysis of BSL are as follows:
VII.A. Risiko Penurunan Harga Batubara dan
Kelangkaan Batubara VII.A. Risk of Coal Price Reduction and Coal
Rarity
Penurunan harga batubara akan menyebabkan terjadinya penurunan ekspor batubara sehingga akan mempengaruhi kinerja perusahaan batubara di Indonesia. Hal ini dikarenakan pihak Pemerintah telah menetapkan pembatasan ekspor batubara untuk kebutuhan nasional yang bertujuan untuk memenuhi kebutuhan berbagai sektor industri yang di masa mendatang sudah memproyeksikan kebutuhannya untuk proses produksi.
The decline in coal prices will lead to a decline in coal exports that will affect the performance of coal companies in Indonesia. This is because the Government has set restrictions on coal exports for national needs aimed at meeting the needs of various industrial sectors which in the future are already projecting their needs for the production process.
Namun demikian, sehubungan dengan risiko penurunan harga batubara dan kelangkaan batubara tersebut, BSL telah menjalin kerjasama dengan para pelanggannya melalui kontrak penjualan batubara sehingga selama masa kontrak tersebut, tarif yang dikenakan oleh BSL terhadap para pelanggannya tidak akan terpengaruh oleh risiko penurunan harga batubara dan kelangkaan batubara sehingga pendapatan BSL akan tetap stabil.
However, due to the risks of coal price decline and the scarcity of coal, BSL has cooperated with its customers through coal sales contracts so that during the contract period, tariffs charged by BSL to its customers will not be affected by the risk of coal price decline and coal shortage so BSL’s income will remain stable.
VII.B. Risiko Permintaan Pasar Terhadap
Batubara VII.B. Risk of Market Demand Against Coal
Banyaknya perushaan yang mengelola pertambangan batubara di Indonesia menyebabkan persaingan yang cukup ketat antara perusahaan yang satu dengan perusahaan lainnya. Kondisi tersebut berpotensi menurunkan pendapatan dan laba BSL sebagai perusahaan pertambangan batubara.
The number of companies that manage coal mining in Indonesia causes a fairly tight competition between one company and another. This condition has the potential to reduce the revenue and profit of BSL as a coal mining company.
Namun demikian, sehubungan dengan permintaan pasar terhadap batubara tersebut, BSL telah menjalin kerjasama dengan para pelanggannya melalui kontrak pennjualan batubara sehingga risiko permintaan pasar terhadap batubara tidak akan mempengaruhi pendapatan BSL.
However, in relation to market demand for the coal, BSL has established cooperation with its customers through coal sales contracts so that the risk of market demand on coal will not affect the revenue of BSL.

This report is originally issued in Bahasa Indonesia
82
VII.C. Risiko Kebijakan Pemerintah VII.C. Risk of Government Policy
Kegiatan usaha BSL dipengaruhi oleh perubahan kebijakan Pemerintah Indonesia baik langsung maupun tidak langsung. Kebijakan moneter uang ketat merupakan salah satu kebijakan tidak langsung yang mempengaruhi kegiatan BSL yang dapat berdampak pada menurunnya daya beli masyarakat melalui tingkat suku bunga yang tinggi. Sedangkan, kebijakan pemerintah yang secara langsung mempengaruhi BSL antara lain kemungkinan perubahan kebijakan rencana pembatasan ekspor batubara. Apabila kebijakan pemerintah tersebut diterapkan, dapat mengakibatkan berkurangnya jumlah pendapatan dan laba BSL.
BSL’s business activities are influenced by direct and indirect changes in Government of Indonesia policy. The tight monetary policy of monetary policy is one of the indirect policies affecting BSL activities that can impact on the decreasing of people’s purchasing power through high interest rates. Meanwhile, government policies that directly affect BSL include the possibility of changing the policy of coal export restriction plan. If such government policy is implemented, it may result in reduced amount of earnings and profit of BSL.
Namun demikian, sehubungan dengan adanya risiko kebijakan pemerintah mengenai pembatasan ekspor batubara, BSL telah menjalin kerjasama dengan para pelanggannya melalui kontrak terkait dengan penggunaan jasa terminal batubara yang dimiliki oleh BSL sehingga selama masa kontrak tersebut pendapatan BSL akan tetap stabil walaupun terdapat risiko kebijakan pemerintah mengenai pembatasan ekspor batubara.
However, in light of the risks of the government’s policy on coal export restrictions, BSL has established cooperation with its customers through contracts related to the use of coal terminal services owned by BSL so that during the contract period BSL’s revenues will remain stable despite the government’s policy risks regarding restrictions export of coal.
VII.D. Risiko Pencemaran Lingkungan VII.D. Risk of Environmental Pollution
Kegiatan usaha BSL sangat tergantung pada beberapa undang-undang dan peraturan yang mengatur eksplorasi, pembangunan, pengembangan dan produksi batubara serta dampak lingkungan dan keselamatan kerja. Pembuangan atas sisa pengangkutan batubara dapat mengakibatkan pencemaran udara, tanah, dan air yang dapat menimbulkan kerugian terhadap negara dan atau pihak ketiga dimana BSL harus mengganti rugi atas kerugian yang ditimbulkan.
BSL’s business activities are highly dependent on several laws and regulations governing the exploration, development, development and production of coal as well as environmental and occupational safety impacts. Disposal of coal transport waste may cause air, soil and water contamination which may cause harm to the state and/or third parties to which BSL shall indemnify against any losses arising.
Namun demikian, fasilitas terminal batubara yang dimiliki oleh BSL telah dirancang sesuai dengan standar dan kualitas yang telah memenuhi persyaratan sehingga dampak negatif atas potensi limbah dan pencemaran lingkungan yang dihasilkan atas proses pengolahan dan pengangkutan batubara dari para pelanggan BSL dapat diminimalisasikan dengan adanya proses pemeliharaan infrasturktur yang dilakukan secara berkala guna mencegah hal-hal tersebut.
However, the coal terminal facility owned by BSL has been designed in accordance with the standards and qualities that have fulfilled the requirements so that the negative impacts on the potential waste and evironmental pollution resulting from the processing and transportation of coal from BSL customers can be minimized by the maintenance process of the infrastructure carried out periodically to prevent such things.
This report is originally issued in Bahasa Indonesia
83
VII.E. Risiko Bencana Alam VII.E. Risk of Natural Disaster
Kegiatan usaha pertambangan batubara BSL tidak terlepas dari ancaman bencana alam seperti badai tropis, angin topan, gempa bumi dan banjir, karena faktor alam dan berbagai bencana yang dapat memberikan dampak negatif secara material terhadap kegiatan usaha, kondisi keuangan, dan hasil usaha BSL.
BSL coal mining business activities are inseparable from the threat of natural disasters such as tropical stroms, hurricanes, earthquakes and floods, due to natural factors and disasters that could have a material adverse effect on BSL’s business activities, financial condition and results.
Namun demikian, fasilitas pertambangan batubara yang dimiliki oleh BSL telah dirancang sesuai dengan standar dan kualitas yang telah memenuhi persyaratan dalam kondisi dan situasi untuk meminimalisasi dampak terjadinya bencana alam sehingga dapat mengurangi dampak negatif atas potensi kerusakan dan kerugian yang akan dialami oleh BSL.
However, the coal mining facilities owned by BSL have been designed in accordance with the standards and quality that have met the requirements in conditions and situations to minimize the impact of natural disasters so as to mitigate the negative impact on the potential damage and losses to be experienced by BSL.

This report is originally issued in Bahasa Indonesia
84
VIII. METODE PENILAIAN VIII. THE VALUATION METHODS
VIII.A. Metode-Metode Penilaian VIII.A. The Valuation Methods
VIII.A.1. Metode Akumulasi Aset VIII.A.1. Assets Accumulation Method
Metode ini merupakan metode penilaian yang berdasarkan pada pendekatan aset. Dengan metode ini, nilai dari semua komponen aset dan liabilitas harus disesuaikan menjadi nilai pasar atau nilai pasar wajarnya, kecuali untuk komponen-komponen yang telah menunjukkan nilai pasarnya (seperti kas/bank atau utang bank).
This method is a valuation method based on assets based approach. Through this method, the value of all components of assets and liabilities should be adjusted to its market value, except for component that has indicated its market value (such as cash/bank or bank loan).
Aset lancar harus dinilai ulang, misalnya untuk piutang dengan mengurangkan jumlah yang tak dapat ditagih secara normal. Aset tetap seperti tanah, bangunan dan mesin-mesin perlu dinilai dengan konsep penilaian properti yang berlaku umum.
Current assets must be revalued, e.q. receivables by subtracting the amount which cannot be normally billed. Fixed assets such as land, buildings and machines need to be valued using generally accepted property concept valuation.
Selain aset berwujud, nilai pasar aset tak berwujud seperti hak paten, lisensi, biaya riset dan pengembangan, karyawan yang telah terlatih dan siap bekerja dan daftar langganan, juga harus dihitung. Nilai pasar aset tak berwujud tersebut diperoleh dengan melakukan penilaian terhadap tiap-tiap aset tersebut secara terpisah. Nilai pasar wajar ekuitas (net worth) kemudian diperoleh dengan menghitung selisih antara nilai seluruh aset dan liabilitas yang telah disesuaikan.
Besides tangible assets, the market value of intangible assets such as patents, licenses, research and development costs, pool of employees and pool of captive customer must also be calculated. The market values of the intangible assets are obtained by performing valuation of each intangible asset separately. The fair market value of equity (net worth) is then obtained by calculating the difference between adjusted value of all assets and liabilities.
VIII.A.2. Metode Pembanding Perusahaan Terbuka VIII.A.2. Guideline Publicly Traded Company
Method
Metode pembanding perusahaan terbuka merupakan metode penilaian yang didasarkan pada pendekatan pasar. Dengan metode ini, nilai pasar wajar saham ditetapkan berdasarkan harga yang telah atau pernah terjadi dari perusahaan sejenis yang sebanding dan sepadan. Nilai pasar wajar dari perusahaan pembanding diambil dari pasar modal (perusahaan publik/terbuka).
Guideline publicly traded company method is a valuation method based on market based approach. Through this method, the fair market value of equity is determined by share price that has been or ever occurred from similar comparable and commensurate companies. The fair market values of the comparison companies are obtained from the capital market (publicly-held companies).
Syarat utama dari penggunaan metode ini adalah perusahaan pembanding harus sebanding dan sepadan dengan perusahaan yang akan dinilai dalam berbagai variabel pembanding, antara lain perputaran penjualan, ekuitas, struktur modal (leverage), aset dan komposisi aset, tingkat laba dan rasio-rasio keuangan.
The prominent requirement of the application of this method is that the comparison companies must be comparable and commensurate with the company that would be assessed in various comparative variables, such as sales turnover, equity, capital structure (leverage), assets and asset composition, income levels and financial ratios.
This report is originally issued in Bahasa Indonesia
85
Jika telah diperoleh perusahaan yang sebanding dan sepadan, nilai pasar wajar saham perusahaan yang dinilai diperoleh dengan cara mengalikan pendapatan perusahaan dengan beberapa rasio yang diperoleh dari perusahaan pembanding, seperti rasio P/E (price/earnings), P/SR (price/sales revenues), P/BV (price/book value of equity) dan sebagainya.
If the comparable and commensurate companies have been obtained, the share market value of the company being assessed is obtained by multiplying the revenues of the company with several ratios obtained from the comparison companies, such as P/E (price/earnings), P/SR (price/sales revenues), P/BV (price/book value of equity) etc.
VIII.A.3. Metode Diskonto Pendapatan Ekonomi
Mendatang VIII.A.3. Discounted Future Economic Income
Method
Metode diskonto pendapatan ekonomi mendatang ini merupakan metode penilaian yang didasarkan pada pendekatan pendapatan.
Discounted future economic income method is a valuation method based on income based approach.
Untuk menggunakan metode ini, sebelum melakukan proses diskonto, terlebih dahulu harus diproyeksikan pendapatan mendatang berupa arus kas bersih untuk ekuitas atau arus kas bersih untuk kapital sesuai dengan sifat dan jenis usaha yang dinilai. Setelah proyeksi dibuat, langkah berikutnya adalah menetapkan tingkat diskonto yang tepat.
To apply this method, before performing the discounting process, future earnings must first be projected in the form of net cash flow to equity or net cash flow to invested capital according to the nature and type of business valued. After the projection is prepared, the next step is to determine the appropriate discount rate.
Proses selanjutnya adalah mendiskonto nilai-nilai arus kas bersih yang telah diproyeksikan, termasuk nilai periode kekal, dengan faktor diskonto yang diperoleh dari tingkat diskonto sesuai dengan periode proyeksinya. Jika yang didiskonto adalah arus kas bersih untuk ekuitas, maka nilai kini dari keseluruhan pendapatan di masa mendatang tersebut merupakan nilai ekuitas, sedangkan jika yang didiskonto adalah arus kas bersih untuk kapital, jumlah nilai kini tersebut merupakan nilai perusahaan, yang masih harus dikurangi dengan nilai liabilitas untuk mendapatkan nilai ekuitas.
The next process is to discount the value of projected net cash flow, including the continuing value, with a discount factor derived from the discount rate according to the projection period. If the net cash flows to equity are discounted, the present value of total future earnings is the equity value, while if net cash flows to capital are discounted, total present value of future earnings is the corporate value, which must still be deducted by the value of the loans to obtain the equity value.

This report is originally issued in Bahasa Indonesia
86
VIII.B. Metode Penilaian yang Digunakan VIII.B. The Valuation Methods Applied
Penilaian Obyek Penilaian didasarkan pada analisa internal dan eksternal. Analisa internal akan berdasarkan pada data yang disediakan oleh manajemen, analisa historis atas laporan posisi keuangan dan laporan laba rugi komprehensif BSL, pengkajian atas kondisi operasi dan manajemen serta sumber daya yang dimiliki BSL. Prospek BSL di masa yang akan datang kami evaluasi berdasarkan rencana usaha serta proyeksi laporan keuangan yang diberikan oleh manajemen yang telah kami kaji kewajaran dan konsistensinya. Analisa eksternal didasarkan pada kajian singkat terhadap faktor-faktor eksternal yang dipertimbangkan sebagai penggerak nilai (value drivers) termasuk juga kajian singkat atas prospek dari industri yang bersangkutan.
The valuation of the Valuation Object relied on internal and external analysis. Internal analysis was performed based on the data provided by the management, historical analysis on BSL’s statements of financial position and statements of comprehensive income, review of BSL’s operating conditions and management as well as resources. BSL’s prospect in the future was evaluated based on the business plans and financial statements projections provided by the management that we have reviewed the fairness and consistency. External analysis was performed based on brief review on external factors considered as the value drivers, including a brief review on the prospects of the related industry.
Dalam mengaplikasikan metode penilaian untuk menentukan indikasi nilai pasar wajar suatu “business interest” perlu beracuan pada laporan keuangan (laporan posisi keuangan dan laporan laba rugi komprehensif) yang representatif, oleh karenanya diperlukan penyesuaian terhadap nilai buku laporan posisi keuangan dan normalisasi keuntungan laporan laba rugi komprehensif yang biasanya disusun oleh manajemen berdasarkan nilai historis. Betapapun nilai buku suatu perusahaan yang direfleksikan dalam laporan posisi keuangan dan laporan laba rugi komprehensif adalah nilai perolehan dan tidak mencerminkan nilai ekonomis yang dapat sepenuhnya dijadikan acuan sebagai nilai pasar wajar saat penilaian tersebut.
In applying the valuation methods to determine the indicative fair market value of a "business interest", it is essential to rely on representative financial statements (statements of financial position and statements of comprehensive income), therefore adjustments are required on the net book value of statements of financial position and the normalization of profit of statements of comprehensive income which are commonly prepared by the management based on historical figures. The company's book value as reflected in statements of financial position and statements of comprehensive income represents the acquisition value and does not reflect the economic value that can be used fully as a reference of the company’s fair market value during the valuation.
Metode penilaian yang digunakan dalam penilaian Obyek Penilaian adalah metode diskonto pendapatan ekonomi mendatang, metode akumulasi aset dan metode pembanding perusahaan terbuka.
The valuation methods applied in the valuation of the Valuation Object were discounted future economic income method, asset accumulation method and guideline publicly traded company method.

This report is originally issued in Bahasa Indonesia
87
Metode diskonto pendapatan ekonomi mendatang dipilih mengingat bahwa kegiatan usaha yang dilaksanakan oleh BSL di masa depan masih akan berfluktuasi sesuai dengan perkiraan atas perkembangan usaha BSL. Dalam melaksanakan penilaian dengan metode ini, operasi BSL diproyeksikan sesuai dengan perkiraan atas perkembangan usaha BSL. Pendapatan ekonomi mendatang yang dihasilkan berdasarkan proyeksi laporan keuangan dikonversi menjadi nilai kini dengan tingkat diskonto yang sesuai dengan tingkat risiko. Indikasi nilai adalah total nilai kini dari pendapatan ekonomi mendatang tersebut.
Discounted future economic income method was used considering that the operations carried out by BSL in the future will still fluctuate according to the estimated BSL’s business development. In performing the valuation through this method, BSL’s operations were projected based on the estimated BSL’s business development. Future cash flows generated by financial statements projections were converted into the present value using an appropriate discount rate to the level of risks. Indicative value was the total present value of future cash flows.
Dalam melaksanakan penilaian dengan metode akumulasi aset, nilai dari semua komponen aset dan liabilitas/utang harus disesuaikan menjadi nilai pasar atau nilai pasar wajarnya, kecuali untuk komponen-komponen yang telah menunjukkan nilai pasarnya (seperti kas/bank atau utang bank). Nilai pasar keseluruhan perusahaan kemudian diperoleh dengan menghitung selisih antara nilai pasar seluruh aset (berwujud maupun tak berwujud) dan nilai pasar liabilitas.
In performing the valuation using asset accumulation method, the value of all components of assets and liabilities should be adjusted to its market value or its fair market value, except for component that has indicated its market value (such as cash/bank or bank loan). Overall market value of the company was then obtained by calculating the difference between the market value of all assets (tangible and intangible) and the market value of liabilities.
Metode pembanding peruahaan terbuka digunakan dalam penilaian ini karena walaupun di pasar saham perusahaan terbuka tidak diperoleh informasi mengenai perusahaan sejenis dengan skala usaha dan aset yang setara, namun diperkirakan data saham perusahaan terbuka yang ada dapat digunakan sebagai data perbandingan atas nilai saham yang dimiliki oleh DSU.
Guideline publicly traded company method was used in the valuation despite the unavailability of information for similar companies with similar business scale and assets in public comapnies stock market, but it is expected that the available public companies stock data could be used as comparative data for the value of shares owned by DSU.
Pendekatan dan metode penilaian di atas adalah yang kami anggap paling sesuai untuk diaplikasikan dalam penugasan ini dan telah disepakati oleh pihak manajemen DSU. Tidak tertutup kemungkinan untuk diaplikasikannya pendekatan dan metode penilaian lain yang dapat memberikan hasil yang berbeda.
The approaches and valuation methods above were considered to be the most suitable to be applied in this assignment and had been approved by the management of DSU. It is possible that application of other valuation approaches and methods may give different results.
Selanjutnya, nilai-nilai yang diperoleh dari tiap-tiap metode tersebut direkonsiliasi dengan melakukan pembobotan.
Furthermore, the values obtained from each methods are reconciled by weighting.

This report is originally issued in Bahasa Indonesia
88
VIII.C. Premis Penilaian VIII.C. The Valuation Premise
Kami telah melakukan penilaian atas nilai pasar wajar Obyek Penilaian dengan premis penilaian bahwa DSU adalah sebuah perusahaan yang “going-concern”.
We have performed the valuation on the fair market value of the Valuation Object with the premise that DSU is a "going-concern" company.
VIII.D. Aplikasi Diskon dan Premi VIII.D. Application of Discounts and Premiums
Diskon dan premi merupakan hal-hal yang tak terpisahkan dari proses penilaian perusahaan tertutup. Diskon dan premi terkait dengan ada/tidaknya tingkat kendali serta tingkat kemampuan untuk dipasarkan dari saham yang dinilai. Diskon adalah potongan yang diberikan kepada suatu indikasi nilai dari business interest atau saham yang berhasil
diperkirakan. Pemberian diskon terkait dengan tidak adanya unsur kendali dalam saham yang dinilai dan disebut dengan Discount for Lack of Control – DLOC (Diskon Pengendalian). Diskon juga terkait dengan tingkat kesulitan saham tersebut untuk dikonversi secara cepat menjadi uang tunai yang disebut dengan Discount for Lack of Marketabilities – DLOM (Diskon Likuiditas
Pasar). Sedangkan, premi adalah tambahan nilai yang diberikan kepada indikasi nilai yang berhasil diperoleh dalam proses penilaian. Pemberian premi terkait dengan adanya unsur kendali dalam saham perusahaan yang dinilai dan disebut dengan Premium for Control (Premi Pengendalian).
Discounts and premiums are inseparable from the valuation process of privately-held company. Discounts and premiums are associated with the existence of control levels and the ability to be marketed from the valued shares. Discount is a deduction given to an indicative value of the predicted business interests or shares. The application of discount associated with the absence of control in the valued shares is called the Discount for Lack of Control – DLOC. Discount is also associated with the level of difficulty of the shares to be converted quickly into cash which is called as Discount for Lack of Marketabilities – DLOM. While the premium is the additional value given to the indicative value obtained in the valuation process. The application of premium associated with the element of control in the valued shares is called the Premium for Control.
VIII.E. Prosedur Penilaian VIII.E. The Valuation Procedures
Berdasarkan pendekatan dan metode penilaian yang telah dipilih untuk menentukan indikasi nilai pasar wajar Obyek Penilaian, kami telah melakukan langkah-langkah sebagai berikut:
Based on the approaches and the valuation methods that have been selected to determine the indicative fair market value of the Valuation Object, we have performed the following steps:
1. Melakukan tinjauan atas faktor internal
dan eksternal yang mempengaruhi operasi BSL.
1. To review the internal and external factors that affected the operation of BSL.
2. Melakukan tinjauan atas laporan keuangan historis dari BSL.
2. To review the historical financial statements of BSL.
3. Melakukan penelaahan atas data-data operasional BSL.
3. To review the operational data of BSL.
4. Melakukan tinjauan atas proyeksi laporan keuangan BSL yang telah disiapkan oleh pihak manajemen BSL.
4. To review the financial statements projections of BSL prepared by BSL’s management.
5. Melakukan diskusi dengan manajemen atas proyeksi laporan keuangan tersebut.
5. To discuss with the management on such financial statements projections.

This report is originally issued in Bahasa Indonesia
89
6. Melakukan penilaian Obyek Penilaian dengan mengaplikasikan metode akumulasi aset dengan pendekatan aset, metode diskonto pendapatan ekonomi mendatang dengan pendekatan pendapatan dan metode pembanding perusahaan terbuka dengan pendekatan pasar.
6. To perform the valuation of the Valuation Object by applying assets accumulation method with assets based approach, discounted future economic income method with income based approach and guideline publicly traded company method with market based approach.
VIII.F. Independensi Penilai VIII.F. The Independency of Appraisers
Dalam mempersiapkan laporan penilaian, JKR bertindak secara independen tanpa adanya benturan kepentingan dan tidak terafiliasi dengan Perseroan dan DSU ataupun pihak-pihak yang terafiliasi dengan Perseroan dan DSU. JKR juga tidak memiliki kepentingan ataupun keuntungan pribadi terkait dengan penugasan ini. Selanjutnya, laporan penilaian ini tidak dilakukan untuk memberikan keuntungan atau merugikan pihak manapun. Imbalan yang kami terima adalah sama sekali tidak dipengaruhi oleh nilai yang dihasilkan dari proses analisa penilaian ini dan JKR hanya menerima imbalan sesuai dengan surat penugasan No. JK/170206-003 tanggal 6 Februari 2017 yang telah disetujui oleh manajemen Perseroan.
In preparing the valuation report, JKR acted independently without any conflict of interests and were not affiliated with the Company and DSU or the parties affiliated with the Company and DSU. JKR also had no interest or personal advantage associated with this assignment. In addition, this valuation report was not performed to advantage or disadvantage any party. The compensation we received was not affected by the value generated from the analysis process of this valuation and JKR only received the compensation in accordance with JKR’s engagement letter No. JK/170206-003 dated 6 February 2017 which was approved by the Company's management.

This report is originally issued in Bahasa Indonesia
90
IX. PENILAIAN IX. THE VALUATION
Sebagaimana telah diuraikan sebelumnya, metode penilaian yang digunakan untuk menilai Obyek Penilaian adalah metode akumulasi aset, metode diskonto pendapatan ekonomi mendatang dan metode pembanding perusahaan terbuka. Dalam bab ini, akan dibahas penentuan nilai pasar wajar Obyek Penilaian.
As described earlier, the valuation methods applied in the valuation of the Valuation Object was assets accumulation method, discounted future economic income method and guideline publicly traded company method. In this chapter, we will describe the determination of the fair market value of Valuation Object.
IX.A. Premi Pengendalian, Diskon Pengendalian
dan Diskon Likuiditas Pasar IX.A. Premium for Control, Discount for Lack of
Control and Discount for Lack of Marketabilities
Berdasarkan Peraturan VIII.C.3, premi pengendalian didefinisikan sebagai “suatu jumlah atau persentase tertentu yang merupakan penambah dari nilai suatu ekuitas sebagai cerminan dari tingkat pengendalian atas obyek penilaian”.
Based on Rule VIII.C.3, premium for control is defined as “a certain amount or percentage which is an addition of an equity value to reflect control of the valuation object”.
Berdasarkan Peraturan VIII.C.3, diskon pengendalian didefinisikan sebagai “suatu jumlah atau persentase tertentu yang merupakan pengurang dari nilai suatu ekuitas sebagai cerminan dari tingkat pengendalian atas obyek penilaian”.
Based on Rule VIII.C.3, discount for lack of control is defined as “a certain amount or percentage which is a deduction of an equity value to reflect control of the valuation object”.
Premi pengendalian dan diskon pengendalian mencerminkan penambahan terhadap nilai dari penyertaan minoritas atau pengurangan terhadap nilai dari penyertaan mayoritas dalam entitas anak yang dinilai sebagai pengaruh dari ketiadaan pengendalian dari pemilik yang berada dalam posisi minoritas atau dibatasi pengendaliannya.
Premium for control and discount for lack of control reflects the addition in value of minority ownership or reduction in value of majority ownership in subsidiaries which regarded as the effect of the lack of control of the owners who are in a minority position or limited control.
Pengurangan diperhitungkan karena pemilik yang dalam kondisi tidak memiliki kemampuan untuk mengendalikan akan memperoleh manfaat yang berbeda dari pemilik yang memiliki kemampuan untuk mengendalikan karena adanya keleluasaan dari pemilik yang mengendalikan untuk mengoptimalkan manfaat dengan:
Reduction is taken into consideration because the owners who are unable to control will acquire different benefits from the owners who have the ability to control due to the discretion of the controlling owners to optimize the benefits by:
• Menentukan arah perkembangan jangka panjang DSU.
• Determining the direction of long-term development of DSU.
• Memilih pengurus inti DSU. • Selecting the core management of DSU.
• Menentukan hak dan fasilitas untuk pengurus inti.
• Defining the rights and facilities for the core management.
• Menentukan kebijakan investasi. • Determining the investment policies.
• Menentukan dengan pihak mana kegiatan usaha akan dilakukan.
• Determining which side the business will be conducted.
• Menentukan besarnya dividen yang akan dibayarkan.
• Determining the amount of dividend to be paid.

This report is originally issued in Bahasa Indonesia
91
• Menolak usulan-usulan di atas yang berasal dari pemegang saham minoritas.
• Rejecting the advice which originated from minority shareholders.
Berdasarkan Peraturan VIII.C.3, diskon likuiditas pasar didefinisikan sebagai “suatu jumlah atau persentase tertentu yang merupakan pengurang dari nilai suatu ekuitas sebagai cerminan dari kurangnya likuiditas obyek penilaian”.
Based on Rule VIII.C.3, discount for lack of marketabilities is defined as “a certain amount or percentage which is a deduction of an equity value to reflect the lack of marketabilities of the valuation object”.
Diskon likuiditas pasar mencerminkan pengurangan terhadap nilai dari perusahaan yang dinilai sebagai pengaruh dari tidak likuidnya saham perusahaan tersebut untuk diperdagangkan.
Discount for lack of marketability reflects a reduction in the value of the assessed company as the effect of the company’s illiquid shares to be traded.
Untuk penilaian atas DSU, sesuai dengan tujuan penilaian yang dilakukan, yaitu untuk memperoleh pendapat yang bersifat independen tentang nilai pasar wajar dari Obyek Penilaian yang dinyatakan dalam mata uang USD dan/atau ekuivalensinya pada tanggal 31 Desember 2016, oleh karena itu atas indikasi nilai yang dihasilkan, dilakukan atau diaplikasikan penyesuaian terhadap kondisi ketidakmampuan untuk dipasarkan dengan cepat (diskon likuiditas pasar), dikenakan tingkat diskonto sebesar 20,00%.
For the valuation of DSU, in accordance with the purpose of the valuation, which is to obtain an independent opinion on the fair market value of the Valuation Object stated in USD and/or its equivalency as of 31 December 2016, therefore, upon the indicative value result, adjustments were performed or applied to the condition of inability to be quickly marketed (discount for lack of marketabilities), with a discount rate of 20.00%.
IX.B. Nilai Pasar Wajar Obyek Penilaian IX.B. The Fair Market Value of The Valuation
Object
IX.B.1. Nilai Pasar Wajar 100,00% Saham DSU
Berdasarkan Metode Akumulasi Aset IX.B.1. The Fair Market Value of 100.00% Shares
of DSU Based on Asset Accumulationn Method
Sebagaimana telah diuraikan sebelumnya, metode yang digunakan untuk menentukan nilai pasar wajar Obyek Penilaian adalah metode akumulasi aset. Metode ini merupakan metode penilaian yang didasarkan pada pendekatan aset. Dengan metode ini, nilai dari semua komponen aset dan liabilitas harus disesuaikan menjadi nilai pasar atau nilai pasar wajarnya, kecuali untuk komponen-komponen yang telah menunjukkan nilai pasarnya (seperti kas/bank atau utang bank).
As described earlier, the method applied to determine the fair market value of the Valuation Object is assets acummulation method. This method is a valuation method based on assets based approach. Through this method, the value of all components of assets and liabilities should be adjusted to its market value, except for component that has indicated its market value (such as cash/bank or bank loan).

This report is originally issued in Bahasa Indonesia
92
Pada penilaian ini, kami melakukan penilaian atas indikasi nilai pasar wajar penyertaan saham pada entitas anak yang tercatat pada laporan posisi keuangan DSU pada tanggal 31 Desember 2016. Perhitungan indikasi nilai pasar penyertaan saham pada DSI yang tercatat dalam laporan keuangan DSU pada tanggal 31 Desember 2016 dilakukan dengan metode akumulasi aset.
In this valuation, we performed the valuation of indicative market value of investment in subsidiaries recorded in the statements of financial position of DSU as of 31 December 2016. The calculation of indicative fair market value of investment in DSI recorded in the statements of financial position of DSU as of 31 December 2016 was performed by applying asset accumulation method.
Dengan menggunakan metode akumulasi aset, diperoleh hasil bahwa indikasi nilai pasar wajar 100,00% saham DSI adalah sebesar USD 72,17 juta.
By applying asset accumulation method, the indicative fair market value of 100.00% shares of DSI was USD 72.17 million.
Berdasarkan penilaian tersebut, maka indikasi nilai pasar wajar 99,00% saham DSI per tanggal 31 Desember 2016 adalah sebesar USD 71,45 juta. Apabila indikasi nilai pasar wajar penyertaan saham pada entitas anak tersebut direfleksikan dalam laporan posisi keuangan, maka jumlah aset DSU adalah sebesar USD 77,83 juta, sedangkan jumlah liabilitas DSU adalah tetap, yaitu sebesar USD 0,05 juta.
Based on the valuation, indicative fair market value of 99.00% shares of DSI as of 31 December 2016 was USD 71.45 million. If the indicative fair market value of the investment in subsidiaries is reflected to the statements of financial position, total assets of DSU was USD 77.83 million, while total liabilities of DSU is fixed, i.e. was USD 0.05 million.
Indikasi nilai pasar wajar 100,00% saham DSU kemudian diperoleh dengan menghitung selisih antara nilai seluruh aset dan liabilitas. Dengan demikian, pada tanggal 31 Desember 2016, indikasi nilai pasar wajar 100,00% saham DSU sebelum diskon likuiditas pasar adalah sebesar USD 77,78 juta. Dengan diskon likuiditas pasar sebesar 20,00%, maka nilai pasar wajar 100,00% saham DSU adalah sebesar USD 62,23 juta. Dengan demikian, nilai pasar wajar 100,00% saham DSU berdasarkan metode akumulasi aset adalah sebesar USD 62,23 juta.
Indicative fair market value of 100.00% shares of DSU was then obtained by calculating the difference of all assets and liabilities. Therefore, as of 31 December 2016, indicative fair market value of 100.00% shares of DSU was USD 77.78 million. By applying discount for lack of marketabilities of 20.00%, then the fair market value of 100.00% shares of DSU was USD 62.23 million. Therefore, the fair market value of 100.00% shares of DSU based on assets accumulation method was USD 62.23 million.

This report is originally issued in Bahasa Indonesia
93
Perhitungan nilai pasar wajar Obyek Penilaian dengan menggunakan metode akumulasi aset adalah sebagai berikut:
The calculation of fair market value of the Valuation Object using assets accumulation method is as follows:
IX.B.2. Nilai Pasar Wajar 100,00% Saham DSU Berdasarkan Metode Pembanding Perusahaan Terbuka
IX.B.2. The Fair Market Value of 100.00% Shares of DSU Based on Guideline Publicly Traded Company Method
Sebagaimana telah diuraikan sebelumnya, metode yang digunakan untuk menentukan nilai pasar wajar Obyek Penilaian adalah metode pembanding perusahaan terbuka. Metode ini merupakan metode penilaian yang didasarkan pada pendekatan pasar. Dengan metode ini, indikasi nilai pasar wajar saham ditetapkan berdasarkan harga yang telah atau pernah terjadi dari perusahaan sejenis yang sebanding dan sepadan. Indikasi nilai pasar wajar dari perusahaan pembanding diambil dari pasar modal (perusahaan publik/terbuka).
As described earlier, the method applied to determine the fair market value of the Valuation Object is guideline publicly traded company method. This method is a valuation method based on market based approach. Through this method, the indicative fair market value of equity is determined by share price that has been or ever occurred from similar comparable and commensurate companies. The indicative fair market values of the comparison companies are obtained from the capital market (publicly-held companies).
Tabel 26 Table 26
PT Dwikarya Sejati Utama PT Dwikarya Sejati Utama
Nilai Pasar Wajar 100,00% Saham Fair Market Value of 100.00% Shares
Metode Akumulasi Aset Assets Accumulation Method
Per 31 Desember 2016 As of 31 December 2016
(Dalam ribuan USD) (In thousand of USD)
Nilai Pasar
Wajar/
Fair Market
Value
A S E T A S S E T S
ASET LANCAR CURRENT ASSETS
Piutang lain-lain 6.388 - 6.388 Other receivables
Jumlah Aset Lancar 6.388 - 6.388 Total Current Assets
ASET TIDAK LANCAR NON-CURRENT ASSETS
Investasi pada entitas anak Investment in subsidiaries
PT Duta Sarana Internusa 109 71.336 71.445 PT Duta Sarana Internusa
Jumlah Aset Tidak Lancar 109 71.336 71.445 Total Non-Current Assets
TOTAL ASET 6.497 71.336 77.833 TOTAL ASSETS
LIABILITAS DAN EKUITAS LIABILITIES AND EQUITY
LIABILITAS LIABILITIES
Utang lain-lain 50 - 50 Other payables
JUMLAH LIABILITAS 50 - 50 TOTAL LIABILITIES
EKUITAS 6.447 71.336 77.783 EQUITY
JUMLAH LIABILITAS DAN EKUITAS 6.497 71.336 77.833 TOTAL LIABILITIES AND EQUITY
Indikasi nilai pasar wajar 100,00% saham Indicative fair market value of 100.00% shares
sebelum diskon likuiditas pasar 77.783 before discount for lack of marketabilities
Diskon likuiditas pasar (20,00%) (15.557) Discount for lack of marketabilities (20.00%)
Nilai pasar wajar 100,00% saham 62.226 Fair market value of 100.00% shares
Penyesuian/
Descriptions
Adjustments
Keterangan 31/12/16

This report is originally issued in Bahasa Indonesia
94
Syarat utama dari penggunaan metode ini adalah perusahaan pembanding harus sebanding dan sepadan dengan perusahaan yang akan dinilai dalam berbagai variabel pembanding, antara lain perputaran penjualan, ekuitas, struktur modal (leverage), aset dan komposisi aset, tingkat laba dan rasio-rasio keuangan.
The prominent requirement of the application of this method is that the comparison companies must be comparable and commensurate with the company that would be assessed in various comparative variables, such as sales turnover, equity, capital structure (leverage), assets and asset composition, income levels and financial ratios.
Jika telah diperoleh perusahaan yang sebanding dan sepadan, indikasi nilai pasar wajar saham perusahaan yang dinilai diperoleh dengan cara mengalikan pendapatan perusahaan dengan beberapa rasio yang diperoleh dari perusahaan pembanding, seperti rasio P/E (price/earnings), P/SR (price/sales revenues), P/BV (price/book value of equity), MVIC/S (market value of invested capital/sales), MVIC/BVIC (market value of invested capital/book value of invested capital) dan
sebagainya.
If the comparable and commensurate companies have been obtained, the indicative share market value of the company being assessed is obtained by multiplying the revenues of the company with several ratios obtained from the comparison companies, such as P/E (price/earnings), P/SR (price/sales revenues), P/BV (price/book value of equity), MVIC/S (market value of invested capital/sales), MVIC/BVIC (market value of invested capital/book value of invested capital) etc.
Dalam metode pembanding perusahaan terbuka, digunakan angka pengali MVIC/BVIC sebesar 2,17 dengan perincian sebagai berikut:
In guideline publicly traded company method, MVIC/BVIC of 2.17 was used as multiplier with the following details:
Untuk metode pembanding perusahaan terbuka, karena angka pengali di atas diperoleh dari perusahaan-perusahaan terbuka, sehingga mencerminkan angka pengali untuk transaksi minoritas yang bersifat likuid, maka di dalam penilaian ini, perlu ditambahkan premi pengendalian yang besarnya menurut pendapat kami adalah sebesar 50,00%.
For guideline publicly traded company method, since the multiplier is obtained from public companies, thus reflecting the multiplier for liquid minority transactions, therefore in this valuation, premium for control must be added whereas in our opinion, such premium for control is 50.00%.
Tabel 27 Table 27
PT Dwikarya Sejati Utama PT Dwikarya Sejati Utama
Data Angka Pengali Perusahaan Pembanding Multiplier Data of Comparison Companies
PT ABM Investama Tbk 1,32 PT ABM Investama Tbk
PT Atlas Resources Tbk 1,38 PT Atlas Resources Tbk
PT Baramulti Suksessarana Tbk 1,97 PT Baramulti Suksessarana Tbk
PT Bumi Resources Tbk 2,70 PT Bumi Resources Tbk
PT Bayan Resources Tbk 2,94 PT Bayan Resources Tbk
PT Indo Tambangraya Megah Tbk 1,56 PT Indo Tambangraya Megah Tbk
PT Bukit Asam (Persero) Tbk 2,38 PT Bukit Asam (Persero) Tbk
PT Toba Bara Sejahtra Tbk 2,91 PT Toba Bara Sejahtra Tbk
Median 2,17 Median
MVIC/BVIC CompaniesPerusahaan

This report is originally issued in Bahasa Indonesia
95
Berdasarkan laporan keuangan DSU untuk periode sembilan bulan yang berakhir pada tanggal 31 Desember 2016, BVIC DSU adalah sebesar USD 6,45 juta. Dengan demikian, indikasi nilai pasar wajar 100,00% saham minoritas DSU adalah sebesar USD 14,02 juta. Dengan premi pengendalian sebesar 50,00%, maka indikasi nilai pasar wajar 100,00% saham DSU adalah sebesar USD 21,03 juta.
Based on DSU’s financial statements for nine months period ended 31 December 2016, DSU’s BVIC was USD 6.45 million. Therefore, the indicative fair market value of 100.00% minority shares of DSU was USD 14.02 million. By applying premium for control of 50.00%, therefore the indicative fair market value of 100.00% shares of DSU was USD 21.03 million.
Pada tanggal 31 Desember 2016, DSU memiliki penyertaan saham kepada DSI sebesar USD 47,14 juta. Dengan menambahkan nilai penyertaan saham kepada DSI tersebut sebesar USD 47,14 juta, maka indikasi nilai pasar wajar 100,00% saham DSU sebelum diskon likuiditas pasar adalah sebesar USD 68,17 juta. Dengan diskon likuiditas pasar sebesar 20,00%, maka nilai pasar wajar 100,00% saham DSU adalah sebesar USD 54,54 juta. Dengan demikian, nilai pasar wajar 100,00% saham DSU berdasarkan metode pembanding perusahaan terbuka adalah sebesar USD 54,54 juta.
As of 31 December 2016, DSU has an investment in shares in DSI amounting USD 47.14 million. By adding the investments in shares in DSI amounting USD 47.14 million, therefore the indicative fair market value of 100.00% shares of DSU before discount for lack of marketabilities was USD 68.17 million. By applying discount for lack marketabilities of 20.00%, therefore the fair market value of 100.00% shares of DSU was USD 54.54 million. Therefore, the fair market value of 100.00% shares of DSU based on guideline publicly traded company method was USD 54.54 million.
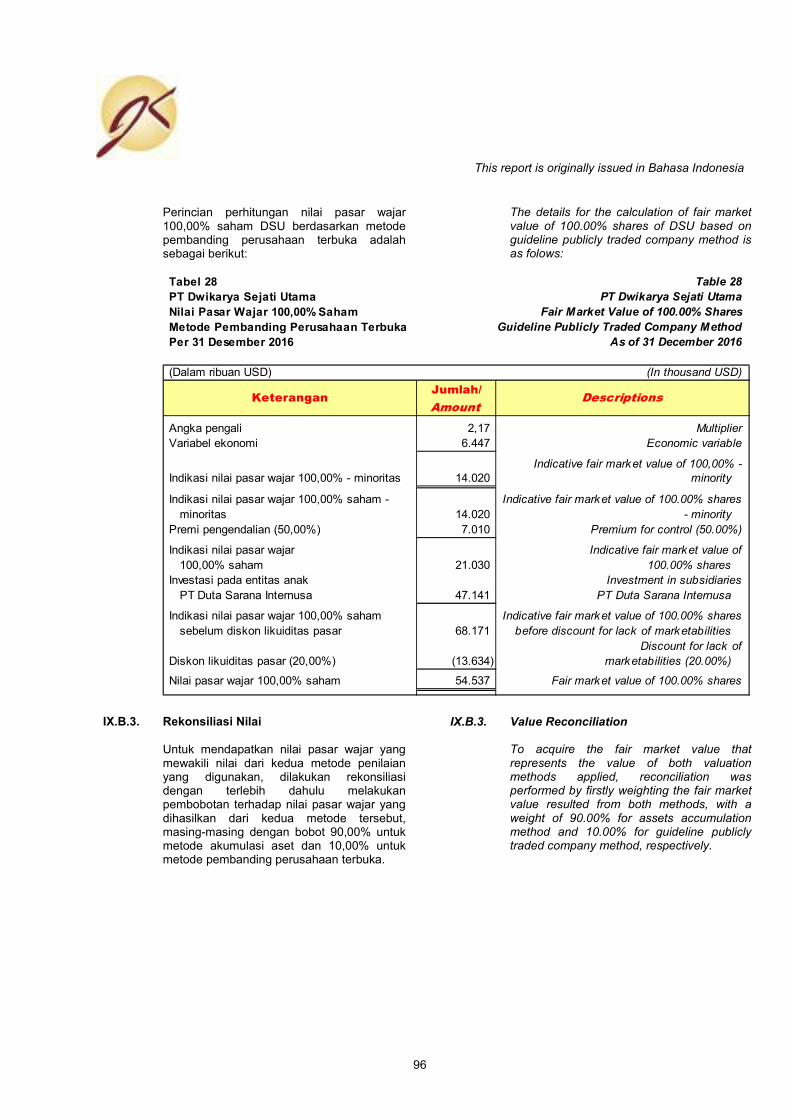
This report is originally issued in Bahasa Indonesia
96
Perincian perhitungan nilai pasar wajar 100,00% saham DSU berdasarkan metode pembanding perusahaan terbuka adalah sebagai berikut:
The details for the calculation of fair market value of 100.00% shares of DSU based on guideline publicly traded company method is as folows:
IX.B.3. Rekonsiliasi Nilai IX.B.3. Value Reconciliation
Untuk mendapatkan nilai pasar wajar yang mewakili nilai dari kedua metode penilaian yang digunakan, dilakukan rekonsiliasi dengan terlebih dahulu melakukan pembobotan terhadap nilai pasar wajar yang dihasilkan dari kedua metode tersebut, masing-masing dengan bobot 90,00% untuk metode akumulasi aset dan 10,00% untuk metode pembanding perusahaan terbuka.
To acquire the fair market value that represents the value of both valuation methods applied, reconciliation was performed by firstly weighting the fair market value resulted from both methods, with a weight of 90.00% for assets accumulation method and 10.00% for guideline publicly traded company method, respectively.
Tabel 28 Table 28
PT Dwikarya Sejati Utama PT Dwikarya Sejati Utama
Nilai Pasar Wajar 100,00% Saham Fair Market Value of 100.00% Shares
Metode Pembanding Perusahaan Terbuka Guideline Publicly Traded Company Method
Per 31 Desember 2016 As of 31 December 2016
(Dalam ribuan USD) (In thousand USD)
Angka pengali 2,17 Multiplier
Variabel ekonomi 6.447 Economic variable
Indicative fair market value of 100,00% -
Indikasi nilai pasar wajar 100,00% - minoritas 14.020 minority
Indikasi nilai pasar wajar 100,00% saham - Indicative fair market value of 100.00% shares
minoritas 14.020 - minority
Premi pengendalian (50,00%) 7.010 Premium for control (50.00%)
Indikasi nilai pasar wajar Indicative fair market value of
100,00% saham 21.030 100.00% shares
Investasi pada entitas anak Investment in subsidiaries
PT Duta Sarana Internusa 47.141 PT Duta Sarana Internusa
Indikasi nilai pasar wajar 100,00% saham Indicative fair market value of 100.00% shares
sebelum diskon likuiditas pasar 68.171 before discount for lack of marketabilities
Discount for lack of
Diskon likuiditas pasar (20,00%) (13.634) marketabilities (20.00%)
Nilai pasar wajar 100,00% saham 54.537 Fair market value of 100.00% shares
KeteranganJumlah/
AmountDescriptions

This report is originally issued in Bahasa Indonesia
97
Alasan kami memberikan bobot 90,00% untuk metode akumulasi aset dan 10,00% untuk metode pembanding perusahaan terbuka, yaitu karena data-data dan informasi yang digunakan pada metode akumulasi aset yang kami gunakan untuk menentukan nilai pasar wajar Obyek Penilaian merupakan data-data dan informasi yang memiliki tingkat kehandalan yang lebih memadai dibandingkan dengan data-data dan informasi yang digunakan pada metode pembanding perusahaan terbuka.
The reason we weighted 90.00% for assets accumulation method and 10.00% for guideline publicly traded company method was because the data and information used in assets accumulaton method that we used to determine the fair market value of the Valuation Object was the data and information that represented more adequate level of reliability compared to the data and information used in guideline publicly traded company method.
Berdasarkan hasil rekonsiliasi tersebut, diperoleh hasil bahwa nilai pasar wajar Obyek Penilaian adalah sebesar USD 61,46 juta.
Based on the reconciliation result, the fair market value of the Valuation Object was USD 61.46 million.
IX.C. PT Duta Sarana Internusa IX.C. PT Duta Sarana Internusa
IX.C.1. Indikasi Nilai Pasar Wajar 100,00% Saham DSI Berdasarkan Metode Akumulasi Aset
IX.C.1. The Indicative Fair Market Value of 100.00% Shares of DSI Based on Assets Accumulation Method
Sebagaimana telah diuraikan sebelumnya, metode yang digunakan untuk menentukan indikasi nilai pasar wajar 100,00% saham DSI adalah metode akumulasi aset. Metode ini merupakan metode penilaian yang didasarkan pada pendekatan aset. Dengan metode ini, nilai dari semua komponen aset dan liabilitas harus disesuaikan menjadi nilai pasar atau nilai pasar wajarnya, kecuali untuk komponen-komponen yang telah menunjukkan nilai pasarnya (seperti kas/bank atau utang bank).
As described earlier, the method applied to determine the indicative fair market value of 100.00 shares of DSI is assets acummulation method. This method is a valuation method based on assets based approach. Through this method, the value of all components of assets and liabilities should be adjusted to its market value, except for component that has indicated its market value (such as cash/bank or bank loan).
Tabel 29 Table 29
PT Dwikarya Sejati Utama PT Dwikarya Sejati Utama
Rekonsiliasi Nilai Value Reconciliation
Per 31 Desember 2016 As of 31 December 2016
(Dalam ribuan USD) (In thousands of USD)
Metode Akumulasi Aset 62.226 90,00% 56.004 Assets Accumulation Method
Metode Pembanding Perusahaan Guideline Publicly Traded
Terbuka 54.537 10,00% 5.454 Company Method
Nilai Pasar Wajar 100,00% 61.457 Fair Market Value
Nilai/
ValueValuation Method
Bobot/
WeightMetode Penilaian
Nilai Pasar
Wajar/
Fair Market
Value

This report is originally issued in Bahasa Indonesia
98
Pada penilaian ini, kami melakukan penilaian atas indikasi nilai pasar wajar penyertaan saham pada entitas anak yang tercatat pada laporan posisi keuangan DSI pada tanggal 31 Desember 2016. Perhitungan indikasi nilai pasar penyertaan saham pada BSL yang tercatat dalam laporan keuangan DSI pada tanggal 31 Desember 2016 dilakukan dengan metode diskonto pendapatan ekonomi mendatang dan metode akumulasi aset.
In this valuation, we performed the valuation of indicative market value of investment in subsidiaries recorded in the statements of financial position of DSI as of 31 December 2016. The calculation of indicative fair market value of investment in BSL recorded in the statements of financial position of DSI as of 31 December 2016 was performed by applying discounted future economic income method and assets accumulation method.
Dengan menggunakan metode diskonto pendapatan ekonomi mendatang dan metode akumulasi aset, diperoleh hasil bahwa indikasi nilai pasar wajar 100,00% saham BSL adalah sebesar USD 88,36 juta.
By applying discounted future economic income method and assets accumulation method, the indicative fair market value of 100.00% shares of BSL was USD 88.36 million.
Berdasarkan penilaian tersebut, maka indikasi nilai pasar wajar 94,97% saham BSL per tanggal 31 Desember 2016 adalah sebesar USD 83,91 juta. Apabila indikasi nilai pasar wajar penyertaan saham pada entitas anak tersebut direfleksikan dalam laporan posisi keuangan, maka jumlah aset DSI adalah sebesar USD 115,31 juta, sedangkan jumlah liabilitas DSI adalah tetap, yaitu sebesar USD 43,15 juta.
Based on the valuation, indicative fair market value of 94.97% shares of BSL as of 31 December 2016 was USD 83.91 million. If the indicative fair market value of the investment in subsidiaries is reflected to the statements of financial position, total assets of DSI was USD 115.31 million, while total liabilities of DSI is fixed, i.e. was USD 43.15 million.
Indikasi nilai pasar wajar 100,00% saham DSI kemudian diperoleh dengan menghitung selisih antara nilai seluruh aset dan liabilitas. Dengan demikian, pada tanggal 31 Desember 2016, indikasi nilai pasar wajar 100,00% saham DSI adalah sebesar USD 72,17 juta. Dengan demikian, indikasi nilai pasar wajar 100,00% saham DSI berdasarkan metode akumulasi aset adalah sebesar USD 72,17 juta.
Indicative fair market value of 100.00% shares of DSI was then obtained by calculating the difference of all assets and liabilities. Therefore, as of 31 December 2016, indicative fair market value of 100.00% shares of DSI was USD 71.17 million. Therefore, the indicative fair market value of 100.00% shares of DSI based on assets accumulation method was USD 71.17 million.

This report is originally issued in Bahasa Indonesia
99
Perhitungan indikasi nilai pasar wajar 100,00% saham DSI dengan menggunakan metode akumulasi aset adalah sebagai berikut:
The calculation of the indicative fair market value of 100.00% shares of DSI using assets accumulation method are as follows:
Tabel 30 Table 30
PT Duta Sarana Internusa PT Duta Sarana Internusa
Indikasi Nilai Pasar Wajar 100,00% Saham Indicative Fair Market Value of 100.00% Shares
Metode Akumulasi Aset Assets Accumulation Method
Per 31 Desember 2016 As of 31 December 2016
(Dalam ribuan USD) (In thousand of USD)
Indikasi Nilai
Pasar Wajar/
Indicative
Fair Market
Value
A S E T A S S E T S
ASET LANCAR CURRENT ASSETS
Kas dan setara kas 45 - 45 Cash and cash equivalents
Piutang lain-lain 31.354 - 31.354 Other receivables
Jumlah Aset Lancar 31.399 - 31.399 Total Current Assets
ASET TIDAK LANCAR NON-CURRENT ASSETS
Investasi pada entitas anak Investment in subsidiaries
PT Barasentosa Lestari 11.019 72.894 83.913 PT Barasentosa Lestari
Jumlah Aset Tidak Lancar 11.019 72.894 83.913 Total Non-Current Assets- -
TOTAL ASET 42.418 72.894 115.312 TOTAL ASSETS
LIABILITAS DAN EKUITAS LIABILITIES AND EQUITY
LIABILITAS LIABILITIES
LIABILITAS JANGKA PENDEK CURRENT LIABILITIES
Utang lain-lain 6.391 - 6.391 Other payables
Jaminan pemasok 7.675 - 7.675 Security deposit from vendor
Biaya yang masih harus dibayar 708 - 708 Accrued expenses
Jumlah Liabilitas Jangka Pendek 14.774 - 14.774 Total Current Liabilities
LIABILITAS JANGKA PANJANG NON-CURRENT LIABILITIES
Utang lain-lain - pihak berelasi 28.372 - 28.372 Other payables - related parties
Jumlah Liabilitas Jangka Panjang 28.372 - 28.372 Total Non-Current Liabilities
JUMLAH LIABILITAS 43.146 - 43.146 TOTAL LIABILITIES
EKUITAS (728) 72.894 72.166 EQUITY
JUMLAH LIABILITAS DAN EKUITAS 42.418 72.894 115.312 TOTAL LIABILITIES AND EQUITY
Indikasi nilai pasar wajar 100,00% saham 72.166 Indicative fair market value of 100.00% shares
Penyesuian/
Descriptions
Adjustments
Keterangan 31/12/16

This report is originally issued in Bahasa Indonesia
100
IX.C.2. Indikasi Nilai Pasar Wajar 100,00% Saham
DSI Berdasarkan Metode Pembanding Perusahaan Terbuka
IX.C.2. The Indicative Fair Market Value of 100.00% Shares of DSI Based on Guideline Publicly Traded Company Method
Sebagaimana telah diuraikan sebelumnya, metode yang digunakan untuk menentukan indikasi nilai pasar wajar 100,00% saham DSI adalah metode pembanding perusahaan terbuka. Metode ini merupakan metode penilaian yang didasarkan pada pendekatan pasar. Dengan metode ini, indikasi nilai pasar wajar saham ditetapkan berdasarkan harga yang telah atau pernah terjadi dari perusahaan sejenis yang sebanding dan sepadan. Indikasi nilai pasar wajar dari perusahaan pembanding diambil dari pasar modal (perusahaan publik/terbuka).
As described earlier, the method applied to determine the indicative fair market value of 100.00% shares of DSI is guideline publicly traded company method. This method is a valuation method based on market based approach. Through this method, the indicative fair market value of equity is determined by share price that has been or ever occurred from similar comparable and commensurate companies. The indicative fair market values of the comparison companies are obtained from the capital market (publicly-held companies).
Syarat utama dari penggunaan metode ini adalah perusahaan pembanding harus sebanding dan sepadan dengan perusahaan yang akan dinilai dalam berbagai variabel pembanding, antara lain perputaran penjualan, ekuitas, struktur modal (leverage), aset dan komposisi aset, tingkat laba dan rasio-rasio keuangan.
The prominent requirement of the application of this method is that the comparison companies must be comparable and commensurate with the company that would be assessed in various comparative variables, such as sales turnover, equity, capital structure (leverage), assets and asset composition, income levels and financial ratios.
Jika telah diperoleh perusahaan yang sebanding dan sepadan, indikasi nilai pasar wajar saham perusahaan yang dinilai diperoleh dengan cara mengalikan pendapatan perusahaan dengan beberapa rasio yang diperoleh dari perusahaan pembanding, seperti rasio P/E (price/earnings), P/SR (price/sales revenues), P/BV (price/book value of equity), MVIC/S (market value of invested capital/sales), MVIC/BVIC (market value of invested capital/book value of invested capital) dan sebagainya.
If the comparable and commensurate companies have been obtained, the indicative share market value of the company being assessed is obtained by multiplying the revenues of the company with several ratios obtained from the comparison companies, such as P/E (price/earnings), P/SR (price/sales revenues), P/BV (price/book value of equity), MVIC/S (market value of invested capital/sales), MVIC/BVIC (market value of invested capital/book value of invested capital) etc.

This report is originally issued in Bahasa Indonesia
101
Dalam metode pembanding perusahaan terbuka, digunakan angka pengali MVIC/BVIC sebesar 2,17 dengan perincian sebagai berikut:
In guideline publicly traded company method, MVIC/BVIC of 2.17 was used as multiplier with the following details:
Untuk metode pembanding perusahaan terbuka, karena angka pengali di atas diperoleh dari perusahaan-perusahaan terbuka, sehingga mencerminkan angka pengali untuk transaksi minoritas yang bersifat likuid, maka di dalam penilaian ini, perlu ditambahkan premi pengendalian yang besarnya menurut pendapat kami adalah sebesar 50,00%.
For guideline publicly traded company method, since the multiplier is obtained from public companies, thus reflecting the multiplier for liquid minority transactions, therefore in this valuation, premium for control must be added whereas in our opinion, such premium for control is 50.00%.
Berdasarkan laporan keuangan DSI untuk periode sembilan bulan yang berakhir pada tanggal 31 Desember 2016, BVIC DSI adalah sebesar USD 27,64 juta. Dengan demikian, indikasi nilai pasar wajar 100,00% minoritas DSI adalah sebesar USD 60,12 juta. Selanjutnya, pada tanggal 31 Desember 2016, DSI memiliki utang lain-lain – pihak berelasi sebesar USD 28,37 juta. Dengan mengurangkan utang lain-lain – pihak berelasi tersebut, maka diperoleh hasil bahwa indikasi nilai pasar wajar 100,00% saham minoritas DSI adalah sebesar USD 31,75 juta. Selanjutnya, dengan premi pengendalian sebesar 50,00%, maka indikasi nilai pasar wajar 100,00% saham DSI adalah sebesar USD 47,62 juta. Dengan demikian, indikasi nilai pasar 100,00% saham DSI berdasarkan metode pembanding perusahaan terbuka adalah sebesar USD 47,62 juta.
Based on DSI’s financial statements for three months period ended 31 December 2016, DSI’s BVIC was USD 27.64 million. Therefore, the indicative fair market value of 100.00% minority of DSI was USD 60.12 million. Furthermore, as of 31 December 2016, DSI has an other payables – related parties amounting USD 28.37 million. By deducting the other payables – related parties, therefore the indicative fair market value of 100.00% minority shares of DSI was USD 31.75 million. Furthermore, by applying premium for control of 50.00%, therefore the indicative fair market value of 100.00% shares of DSI was USD 47.62 million. Therefore, the indicative fair market value of 100.00% shares of DSI based on guideline publicly traded company method was USD 47.62 million
Tabel 31 Table 31
PT Duta Sarana Internusa PT Duta Sarana Internusa
Data Angka Pengali Perusahaan Pembanding Multiplier Data of Comparison Companies
PT ABM Investama Tbk 1,32 PT ABM Investama Tbk
PT Atlas Resources Tbk 1,38 PT Atlas Resources Tbk
PT Baramulti Suksessarana Tbk 1,97 PT Baramulti Suksessarana Tbk
PT Bumi Resources Tbk 2,70 PT Bumi Resources Tbk
PT Bayan Resources Tbk 2,94 PT Bayan Resources Tbk
PT Indo Tambangraya Megah Tbk 1,56 PT Indo Tambangraya Megah Tbk
PT Bukit Asam (Persero) Tbk 2,38 PT Buk it Asam (Persero) Tbk
PT Toba Bara Sejahtra Tbk 2,91 PT Toba Bara Sejahtra Tbk
Median 2,17 Median
Perusahaan MVIC/BVIC Companies

This report is originally issued in Bahasa Indonesia
102
Perincian perhitungan indikasi nilai pasar wajar 100,00% saham DSI menggunakan metode pembanding perusahaan terbuka adalah sebagai berikut:
The details for the calculation of indicative fair market value of 100.00% shares of DSI using guideline publicly traded company method are as folows:
IX.C.3. Rekonsiliasi Nilai IX.C.3. Value Reconciliation
Untuk mendapatkan nilai pasar wajar yang mewakili nilai dari kedua metode penilaian yang digunakan, dilakukan rekonsiliasi dengan terlebih dahulu melakukan pembobotan terhadap nilai pasar wajar yang dihasilkan dari kedua metode tersebut, masing-masing dengan bobot 90,00% untuk metode akumulasi aset dan 10,00% untuk metode pembanding perusahaan terbuka.
To acquire the fair market value that represents the value of both valuation methods applied, reconciliation was performed by firstly weighting the fair market value resulted from both methods, with a weight of 90.00% for assets accumulation method and 10.00% for guideline publicly traded company method, respectively.
Alasan kami memberikan bobot 90,00% untuk metode akumulasi aset dan 10,00% untuk metode pembanding perusahaan terbuka, yaitu karena data-data dan informasi yang digunakan pada metode akumulasi aset yang kami gunakan untuk menentukan indikasi nilai pasar wajar 100,00% saham DSI merupakan data-data dan informasi yang memiliki tingkat kehandalan yang lebih memadai dibandingkan dengan data-data dan informasi yang digunakan pada metode pembanding perusahaan terbuka.
The reason we weighted 90.00% for assets accumulation method and 10.00% for guideline publicly traded company method was because the data and information used in assets accumulaton method that we used to determine the indicative fair market value of 100.00% shares of DSI was the data and information that represented more adequate level of reliability compared to the data and information used in guideline publicly traded company method.
Tabel 32 Table 32
PT Duta Sarana Internusa PT Duta Sarana Internusa
Indikasi Nilai Pasar Wajar 100,00% Saham Indicative Fair Market Value of 100.00% Shares
Metode Pembanding Perusahaan Terbuka Guideline Publicly Traded Company Method
Per 31 Desember 2016 As of 31 December 2016
(Dalam ribuan USD) (In thousand USD)
Angka pengali 2,17 Multiplier
Variabel ekonomi 27.644 Economic variable
Indicative fair market value of 100,00% -
Indikasi nilai pasar wajar 100,00% - minoritas 60.117 minority
Utang lain-lain - pihak berelasi (28.372) Other payables - related parties
Indikasi nilai pasar wajar 100,00% saham - Indicative fair market value of 100.00% shares
minoritas 31.745 - minority
Premi pengendalian (50,00%) 15.872 Premium for control (50.00%)
Indikasi nilai pasar wajar Indicative fair market value of
100,00% saham 47.617 100.00% shares
KeteranganJumlah/
AmountDescriptions

This report is originally issued in Bahasa Indonesia
103
Berdasarkan hasil rekonsiliasi tersebut, diperoleh hasil bahwa indkasi nilai pasar wajar 100,00% saham DSI adalah sebesar USD 69,71 juta.
Based on the reconciliation result, the indicative fair market value of 100.00% shares of DSI was USD 69.71 million.
IX.D. PT Barasentosa Lestari IX.D. PT Barasentosa Lestari
IX.D.1. Metode Diskonto Pendapatan Ekonomi Mendatang
IX.D.1. Dicounted Future Economic Income Method
IX.D.1.a. Proyeksi Laporan Keuangan IX.D.1.a Financial Statements Projections
Penilaian BSL yang dilakukan dengan metode diskonto pendapatan ekonomi mendatang didasarkan pada proyeksi laporan keuangan yang disusun oleh manajemen BSL. Dalam penyusunan proyeksi laporan keuangan, berbagai asumsi dikembangkan berdasarkan kinerja BSL pada tahun-tahun sebelumnya dan berdasarkan rencana manajemen di masa yang akan datang. Di samping itu, berbagai informasi dan saran yang relevan diberikan oleh manajemen BSL sehubungan dengan perubahan-perubahan pada setiap faktor dalam jangka waktu yang telah ditetapkan juga turut menjadi bahan pertimbangan. Kami telah melakukan penyesuaian terhadap proyeksi laporan keuangan tersebut agar dapat menggambarkan kondisi operasi dan kinerja BSL yang dinilai pada saat penilaian ini dengan lebih wajar. Secara garis besar, tidak ada penyesuaian yang signifikan yang kami lakukan terhadap target kinerja BSL yang dinilai.
The valuation of BSL performed with discounted future economic income method was based on financial statements projections prepared by the management of BSL. In preparing the financial statements projections, various assumptions were developed based on the performance of BSL in previous years and management’s plan for the future. In addition, various relevant information and suggestions were provided by the management of BSL related to movements in each factor within the prescribed time which have also been taken into consideration. We have made some adjustments to the financial statements projections in order to describe the operating conditions and performance of BSL more fairly during the valuation. Overall, there were not any significant adjustments have been applied to the performance targets of BSL.
Tabel 33 Table 33
PT Duta Sarana Internusa PT Duta Sarana Internusa
Rekonsiliasi Nilai Value Reconciliation
Per 31 Desember 2016 As of 31 December 2016
(Dalam ribuan USD) (In thousands of USD)
Metode Akumulasi Aset 72.166 90,00% 64.950 Assets Accumulation Method
Metode Pembanding Perusahaan Guideline Publicly Traded
Terbuka 47.617 10,00% 4.762 Company Method
Indikasi Nilai Pasar Wajar 100,00% 69.711 Indicative Fair Market Value
Metode Penilaian
Indikasi Nilai
Pasar Wajar/
Indicative
Fair Market
Value
Bobot/
Weight
Nilai/
ValueValuation Method

This report is originally issued in Bahasa Indonesia
104
Berikut adalah penjelasan mengenai hal-hal pokok dalam proyeksi laporan keuangan yang digunakan dalam penilaian atas BSL.
Followings were the explanation of the principal matters in the financial statements projections which were used in the valuation of BSL.
IX.D.1.a.1) Umum IX.D.1.a.1) General
• Tidak akan ada perubahan yang material mengenai kondisi politik, ekonomi, hukum atau undang-undang yang akan mempengaruhi aktivitas BSL, industri atau negara dimana BSL beroperasi.
• There would be no significant changes in existing political, economic, legal or regulatory conditions that would affect the activities of BSL, the industry or the country where BSL operates.
• Tidak akan ada perubahan yang material mengenai tarif pajak, bea cukai, nilai tukar mata uang dan suku bunga yang dipergunakan dalam proyeksi laporan keuangan yang dapat mempengaruhi kinerja BSL selain yang telah diproyeksikan.
• There would be no significant changes on the tax rate, excise tax, exchange rate and interest rates applied in the financial statements projections which might affect the performance of BSL other than those that have been projected.
• Tidak akan ada perubahan yang material pada struktur dan aktivitas utama BSL atau pada sumber utama penghasilan BSL selain yang telah diproyeksikan.
• There would be no significant changes in the structure and principal activities of BSL or in its principal sources of revenue other than those have been projected.
• Tidak akan ada perubahan yang material pada manajemen BSL.
• There would be no significant changes in the management of BSL.
• Tidak akan ada hambatan-hambatan yang berarti yang berasal dari perselisihan industri atau pengadaan tenaga kerja atau hal-hal lain yang dapat mempengaruhi kegiatan usaha BSL.
• There would be no significant obstacles arising from industrial disputes or supply of labor or any causes which would affect the operations of BSL.
• Tidak akan ada hambatan-hambatan yang berarti atas penawaran bahan baku, bahan-bahan lainnya, produk-produk serta jasa-jasa yang dijual kepada BSL.
• There would be no significant obstacles to the supply of raw materials, other materials, products and services provided to BSL.
• Tidak akan ada perubahan yang material terhadap harga bahan baku, bahan-bahan lainnya, produk-produk serta jasa-jasa yang dijual, beban tenaga kerja, beban pabrikasi dan beban-beban lain seperti yang berlaku sekarang ini dan yang diproyeksikan.
• There would be no material changes in prices of raw materials, other materials, products and services provided, labour costs, production costs and other costs from those currently prevailing and projected.
• Tidak akan ada pembelian aset tetap yang material selain yang diproyeksikan.
• There would be no significant capital expenditures other than those projected.
• Tidak ada pengecualian atas pencadangan yang harus dibuat oleh BSL atas kewajiban kontijen atau arbritase, ancaman atau sebaliknya, piutang tak tertagih yang luar biasa, kontrak atau aset lain yang belum dipenuhi.
• There would be no exception on provisions to be made by BSL in respect to any contingent liability or arbitration, threat or otherwise, abnormal bad debts, uncompleted contracts or other assets.
• Tidak ada perubahan yang material terhadap perjanjian-perjanjian dan ketentuan-ketentuan yang ada.
• There would be no material changes to existing agreements or terms.
• Sesuai dengan sifat industri, manajemen BSL mempersiapkan proyeksi laporan keuangan untuk tahun 2017 sampai dengan 2039.
• In accordance with the nature of the industry, the management of BSL has prepared the financial statements projections for 2017 to 2039.

This report is originally issued in Bahasa Indonesia
105
IX.D.1.a.2) Asumsi-asumsi yang Digunakan Dalam Penyusunan Proyeksi Laporan Keuangan
IX.D.1.a.2) Assumptions Used in the Preparation of Financial Statements Projections
1. Proyeksi Penjualan 1. Sales Projections
Pendapatan dalam penilaian ini dihasilkan dari penjualan batubara.
The sales in this valuation are generated from sales of coal.
Grafik berikut menunjukkan proyeksi penjualan BSL untuk periode tiga bulan yang berakhir pada tanggal 31 Maret 2017 dan untuk tahun yang berakhir pada tanggal-tanggal 31 Maret 2018 – 2039.
The chart below shows revenues projections of BSL for the period of three months ended 31 March 2017 and for the years ended 31 March 2018 – 2039.
Grafik 9 Chart 9 PT Barasentosa Lestari PT Barasentosa Lestari Proyeksi Penjualan Tahun 2017 – 2039 Sales Projections for 2017 – 2039 (Dalam jutaan USD) (In millions of USD)
-
50
100
150
200
250
300
350
201
7
201
8
201
9
202
0
202
1
202
2
202
3
202
4
202
5
202
6
202
7
202
8
202
9
203
0
203
1
203
2
203
3
203
4
203
5
203
6
203
7
203
8
203
9
Penjualan/Sales

This report is originally issued in Bahasa Indonesia
106
2. Proyeksi Beban Pokok Penjualan 2. Cost of Sales Projections
Beban pokok penjualan BSL terutama terdiri dari biaya produksi, biaya penjualan, depresiasi dan amortisasi.
The cost of sales of BSL primarily consists of production cost, selling cost, depreciation and amortization.
Grafik berikut menunjukkan proyeksi beban pokok penjualan BSL untuk periode tiga bulan yang berakhir pada tanggal 31 Maret 2017 dan untuk tahun yang berakhir pada tanggal-tanggal 31 Maret 2018 – 2039.
The chart below shows cost of sales projections of BSL for the period of three months ended 31 March 2017 and for the years ended 31 March 2018 – 2039.
Grafik 10 Chart 10 PT Barasentosa Lestari PT Barasentosa Lestari Proyeksi Beban Pokok Penjualan Tahun 2017 – 2039
Cost of Revenues Projections for 2017 – 2039
(Dalam jutaan USD) (In millions of USD)
3. Beban Usaha 3. Operating Expense
Beban usaha BSL terutama terdiri dari beban gaji, beban sewa alat berat dan kendaraan, beban jasa profesional, beban transportasi, beban asuransi, beban perjalanan, beban imbalan kerja karyawan, beban tanggung jawab sosial dan donasi dan beban perijinan. Beban usaha periode tiga bulan yang berakhir pada tanggal 31 Maret 2017 dan untuk tahun yang berakhir pada tanggal-tanggal 31 Maret 2018 – 2039 diprediksikan berkisar antara 0,43% - 1,52% dari penjualan.
BSL’s operating expense mainly consists of salaries expense, rental of vehicle and heavy equipment, profesional fee expense, transportation expense, insurance expense, travelling expense, post employment benefit expense, corporate social responsibility expense and license and permits expense. The operating expense for the period of three months ended 31 March 2017 and for the years ended 31 March 2018 – 2039.is predicted between 0.43% - 1.52% of sales.
-
0
0
0
0
0
0
0
201
7
201
8
201
9
202
0
202
1
202
2
202
3
202
4
202
5
202
6
202
7
202
8
202
9
203
0
203
1
203
2
203
3
203
4
203
5
203
6
203
7
203
8
203
9
Beban Pokok Penjualan/Cost of Revenues

This report is originally issued in Bahasa Indonesia
107
4. Pajak 4. Tax
Mengingat BSL adalah perusahaan yang berdomisili di Indonesia, maka tarif pajak yang diberlakukan atas BSL adalah berdasarkan laba kena pajak dalam periode yang bersangkutan yang dihitung berdasarkan tarif pajak yang berlaku umum di Indonesia, yaitu sebesar 25,00%.
Considering BSL is a company domiciled in Indonesia, therefore the tax rate applied on BSL is based on taxable income for the period which is calculated based on the applicable general tax rate of Indonesia, i.e. 25.00%.
5. Proyeksi Laporan Laba Rugi
Komprehensif 5. Statements of Comprehensive Income
Projections
Berdasarkan asumsi-asumsi untuk proyeksi laporan laba rugi komprehensif sebagaimana dijelaskan di atas, proyeksi laporan laba rugi komprehensif BSL untuk periode tiga bulan yang berakhir pada tanggal 31 Maret 2017 dan untuk tahun yang berakhir pada tanggal-tanggal 31 Maret 2018 – 2039 adalah sebagai berikut:
Based on the assumptions for the statements of comprehensive income projections as described above, the forecasted statements of comprehensive income of BSL the period of three months ended 31 March 2017 and for the years ended 31 March 2018 – 2039 were as follows:
Tabel 34 Table 34
PT Barasentosa Lestari PT Barasentosa Lestari
Proyeksi Laporan Laba Rugi Komprehensif Statements of Comprehensive Income Projections
untuk periode tiga bulan yang berakhir pada for three months period ended
tanggal 31 Maret 2017 dan 31 March 2017 and
untuk tahun yang berakhir pada for the years ended
tanggal-tanggal 31 Maret 2018 - 2039 31 March 2018 - 2039
(Dalam ribuan USD) (In thousands of USD)
31/03/17 31/03/18 31/03/19 31/03/20 31/03/21
Pendapatan - 85.278 173.260 218.415 284.168 Revenues
Beban pokok pendapatan - 73.305 150.657 190.649 253.295 Cost of revenues
Laba (rugi) kotor - 11.974 22.604 27.766 30.872 Gross profit (loss)
Beban usaha 194 1.298 1.326 1.356 1.385 Operating expenses
Laba (rugi) usaha (194) 10.676 21.277 26.410 29.487 Operating profit (loss)
Beban lain-lain - (5.726) (7.263) (6.730) (5.484) Other expense
Laba (rugi) sebelum beban pajak
penghasilan (194) 4.950 14.015 19.681 24.003 Profit (loss) before income tax expense
Beban pajak penghasilan - (1.189) (3.504) (4.920) (6.001) Income tax expense
Laba (rugi) bersih tahun berjalan (194) 3.761 10.511 14.761 18.002 Net income (loss) for the period
Keterangan Descriptions(3 Bulan/
Months )
(1 Tahun/
Year )
(1 Tahun/
Year )
(1 Tahun/
Year )
(1 Tahun/
Year )
(Dalam ribuan USD) (In thousands of USD)
31/03/22 31/03/23 31/03/24 31/03/25 31/03/26
Pendapatan 286.760 280.737 299.841 300.624 300.624 Revenues
Beban pokok pendapatan 266.817 258.672 275.294 276.249 276.178 Cost of revenues- -
Laba (rugi) kotor 19.943 22.065 24.547 24.375 24.446 Gross profit (loss)
Beban usaha 1.385 1.385 1.385 1.385 1.385 Operating expenses- -
Laba (rugi) usaha 18.557 20.680 23.162 22.990 23.061 Operating profit (loss)
Beban lain-lain (3.763) (2.043) (1.035) (739) (443) Other expense- -
Laba (rugi) sebelum beban pajak
penghasilan 14.794 18.637 22.127 22.251 22.617 Profit (loss) before income tax expense
Beban pajak penghasilan (3.698) (4.659) (5.532) (5.563) (5.654) Income tax expense- -
Laba (rugi) bersih tahun berjalan 11.095 13.978 16.595 16.688 16.963 Net income (loss) for the period
Descriptions(1 Tahun/
Year )
(1 Tahun/
Year )
(1 Tahun/
Year )
(1 Tahun/
Year )
(1 Tahun/
Year )
Keterangan
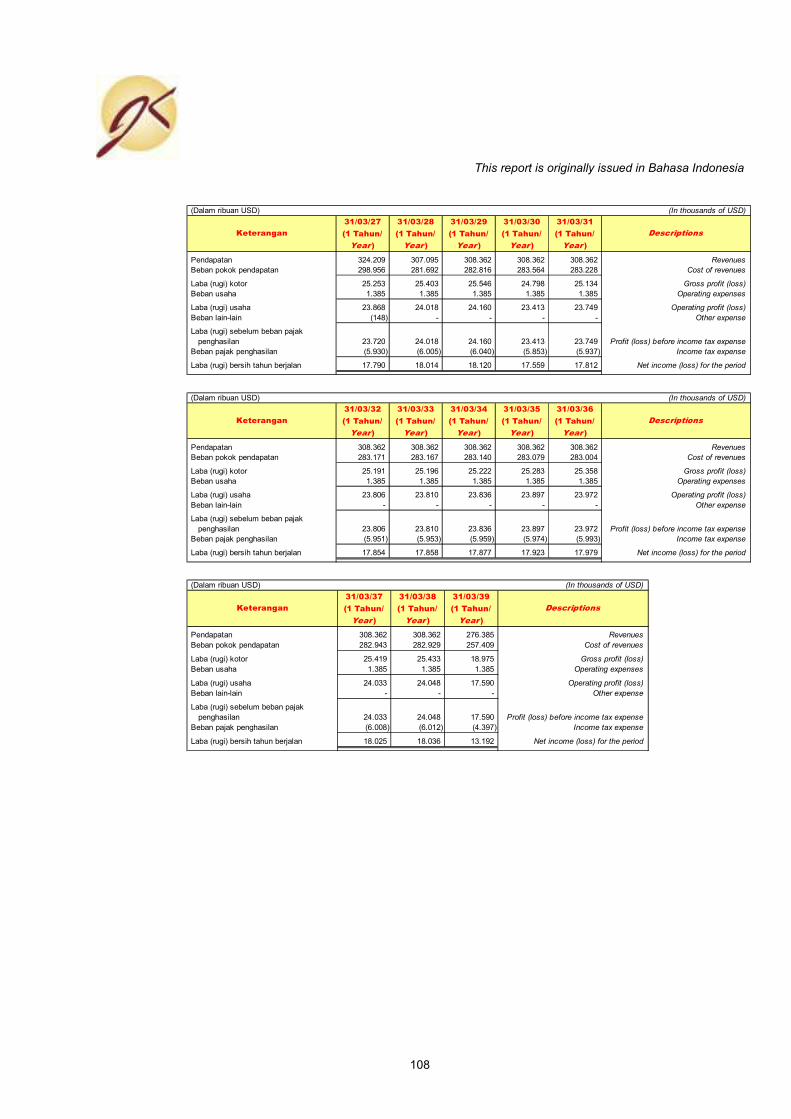
This report is originally issued in Bahasa Indonesia
108
(Dalam ribuan USD) (In thousands of USD)
31/03/27 31/03/28 31/03/29 31/03/30 31/03/31
Pendapatan 324.209 307.095 308.362 308.362 308.362 Revenues
Beban pokok pendapatan 298.956 281.692 282.816 283.564 283.228 Cost of revenues- -
Laba (rugi) kotor 25.253 25.403 25.546 24.798 25.134 Gross profit (loss)
Beban usaha 1.385 1.385 1.385 1.385 1.385 Operating expenses- -
Laba (rugi) usaha 23.868 24.018 24.160 23.413 23.749 Operating profit (loss)
Beban lain-lain (148) - - - - Other expense- -
Laba (rugi) sebelum beban pajak
penghasilan 23.720 24.018 24.160 23.413 23.749 Profit (loss) before income tax expense
Beban pajak penghasilan (5.930) (6.005) (6.040) (5.853) (5.937) Income tax expense- -
Laba (rugi) bersih tahun berjalan 17.790 18.014 18.120 17.559 17.812 Net income (loss) for the period
Keterangan Descriptions(1 Tahun/
Year )
(1 Tahun/
Year )
(1 Tahun/
Year )
(1 Tahun/
Year )
(1 Tahun/
Year )
(Dalam ribuan USD) (In thousands of USD)
31/03/32 31/03/33 31/03/34 31/03/35 31/03/36
Pendapatan 308.362 308.362 308.362 308.362 308.362 Revenues
Beban pokok pendapatan 283.171 283.167 283.140 283.079 283.004 Cost of revenues- -
Laba (rugi) kotor 25.191 25.196 25.222 25.283 25.358 Gross profit (loss)
Beban usaha 1.385 1.385 1.385 1.385 1.385 Operating expenses- -
Laba (rugi) usaha 23.806 23.810 23.836 23.897 23.972 Operating profit (loss)
Beban lain-lain - - - - - Other expense- -
Laba (rugi) sebelum beban pajak
penghasilan 23.806 23.810 23.836 23.897 23.972 Profit (loss) before income tax expense
Beban pajak penghasilan (5.951) (5.953) (5.959) (5.974) (5.993) Income tax expense- -
Laba (rugi) bersih tahun berjalan 17.854 17.858 17.877 17.923 17.979 Net income (loss) for the period
Keterangan Descriptions(1 Tahun/
Year )
(1 Tahun/
Year )
(1 Tahun/
Year )
(1 Tahun/
Year )
(1 Tahun/
Year )
(Dalam ribuan USD) (In thousands of USD)
31/03/37 31/03/38 31/03/39
Pendapatan 308.362 308.362 276.385 Revenues
Beban pokok pendapatan 282.943 282.929 257.409 Cost of revenues- -
Laba (rugi) kotor 25.419 25.433 18.975 Gross profit (loss)
Beban usaha 1.385 1.385 1.385 Operating expenses- -
Laba (rugi) usaha 24.033 24.048 17.590 Operating profit (loss)
Beban lain-lain - - - Other expense- -
Laba (rugi) sebelum beban pajak
penghasilan 24.033 24.048 17.590 Profit (loss) before income tax expense
Beban pajak penghasilan (6.008) (6.012) (4.397) Income tax expense- -
Laba (rugi) bersih tahun berjalan 18.025 18.036 13.192 Net income (loss) for the period
Keterangan Descriptions(1 Tahun/
Year )
(1 Tahun/
Year )
(1 Tahun/
Year )

This report is originally issued in Bahasa Indonesia
109
6. Kas dan Setara Kas 6. Cash and Cash Equivalents
Kas dan bank dipertahankan pada tingkat tertentu untuk menutupi kebutuhan operasi. Kelebihan kas yang timbul dari operasi akan tetap ditempatkan pada setara kas.
Cash and cash equivalents are maintained at certain amount to cover operational needs. The excess cash arising from operation will still be placed on cash equivalents.
7. Piutang Usaha 7. Trade Receivables
Perputaran piutang usaha diasumsikan sebesar 60 hari selama periode proyeksi. Piutang usaha merupakan piutang usaha atas penjualan kepada pelanggan.
Trade receivables turnover was assumed at 60 days during projection period. Trade recevibales was a sales receivables to customers.
8. Persediaan 8. Inventories
Perputaran persediaan diasumsikan sebesar 14 hari selama periode proyeksi. Persediaan merupakan persediaan atas batubara.
Inventories turnover was assumed at 14 days during projection period. Inventories was an inventories of coal.
9. Utang Usaha 9. Trade Payables
Perputaran utang usaha diasumsikan sebesar 45 hari selama periode proyeksi. Utang usaha merupakan utang usaha kepada pemasok.
Trade payables turnover was assumed at 45 days during projection period. Trade payables was a payables to supplier.

This report is originally issued in Bahasa Indonesia
110
11. Proyeksi Laporan Posisi Keuangan 11. Statements of Financial Position
Projections
Berdasarkan asumsi-asumsi untuk proyeksi laporan posisi keuangan sebagaimana dijelaskan di atas, proyeksi laporan posisi keuangan BSL untuk tahun 2017 sampai dengan tahun 2039 adalah sebagai berikut:
Based on the assumptions for statements of financial position projections as described above, the forecasted statements of financial position of BSL for 2017 to 2039 were as follows:
Tabel 35 Table 35
PT Barasentosa Lestari PT Barasentosa Lestari
Proyeksi Laporan Posisi Keuangan Statements of Financial Position Projections
Per 31 Maret 2017 - 2039 As of 31 March 2017 - 2039
(Dalam ribuan USD) (In thousands of USD)
A S E T A S S E T S
ASET LANCAR CURRENT ASSETS
Kas dan setara kas 2.504 7.171 3.890 5.019 3.708 Cash and cash equivalents
Piutang usaha - 14.213 28.877 36.402 47.361 Trade receivables
Persediaan - 2.104 4.161 5.185 6.588 Inventories
Uang muka 645 645 645 645 645 Advance payments
Biaya dibayar di muka 5 5 5 5 5 Prepaid expenses
Pajak dibayar di muka 0 0 0 0 0 Prepaid taxes
Jumlah Aset Lancar 3.154 24.139 37.578 47.257 58.308 Total Current Assets
ASET TIDAK LANCAR NON-CURRENT ASSETS
Aset tetap 5.132 9.381 13.971 17.381 16.429 Fixed assets
Jaminan 16 16 16 16 16 Refundable deposits
Dana yang dibatasi dalam
penggunaannya 424 424 424 424 424 Restricted deposits
Biaya eksplorasi dan pengembangan Deferred exploration and development
ditangguhkan 77.250 76.216 74.149 71.565 68.206 expenditures
Jumlah Aset Tidak Lancar 82.821 86.037 88.560 89.385 85.074 Total Non-current Assets
TOTAL ASET 85.975 110.175 126.138 136.643 143.382 TOTAL ASSETS
Descriptions31/03/19 31/03/20Keterangan 31/03/17 31/03/18 31/03/21
(Dalam ribuan USD) (In thousands of USD)
A S E T A S S E T S
ASET LANCAR CURRENT ASSETS
Kas dan setara kas 2.495 2.689 19.242 37.466 55.976 Cash and cash equivalents
Piutang usaha 47.793 46.790 49.974 50.104 50.104 Trade receivables
Persediaan 6.292 6.482 7.052 7.042 7.042 Inventories
Uang muka 645 645 645 645 645 Advance payments
Biaya dibayar di muka 5 5 5 5 5 Prepaid expenses
Pajak dibayar di muka 0 0 0 0 0 Prepaid taxes
Jumlah Aset Lancar 57.231 56.610 76.917 95.262 113.772 Total Current Assets
ASET TIDAK LANCAR NON-CURRENT ASSETS
Aset tetap 14.431 12.431 10.430 8.439 6.510 Fixed assets
Jaminan 16 16 16 16 16 Refundable deposits
Dana yang dibatasi dalam
penggunaannya 424 424 424 424 424 Restricted deposits
Biaya eksplorasi dan pengembangan Deferred exploration and development
ditangguhkan 64.846 61.487 57.869 54.251 50.633 expenditures
Jumlah Aset Tidak Lancar 79.716 74.357 68.738 63.130 57.583 Total Non-current Assets
TOTAL ASET 136.947 130.968 145.656 158.392 171.355 TOTAL ASSETS
Keterangan 31/03/22 31/03/23 31/03/26 Descriptions31/03/24 31/03/25

This report is originally issued in Bahasa Indonesia
111
(Dalam ribuan USD) (In thousands of USD)
A S E T A S S E T S
ASET LANCAR CURRENT ASSETS
Kas dan setara kas 74.499 97.972 120.950 143.209 165.258 Cash and cash equivalents
Piutang usaha 54.035 51.183 51.394 51.394 51.394 Trade receivables
Persediaan 7.153 8.107 8.085 8.051 8.051 Inventories
Uang muka 645 645 645 645 645 Advance payments
Biaya dibayar di muka 5 5 5 5 5 Prepaid expenses
Pajak dibayar di muka 0 0 0 0 0 Prepaid taxes
Jumlah Aset Lancar 136.337 157.912 181.079 203.304 225.353 Total Current Assets
ASET TIDAK LANCAR NON-CURRENT ASSETS
Aset tetap 4.611 2.975 1.952 1.360 1.050 Fixed assets
Jaminan 16 16 16 16 16 Refundable deposits
Dana yang dibatasi dalam
penggunaannya 424 424 424 424 424 Restricted deposits
Biaya eksplorasi dan pengembangan Deferred exploration and development
ditangguhkan 46.566 42.638 38.710 34.782 30.855 expenditures
Jumlah Aset Tidak Lancar 51.617 46.053 41.102 36.582 32.344 Total Non-current Assets
TOTAL ASET 187.954 203.965 222.180 239.886 257.697 TOTAL ASSETS
31/03/31 DescriptionsKeterangan 31/03/27 31/03/28 31/03/29 31/03/30
(Dalam ribuan USD) (In thousands of USD)
A S E T A S S E T S
ASET LANCAR CURRENT ASSETS
Kas dan setara kas 187.294 209.327 231.355 253.367 275.361 Cash and cash equivalents
Piutang usaha 51.394 51.394 51.394 51.394 51.394 Trade receivables
Persediaan 8.051 8.051 8.051 8.051 8.051 Inventories
Uang muka 645 645 645 645 645 Advance payments
Biaya dibayar di muka 5 5 5 5 5 Prepaid expenses
Pajak dibayar di muka 0 0 0 0 0 Prepaid taxes
Jumlah Aset Lancar 247.389 269.423 291.450 313.462 335.456 Total Current Assets
ASET TIDAK LANCAR NON-CURRENT ASSETS
Aset tetap 797 548 326 165 79 Fixed assets
Jaminan 16 16 16 16 16 Refundable deposits
Dana yang dibatasi dalam
penggunaannya 424 424 424 424 424 Restricted deposits
Biaya eksplorasi dan pengembangan Deferred exploration and development
ditangguhkan 26.927 22.999 19.071 15.143 11.215 expenditures
Jumlah Aset Tidak Lancar 28.163 23.987 19.837 15.748 11.734 Total Non-current Assets
TOTAL ASET 275.552 293.409 311.287 329.210 347.189 TOTAL ASSETS
DescriptionsKeterangan 31/03/32 31/03/33 31/03/34 31/03/35 31/03/36

This report is originally issued in Bahasa Indonesia
112
(Dalam ribuan USD) (In thousands of USD)
A S E T A S S E T S
ASET LANCAR CURRENT ASSETS
Kas dan setara kas 297.339 319.313 356.998 Cash and cash equivalents
Piutang usaha 51.394 51.394 - Trade receivables
Persediaan 8.051 8.051 - Inventories
Uang muka 645 645 - Advance payments
Biaya dibayar di muka 5 5 5 Prepaid expenses
Pajak dibayar di muka 0 0 0 Prepaid taxes
Jumlah Aset Lancar 357.434 379.408 357.003 Total Current Assets
ASET TIDAK LANCAR NON-CURRENT ASSETS
Aset tetap 53 42 33 Fixed assets
Jaminan 16 16 16 Refundable deposits
Dana yang dibatasi dalam
penggunaannya 424 424 424 Restricted deposits
Biaya eksplorasi dan pengembangan Deferred exploration and development
ditangguhkan 7.287 3.359 - expenditures
Jumlah Aset Tidak Lancar 7.780 3.841 472 Total Non-current Assets
TOTAL ASET 365.214 383.250 357.475 TOTAL ASSETS
DescriptionsKeterangan 31/03/37 31/03/38 31/03/39
(Dalam ribuan USD) (In thousands of USD)
LIABILITAS DAN EKUITAS LIABILITIES AND EQUITY
LIABILITAS LIABILITIES
LIABILITAS JANGKA PENDEK CURRENT LIABILITIES
Utang usaha - 9.241 18.692 23.436 31.173 Trade payables
Biaya yang masih harus dibayar 3.316 3.316 3.316 3.316 3.316 Accrued expense
Utang pajak 312 312 312 312 312 Taxs payables
Utang lain-lain 162 162 162 162 162 Other payables
Uang muka pelanggan 13 13 13 13 13 Advance from customer
Jumlah Liabilitas Jangka Pendek 3.803 13.043 22.495 27.239 34.976 Total Current Liabilities
LIABILITAS JANGKA PANJANG NON-CURRENT LIABILITIES
Obligasi konversi 9.939 9.939 9.939 9.939 9.939 Convertible bonds
Utang bank 40.000 36.000 32.000 28.000 24.000 Bank loans
Utang lain-lain - pihak berelasi 29.801 - - - - Other payables - related parties
Utang lain-lain - pihak ketiga 5.000 50.000 50.000 45.000 30.000 Other payables - third parties
Liabilitas imbalan kerja karyawan 291 291 291 291 291 Post employment benefit obligation
Liabilitas pajak tangguhan 12 12 12 12 12 Deferred tax liabilities
Jumlah Liabilitas Jangka Panjang 85.043 96.242 92.242 83.242 64.242 Total Non-Current Liabilities
JUMLAH LIABILITAS 88.846 109.285 114.737 110.481 99.218 TOTAL LIABILITIES
EKUITAS EQUITY
Modal saham 899 899 899 899 899 Capital stock
Tambahan modal disetor 79 79 79 79 79 Additional paid-in capital
Obligasi wajib konversi 113 113 113 113 113 Mandatory convertible bonds
Komponen ekuitas lainnya 226 226 226 226 226 Other contributed capital
Akumulasi keuntungan aktuaria 157 157 157 157 157 Accumulated actuarial gain
Saldo laba (rugi) (4.344) (583) 9.928 24.689 42.691 Retained earnings (deficit)
JUMLAH EKUITAS (2.870) 890 11.401 26.162 44.164 TOTAL EQUITY
JUMLAH LIABILITAS DAN EKUITAS 85.975 110.175 126.138 136.643 143.382 TOTAL LIABILITIES AND EQUITY
Descriptions31/03/19 31/03/20Keterangan 31/03/17 31/03/18 31/03/21

This report is originally issued in Bahasa Indonesia
113
(Dalam ribuan USD) (In thousands of USD)
LIABILITAS DAN EKUITAS LIABILITIES AND EQUITY
LIABILITAS LIABILITIES
LIABILITAS JANGKA PENDEK CURRENT LIABILITIES
Utang usaha 32.643 31.685 33.778 33.826 33.826 Trade payables
Biaya yang masih harus dibayar 3.316 3.316 3.316 3.316 3.316 Accrued expense
Utang pajak 312 312 312 312 312 Taxs payables
Utang lain-lain 162 162 162 162 162 Other payables
Uang muka pelanggan 13 13 13 13 13 Advance from customer
Jumlah Liabilitas Jangka Pendek 36.445 35.488 37.581 37.629 37.629 Total Current Liabilities
LIABILITAS JANGKA PANJANG NON-CURRENT LIABILITIES
Obligasi konversi 9.939 9.939 9.939 9.939 9.939 Convertible bonds
Utang bank 20.000 16.000 12.000 8.000 4.000 Bank loans
Utang lain-lain - pihak berelasi - - - - - Other payables - related parties
Utang lain-lain - pihak ketiga 15.000 - - - - Other payables - third parties
Liabilitas imbalan kerja karyawan 291 291 291 291 291 Post employment benefit obligation
Liabilitas pajak tangguhan 12 12 12 12 12 Deferred tax liabilities
Jumlah Liabilitas Jangka Panjang 45.242 26.242 22.242 18.242 14.242 Total Non-Current Liabilities
JUMLAH LIABILITAS 81.687 61.730 59.823 55.871 51.871 TOTAL LIABILITIES
EKUITAS EQUITY
Modal saham 899 899 899 899 899 Capital stock
Tambahan modal disetor 79 79 79 79 79 Additional paid-in capital
Obligasi wajib konversi 113 113 113 113 113 Mandatory convertible bonds
Komponen ekuitas lainnya 226 226 226 226 226 Other contributed capital
Akumulasi keuntungan aktuaria 157 157 157 157 157 Accumulated actuarial gain
Saldo laba (rugi) 53.786 67.764 84.360 101.048 118.011 Retained earnings (deficit)
JUMLAH EKUITAS 55.260 69.238 85.833 102.521 119.484 TOTAL EQUITY
JUMLAH LIABILITAS DAN EKUITAS 136.947 130.968 145.656 158.392 171.355 TOTAL LIABILITIES AND EQUITY
Keterangan 31/03/22 31/03/23 31/03/26 Descriptions31/03/24 31/03/25
(Dalam ribuan USD) (In thousands of USD)
LIABILITAS DAN EKUITAS LIABILITIES AND EQUITY
LIABILITAS LIABILITIES
LIABILITAS JANGKA PENDEK CURRENT LIABILITIES
Utang usaha 36.635 34.633 34.728 34.874 34.874 Trade payables
Biaya yang masih harus dibayar 3.316 3.316 3.316 3.316 3.316 Accrued expense
Utang pajak 312 312 312 312 312 Taxs payables
Utang lain-lain 162 162 162 162 162 Other payables
Uang muka pelanggan 13 13 13 13 13 Advance from customer
Jumlah Liabilitas Jangka Pendek 40.438 38.435 38.530 38.676 38.676 Total Current Liabilities
LIABILITAS JANGKA PANJANG NON-CURRENT LIABILITIES
Obligasi konversi 9.939 9.939 9.939 9.939 9.939 Convertible bonds
Utang bank - - - - - Bank loans
Utang lain-lain - pihak berelasi - - - - - Other payables - related parties
Utang lain-lain - pihak ketiga - - - - - Other payables - third parties
Liabilitas imbalan kerja karyawan 291 291 291 291 291 Post employment benefit obligation
Liabilitas pajak tangguhan 12 12 12 12 12 Deferred tax liabilities
Jumlah Liabilitas Jangka Panjang 10.242 10.242 10.242 10.242 10.242 Total Non-Current Liabilities
JUMLAH LIABILITAS 50.680 48.677 48.772 48.918 48.918 TOTAL LIABILITIES
EKUITAS EQUITY
Modal saham 899 899 899 899 899 Capital stock
Tambahan modal disetor 79 79 79 79 79 Additional paid-in capital
Obligasi wajib konversi 113 113 113 113 113 Mandatory convertible bonds
Komponen ekuitas lainnya 226 226 226 226 226 Other contributed capital
Akumulasi keuntungan aktuaria 157 157 157 157 157 Accumulated actuarial gain
Saldo laba (rugi) 135.801 153.814 171.934 189.494 207.306 Retained earnings (deficit)
JUMLAH EKUITAS 137.274 155.288 173.408 190.967 208.779 TOTAL EQUITY
JUMLAH LIABILITAS DAN EKUITAS 187.954 203.965 222.180 239.886 257.697 TOTAL LIABILITIES AND EQUITY
DescriptionsKeterangan 31/03/27 31/03/28 31/03/29 31/03/30 31/03/31

This report is originally issued in Bahasa Indonesia
114
(Dalam ribuan USD) (In thousands of USD)
LIABILITAS DAN EKUITAS LIABILITIES AND EQUITY
LIABILITAS LIABILITIES
LIABILITAS JANGKA PENDEK CURRENT LIABILITIES
Utang usaha 34.874 34.874 34.874 34.874 34.874 Trade payables
Biaya yang masih harus dibayar 3.316 3.316 3.316 3.316 3.316 Accrued expense
Utang pajak 312 312 312 312 312 Taxs payables
Utang lain-lain 162 162 162 162 162 Other payables
Uang muka pelanggan 13 13 13 13 13 Advance from customer
Jumlah Liabilitas Jangka Pendek 38.676 38.676 38.676 38.676 38.676 Total Current Liabilities
LIABILITAS JANGKA PANJANG NON-CURRENT LIABILITIES
Obligasi konversi 9.939 9.939 9.939 9.939 9.939 Convertible bonds
Utang bank - - - - - Bank loans
Utang lain-lain - pihak berelasi - - - - - Other payables - related parties
Utang lain-lain - pihak ketiga - - - - - Other payables - third parties
Liabilitas imbalan kerja karyawan 291 291 291 291 291 Post employment benefit obligation
Liabilitas pajak tangguhan 12 12 12 12 12 Deferred tax liabilities
Jumlah Liabilitas Jangka Panjang 10.242 10.242 10.242 10.242 10.242 Total Non-Current Liabilities
JUMLAH LIABILITAS 48.918 48.918 48.918 48.918 48.918 TOTAL LIABILITIES
EKUITAS EQUITY
Modal saham 899 899 899 899 899 Capital stock
Tambahan modal disetor 79 79 79 79 79 Additional paid-in capital
Obligasi wajib konversi 113 113 113 113 113 Mandatory convertible bonds
Komponen ekuitas lainnya 226 226 226 226 226 Other contributed capital
Akumulasi keuntungan aktuaria 157 157 157 157 157 Accumulated actuarial gain
Saldo laba (rugi) 225.160 243.018 260.895 278.818 296.797 Retained earnings (deficit)
JUMLAH EKUITAS 226.633 244.491 262.368 280.292 298.271 TOTAL EQUITY
JUMLAH LIABILITAS DAN EKUITAS 275.552 293.409 311.287 329.210 347.189 TOTAL LIABILITIES AND EQUITY
Keterangan 31/03/32 31/03/33 31/03/34 31/03/35 31/03/36 Descriptions
(Dalam ribuan USD) (In thousands of USD)
LIABILITAS DAN EKUITAS LIABILITIES AND EQUITY
LIABILITAS LIABILITIES
LIABILITAS JANGKA PENDEK CURRENT LIABILITIES
Utang usaha 34.874 34.874 - Trade payables
Biaya yang masih harus dibayar 3.316 3.316 - Accrued expense
Utang pajak 312 312 - Taxs payables
Utang lain-lain 162 162 - Other payables
Uang muka pelanggan 13 13 - Advance from customer
Jumlah Liabilitas Jangka Pendek 38.676 38.676 - Total Current Liabilities
LIABILITAS JANGKA PANJANG NON-CURRENT LIABILITIES
Obligasi konversi 9.939 9.939 9.939 Convertible bonds
Utang bank - - - Bank loans
Utang lain-lain - pihak berelasi - - - Other payables - related parties
Utang lain-lain - pihak ketiga - - - Other payables - third parties
Liabilitas imbalan kerja karyawan 291 291 - Post employment benefit obligation
Liabilitas pajak tangguhan 12 12 12 Deferred tax liabilities
Jumlah Liabilitas Jangka Panjang 10.242 10.242 9.951 Total Non-Current Liabilities
JUMLAH LIABILITAS 48.918 48.918 9.951 TOTAL LIABILITIES
EKUITAS EQUITY
Modal saham 899 899 899 Capital stock
Tambahan modal disetor 79 79 79 Additional paid-in capital
Obligasi wajib konversi 113 113 113 Mandatory convertible bonds
Komponen ekuitas lainnya 226 226 226 Other contributed capital
Akumulasi keuntungan aktuaria 157 157 157 Accumulated actuarial gain
Saldo laba (rugi) 314.822 332.858 346.051 Retained earnings (deficit)
JUMLAH EKUITAS 316.296 334.332 347.524 TOTAL EQUITY
JUMLAH LIABILITAS DAN EKUITAS 365.214 383.250 357.475 TOTAL LIABILITIES AND EQUITY
Keterangan 31/03/37 31/03/38 31/03/39 Descriptions

This report is originally issued in Bahasa Indonesia
115
IX.D.2.b. Terminal Value dan Tingkat Pertumbuhan IX.D.2.b. Terminal Value and Growth Rate
Sebagai dasar dalam menentukan terminal value atau nilai pada periode kekal, kami menggunakan proyeksi tahun 2017 sampai tahun 2039 sebagai periode tetap, sedangkan tahun 2040 dianggap sebagai awal periode kekal. Dalam penilaian ini, pertumbuhan arus kas bersih (AKB) pada tahun 2040 atau periode kekal diasumsikan sebesar nol atau tidak ada.
As a basis to determine the terminal value or value in the perpetuity period, we used the projections for 2017 to 2039 as a fixed period, whereas 2040 was considered as the beginning of the perpetuity period. In this valuation, free cash flows (FCF) growth in 2040 or perpetuity period was assumed zero or nothing.
IX.D.2.c. Penentuan Arus Kas Bersih IX.D.2.c. Determination of Free Cash Flows
Untuk penilaian dengan menggunakan metode diskonto pendapatan ekonomi mendatang, terdapat 3 (tiga) pilihan pendapatan ekonomi untuk didiskonto, yaitu dividen, AKB untuk ekuitas dan AKB untuk kapital atau AKB untuk perusahaan.
For the valuation using discounted future economic income method, there are 3 (three) alternatives of economic income to be discounted, i.e. dividends, FCF to equity and FCF to invested capital or FCF to firm.
Dalam penilaian ini, pendapatan ekonomi yang akan didiskonto untuk dijadikan indikasi nilai bisnis adalah AKB untuk kapital.
In this valuation, the economic income to be discounted that will be used as an indicative business value was the FCF to firm.
Pengertian AKB berarti bahwa arus kas yang diperoleh sudah bebas dari kewajiban penyediaan pengeluaran barang modal, baik untuk mempertahankan operasi perusahaan saat ini maupun penyediaan cadangan untuk penggantian, modal kerja dan untuk pertumbuhan melalui penyediaan dana tambahan pengeluaran barang modal, yang dihitung dengan cara langsung.
The definition of FCF means that the cash flow obtained is free from the obligation to provide capital expenditure, either to maintain current operations of the company or provision of reserve for replacement, working capital and for growth through the provision of additional funds for capital expenditure, which is calculated using a direct method.

This report is originally issued in Bahasa Indonesia
116
Berdasarkan asumsi-asumsi untuk proyeksi laporan posisi keuangan dan proyeksi laporan laba rugi komprehensif sebagaimana dijelaskan di atas, proyeksi AKB untuk kapital BSL untuk periode tiga bulan yang berakhir pada tanggal 31 Maret 2017 dan untuk tahun yang berakhir pada tanggal-tanggal 31 Maret 2018 – 2039 adalah sebagai berikut:
Based on the assumptions for the forecasted statements of financial position and statements of comprehensive income as described above, the FCF projections of BSL for the period of three months ended 31 March 2017 and for the years ended 31 March 2018 – 2039 were as follows:
Tabel 36 Table 36
PT Barasentosa Lestari PT Barasentosa Lestari
Proyeksi Arus Kas Bersih Statements of Cash Flows Projections
untuk periode tiga bulan yang berakhir pada for three months period ended
tanggal 31 Maret 2017 dan 31 March 2017 and
untuk tahun yang berakhir pada for the years ended
tanggal-tanggal 31 Maret 2018 - 2039 31 March 2018 - 2039
(Dalam ribuan USD) (In thousands of USD)
31/03/17 31/03/18 31/03/19 31/03/20 31/03/21
Penerimaan kas dari pelanggan - 71.065 158.597 210.889 273.209 Cash receipt from the customers
Pembayaran kas kepada pemasok - (64.684) (140.085) (182.745) (241.650) Cash payment to the suppliers
Pembayaran beban usaha (31) (1.298) (1.326) (1.356) (1.385) Cash payment for operating expense
Pembayaran beban pajak penghasilan - (1.189) (3.504) (4.920) (6.001) Cash payment for income tax expense
Penerimaan lain-lain - - - - - Cash receipt from other income
Penambahan aset tetap (1.550) (4.700) (5.700) (5.010) (1.000) Additional of fixed assets
Arus kas bersih sebelum penyesuaian
pajak (1.581) (805) 7.982 16.859 23.173 Net cash flows before tax adjustment
Penyesuaian pajak atas beban bunga - (1.376) (1.816) (1.682) (1.371) Tax adjustment on interest expense
Arus kas bersih (1.581) (2.181) 6.166 15.176 21.802 Net cash flows
Keterangan Descriptions(3 Bulan/
Months )
(1 Tahun/
Year )
(1 Tahun/
Year )
(1 Tahun/
Year )
(1 Tahun/
Year )
(Dalam ribuan USD) (In thousands of USD)
31/03/22 31/03/23 31/03/24 31/03/25 31/03/26
Penerimaan kas dari pelanggan 286.328 281.741 296.657 300.493 300.624 Cash receipt from the customers
Pembayaran kas kepada pemasok (259.673) (254.440) (268.132) (270.562) (270.611) Cash payment to the suppliers
Pembayaran beban usaha (1.385) (1.385) (1.385) (1.385) (1.385) Cash payment for operating expense
Pembayaran beban pajak penghasilan (3.698) (4.659) (5.532) (5.563) (5.654) Cash payment for income tax expense
Penerimaan lain-lain - - - - - Cash receipt from other income
Penambahan aset tetap (20) (20) (20) (20) (20) Additional of fixed assets
Arus kas bersih sebelum penyesuaian
pajak 21.551 21.236 21.588 22.963 22.954 Net cash flows before tax adjustment
Penyesuaian pajak atas beban bunga (941) (511) (259) (185) (111) Tax adjustment on interest expense
Arus kas bersih 20.610 20.725 21.329 22.778 22.843 Net cash flows
Keterangan Descriptions(1 Tahun/
Year )
(1 Tahun/
Year )
(1 Tahun/
Year )
(1 Tahun/
Year )
(1 Tahun/
Year )
(Dalam ribuan USD) (In thousands of USD)
31/03/27 31/03/28 31/03/29 31/03/30 31/03/31
Penerimaan kas dari pelanggan 320.278 309.948 308.151 308.362 308.362 Cash receipt from the customers
Pembayaran kas kepada pemasok (290.273) (279.065) (277.728) (278.844) (278.990) Cash payment to the suppliers
Pembayaran beban usaha (1.385) (1.385) (1.385) (1.385) (1.385) Cash payment for operating expense
Pembayaran beban pajak penghasilan (5.930) (6.005) (6.040) (5.853) (5.937) Cash payment for income tax expense
Penerimaan lain-lain - - - - - Cash receipt from other income
Penambahan aset tetap (20) (20) (20) (20) - Additional of fixed assets
Arus kas bersih sebelum penyesuaian
pajak 22.670 23.473 22.978 22.259 22.049 Net cash flows before tax adjustment
Penyesuaian pajak atas beban bunga (37) - - - - Tax adjustment on interest expense
Arus kas bersih 22.633 23.473 22.978 22.259 22.049 Net cash flows
Keterangan Descriptions(1 Tahun/
Year )
(1 Tahun/
Year )
(1 Tahun/
Year )
(1 Tahun/
Year )
(1 Tahun/
Year )

This report is originally issued in Bahasa Indonesia
117
IX.D.2.d. Tingkat Diskonto IX.D.2.d. Discount Rate
Untuk mendiskonto AKB untuk kapital, tingkat diskonto yang digunakan adalah biaya modal rata-rata tertimbang (WACC/weighted average cost of capital) yang ditentukan dengan menggunakan persamaan sebagai berikut:
To discount the FCF to firm, the discount rate used was weighted average cost of capital (WACC) which was calculated by using the following formula:
Dimana: Whereas:
ke = Biaya modal ekuitas/saham biasa ke = Cost of equity/common stock kd = Biaya modal utang kd = Cost of debt We = Bobot ekuitas dalam struktur
ekuitas We = Weighted equity in capital structure
Wd = Bobot utang dalam struktur kapital Wd = Weighted debt in capital structure t = Pajak penghasilan perusahaan t = Corporate income tax rate
(Dalam ribuan USD) (In thousands of USD)
31/03/32 31/03/33 31/03/34 31/03/35 31/03/36
Penerimaan kas dari pelanggan 308.362 308.362 308.362 308.362 308.362 Cash receipt from the customers
Pembayaran kas kepada pemasok (278.990) (278.990) (278.990) (278.990) (278.990) Cash payment to the suppliers
Pembayaran beban usaha (1.385) (1.385) (1.385) (1.385) (1.385) Cash payment for operating expense
Pembayaran beban pajak penghasilan (5.951) (5.953) (5.959) (5.974) (5.993) Cash payment for income tax expense
Penerimaan lain-lain - - - - - Cash receipt from other income
Penambahan aset tetap - - - - - Additional of fixed assets
Arus kas bersih sebelum penyesuaian
pajak 22.035 22.034 22.027 22.012 21.993 Net cash flows before tax adjustment
Penyesuaian pajak atas beban bunga - - - - - Tax adjustment on interest expense
Arus kas bersih 22.035 22.034 22.027 22.012 21.993 Net cash flows
Keterangan Descriptions(1 Tahun/
Year )
(1 Tahun/
Year )
(1 Tahun/
Year )
(1 Tahun/
Year )
(1 Tahun/
Year )
(Dalam ribuan USD) (In thousands of USD)
31/03/37 31/03/38 31/03/39
Penerimaan kas dari pelanggan 308.362 308.362 327.778 Cash receipt from the customers
Pembayaran kas kepada pemasok (278.990) (278.990) (280.863) Cash payment to the suppliers
Pembayaran beban usaha (1.385) (1.385) (1.385) Cash payment for operating expense
Pembayaran beban pajak penghasilan (6.008) (6.012) (4.397) Cash payment for income tax expense
Penerimaan lain-lain - - (3.448) Cash receipt from other income
Penambahan aset tetap - - - Additional of fixed assets
Arus kas bersih sebelum penyesuaian
pajak 21.978 21.975 37.684 Net cash flows before tax adjustment
Penyesuaian pajak atas beban bunga - - - Tax adjustment on interest expense
Arus kas bersih 21.978 21.975 37.684 Net cash flows
Keterangan Descriptions(1 Tahun/
Year )
(1 Tahun/
Year )
(1 Tahun/
Year )
)]1[()( ddee WtkWkWACC ×−+×=

This report is originally issued in Bahasa Indonesia
118
IX.D.2.d.1) Biaya Modal untuk Ekuitas IX.D.2.d.1) Cost of Equity
Sebelum dapat menetapkan WACC, terlebih dahulu harus dihitung biaya modal ekuitas, yang ditentukan dengan expanded capital asset pricing model (CAPM) dengan menggunakan persamaan sebagai berikut:
Before determining the WACC, firstly the cost of equity must be calculated, which was determined by expanded capital asset pricing model (CAPM) using the following formula:
)( mfe RPRk ×+= β
Dimana: Whereas:
ke = Tingkat balikan yang diharapkan
dari suatu sekuritas tertentu atau biaya modal ekuitas/saham biasa
ke = Expected rate of return from certain securities or the cost of equity/common stock
Rf = Tingkat balikan yang tersedia untuk suatu sekuritas bebas risiko (risk-free rate)
Rf = Available rate of return for a risk-free securities (risk-free rate)
β = Beta β = Beta RPm = Premi risiko ekuitas untuk pasar
secara keseluruhan (equity risk premium)
RPm = Equity risk premium for overall market (equity risk premium)
Rf adalah tingkat suku bunga untuk instrumen-instrumen yang dianggap tidak memiliki kemungkinan gagal bayar. Di Indonesia, instrumen bebas risiko yang dapat dipilih adalah tingkat bunga Obligasi Pemerintah untuk jangka panjang. Terkait dengan tanggal penilaian yang jatuh pada tanggal 31 Desember 2016, maka instrumen bebas risiko yang dipakai, yaitu obligasi Indonesia berjangka panjang dalam mata uang USD dengan jangka waktu 23 tahun dengan tingkat yield rata-rata sebesar 5,13% yang diperoleh dari Bloomberg dan angka tersebut akan digunakan sebagai tingkat balikan bebas resiko.
Rf is the interest rate for instruments that are considered not to have the possibility of default. In Indonesia, the risk-free instrument that can be selected is the interest rate for long-term government bonds. Related to the date of valuation as of 31 December 2016, the risk-free instrument used was long-term Indonesia bonds in USD for the period of 23 years with average yield of 5.13% acquired from Bloomberg and the figures will be used as a risk-free rate.
RPm adalah selisih antara tingkat bunga investasi bebas risiko dengan tingkat balikan investasi dalam bentuk penyertaan. Penentuan equity market risk premium memasukkan premi untuk risiko spesifik negara seperti volatilitas harga saham untuk menghasilkan base equity market risk premium. Dengan mengikutsertakan risiko-risiko ini, dihasilkan tingkat diskonto yang mengakomodasi perubahan-perubahan sentimen jangka pendek di sekuritas pada pasar negara yang bersangkutan. Untuk penilaian ini, kami menggunakan tingkat premi risiko sebesar 8,82%, yang diperoleh dari riset Aswath Damodaran (New York University Business School) tahun 2016 yang dikeluarkan pada bulan Januari 2017.
RPm is the difference between the risk-free interest rate of investments with return investments rate in the form of investments. The determination of equity market risk premium includes country-specific risk premiums, such as stock price volatility to obtain base equity market risk premium. By considering these risks, the discount rate that accommodates the changes in short-term sentiment in the securities market in related country is obtained. For this valuation, we applied the risk premium of 8.82%, which was acquired from the research of Aswath Damodaran (New York University Business School) for 2016 which was issued in January 2017.

This report is originally issued in Bahasa Indonesia
119
Beta (β) adalah faktor untuk meliput risiko
sistematis dari suatu ekuitas. Beta akan dikalikan dengan market risk premium untuk mendapatkan equity risk premium.
Beta (β) is a factor to cover the systematic risk of equity. Beta will be multiplied by the market risk premium to obtain equity risk premium.
Unlevered beta rata-rata perusahaan pembanding diperoleh dari perusahaan publik sejenis, yaitu sebagai berikut:
The average unlevered beta of comparison companies was obtained from similar public companies as follows:
• PT Adaro Energy Tbk; • PT Adaro Energy Tbk;
• PT Baramulti Suksessarana Tbk; • PT Baramulti Suksessarana;
• PT Bayan Resources Tbk; • PT Bayan Resources Tbk;
• PT Harum Energy Tbk; • PT Harum Enegy Tbk;
• PT Indo Tambangraya Megah Tbk; • PT Indo Tambangraya Megah Tbk;
• PT Resource Alam Indonesia Tbk; • PT Resource Alam Indonesia Tbk;
• PT Samindo Resources Tbk; • PT Samindo Resources Tbk;
• PT Bukit Asam (Persero) Tbk; • PT Bukit Asam (Persero) Tbk;
• PT Golden Eagle Energy Tbk; dan • PT Golden Eagle Energy Tbk; and
• PT Toba Bara Sejahtra Tbk. • PT Toba Bara Sejahtra Tbk
sebesar 0,74 yang kemudian di-relever dengan tingkat leverage yang berlaku di pasar untuk memperoleh beta yang sesuai untuk mendiskonto AKB BSL tersebut dengan formula sebagai berikut:
at 0.74 which was then re-levered with the prevailing leverage in the market to obtain appropriate beta to discount the FCF of BSL by using the following formula:
( )( )DERTUL ×−+×= 11ββ
Dalam penilaian ini, kami menggunakan rata-rata debt to equity ratio (DER) dari perusahaan-perusahaan publik sejenis sebesar 21,51% untuk memperoleh beta BSL. Tarif pajak yang berlaku untuk BSL adalah sebesar 0,00% untuk tahun 2017, sebesar 23,04% untuk tahun 2018 dan sebesar 25,00% untuk tahun 2019 – 2039. Dengan demikian, maka diperoleh beta BSL sebesar 0,90 untuk tahun 2017, sebesar 0,87 untuk tahun 2018 dan sebesar 0,86 untuk tahun 2019 – 2039 masing-masing dengan rincian perhitungan sebagai berikut:
In this valuation, we applied the average debt to equity ratio (DER) of similar public companies of 21.51% to obtain the beta of BSL. The applicable tax rate for BSL is 0.00% for 2017, 23.04% for 2018 and 25.00% for 2019 – 2039. Therefore, beta of BSL is 0.90 for 2017, 0.87 for 2018 and 0.86 for 2019 – 2039 respectively with the details of calculation as follows:
( )( ) 90,0%51,21%00,01174,02017 =×−+×=Lβ
( )( ) 87,0%51,21%04,231174,02018 =×−+×=Lβ
( )( ) 88,0%51,21%00,251174,020392019 =×−+×=−Lβ

This report is originally issued in Bahasa Indonesia
120
Berdasarkan nilai beta tersebut, maka dengan menggunakan persamaan CAPM dengan memperhitungkan rating-based default spread sebesar 2,54% diperoleh biaya modal atas ekuitas BSL sebagaimana tampak dalam perhitungan di bawah ini:
Based on such beta, by using the CAPM formula and considering rating-based default spread of 2.54%, the cost of equity of BSL was obtained as shown in calculations below:
RBDSRPRk mfe −×+= β
%56,10%54,2%82,890,0%13,52017 =−×+=ek
%24,10%54,2%82,887,0%13,52018 =−×+=ek
%21,10%54,2%82,886,0%13,520392019 =−×+=−ek
IX.D.2.d.2) Biaya Modal untuk Utang IX.D.2.d.2) Cost of Debt
Karena perhitungan nilai ekuitas BSL dilakukan dengan mendiskonto tingkat balikan terhadap keseluruhan modal (AKB untuk kapital atau free cash flows to invested capital), maka tingkat diskonto yang digunakan adalah tingkat diskonto yang merupakan rata-rata tertimbang biaya modal, baik yang berasal dari pinjaman jangka panjang (biaya modal untuk utang) maupun yang berasal dari ekuitas (biaya modal untuk ekuitas).
Since the calculation of equity value of BSL was performed by discounting the cost of capital (FCF to firm or FCF to invested capital), the discount rate used was the discount rate which was the weighted average cost of capital, both derived from the long-term loan (cost of debt) and those derived from equity (cost of equity).
Dalam penilaian ini, biaya modal untuk utang yang digunakan adalah suku bunga pinjaman dalam mata uang USD yang diambil dari suku bunga kredit investasi bank Persero untuk bulan Desember 2016 yang dipublikasikan oleh Bank Indonesia sebesar 5,35%.
In this valuation, the cost of debt used was the average interest rate for loan denominated in USD taken from the average interest rate for investment credit in December 2016 as published by Bank Indonesia, i.e. 5.35%.
IX.D.2.d.3) Weighted Average Cost of Capital IX.D.2.d.3) Weighted Average Cost of Capital
Berdasarkan biaya modal untuk ekuitas, biaya modal untuk utang, bobot ekuitas sebesar 82,30% dan bobot utang sebesar 17,70%, yang diolah dari data rata-rata DER dari perusahaan-perusahaan publik yang sejenis serta menggunakan tarif pajak penghasilan sebesar 0,00% untuk tahun 2017, sebesar 23,04% untuk tahun 2018 dan sebesar 25,00% untuk tahun 2019 – 2039, maka weighted average cost of capital (WACC) adalah sebagai berikut:
Based on the cost of equity, cost of debt, weighted equity at 82.30% and the weighted debt at 17.70%, which was compiled from data on average DER of similar public companies and using the income tax rate of 0.00% for 2017, 23.04% for 2018 and 25.00% for 2019 – 2039, the weighted average cost of capital (WACC) was as follows:
( ) [ ]( )WdTKdWeKeWACC ×−×+×= 1
( ) [ ]( ) %64,9%70,17%00,01%35,5%30,82%56,102017 =×−×+×=WACC
( ) [ ]( ) %15,9%70,17%04,231%535%30,82%24,102018 =×−×+×=WACC
( ) [ ]( ) %11,9%70,17%00,251%35,5%30,82%21,1020392019 =×−×+×=−WACC

This report is originally issued in Bahasa Indonesia
121
IX.D.2.e. Perhitungan Indikasi Nilai Pasar Wajar
100,00% Saham BSL IX.D.2.e. Calculation of Indicative Fair Market Value
of 100.00% Shares of BSL
Berdasarkan AKB sebagaimana dijelaskan di atas, indikasi nilai kini operasi BSL untuk periode tiga bulan yang berakhir pada tanggal 31 Maret 2017 dan untuk tahun yang berakhir pada tanggal-tanggal 31 Maret 2018 – 2039 adalah sebagai berikut:
Based on FCF as described above, the indicative operating present value of BSL for three months period ended 31 March 2017 and for the years ended 31 March 2018 – 2039 were as follows:
Tabel 37 Table 37
PT Barasentosa Lestari PT Barasentosa Lestari
Indikasi Nilai Kini Operasi Indicative Operating Present Value
Per 31 Desember 2016 As of 31 December 2016
(Dalam ribuan USD) (In thousands of USD)
31/03/17 31/03/18 31/03/19 31/03/20 31/03/21
Arus kas bersih (1.581) (2.181) 6.166 15.176 21.802 Free cash flows
Faktor diskonto 0,9773 0,8955 0,8207 0,7522 0,6894 Discount factor
Nilai kini arus kas bersih (1.545) (1.953) 5.060 11.415 15.030 Present value of free cash flows
Keterangan Descriptions(3 Bulan/
Months )
(1 Tahun/
Year )
(1 Tahun/
Year )
(1 Tahun/
Year )
(1 Tahun/
Year )
(Dalam ribuan USD) (In thousands of USD)
31/03/22 31/03/23 31/03/24 31/03/25 31/03/26
Arus kas bersih 20.610 20.725 21.329 22.778 22.843 Free cash flows
Faktor diskonto 0,6318 0,5790 0,5306 0,4863 0,4457 Discount factor
Nilai kini arus kas bersih 13.021 12.000 11.317 11.077 10.181 Present value of free cash flows
(1 Tahun/
Year )
(1 Tahun/
Year )
(1 Tahun/
Year )
(1 Tahun/
Year )
Keterangan Descriptions(1 Tahun/
Year )
(Dalam ribuan USD) (In thousands of USD)
31/03/27 31/03/28 31/03/29 31/03/30 31/03/31
Arus kas bersih 22.633 23.473 22.978 22.259 22.049 Free cash flows
Faktor diskonto 0,4085 0,3744 0,3431 0,3144 0,2881 Discount factor
Nilai kini arus kas bersih 9.246 8.788 7.884 6.998 6.352 Present value of free cash flows
Keterangan Descriptions(1 Tahun/
Year )
(1 Tahun/
Year )
(1 Tahun/
Year )
(1 Tahun/
Year )
(1 Tahun/
Year )
(Dalam ribuan USD) (In thousands of USD)
31/03/32 31/03/33 31/03/34 31/03/35 31/03/36
Arus kas bersih 22.035 22.034 22.027 22.012 21.993 Free cash flows
Faktor diskonto 0,2640 0,2420 0,2218 0,2033 0,1863 Discount factor
Nilai kini arus kas bersih 5.817 5.332 4.886 4.475 4.097 Present value of free cash flows
Keterangan Descriptions(1 Tahun/
Year )
(1 Tahun/
Year )
(1 Tahun/
Year )
(1 Tahun/
Year )
(1 Tahun/
Year )
(Dalam ribuan USD) (In thousands of USD)
31/03/37 31/03/38 31/03/39
Arus kas bersih 21.978 21.975 37.684 Free cash flows
Faktor diskonto 0,1707 0,1564 0,1433 Discount factor
Nilai kini arus kas bersih 3.752 3.437 5.400 Present value of free cash flows
Indikasi nilai kini operasi 162.069 Indicative operating present value
Keterangan Descriptions(1 Tahun/
Year )
(1 Tahun/
Year )
(1 Tahun/
Year )

This report is originally issued in Bahasa Indonesia
122
Keseluruhan jumlah nilai kini AKB adalah sebesar USD 162,07 juta untuk tingkat diskonto sebesar 9,64% untuk tahun 2017, sebesar 9,15% untuk tahun 2018 dan sebesar 9,11% untuk tahun 2019 – 2039. Nilai tersebut merupakan indikasi nilai BSL dari hasil operasi berdasarkan metode diskonto pendapatan ekonomi mendatang.
The total present value of FCF was USD 162.07 million for discount rate of 9.64% for 2017, 9.15% for 2018 and 9.11% for 2019 – 2039. This value was the indicative value of BSL from operation using the discounted future economic income method.
Setelah diperoleh indikasi nilai saham dari hasil operasi, langkah selanjutnya adalah menjumlahkan aset non-operasi dan mengurangkan liabilitas jangka panjang serta liabilitas lainnya, jika ada, kepada indikasi nilai dari hasil operasi tersebut untuk mendapatkan indikasi nilai pasar wajar BSL.
After obtaining an indicative value of shares from operation, the next step is to add non-operating assets and to deduct the long-term liabilities as well as other liabilities, if any, to indicative value from operation to obtain indicative fair market value of shares of BSL.
Pada tanggal 31 Desember 2016, BSL memiliki aset non-operasi berupa:
As of 31 December 2016, BSL had non-operating assets in the form of:
• Kas dan setara kas sebesar USD 0,04 juta;
• Cash and cash equivalent amounting USD 0.04 million;
• Jaminan sebesar USD 0,02 juta; dan • Refundable deposits amounting USD 0.02 million; and
• Dana yang dibatasi penggunaannya sebesar USD 0,42 juta.
• Restricted deposits amounting USD 0.42 million.
maka jumlah aset non-operasi yang dapat ditambahkan pada indikasi nilai saham dari hasil operasi adalah sebesar USD 0,48 juta.
therefore, total non-operating assets to be added to indicative value of shares from operation was USD 0.48 million.
Selanjutnya, pada tanggal 31 Desember 2016, BSL memiliki liabilitas jangka panjang berupa:
Therefore, as of 31 December 2016, BSL had long-term liabilities in the form of:
• Utang bank sebesar USD 40,00 juta; dan • Bank loan amounting USD 40.00 million; and
• Utang lain-lain sebesar USD 29,80 juta. • Other payables amounting USD 29.80 million.
Dengan demikian, jumlah liabilitas jangka panjang yang dapat dikurangkan pada indikasi nilai saham dari hasil operasi adalah sebesar USD 69,80 juta.
therefore, total long-term liabilities to be deducted to indicative value of shares from operation was USD 69.80 million.

This report is originally issued in Bahasa Indonesia
123
Dengan menambahkan aset non-operasi dan mengurangkan liabilitas jangka panjang tersebut pada indikasi nilai operasi BSL dari hasil operasi, maka berdasarkan metode diskonto pendapatan ekonomi mendatang, diperoleh hasil bahwa indikasi nilai pasar wajar 100,00% saham BSL adalah sebesar USD 92,74 juta.
By adding the non-operating assets and deducting long-term liabilities to indicative operating value of BSL from operation, therefore based on discounted future economic income method, the indicative fair market value of 100.00% shares of BSL was USD 92.74 million.
Perincian perhitungan indikasi nilai pasar wajar 100,00% saham BSL menggunakan metode diskonto pendapatan ekonomi mendatang adalah sebagai berikut:
The details of the calculation of the indicative fair market value of the 100.00% shares of BSL using discounted future economic income method were as follows:
IX.D.2.f. Indikasi Nilai Pasar Wajar 100,00% Saham BSL Berdasarkan Metode Diskonto Pendapatan Ekonomi Mendatang
IX.D.2.f. Indicative Fair Market Value of 100.00% Shares of BSL Based on Discounted Future Economic Income Method
Dari uraian-uraian sebelumnya, kami menyimpulkan bahwa indikasi nilai pasar wajar 100,00% saham BSL berdasarkan metode diskonto pendapatan ekonomi mendatang adalah sebesar USD 92,74 juta.
Based on previous descriptions, we concluded that the indicative fair market value of the 100.00% shares of BSL based on discounted future economic income method was USD 92.74 million.
Tabel 38 Table 38
PT Barasentosa Lestari PT Barasentosa Lestari
Indikasi Nilai Pasar Wajar 100,00% Saham Indicative Fair Market Value of 100.00% Shares
Metode Diskonto Pendapatan Discounted Future Economic
Ekonomi Mendatang Income Method
Per 31 Desember 2016 As of 31 December 2016
(Dalam ribuan USD) (In thousands of USD)
Indikasi nilai kini operasi 162.069 Indicative operating present value
Aset non-operasi: Non-operating assets:
Kas dan setara kas 36 Cash and cash equivalent
Jaminan 16 Refundable deposits
Dana yang dibatasi penggunaannya 424 Restricted deposits
Utang bank (40.000) Bank loan
Utang lain-lain (29.801) Other payables
Indicative fair market value of 100.00%
Indikasi nilai pasar wajar 100,00% saham shares before discount for lack of
sebelum diskon likuiditas pasar 92.744 marketabilities
KeteranganJumlah/
AmountDescriptions

This report is originally issued in Bahasa Indonesia
124
IX.D.2. Indikasi Nilai Pasar Wajar 100,00% Saham
BSL Berdasarkan Metode Akumulasi Aset IX.D.2. Indicative Fair Market Value of 100.00%
Shares of BSL Based on Assets Accumulation Method
Sebagaimana telah diuraikan sebelumnya, metode yang digunakan untuk menentukan indikasi nilai pasar wajar BSL adalah metode akumulasi aset. Metode ini merupakan metode penilaian yang didasarkan pada pendekatan aset. Dengan metode ini, nilai dari semua komponen aset dan liabilitas harus disesuaikan menjadi nilai pasar atau nilai pasar wajarnya, kecuali untuk komponen-komponen yang telah menunjukkan nilai pasarnya (seperti kas/bank atau utang bank).
As described earlier, the method applied to determine the indicative fair market value of BSL is assets acummulation method. This method is a valuation method based on assets based approach. Through this method, the value of all components of assets and liabilities should be adjusted to its market value, except for component that has indicated its market value (such as cash/bank or bank loan).
Pada penilaian ini, kami melakukan penilaian atas nilai pasar wajar atas biaya eksplorasi dan pengembangan ditangguhkan, dimana nilai nilai pasar wajar atas biaya eksplorasi dan pengembangan ditangguhkan pada tanggal 31 Desember 2016 adalah sebesar USD 143,38 juta. Apabila nilai pasar wajar atas biaya eksplorasi dan pengembangan ditangguhkan tersebut direfleksikan dalam laporan posisi keuangan, maka jumlah aset BSL adalah sebesar USD 144,71 juta, sedangkan jumlah liabilitas BSL adalah tetap, yaitu sebesar USD 83,85 juta.
In this valuation, we performed the valuation of fair market value of deferred exploration and development expenditures, where the total amount of fair market value of deferred exploration and development expenditures as of 31 December 2016 amounting USD 143.38 million. If the fair market value of deferred exploration and development expenditures is reflected to the statements of financial position, total assets of BSL was USD 144,71 million, and total liabilities of BSL is fixed, i.e. USD 83.85 million.
Indikasi nilai pasar wajar 100,00% saham BSL kemudian diperoleh dengan menghitung selisih antara nilai seluruh aset dan liabilitas. Dengan demikian, pada tanggal 31 Desember 2016, indikasi nilai pasar wajar 100,00% saham BSL adalah sebesar USD 70,80 juta.
Indicative fair market value of 100.00% shares of BSL was then obtained by calculating the difference of all assets and liabilities. Therefore, as of 31 December 2016, the indicative fair market value of 100.00% shares of BSL was USD 70.80 million.

This report is originally issued in Bahasa Indonesia
125
Perhitungan indikasi nilai pasar wajar 100,00% saham BSL dengan menggunakan metode akumulasi aset adalah sebagai berikut:
The calculation of the indicative fair market value of 100.00% shares of BSL using assets accumulation method are as follows:
Tabel 39 Table 39
PT Barasentosa Lestari PT Barasentosa Lestari
Indikasi Nilai Pasar Wajar 100,00% Saham Indicative Fair Market Value of 100.00% Shares
Metode Akumulasi Aset Assets Accumulation Method
Per 31 Desember 2016 As of 31 December 2016
(Dalam ribuan USD) (In thousand of USD)
Indikasi Nilai
Pasar Wajar/
Indicative
Fair Market
Value
A S E T A S S E T S
ASET LANCAR CURRENT ASSETS
Kas dan setara kas 36 - 36 Cash and cash equivalents
Uang muka 645 - 645 Advance payments
Biaya dibayar di muka 5 - 5 Prepayments
Pajak dibayar di muka 0 - 0 Prepaid taxes
Jumlah Aset Lancar 686 - 686 Total Current Assets
ASET TIDAK LANCAR NON-CURRENT ASSETS
Aset tetap 209 - 209 Fixed assets
Jaminan 16 - 16 Refundable deposits
Dana yang dibatasi dalam penggunaannya 424 - 424 Restricted deposits
Biaya eksplorasi dan pengembangan Deferred exploration and development
ditangguhkan 79.834 63.541 143.375 expenditures
Jumlah Aset Tidak Lancar 80.483 63.541 144.024 Total Non-Current Assets- -
TOTAL ASET 81.169 63.541 144.710 TOTAL ASSETS
LIABILITAS DAN EKUITAS LIABILITIES AND EQUITY
LIABILITAS LIABILITIES
LIABILITAS JANGKA PENDEK CURRENT LIABILITIES
Biaya yang masih harus dibayar 3.316 - 3.316 Accrued expenses
Utang pajak 312 - 312 Taxes payable
Utang lain-lain 162 - 162 Other payables
Uang muka pelanggan 13 - 13 Advance from customers
Jumlah Liabilitas Jangka Pendek 3.803 - 3.803 Total Current Liabilities
LIABILITAS JANGKA PANJANG NON-CURRENT LIABILITIES
Obligasi konversi 9.939 - 9.939 Convertible bonds
Utang bank 40.000 - 40.000 Bank loans
Utang lain-lain - pihak berelasi 29.801 - 29.801 Other payables - related parties
Liabilitas imbalan kerja karyawan 291 - 291 Post-employment benefit obligation
Liabilitas pajak tangguhan 12 - 12 Deferred tax liabilities
Jumlah Liabilitas Jangka Panjang 80.043 - 80.043 Total Non-Current Liabilities
JUMLAH LIABILITAS 83.846 - 83.846 TOTAL LIABILITIES
EKUITAS (2.677) 63.541 60.864 EQUITY
JUMLAH LIABILITAS DAN EKUITAS 81.169 63.541 144.710 TOTAL LIABILITIES AND EQUITY
Indikasi nilai pasar wajar 100,00% saham 70.804 Indicative fair market value of 100.00% shares
Keterangan 31/12/16
Penyesuian/
Descriptions
Adjustments

This report is originally issued in Bahasa Indonesia
126
IX.D.3. Rekonsiliasi Nilai IX.D.3. Value Reconciliation
Untuk mendapatkan nilai pasar wajar yang mewakili nilai dari kedua metode penilaian yang digunakan, dilakukan rekonsiliasi dengan terlebih dahulu melakukan pembobotan terhadap nilai pasar wajar yang dihasilkan dari kedua metode tersebut, masing-masing dengan bobot 80,00% untuk metode diskonto pendapatan ekonomi mendatang dan 20,00% untuk metode akumulasi aset.
To acquire the fair market value that represents the value of both valuation methods applied, reconciliation was performed by firstly weighting the fair market value resulted from both methods, with a weight of 80.00% for discounted future economic income method and 20.00% for assets accumulation method, respectively.
Alasan kami memberikan bobot 80,00% untuk metode diskonto pendapatan ekonomi mendatang dan 20,00% untuk metode akumulasi aset, yaitu karena data-data dan informasi yang digunakan pada metode diskonto pendapatan ekonomi mendatang untuk menentukan indikasi nilai pasar wajar BSL merupakan data-data dan informasi yang memiliki tingkat kehandalan yang lebih memadai dibandingkan metode akumulasi aset.
The reason we weighted 80.00% for discounted future economic income method and 20.00% for assets accumulation method was because the data and information used in discounted future economic income method that we used to determine the indicative fair market value of BSL was the data and information that represented more adequate level of reliability compared to assets accumulation method.
Berdasarkan hasil rekonsiliasi tersebut, diperoleh hasil bahwa indikasi nilai pasar wajar 100,00% saham BSL adalah sebesar USD 88,36 juta.
Based on the reconciliation result, the indicative fair market value of 100.00% shares of BSL was USD 88.36 million.
Tabel 40 Table 40
PT Barasentosa Lestari PT Barasentosa Lestari
Rekonsiliasi Nilai Value Reconciliation
Per 31 Desember 2016 As of 31 December 2016
(Dalam ribuan USD) (In thousands of USD)
Metode Diskonto Pendapatan Ekonomi Discounted Future Economic Income
Mendatang 92.744 80,00% 74.195 Method
Metode Akumulasi Aset 70.804 20,00% 14.161 Assets Accumulation Method
Indikasi Nilai Pasar Wajar 100,00% 88.356 Indicative Fair Market Value
Metode Penilaian
Indikasi Nilai
Pasar Wajar/
Indicative
Fair Market
Value
Bobot/
Weight
Nilai/
ValueValuation Method

This report is originally issued in Bahasa Indonesia
127
Sehubungan dengan penilaian ini, kami ingin menekankan bahwa nilai pasar wajar yang dihitung dengan metode diskonto pendapatan ekonomi mendatang didasarkan atas asumsi-asumsi mengenai tingkat pendapatan, beban dan akun-akun laporan posisi keuangan yang dikembangkan pihak manajemen BSL melalui analisa atas kinerja historis dan pernyataan manajemen BSL mengenai rencana-rencana untuk masa yang akan datang sebelum Rencana Akuisisi. Kami melakukan penelaahan atas asumsi-asumsi tersebut dan menurut pendapat kami, asumsi-asumsi tersebut wajar. Akan tetapi, kami tidak bertanggung jawab atas asumsi-asumsi tersebut. Setiap perubahan dari asumsi-asumsi ini akan mempengaruhi perhitungan indikasi nilai pasar wajar 100,00% saham BSL. Karena tidak ada kepastian bahwa dasar-dasar dan asumsi-asumsi tersebut akan terealisasi, kami tidak dapat memberikan jaminan bahwa hasil-hasil yang diproyeksikan akan tercapai.
In connection with this valuation, we would like to emphasize that the fair market value calculated using discounted future economic income method relied on the assumptions of the revenues, expenses and accounts of statements of financial position developed by the management of BSL through analysis of historical performance and the statements of BSL’s management concerning future plans before the Proposed Acquisition. We have reviewed those assumptions and in our opinion, those assumptions were reasonable. However, we are not responsible for those assumptions. Any changes to those assumptions would affect the calculation of the indicative fair market value of 100.00% shares of BSL. Since there was no certainty that the principles and assumptions would be realized, we could not provide assurance that the projected results would be achieved.
IX.E. Kesimpulan Penilaian IX.E. The Valuation Conclusion
Berdasarkan hasil analisa atas seluruh data dan informasi yang telah kami terima dan dengan mempertimbangkan semua faktor yang relevan yang mempengaruhi penilaian, maka menurut pendapat kami, nilai pasar wajar Obyek Penilaian pada tanggal 31 Desember 2016 adalah sebesar USD 61,46 juta.
Based on the analysis of all data and information that we have received and by considering all relevant factors affecting the valuation, therefore in our opinion, the fair market value of the Valuation Object as of 31 December 2016 was USD 61.46 million.

This report is originally issued in Bahasa Indonesia
128
Lampiran A Exhibit A
PT Dwikarya Sejati Utama PT Dwikarya Sejati Utama
Nilai Pasar Wajar 100,00% Saham Fair Market Value of 100.00% Shares
Metode Akumulasi Aset Assets Accumulation Method
Per 31 Desember 2016 As of 31 December 2016
(Dalam ribuan USD) (In thousand of USD)
Nilai Pasar
Wajar/
Fair Market
Value
A S E T A S S E T S
ASET LANCAR CURRENT ASSETS
Piutang lain-lain 6.388 - 6.388 Other receivables
Jumlah Aset Lancar 6.388 - 6.388 Total Current Assets
ASET TIDAK LANCAR NON-CURRENT ASSETS
Investasi pada entitas anak Investment in subsidiaries
PT Duta Sarana Internusa 109 71.336 71.445 PT Duta Sarana Internusa
Jumlah Aset Tidak Lancar 109 71.336 71.445 Total Non-Current Assets
TOTAL ASET 6.497 71.336 77.833 TOTAL ASSETS
LIABILITAS DAN EKUITAS LIABILITIES AND EQUITY
LIABILITAS LIABILITIES
Utang lain-lain 50 - 50 Other payables
JUMLAH LIABILITAS 50 - 50 TOTAL LIABILITIES
EKUITAS 6.447 71.336 77.783 EQUITY
JUMLAH LIABILITAS DAN EKUITAS 6.497 71.336 77.833 TOTAL LIABILITIES AND EQUITY
Indikasi nilai pasar wajar 100,00% saham Indicative fair market value of 100.00% shares
sebelum diskon likuiditas pasar 77.783 before discount for lack of marketabilities
Diskon likuiditas pasar (20,00%) (15.557) Discount for lack of marketabilities (20.00%)
Nilai pasar wajar 100,00% saham 62.226 Fair market value of 100.00% shares
Penyesuian/
Descriptions
Adjustments
Keterangan 31/12/16

This report is originally issued in Bahasa Indonesia
129
Lampiran B Exhibit B
PT Dwikarya Sejati Utama PT Dwikarya Sejati Utama
Nilai Pasar Wajar 100,00% Saham Fair Market Value of 100.00% Shares
Metode Pembanding Perusahaan Terbuka Guideline Publicly Traded Company Method
Per 31 Desember 2016 As of 31 December 2016
(Dalam ribuan USD) (In thousand USD)
Angka pengali 2,17 Multiplier
Variabel ekonomi 6.447 Economic variable
Indicative fair market value of 100,00% -
Indikasi nilai pasar wajar 100,00% - minoritas 14.020 minority
Indikasi nilai pasar wajar 100,00% saham - Indicative fair market value of 100.00% shares
minoritas 14.020 - minority
Premi pengendalian (50,00%) 7.010 Premium for control (50.00%)
Indikasi nilai pasar wajar Indicative fair market value of
100,00% saham 21.030 100.00% shares
Investasi pada entitas anak Investment in subsidiaries
PT Duta Sarana Internusa 47.141 PT Duta Sarana Internusa
Indikasi nilai pasar wajar 100,00% saham Indicative fair market value of 100.00% shares
sebelum diskon likuiditas pasar 68.171 before discount for lack of marketabilities
Discount for lack of
Diskon likuiditas pasar (20,00%) (13.634) marketabilities (20.00%)
Nilai pasar wajar 100,00% saham 54.537 Fair market value of 100.00% shares
KeteranganJumlah/
AmountDescriptions

This report is originally issued in Bahasa Indonesia
130
Lampiran C Exhibit C
PT Dwikarya Sejati Utama PT Dwikarya Sejati Utama
Rekonsiliasi Nilai Value Reconciliation
Per 31 Desember 2016 As of 31 December 2016
(Dalam ribuan USD) (In thousands of USD)
Metode Akumulasi Aset 62.226 90,00% 56.004 Assets Accumulation Method
Metode Pembanding Perusahaan Guideline Publicly Traded
Terbuka 54.537 10,00% 5.454 Company Method
Nilai Pasar Wajar 100,00% 61.457 Fair Market Value
Nilai/
ValueValuation Method
Bobot/
WeightMetode Penilaian
Nilai Pasar
Wajar/
Fair Market
Value

This report is originally issued in Bahasa Indonesia
131
Lampiran D Exhibit D
PT Duta Sarana Internusa PT Duta Sarana Internusa
Indikasi Nilai Pasar Wajar 100,00% Saham Indicative Fair Market Value of 100.00% Shares
Metode Akumulasi Aset Assets Accumulation Method
Per 31 Desember 2016 As of 31 December 2016
(Dalam ribuan USD) (In thousand of USD)
Indikasi Nilai
Pasar Wajar/
Indicative
Fair Market
Value
A S E T A S S E T S
ASET LANCAR CURRENT ASSETS
Kas dan setara kas 45 - 45 Cash and cash equivalents
Piutang lain-lain 31.354 - 31.354 Other receivables
Jumlah Aset Lancar 31.399 - 31.399 Total Current Assets
ASET TIDAK LANCAR NON-CURRENT ASSETS
Investasi pada entitas anak Investment in subsidiaries
PT Barasentosa Lestari 11.019 72.894 83.913 PT Barasentosa Lestari
Jumlah Aset Tidak Lancar 11.019 72.894 83.913 Total Non-Current Assets- -
TOTAL ASET 42.418 72.894 115.312 TOTAL ASSETS
LIABILITAS DAN EKUITAS LIABILITIES AND EQUITY
LIABILITAS LIABILITIES
LIABILITAS JANGKA PENDEK CURRENT LIABILITIES
Utang lain-lain 6.391 - 6.391 Other payables
Jaminan pemasok 7.675 - 7.675 Security deposit from vendor
Biaya yang masih harus dibayar 708 - 708 Accrued expenses
Jumlah Liabilitas Jangka Pendek 14.774 - 14.774 Total Current Liabilities
LIABILITAS JANGKA PANJANG NON-CURRENT LIABILITIES
Utang lain-lain - pihak berelasi 28.372 - 28.372 Other payables - related parties
Jumlah Liabilitas Jangka Panjang 28.372 - 28.372 Total Non-Current Liabilities
JUMLAH LIABILITAS 43.146 - 43.146 TOTAL LIABILITIES
EKUITAS (728) 72.894 72.166 EQUITY
JUMLAH LIABILITAS DAN EKUITAS 42.418 72.894 115.312 TOTAL LIABILITIES AND EQUITY
Indikasi nilai pasar wajar 100,00% saham 72.166 Indicative fair market value of 100.00% shares
Penyesuian/
Descriptions
Adjustments
Keterangan 31/12/16

This report is originally issued in Bahasa Indonesia
132
Lampiran E Exhibit E
PT Duta Sarana Internusa PT Duta Sarana Internusa
Indikasi Nilai Pasar Wajar 100,00% Saham Indicative Fair Market Value of 100.00% Shares
Metode Pembanding Perusahaan Terbuka Guideline Publicly Traded Company Method
Per 31 Desember 2016 As of 31 December 2016
(Dalam ribuan USD) (In thousand USD)
Angka pengali 2,17 Multiplier
Variabel ekonomi 27.644 Economic variable
Indicative fair market value of 100,00% -
Indikasi nilai pasar wajar 100,00% - minoritas 60.117 minority
Utang lain-lain - pihak berelasi (28.372) Other payables - related parties
Indikasi nilai pasar wajar 100,00% saham - Indicative fair market value of 100.00% shares
minoritas 31.745 - minority
Premi pengendalian (50,00%) 15.872 Premium for control (50.00%)
Indikasi nilai pasar wajar Indicative fair market value of
100,00% saham 47.617 100.00% shares
KeteranganJumlah/
AmountDescriptions

This report is originally issued in Bahasa Indonesia
133
Lampiran F Exhibit F
PT Duta Sarana Internusa PT Duta Sarana Internusa
Rekonsiliasi Nilai Value Reconciliation
Per 31 Desember 2016 As of 31 December 2016
(Dalam ribuan USD) (In thousands of USD)
Metode Akumulasi Aset 72.166 90,00% 64.950 Assets Accumulation Method
Metode Pembanding Perusahaan Guideline Publicly Traded
Terbuka 47.617 10,00% 4.762 Company Method
Indikasi Nilai Pasar Wajar 100,00% 69.711 Indicative Fair Market Value
Metode Penilaian
Indikasi Nilai
Pasar Wajar/
Indicative
Fair Market
Value
Bobot/
Weight
Nilai/
ValueValuation Method

This report is originally issued in Bahasa Indonesia
134
Lampiran G Exhibit G
PT Barasentosa Lestari PT Barasentosa Lestari
Indikasi Nilai Pasar Wajar 100,00% Saham Indicative Fair Market Value of 100.00% Shares
Metode Diskonto Pendapatan Ekonomi Mendatang Discounted Future Economic Income Method
Per 31 Desember 2016 As of 31 December 2016
(Dalam ribuan USD) (In thousands of USD)
2017 (1.581) 0,9773 (1.545)
2018 (2.181) 0,8955 (1.953)
2019 6.166 0,8207 5.060
2020 15.176 0,7522 11.415
2021 21.802 0,6894 15.030
2022 20.610 0,6318 13.021
2023 20.725 0,5790 12.000
2024 21.329 0,5306 11.317
2025 22.778 0,4863 11.077
2026 22.843 0,4457 10.181
2027 22.633 0,4085 9.246
2028 23.473 0,3744 8.788
2029 22.978 0,3431 7.884
2030 22.259 0,3144 6.998
2031 22.049 0,2881 6.352
2032 22.035 0,2640 5.817
2033 22.034 0,2420 5.332
2034 22.027 0,2218 4.886
2035 22.012 0,2033 4.475
2036 21.993 0,1863 4.097
2037 21.978 0,1707 3.752
2038 21.975 0,1564 3.437
2039 37.684 0,1433 5.400
Nilai kini arus kas bersih/
Present value of free cash flows 162.069
Aset non-operasi/
Non-operating assets:
Kas dan setara kas/
Cash and cash equivalent 36
Jaminan/
Refundable deposits 16
Dana yang dibatasi penggunaannya/
Restricted deposits 424
Utang bank/
Bank loan (40.000)
Utang lain-lain/
Other payables (29.801)
Indikasi nilai pasar wajar 100,00% saham/
Indicative fair market value of 100.00% shares 92.744
Tahun/
Year
Arus Kas Bersih/
Net Cash Flows
Faktor Diskonto/
Discount Factor
Nilai Kini
Arus Kas Bersih/
Present Value of
Net Cash Flows

This report is originally issued in Bahasa Indonesia
135
Lampiran H Exhibit H
PT Barasentosa Lestari PT Barasentosa Lestari
Indikasi Nilai Pasar Wajar 100,00% Saham Indicative Fair Market Value of 100.00% Shares
Metode Akumulasi Aset Assets Accumulation Method
Per 31 Desember 2016 As of 31 December 2016
(Dalam ribuan USD) (In thousand of USD)
Indikasi Nilai
Pasar Wajar/
Indicative
Fair Market
Value
A S E T A S S E T S
ASET LANCAR CURRENT ASSETS
Kas dan setara kas 36 - 36 Cash and cash equivalents
Uang muka 645 - 645 Advance payments
Biaya dibayar di muka 5 - 5 Prepayments
Pajak dibayar di muka 0 - 0 Prepaid taxes
Jumlah Aset Lancar 686 - 686 Total Current Assets
ASET TIDAK LANCAR NON-CURRENT ASSETS
Aset tetap 209 - 209 Fixed assets
Jaminan 16 - 16 Refundable deposits
Dana yang dibatasi dalam penggunaannya 424 - 424 Restricted deposits
Biaya eksplorasi dan pengembangan Deferred exploration and development
ditangguhkan 79.834 63.541 143.375 expenditures
Jumlah Aset Tidak Lancar 80.483 63.541 144.024 Total Non-Current Assets- -
TOTAL ASET 81.169 63.541 144.710 TOTAL ASSETS
LIABILITAS DAN EKUITAS LIABILITIES AND EQUITY
LIABILITAS LIABILITIES
LIABILITAS JANGKA PENDEK CURRENT LIABILITIES
Biaya yang masih harus dibayar 3.316 - 3.316 Accrued expenses
Utang pajak 312 - 312 Taxes payable
Utang lain-lain 162 - 162 Other payables
Uang muka pelanggan 13 - 13 Advance from customers
Jumlah Liabilitas Jangka Pendek 3.803 - 3.803 Total Current Liabilities
LIABILITAS JANGKA PANJANG NON-CURRENT LIABILITIES
Obligasi konversi 9.939 - 9.939 Convertible bonds
Utang bank 40.000 - 40.000 Bank loans
Utang lain-lain - pihak berelasi 29.801 - 29.801 Other payables - related parties
Liabilitas imbalan kerja karyawan 291 - 291 Post-employment benefit obligation
Liabilitas pajak tangguhan 12 - 12 Deferred tax liabilities
Jumlah Liabilitas Jangka Panjang 80.043 - 80.043 Total Non-Current Liabilities
JUMLAH LIABILITAS 83.846 - 83.846 TOTAL LIABILITIES
EKUITAS (2.677) 63.541 60.864 EQUITY
JUMLAH LIABILITAS DAN EKUITAS 81.169 63.541 144.710 TOTAL LIABILITIES AND EQUITY
Indikasi nilai pasar wajar 100,00% saham 70.804 Indicative fair market value of 100.00% shares
Keterangan 31/12/16
Penyesuian/
Descriptions
Adjustments

This report is originally issued in Bahasa Indonesia
136
Lampiran I Exhibit I
PT Barasentosa Lestari PT Barasentosa Lestari
Rekonsiliasi Nilai Value Reconciliation
Per 31 Desember 2016 As of 31 December 2016
(Dalam ribuan USD) (In thousands of USD)
Metode Diskonto Pendapatan Ekonomi Discounted Future Economic Income
Mendatang 92.744 80,00% 74.195 Method
Metode Akumulasi Aset 70.804 20,00% 14.161 Assets Accumulation Method
Indikasi Nilai Pasar Wajar 100,00% 88.356 Indicative Fair Market Value
Metode Penilaian
Indikasi Nilai
Pasar Wajar/
Indicative
Fair Market
Value
Bobot/
Weight
Nilai/
ValueValuation Method