jll’s global market perspective report - jll. · pdf filethe pace of improvement in the...
TRANSCRIPT

[Type text]
Real Estate Markets Thrive
Despite Economic Headwinds
Global Market Perspective | Q3 2015
COPYRIGHT © JONES LANG LASALLE IP, INC. 2015. All Rights Reserved 2
Global Market Perspective, Third Quarter 2015
Global Market Perspective
Contents
Real Estate Markets Thrive despite Economic Headwinds ........................................................................................... 3
Global Economy ................................................................................................................................................................ 6
Real Estate Capital Markets ............................................................................................................................................. 8
Investment Volumes ............................................................................................................................................................ 8
Capital Values and Yields ................................................................................................................................................. 13
Corporate Occupiers ...................................................................................................................................................... 14
Global Real Estate Health Monitor ................................................................................................................................. 16
Office Markets ................................................................................................................................................................. 17
Office Demand Dynamics ................................................................................................................................................. 17
Office Supply Trends ......................................................................................................................................................... 20
Office Rental Trends ......................................................................................................................................................... 23
Retail Markets .................................................................................................................................................................. 26
Industrial Warehousing Markets .................................................................................................................................... 28
Hotel Markets ................................................................................................................................................................... 29
Residential Markets ........................................................................................................................................................ 32
Key Investment Transactions in Q2 2015 ..................................................................................................................... 35
Illustrative Office Occupational Transactions in Q2 2015 ........................................................................................... 39

Global Market Perspective, Third Quarter 2015
COPYRIGHT © JONES LANG LASALLE IP, INC. 2015. All Rights Reserved 3
Real Estate Markets Thrive despite Economic Headwinds
Investment and occupational markets move in tandem
Momentum continues to build in the world’s major commercial real estate markets and, for the first time in the current
cycle, growth in leasing activity has matched that of investment. Significantly, office leasing volumes are at their highest
level for more than three years, with healthy uplifts recorded across all three global regions. Meanwhile, investor
appetite for real estate shows no signs of abating, with a potential Grexit, China stock market volatility and expectations
of rising U.S. interest rates doing little to knock real estate investment off its stride.
Investors push yields to new lows
Investment activity has continued to expand vigorously. Volumes during the first half of the year, at US$177 billion, were
9% up on H1 2014 and an impressive 19% higher when denominated in local currencies. Larger single-asset and
portfolio deals are now a regular feature of the dominant markets. The weight of money is still pushing yields to new
lows, with yields compressing at their fastest pace for five years.
Prime Office Yields, 2007-2015
*20 Major Office Markets
Source: JLL, July 2015
The U.S. has been the standout investment market, with year-to-date volumes increasing 29% on 2014. Germany and
the UK have also registered a strong first half of the year, while China has bounced back robustly during Q2. Investor
demand is high in Australia and Japan, but activity in these markets has been constrained by a lack of product.
The ‘Super Cities’ shine
Investor demand for prime assets in the ‘Super Cities’ has reached new heights, with New York and London having
their busiest first half of the year since 2006, accounting for a record 15% of global activity. Their scale, liquidity,
transparency and ‘safe haven’ attributes are attracting significant capital from sovereign wealth funds, global institutions
and HNWIs.
4.8
5.2
5.6
6.0
6.4
6.8
7.2
-40-30-20-10
010203040506070
Q12007
Q22007
Q32007
Q42007
Q12008
Q22008
Q32008
Q42008
Q12009
Q22009
Q32009
Q42009
Q12010
Q22010
Q32010
Q42010
Q12011
Q22011
Q32011
Q42011
Q12012
Q22012
Q32012
Q42012
Q12013
Q22013
Q32013
Q42013
Q12014
Q22014
Q32014
Q42014
Q12015
Q22015
Mean Prime Office Yields*
5.50%
4.94%
Yield Compression (bps)
%
bps
6.92%
COPYRIGHT © JONES LANG LASALLE IP, INC. 2015. All Rights Reserved 4
Global Market Perspective, Third Quarter 2015
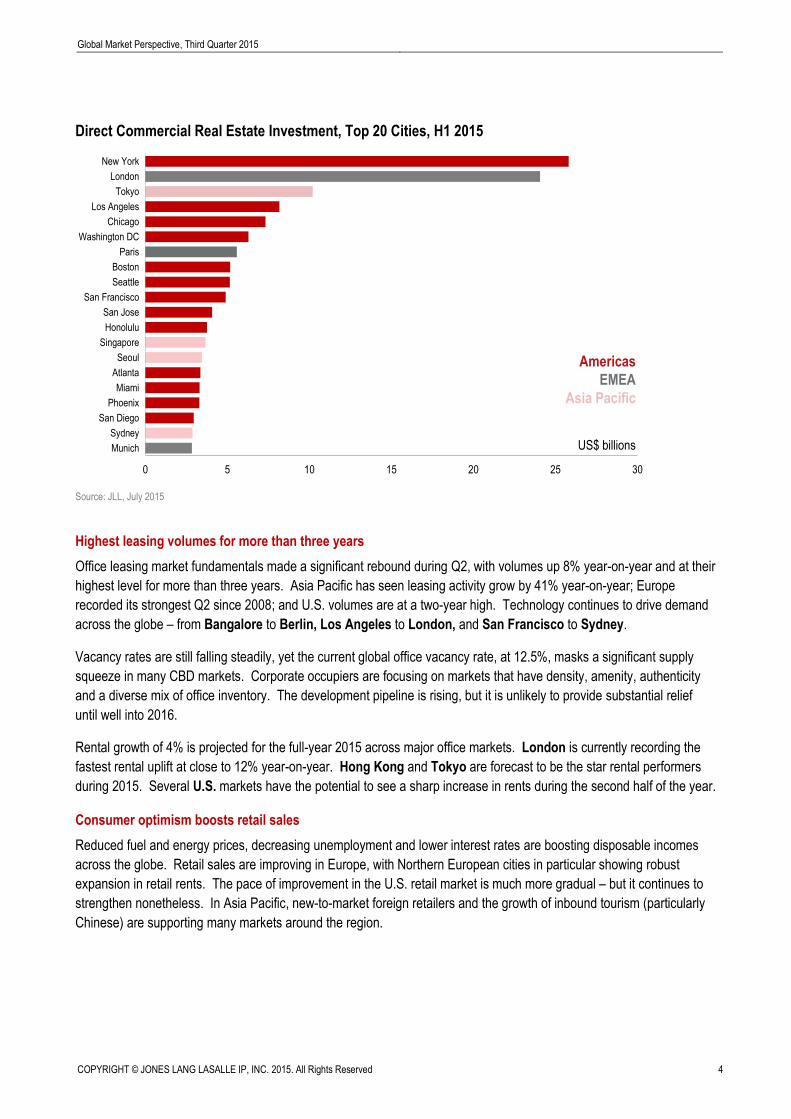
Direct Commercial Real Estate Investment, Top 20 Cities, H1 2015
Source: JLL, July 2015
Highest leasing volumes for more than three years
Office leasing market fundamentals made a significant rebound during Q2, with volumes up 8% year-on-year and at their
highest level for more than three years. Asia Pacific has seen leasing activity grow by 41% year-on-year; Europe
recorded its strongest Q2 since 2008; and U.S. volumes are at a two-year high. Technology continues to drive demand
across the globe – from Bangalore to Berlin, Los Angeles to London, and San Francisco to Sydney.
Vacancy rates are still falling steadily, yet the current global office vacancy rate, at 12.5%, masks a significant supply
squeeze in many CBD markets. Corporate occupiers are focusing on markets that have density, amenity, authenticity
and a diverse mix of office inventory. The development pipeline is rising, but it is unlikely to provide substantial relief
until well into 2016.
Rental growth of 4% is projected for the full-year 2015 across major office markets. London is currently recording the
fastest rental uplift at close to 12% year-on-year. Hong Kong and Tokyo are forecast to be the star rental performers
during 2015. Several U.S. markets have the potential to see a sharp increase in rents during the second half of the year.
Consumer optimism boosts retail sales
Reduced fuel and energy prices, decreasing unemployment and lower interest rates are boosting disposable incomes
across the globe. Retail sales are improving in Europe, with Northern European cities in particular showing robust
expansion in retail rents. The pace of improvement in the U.S. retail market is much more gradual – but it continues to
strengthen nonetheless. In Asia Pacific, new-to-market foreign retailers and the growth of inbound tourism (particularly
Chinese) are supporting many markets around the region.
0 5 10 15 20 25 30
Munich
Sydney
San Diego
Phoenix
Miami
Atlanta
Seoul
Singapore
Honolulu
San Jose
San Francisco
Seattle
Boston
Paris
Washington DC
Chicago
Los Angeles
Tokyo
London
New York
Americas
EMEA
Asia Pacific
US$ billions
Global Market Perspective, Third Quarter 2015
COPYRIGHT © JONES LANG LASALLE IP, INC. 2015. All Rights Reserved 5
Realignment of logistics networks heightens demand
Continued innovation in order fulfilment and delivery is driving further adaption of logistics networks and heightening
demand in multimodal locations, for automated facilities and for facilities supporting efficient urban logistics. Demand is
also being boosted by a strengthening manufacturing sector. In the U.S., absorption is still outpacing new supply and
vacancy rates remain low. Likewise, vacancy is very low in Europe, but here speculative development is, as yet,
extremely limited.
Global hotel investment going from strength to strength
Global hotel transaction volumes have gone from strength to strength, reaching a new high of US$42 billion in H1 2015,
up 55% from the same period last year. Europe continues to be a magnet for foreign investment in hotel assets.
Investors from the Middle East and mainland China have been the major exporters of capital.
Robust appetite for institutional-grade residential product
Demand for institutional-grade residential product continues apace in many markets across the globe. In the U.S.,
multifamily investment sales momentum exceeds the 2007 peak; volumes are at record levels in Germany; and there is
growing investor appetite for institutional-grade rental product in the fledging UK market. Policy restrictions remain in
place in various Asian residential markets, but sales activity is slowly increasing and China has relaxed its down-
payment rules for buyers of second homes. Dubai has seen a notable decline in residential sales, but falls in prices
have been modest. Australia is also showing signs of capital growth moderation.

COPYRIGHT © JONES LANG LASALLE IP, INC. 2015. All Rights Reserved 6
Global Market Perspective, Third Quarter 2015
Global Economy
Global upswing still faces headwinds and Grexit risks remain
After a disappointing start to the year, it has been an unsettled quarter for the global economy. While there have been
more encouraging signs on economic activity in the advanced economies, most notably in the U.S. and the Eurozone,
lingering risks and uncertainties refuse to dissipate and continue to cloud the outlook. While few expect a reversal in the
slow revival, forecasts remain cautious for this year and there appears little prospect of an acceleration in global GDP
before 2016.
A last-minute deal for Greece was passed in July that included controversial austerity measures. The schedule for
securing funding is tight and, although progress has been made, the Grexit danger has still not disappeared. Creditors
will be demanding further market reforms to improve economic performance which will likely be difficult for the Greek
administration to accept, particularly as debt relief seems to be off-the-table in the near term.
While Greece dominated headlines for much of July, a sharp sell-off in Chinese equities has also reminded investors
about the risks to financial stability in the world’s second largest economy. The reaction of the Chinese authorities was
swift, but also interventionist, raising further concerns about the depth of market reforms in China.
These global uncertainties have been reflected in a patchy set of forecast revisions over the last three months. The U.S.
and UK have received downgrades, though this largely reflects historic weakness and more recent news has been more
upbeat. Similarly, Germany has also suffered from a poorer-than-expected Q1 and a subsequent downgrade to the
year’s outlook, though this contradicts the improving tone of most other Eurozone data, including figures from France.
Of the few of our focus markets to be upgraded, Japan has received the most notable boost.
GDP Projections for 2015 in Major Economies – Recent Movements
Australia China France Germany India Japan UK U.S.
April 2.7 6.6 1.2 2.4 7.5 0.8 2.8 2.7
July (Latest) 2.6 6.6 1.3 1.9 7.5 1.0 2.6 2.3
Change (bps) -10 0 +10 -50 0 +20 -20 -40
Source: Oxford Economics, July 2015
Bumpy ride for Eurozone bonds, while U.S. tightening moves ever closer
After the ECB’s QE announcement in Q1, European monetary developments have been dominated by its
implementation from March. The initial impact of the liquidity injection in the Eurozone was falling bond rates, but this
trend was reversing by the summer as a result of receding deflation fears. Since then there has been considerable
volatility, including a slight increase of peripheral Eurozone spreads (Spain, Portugal, Italy and Ireland, relative to
Germany) as contagion risk has heightened in the Greek crisis. Markets have calmed post-deal, while bond rates
remain at historically low levels with the 10-year bund rate still sub-1%.
Providing that the Eurozone situation stabilises, attention will shift back to the U.S. in Q3 with the impending Fed rate
hike. The U.S. is still expected to lead the tightening in global rates during 2015, but there continues to be intense
speculation about the timing. Events in Greece and China have provided a sobering reminder of global fragility and
were noted in recent FOMC notes, but are also set against improving U.S. data during Q2. The consensus remains that
U.S. rates will rise during Q3, probably in September. However, policymakers will continue to err on the side of caution if
there is any sign of uncertainty, and there is still a significant chance that the decision could be delayed.
Global Market Perspective, Third Quarter 2015
COPYRIGHT © JONES LANG LASALLE IP, INC. 2015. All Rights Reserved 7
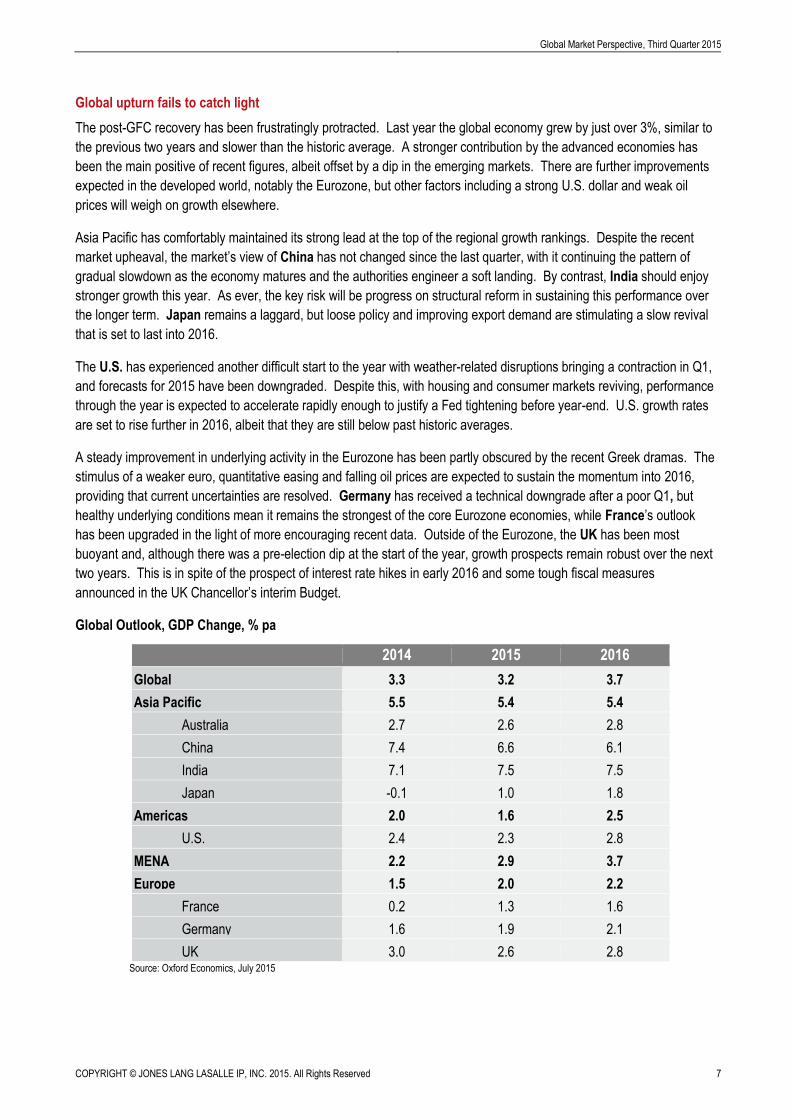
Global upturn fails to catch light
The post-GFC recovery has been frustratingly protracted. Last year the global economy grew by just over 3%, similar to
the previous two years and slower than the historic average. A stronger contribution by the advanced economies has
been the main positive of recent figures, albeit offset by a dip in the emerging markets. There are further improvements
expected in the developed world, notably the Eurozone, but other factors including a strong U.S. dollar and weak oil
prices will weigh on growth elsewhere.
Asia Pacific has comfortably maintained its strong lead at the top of the regional growth rankings. Despite the recent
market upheaval, the market’s view of China has not changed since the last quarter, with it continuing the pattern of
gradual slowdown as the economy matures and the authorities engineer a soft landing. By contrast, India should enjoy
stronger growth this year. As ever, the key risk will be progress on structural reform in sustaining this performance over
the longer term. Japan remains a laggard, but loose policy and improving export demand are stimulating a slow revival
that is set to last into 2016.
The U.S. has experienced another difficult start to the year with weather-related disruptions bringing a contraction in Q1,
and forecasts for 2015 have been downgraded. Despite this, with housing and consumer markets reviving, performance
through the year is expected to accelerate rapidly enough to justify a Fed tightening before year-end. U.S. growth rates
are set to rise further in 2016, albeit that they are still below past historic averages.
A steady improvement in underlying activity in the Eurozone has been partly obscured by the recent Greek dramas. The
stimulus of a weaker euro, quantitative easing and falling oil prices are expected to sustain the momentum into 2016,
providing that current uncertainties are resolved. Germany has received a technical downgrade after a poor Q1, but
healthy underlying conditions mean it remains the strongest of the core Eurozone economies, while France’s outlook
has been upgraded in the light of more encouraging recent data. Outside of the Eurozone, the UK has been most
buoyant and, although there was a pre-election dip at the start of the year, growth prospects remain robust over the next
two years. This is in spite of the prospect of interest rate hikes in early 2016 and some tough fiscal measures
announced in the UK Chancellor’s interim Budget.
Global Outlook, GDP Change, % pa
2014 2015 2016
Global 3.3 3.2 3.7
Asia Pacific 5.5 5.4 5.4
Australia 2.7 2.6 2.8
China 7.4 6.6 6.1
India 7.1 7.5 7.5
Japan -0.1 1.0 1.8
Americas 2.0 1.6 2.5
U.S. 2.4 2.3 2.8
MENA 2.2 2.9 3.7
Europe 1.5 2.0 2.2
France 0.2 1.3 1.6
Germany 1.6 1.9 2.1
UK 3.0 2.6 2.8 Source: Oxford Economics, July 2015

COPYRIGHT © JONES LANG LASALLE IP, INC. 2015. All Rights Reserved 8
Global Market Perspective, Third Quarter 2015
Real Estate Capital Markets
Investment Volumes
Deals are getting bigger and more sophisticated as volumes increase further
Transactional volumes in Q2 2015 were US$177 billion, which is 9% higher than the second quarter of 2014. On a year-
to-date basis, volumes at US$333 billion are also 9% higher than last year with larger deals and portfolios now a regular
feature of the investment market. However, the strength of the U.S. dollar over the first half of the year is masking the
true level of transactional activity around the world. This is particularly true for the Eurozone, UK, Japan, Australia and
South Korea where the dollar is between 10% and 20% stronger than a year ago. If fixed exchange rates were used,
then volumes would be up 19% globally over the first half of 2015 compared to 2014.
Threat of rising Fed rate yet to knock real estate off its stride
The United States continues to be the major driver of activity in the Americas and globally, with growth over 30% up on
Q2 last year and 29% higher than 2014’s first six months. This has helped increase regional volumes almost 20%, both
on a year-on-year and year-to-date basis, to US$153 billion. Elsewhere in the region, volumes in Canada are 6% down
year-to-date against 2014, with falls in Brazil and Mexico even more pronounced; both countries are circa 80% lower
than the first six months of 2014.
Potential Grexit and Brexit does little to disrupt investment in real estate assets
European volumes in local currency terms continue to move higher, up 28% on Q2 2014 and 26% on H1 2014. Growth
over the first half of the year has been spread region-wide with uplifts in the UK and Germany being supported by
increases in the Nordics and Southern Europe, despite the Greek turmoil. Even Russia is showing some signs of
renewed optimism with stronger levels of activity. In U.S. dollar terms, volumes are slightly higher both year-on-year and
over the first six months at US$124 billion, with the difference to local currency activity almost entirely due to foreign
exchange factors.
New York and London account for 15% of transactions globally
New York and London have witnessed one of their busiest first halves of the year, with US$26 billion and US$24 billion
transacted respectively. They stand head-and-shoulders above all other cities and, between them, accounted for 15% of
global transactions in H1 2015. Their scale and liquidity continues to attract capital, with global institutions, sovereign
wealth funds and HNWIs representing a notable share of buyers.
Stable first half with market-setting assets on the horizon to trade
Asia Pacific’s biggest markets of Japan and Australia are feeling the effects of the stronger U.S. dollar; both country’s
currencies are 15% weaker than the same period last year and this is also feeding through into weaker transactional
volumes for Australia. This has had the effect of depressing regional volumes by 2% compared to Q2 2014 but half-year
volumes are 2% higher than H1 2014 at US$56 billion. Regionally, the second half of the year looks as if it will be much
stronger than the first with a number of large transactions set to close in Singapore, Australia and China. Hong Kong
has been one of the bright spots over the first half with volumes up 66% year-on-year.
Structural shift in investment habits continues to support real estate investment
The second quarter of the year has been dominated by discussions around Greece’s role in the Eurozone and the
extreme volatility we have seen in equities in China. What has garnered less attention, but is probably more important,
is the continuing decline in global interest rates, with Sweden cutting its interest rate to minus 0.35% despite the
economy forecast to grow by 3% in 2015, and China also cutting rates for the fourth time since November 2014. This
decline in global interest rates makes real estate investment more attractive and should support transactional activity for
the remainder of 2015. The longer-term structural shift of institutional capital allocating more to real estate also

Global Market Perspective, Third Quarter 2015
COPYRIGHT © JONES LANG LASALLE IP, INC. 2015. All Rights Reserved 9
continues, with a recent PwC report estimating that alternative investments, including real estate, could reach US$15
trillion by 2020, up from US$8 trillion today. JLL maintains its full-year 2015 forecast at US$750-760 billion which
represents a 5% rise on 2014 transactional activity.
Direct Commercial Real Estate Investment – Regional Volumes, 2014-2015
Source: JLL, July 2015
Direct Commercial Real Estate Investment – Largest Markets, 2014-2015
Source: JLL, July 2015
REGIONS IN FOCUS
U.S. momentum builds further
The Americas region is well on pace to achieve a new high-water mark in 2015 – exceeding the record volumes seen
over the 2006-2007 period (on an ex-entity deal-level basis) and 20% higher than 2014. Growth is being entirely driven
by the U.S. market where there is a very active transaction pipeline across sectors and geographies.
A combination of attributes is continuing to make the U.S. commercial property market a highly sought-after destination
for capital placement for both domestic and global investors, including relative economic outperformance among
advanced economies, a broad ‘safe haven’ appeal, and attractive yield on offer against the backdrop of very low interest
rates worldwide. Of particular note is that large portfolio transactions are being increasingly pursued and, by extension,
this includes an increase in M&A activity among REITs and other property investment firms (although those transactions
are, by and large, not included in volumes cited in this report).
US$ billions Q1 15 Q2 15
% change
Q1 15-Q2 15 Q2 14
% change
Q2 14-Q2 15 YTD 2014 YTD 2015
% change
YTD 2014- YTD 2015
Americas 73 81 11% 67 20% 129 153 19%
EMEA 59 65 11% 63 3% 120 124 3%
Asia Pacific 25 31 24% 31 -2% 55 56 2%
TOTAL 156 177 13% 162 9% 304 333 9%
US$ billions Q1 15 Q2 15
% change
Q1 15-Q2 15 Q2 14
% change
Q2 14-Q2 15 YTD 2014 YTD 2015
% change
YTD 2014- YTD 2015
U.S. 69.5 75.7 9% 56.8 33% 112.7 145.3 29%
UK 23.7 24.4 3% 21.3 14% 43.3 48.1 11%
Germany 10.4 14.9 44% 8.6 72% 19.8 25.2 27%
China 2.6 7.9 210% 5.1 54% 8.1 10.5 29%
Japan 12.9 6.4 -50% 8.4 -23% 20.6 19.3 -6%
Australia 2.5 4.4 74% 7.8 -44% 11.9 6.9 -42%
Norway 1.8 4.2 128% 2.0 109% 2.8 6.0 115%
Hong Kong 1.0 3.8 284% 1.9 102% 2.9 4.8 66%
Canada 2.6 3.5 37% 2.8 28% 6.5 6.1 -6%
France 4.8 3.3 -32% 11.2 -70% 16.9 8.2 -52%
South Korea 0.7 3.2 329% 2.6 23% 3.4 3.9 13%
Sweden 1.8 2.9 58% 4.2 -33% 7.4 4.7 -37%
Netherlands 0.8 2.5 232% 2.9 -13% 4.9 3.3 -34%
Spain 2.6 2.2 -18% 2.0 6% 3.6 4.8 32%
Singapore 2.0 1.8 -8% 2.4 -24% 3.6 3.8 6%
Czech Republic 0.9 1.7 97% 0.5 219% 0.8 2.5 200%
Italy 2.3 1.6 -28% 1.4 21% 2.5 3.9 58%
Finland 0.8 1.3 59% 0.6 141% 1.4 2.2 60%
Malaysia 0.7 1.1 66% 0.4 172% 0.4 1.8 324%

COPYRIGHT © JONES LANG LASALLE IP, INC. 2015. All Rights Reserved 10
Global Market Perspective, Third Quarter 2015
Weaker investment activity across Latin America
Transaction activity remained far weaker in Latin America during the second quarter. Although both Brazil and Mexico
are subject to the ‘lumpiness’ of large individual and portfolio sales in their developing markets, there has nonetheless
been a marked slowing in deal velocity thus far in 2015. Brazil, in particular, is also being impacted by its recession and
property market downturn. Nevertheless, the second half of 2015 is likely to bring improved transaction activity to both
markets on a relative basis.
Direct Commercial Real Estate Investment – 2007-2015
Source: JLL, July 2015
Uncertainty drives investors to ‘safe haven’ asset classes in Europe
The euro has come under sustained pressure since the middle of last year due to a combination of expectations of a
return to the rate hike cycle in the U.S., an aggressive quantitative easing programme in Europe and, more recently,
concerns over the viability of the European project as a result of Greece’s debt crisis. Though the impact on the euro is
meaningful, if anything, the uncertainty in Europe has driven investors further towards ‘safe haven’ asset classes such
as real estate.
UK and Germany outperform as investors focus on core markets
The UK, Europe’s largest market, continues to perform strongly, rising by 26% year-on-year in local currency terms to
£15.9 billion, accounting for 37% of the region’s volumes. Activity in Germany has also been strong, with year-on-year
volumes more than doubling in euro terms to €13.4 billion.
Smaller European markets mixed in both local currency and U.S. dollar terms
Southern Europe has remained resilient in the second quarter, despite concerns over the future of Greece, with
investment up 16% year-on-year at US$4.5 billion driven by Portugal and Italy. Investment in the Nordics overall was
strong, with impressive increases in Finland and Norway, but volumes have fallen in Sweden. Volumes have also been
weaker in the Benelux. Activity in the CEE region was up over Q2 (66% year-on-year) to US$2.9 billion.
0
30
60
90
120
150
180
210
240
Q10
7
Q20
7
Q30
7
Q40
7
Q10
8
Q20
8
Q30
8
Q40
8
Q10
9
Q20
9
Q30
9
Q40
9
Q11
0
Q21
0
Q31
0
Q41
0
Q11
1
Q21
1
Q31
1
Q41
1
Q11
2
Q21
2
Q31
2
Q41
2
Q11
3
Q21
3
Q31
3
Q41
3
Q11
4
Q21
4
Q31
4
Q41
4
Q11
5
Q21
5
Americas EMEA Asia Pacific Rolling Four-Quarter Average
US
$ bi
llion
s
205
107110100
113
7369666666
100
118120
159
204
190
119
91
110100
163
41 4335
108
124
146
211
142
162
175
231
156
177
Global Market Perspective, Third Quarter 2015
COPYRIGHT © JONES LANG LASALLE IP, INC. 2015. All Rights Reserved 11
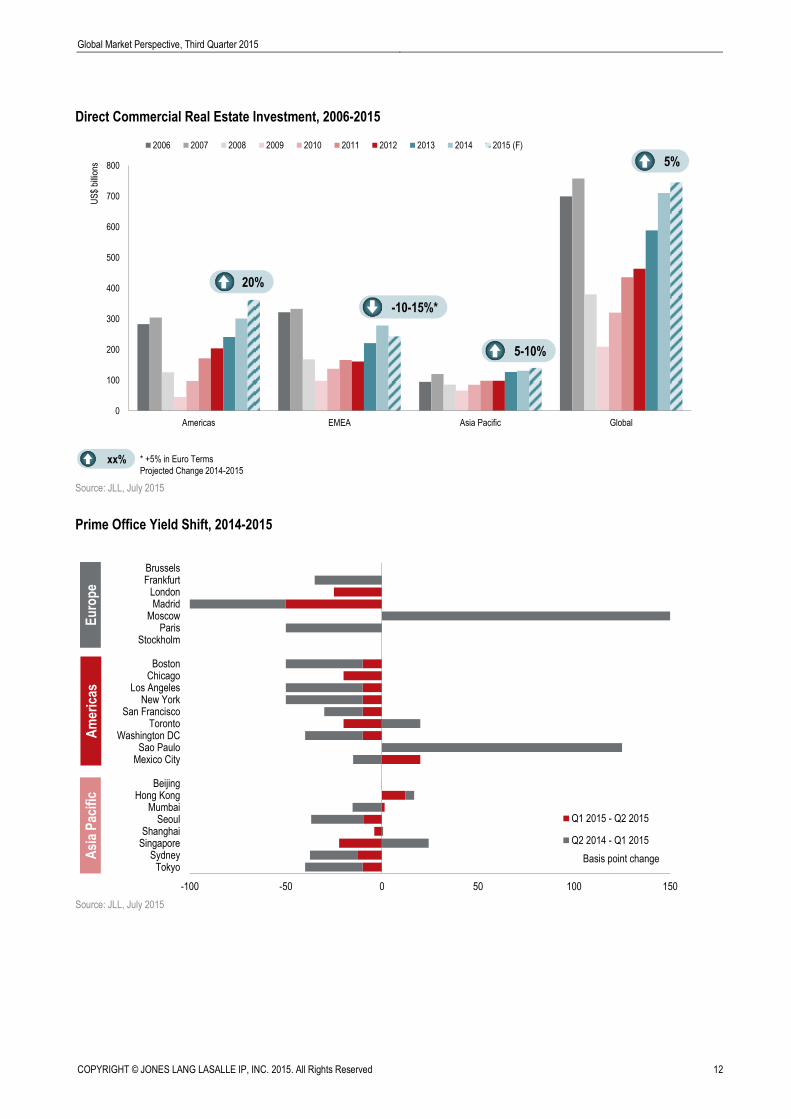
Market to remain robust in Europe
While it is hard to draw conclusions from one quarter of data, investment activity across Europe remains robust. The
region does not yet show any signs of slowing down due to concerns about the future of Greece and its possible
exclusion from the euro. Indeed, Europe is still benefiting from low borrowing costs in its core markets, plentiful liquidity
and a continued move to ‘safe haven’ assets. JLL’s forecast for full-year 2015 is for a 5% increase on 2014 in euro
terms, which would signify a 10%-15% fall in U.S. dollar terms (at quarter-end exchange rates).
Asia Pacific still on track for record year
In general, the Asia Pacific investment market remains active with strong investor appetite demonstrated by a wave of
large transactions and the appearance of more trophy assets on the market over the past six months. Furthermore, the
region has witnessed an increase in portfolio transactions in H1 2015. Investment volumes are expected to pick up
significantly during the second half of the year; JLL maintains its forecast for transaction volumes of US$140 billion for
the full-year 2015, which translates to a year-on-year gain of 5%-10%.
Meanwhile, Asian debt markets experienced a period of volatility over the second quarter. New debt issues continue to
be present in most Asian markets but moderated in Q2 2015 as investors focused more on longer-term maturity fixed
rate bonds to avoid near-term refinancing risk.
Australia’s investment volumes constrained by lack of product
The limited availability of good-quality stock after several years of robust investment activity is constraining transactions
in Australia. Moreover, the sale of the Investa portfolio is diverting attention, with investors and vendors awaiting new
pricing from the sale before bringing assets to the market. Overseas investors, especially from Asia, continue to be
attracted to Australian assets, in part due to the weak Australian dollar and attractive yields.
Liquidity is high in Japan
The market in Japan was stable in local currency terms in H1 2015. There is still ample liquidity as more equity funds
were raised in Q2, and foreign investor demand remains at an unprecedented level on the back of a weak currency.
Regional leader China’s volumes up 54% year-on-year on more stimulus measures
China ranked first in investment volumes in the region during Q2 with volumes up 54% year-on-year. Sentiment in core
offices is improving in the country’s Tier 1 or top-end Tier 2 cities driven by sufficient liquidity from core and core-plus
funds looking for assets with strong yields. Lower interest rates and bank reserve requirement ratios are likely to reduce
the costs of borrowing going forward and may provide more upside for the real estate investment market. However, the
recent volatility seen in China’s equity market may potentially slow the investment decision process and lead to more
outbound investment.
ADIA’s hotel portfolio deal boosts Hong Kong volumes
In Hong Kong, transaction volumes for Q2 2015 more than doubled year-on-year largely due to the three-hotel property
portfolio platform deal between Abu Dhabi Investment Authority (ADIA) and New World Development for US$2.4 billion.
The high-profile acquisitions mark ADIA’s largest investment in Asia to date.
Investors struggle to access product in India
India’s transaction volumes in the second quarter were flat year-on-year, with access to stock remaining a barrier to
entry. Investors continue to prefer stabilised assets in the retail and logistics sectors and there is still abundance of
liquidity as new private equity funds look to take in India’s growth story.
COPYRIGHT © JONES LANG LASALLE IP, INC. 2015. All Rights Reserved 12
Global Market Perspective, Third Quarter 2015
Direct Commercial Real Estate Investment, 2006-2015
Source: JLL, July 2015
Prime Office Yield Shift, 2014-2015
Source: JLL, July 2015
0
100
200
300
400
500
600
700
800
Americas EMEA Asia Pacific Global
US
$ bi
llion
s
2006 2007 2008 2009 2010 2011 2012 2013 2014 2015 (F)
xx% * +5% in Euro Terms
Projected Change 2014-2015
5-10%
-10-15%*
20%
5%
-100 -50 0 50 100 150
TokyoSydney
SingaporeShanghai
SeoulMumbai
Hong KongBeijing
Mexico CitySao Paulo
Washington DCToronto
San FranciscoNew York
Los AngelesChicagoBoston
StockholmParis
MoscowMadrid
LondonFrankfurtBrussels
Q1 2015 - Q2 2015
Q2 2014 - Q1 2015
Basis point change
Am
eric
asE
uro
pe
Asi
a P
acif
ic
Global Market Perspective, Third Quarter 2015
COPYRIGHT © JONES LANG LASALLE IP, INC. 2015. All Rights Reserved 13
Capital Values and Yields
Yield compression defies expectations
Though yields in many core markets are perceived to have reached their low point in the cycle, compression of yields for
prime office assets (across 20 major markets) continued into Q2; in fact, at its strongest pace for nearly five years. The
weight of investor demand pushed yields down by 50 bps in Madrid and by a further 25 bps in London, while a 10-20
bps compression was seen across the board in North America’s gateway cities. In Asia Pacific, yields fell in Sydney
(12.5 bps) and Tokyo (10 bps) on the back of robust investor demand.
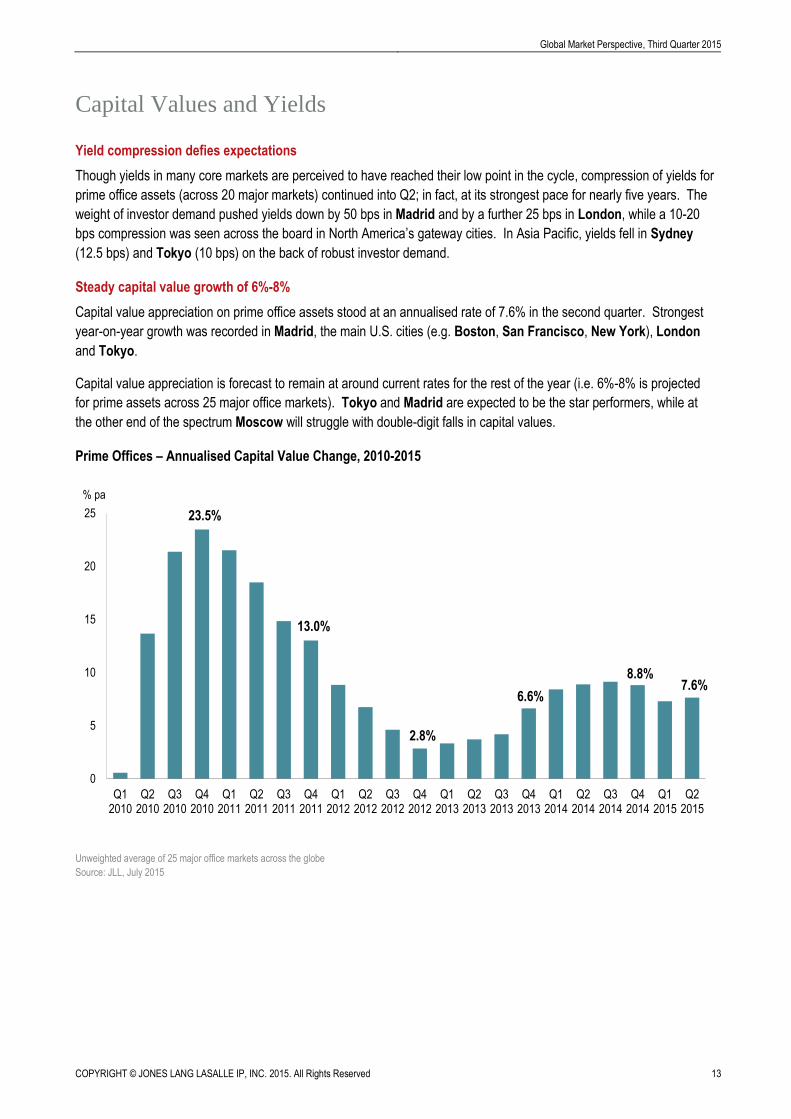
Steady capital value growth of 6%-8%
Capital value appreciation on prime office assets stood at an annualised rate of 7.6% in the second quarter. Strongest
year-on-year growth was recorded in Madrid, the main U.S. cities (e.g. Boston, San Francisco, New York), London
and Tokyo.
Capital value appreciation is forecast to remain at around current rates for the rest of the year (i.e. 6%-8% is projected
for prime assets across 25 major office markets). Tokyo and Madrid are expected to be the star performers, while at
the other end of the spectrum Moscow will struggle with double-digit falls in capital values.
Prime Offices – Annualised Capital Value Change, 2010-2015
Unweighted average of 25 major office markets across the globe
Source: JLL, July 2015
0
5
10
15
20
25
Q12010
Q22010
Q32010
Q42010
Q12011
Q22011
Q32011
Q42011
Q12012
Q22012
Q32012
Q42012
Q12013
Q22013
Q32013
Q42013
Q12014
Q22014
Q32014
Q42014
Q12015
Q22015
% pa
23.5%
13.0%
2.8%
6.6%7.6%
8.8%
COPYRIGHT © JONES LANG LASALLE IP, INC. 2015. All Rights Reserved 14
Global Market Perspective, Third Quarter 2015
Corporate Occupiers
Occupier activity on the rise globally
The second quarter of 2015 has seen a surge of occupier activity across global markets. Despite continued volatility in
operating and macroeconomic conditions, business sentiment remains robust with corporates increasingly moving into
growth mode. According to a recent CEO Survey from PwC, 50% of CEOs questioned reported plans to increase their
headcount in 2015. An uplift in global leasing volumes of 24% on the quarter and 8% year-on-year provides clear
evidence of this growth trajectory.
M&A driving portfolio change
M&A is particularly high on the corporate agenda and, after 2014 witnessed the strongest increase in M&A since the
GFC, 2015 year-to-date M&A volumes remain at multi-year highs. A growing number of companies are absorbing new
real estate, consolidating, and reassessing enterprise footprints and resultant real estate portfolios. Divestments are
also increasingly common as corporates recast and optimise their businesses, with some rationalisation still apparent in
financial services. Notwithstanding these areas of ongoing restructuring, expansionary demand is now on the rise
across the majority of major global markets and sectors.
In search of authenticity
A combination of changing occupier preferences and real estate market conditions are reshaping space requirements in
some markets. In the U.S., demand for Class B space is skyrocketing among tenants. Technology, media and creative
firms are showing more interest in the character of the space, neighbourhood and the amenities that they can get within
their space than an address on Fifth Avenue or the most prestigious trophy building. A search for ‘authenticity’ appears
to be spilling into real estate from other industries.
In Asia Pacific, in addition to robust domestic activity and solid demand from MNCs, the continuing strength of smaller
occupiers is apparent; especially finance players in the key financial markets of Hong Kong, Shanghai, Singapore and
Tokyo. Flexibility is key for these high-growth occupiers who favour two-three year lease patterns, may take 500 square
metres, and grow within 18 months to double or triple that space.
In Europe, many markets are now facing a declining number of high-quality space options. In some markets, this fall in
prime supply has been sharp, driving increasing occupier mobility and forcing occupiers to plan further ahead in their real
estate strategies.
People, productivity and cost will continue to shape strategy
JLL’s recently launched global CRE survey points to a range of pressures impacting corporate real estate decision-
making; however, some themes stand out. People and productivity certainly continue to drive real estate decisions but
reducing operating expenses remains a core success factor for CRE teams. In a volatile operating environment,
flexibility is increasingly sought by occupiers with many reviewing their traditional portfolio balance of leased and owned
space. Finally, the data is clear that the volume of strategic and operational demands being placed on occupiers is
driving many towards increasing partnership and outsourcing as a way to deliver greater performance from their real
estate.
Global Market Perspective, Third Quarter 2015
COPYRIGHT © JONES LANG LASALLE IP, INC. 2015. All Rights Reserved 15
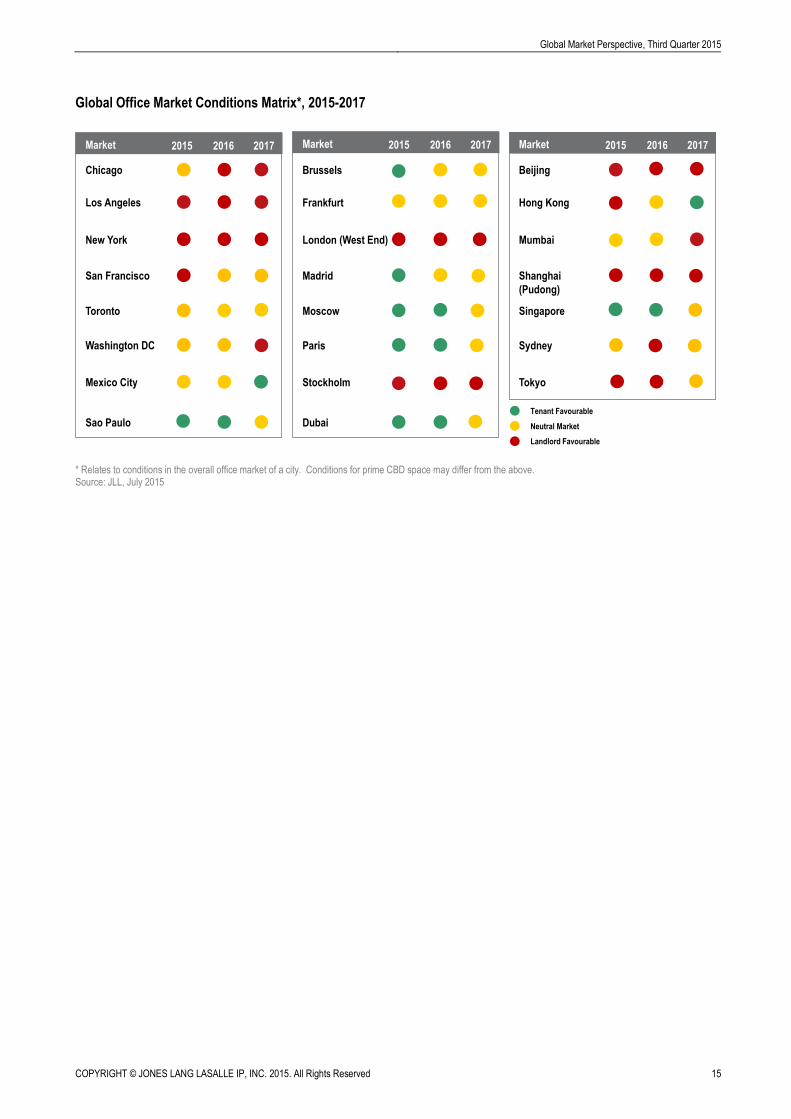
Global Office Market Conditions Matrix*, 2015-2017
* Relates to conditions in the overall office market of a city. Conditions for prime CBD space may differ from the above. Source: JLL, July 2015
MARKET
Brussels Beijing
Frankfurt Hong Kong
London (West End) Mumbai
Madrid Shanghai
(Pudong)
Moscow Singapore
Paris Sydney
Stockholm
Dubai
Market 2015 2016 2017 Market 2015 2016 2017
Tokyo
Neutral Market
Landlord Favourable
Tenant Favourable
Market
Chicago
Los Angeles
New York
San Francisco
Toronto
Washington DC
Mexico City
Sao Paulo
2015 2016 2017

COPYRIGHT © JONES LANG LASALLE IP, INC. 2015. All Rights Reserved 16
Global Market Perspective, Third Quarter 2015
Global Real Estate Health Monitor
Economy Real Estate Investment Markets Real Estate Occupier Markets
Metro
GDP
OECD
Leading
Indicator
City
Investment
Volumes
Capital
Value
Change
Prime
Yield Yield Gap
Rental
Change
Net
Absorption
Vacancy
Rate
Supply
Pipeline
Dubai 4.8% na -64% 2.3% 7.5% na 2.3% na 21.0% 14.0%
Frankfurt 2.0% 0.10 77% 9.6% 4.4% 358 1.4% 1.1% 10.0% 1.5%
Hong Kong 2.9% na 69% 2.0% 3.1% 127 7.9% 2.8% 3.5% 4.5%
London 3.9% -0.20 0% 19.9% 3.5% 147 11.9% 1.8% 3.9% 5.1%
Madrid 3.2% -0.10 170% 31.1% 4.3% 194 6.1% 1.4% 11.1% 0.8%
Mexico City 3.7% -0.40 26% -1.2% 7.5% 144 2.2% 10.0% 11.0% 16.2%
Moscow -4.6% 0.10 -39% -34.5% 10.5% -58 -23.6% 4.0% 17.0% 8.0%
Mumbai 5.2% 0.10 569% -3.3% 10.0% 195 -4.7% 8.0% 19.8% 13.0%
New York 2.8% -0.10 25% 21.2% 3.3% 97 2.5% 1.4% 9.7% 0.9%
Paris 1.6% 0.00 -18% 9.7% 3.5% 230 -4.1% -0.7% 7.6% 2.6%
Sao Paulo 0.2% -0.30 -61% -18.3% 9.8% 498 -6.3% 3.4% 23.4% 18.6%
Seoul 3.4% -0.10 24% 6.9% 4.7% 225 -0.9% -0.2% 11.5% 3.2%
Shanghai 6.5% -0.20 -21% 5.9% 5.9% 227 5.3% 16.3% 10.7% 37.6%
Singapore 3.6% na -25% 0.0% 4.0% 128 0.5% 4.8% 6.0% 12.6%
Sydney 2.4% -0.20 -32% 9.5% 6.0% 297 2.4% 2.4% 8.8% 5.2%
Tokyo 1.4% 0.00 6% 20.6% 3.1% 266 6.8% 3.3% 3.3% 10.5%
Toronto 2.4% -0.10 45% 6.8% 4.9% 322 2.7% 1.0% 9.9% 2.2%
Real estate data as at end Q2 2015
Definitions and Sources
Metropolitan Region GDP: Change in Real GDP. Projection, 2015. Source: Oxford Economics
OECD Leading Indicator: Composite Leading Indicator. Change in Index. Latest Month. Source: OECD
City Investment Volumes: Direct Commercial Real Estate Volumes. Metro Area Data. Rolling Annual Change. Source: JLL
Capital Value Change: Notional Prime Office Capital Values. Year-on-Year Change. Latest Quarter. Source: JLL
Prime Yield: Indicative Yield on Prime/Grade-A Offices. Latest Quarter. Source: JLL
Yield Gap: Basis Points that Prime Office Yields are above or below 10-year Government Bond Yields. Latest Quarter. Source: JLL, Datastream
Rental Change: Prime Office Rents. Year-on-Year Change. Latest Quarter. Source: JLL
Net Absorption: Annual Net Absorption as % of Occupied Office Stock. Rolling Annual. Source: JLL
Vacancy Rate: Metro Area Office Vacancy Rate. Latest Quarter. Source: JLL
Supply Pipeline: Metro Area Office Completions (2015-2016) as % of Existing Stock. Source: JLL

Global Market Perspective, Third Quarter 2015
COPYRIGHT © JONES LANG LASALLE IP, INC. 2015. All Rights Reserved 17
Office Markets
Office Demand Dynamics
Highest leasing volumes for more than three years
After a slow first quarter, office leasing market fundamentals made a significant rebound during the second quarter.
Global leasing volumes improved by 24% on Q1 and were up 8% year-on-year. At 10.4 million square metres in Q2,
global corporate occupier activity (for the markets tracked by JLL) was at its highest level since Q4 2011. The strongest
gains were recorded in Asia Pacific, up 41% year-on-year, while the U.S. and Europe also registered healthy growth.
Modest uplift in volumes for full-year 2015
Despite the recent improvement, JLL still expects gross leasing volumes to be only moderately higher for the full-year
2015 (+0%-5%) compared to 2014 levels. The biggest uplift is forecast for Asia Pacific (+15%-20%), while volumes in
the U.S. and Europe are anticipated to remain in line with 2014 levels. The focus will be on CBD space, notably markets
that have amenity, density and a diverse mix of office inventory to create dynamic environments, albeit that supply
shortages in these locations will constrain leasing activity.
A shift towards expansion demand
Expansion demand is now firmly on the agenda of many corporate occupiers, with projections of a 15%-20% increase in
global net absorption for the full-year 2015. Occupancy growth in the U.S. is expected to be sustained at its current
robust level, and also has the potential to accelerate in Europe and Asia Pacific.
Technology still dominates demand
While there is now a much broader diversity of demand in terms of industry sectors, technology continues to have a
significant impact on leasing markets across the globe as it expands into new business areas, such as financial,
healthcare and personal services. As the sector becomes more ubiquitous within business in general, a greater variety
of office markets, beyond the more established global technology hubs, are benefiting from technology’s expansion.
A more robust U.S. economy boosts office demand
Leasing activity during the second quarter in the U.S. reached its highest level in two years, following a disappointing
first quarter:
Leasing activity was led by Boston, Chicago, Los Angeles and Washington DC, where demand has
intensified as scientific and technical industries have expanded out beyond the supply-constrained Northern
California (San Francisco, Silicon Valley), Pacific Northwest (Seattle, Portland) and New York.
Absorption gains were more evenly spread across markets, with Washington DC and New York making a
significant comeback. Dallas topped the U.S. rankings in terms of net absorption, reflecting its rapid ascent as
a powerhouse economy. Silicon Valley, Atlanta, Boston and Raleigh-Durham also performed well.
Many suburban markets continued to struggle with weak demand as they compete for tenants who are looking
for amenity-rich locations and also using such locations as a recruitment and retention tool.
Growth slowed substantially in energy-dependent Houston as occupiers consolidate their space
requirements.
Pre-leasing was strong with companies like Apple, Box, Google and Salesforce leasing full buildings in the
San Francisco Bay Area and Austin.
COPYRIGHT © JONES LANG LASALLE IP, INC. 2015. All Rights Reserved 18
Global Market Perspective, Third Quarter 2015
In Canada, positive absorption was registered in Vancouver and Toronto, while Calgary is feeling the
negative effects of depressed oil prices.
Looking southwards, demand was among the most resilient in Mexico City, where the market is successfully
absorbing significant new supply.
Europe records strongest Q2 take-up volumes since 2008
European office leasing activity totalled just over 2.9 million square metres in Q2, up 25% quarter-on-quarter and the
strongest second quarter since 2008. While most markets recorded positive growth, Europe continues to be a multi-
speed environment with cities also moving in different directions:
Corporate occupier activity in London shows no signs of weakening with take-up increasing by 41% year-on-
year in Q2, representing the strongest quarter in almost 10 years.
In Spain, Barcelona experienced a strong quarter, with leasing volumes up by 87% year-on-year. In Madrid,
transaction volumes are being increasingly held back by the lack of good-quality supply in central locations.
German offices have gone from strength to strength. The five largest office markets recorded a year-on-year
increase in take-up of 12% in the second quarter. Berlin and Hamburg put in particularly robust performances
as the willingness of occupiers to expand has increased substantially in recent quarters, as signified by a jump
in occupied stock and increases in take-up of 22% and 15% in the respective cities in H1 2015 versus H1 2014.
Central and Eastern Europe (CEE) also performed strongly in Q2. Prague saw a year-on-year increase in
take-up of around 55%, while Budapest and Warsaw recorded their best quarters in over 15 years.
By contrast, two of the largest office markets in Europe - Paris and Moscow - underperformed in H1 2015
compared with their long-term averages. Excluding Paris and Moscow, overall take-up for Europe was up 15%
on the Q2 2014 numbers.
Strong improvement in Asia Pacific leasing activity
Office leasing activity in Asia Pacific surged in Q2, with gross and net leasing up by 41% and 76% year-on-year
respectively. India and Greater China were the outperformers, with India contributing 40% of total regional gross
absorption and its volumes nearly double their Q2 2014 level:
The strongest activity was recorded in Delhi and Bangalore on the back of large deals signed by finance,
professional services and IT firms.
Shanghai saw a rising number of enquiries from domestic financial services companies as well as MNCs.
A few large occupiers and Chinese mainland companies drove take-up in Hong Kong.
Singapore saw weak activity, with many tenants holding off in expectation of lower rents due to the large
volume of impending supply.
Tokyo continued to see business consolidation to new high-quality buildings and persisting demand from the IT
sector.
Leasing activity maintained its recovery in Australia, particularly in Sydney where the CBD recorded its most
robust quarter of net absorption since Q4 2005.
JLL is optimistic that office leasing volumes in Asia Pacific will continue to improve in 2015, and has upgraded its
forecast of growth of 15%-20% for the full-year 2015. Domestic financial firms and technology should remain active
demand drivers.

Global Market Perspective, Third Quarter 2015
COPYRIGHT © JONES LANG LASALLE IP, INC. 2015. All Rights Reserved 19
Global Office Demand – Net Absorption Trends, 2004-2015
24 markets in Europe; 25 markets in Asia Pacific; 44 markets in the U.S. Asia relates to Grade A only. Source: JLL, July 2015
Global Office Completions, 2000-2017
24 markets in Europe; 25 markets in Asia Pacific; 44 markets in the U.S. Asia relates to Grade A only. Source: JLL, July 2015
-5
0
5
10
15
20
2004 2005 2006 2007 2008 2009 2010 2011 2012 2013 2014 2015
mill
ions
sq
m
Pro
ject
ion
0
5
10
15
20
2000 2001 2002 2003 2004 2005 2006 2007 2008 2009 2010 2011 2012 2013 2014 2015(F)
2016(F)
2017(F)
U.S. Europe Asia Pacific
mill
ions
sq
m
Average
COPYRIGHT © JONES LANG LASALLE IP, INC. 2015. All Rights Reserved 20
Global Market Perspective, Third Quarter 2015
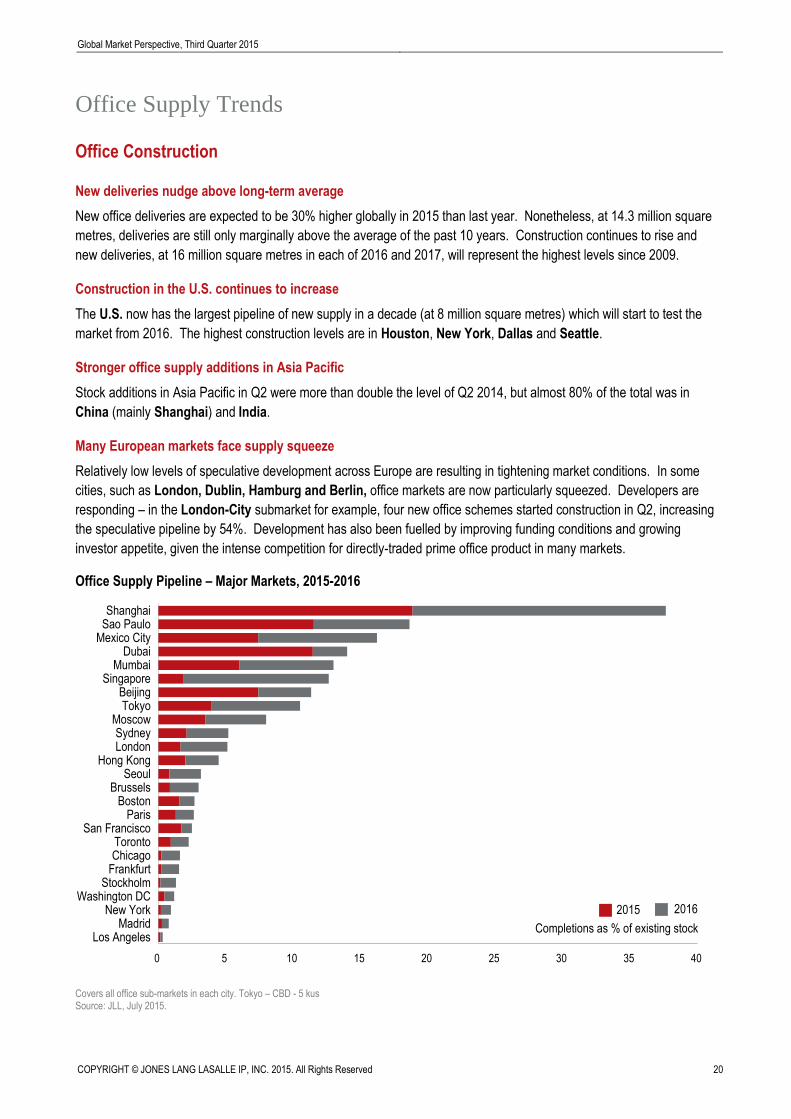
Office Supply Trends
Office Construction
New deliveries nudge above long-term average
New office deliveries are expected to be 30% higher globally in 2015 than last year. Nonetheless, at 14.3 million square
metres, deliveries are still only marginally above the average of the past 10 years. Construction continues to rise and
new deliveries, at 16 million square metres in each of 2016 and 2017, will represent the highest levels since 2009.
Construction in the U.S. continues to increase
The U.S. now has the largest pipeline of new supply in a decade (at 8 million square metres) which will start to test the
market from 2016. The highest construction levels are in Houston, New York, Dallas and Seattle.
Stronger office supply additions in Asia Pacific
Stock additions in Asia Pacific in Q2 were more than double the level of Q2 2014, but almost 80% of the total was in
China (mainly Shanghai) and India.
Many European markets face supply squeeze
Relatively low levels of speculative development across Europe are resulting in tightening market conditions. In some
cities, such as London, Dublin, Hamburg and Berlin, office markets are now particularly squeezed. Developers are
responding – in the London-City submarket for example, four new office schemes started construction in Q2, increasing
the speculative pipeline by 54%. Development has also been fuelled by improving funding conditions and growing
investor appetite, given the intense competition for directly-traded prime office product in many markets.
Office Supply Pipeline – Major Markets, 2015-2016
Covers all office sub-markets in each city. Tokyo – CBD - 5 kus Source: JLL, July 2015.
0 5 10 15 20 25 30 35 40
Los AngelesMadrid
New YorkWashington DC
StockholmFrankfurtChicagoToronto
San FranciscoParis
BostonBrussels
SeoulHong Kong
LondonSydney
MoscowTokyo
BeijingSingapore
MumbaiDubai
Mexico CitySao PauloShanghai
Completions as % of existing stock
2015 2016

Global Market Perspective, Third Quarter 2015
COPYRIGHT © JONES LANG LASALLE IP, INC. 2015. All Rights Reserved 21
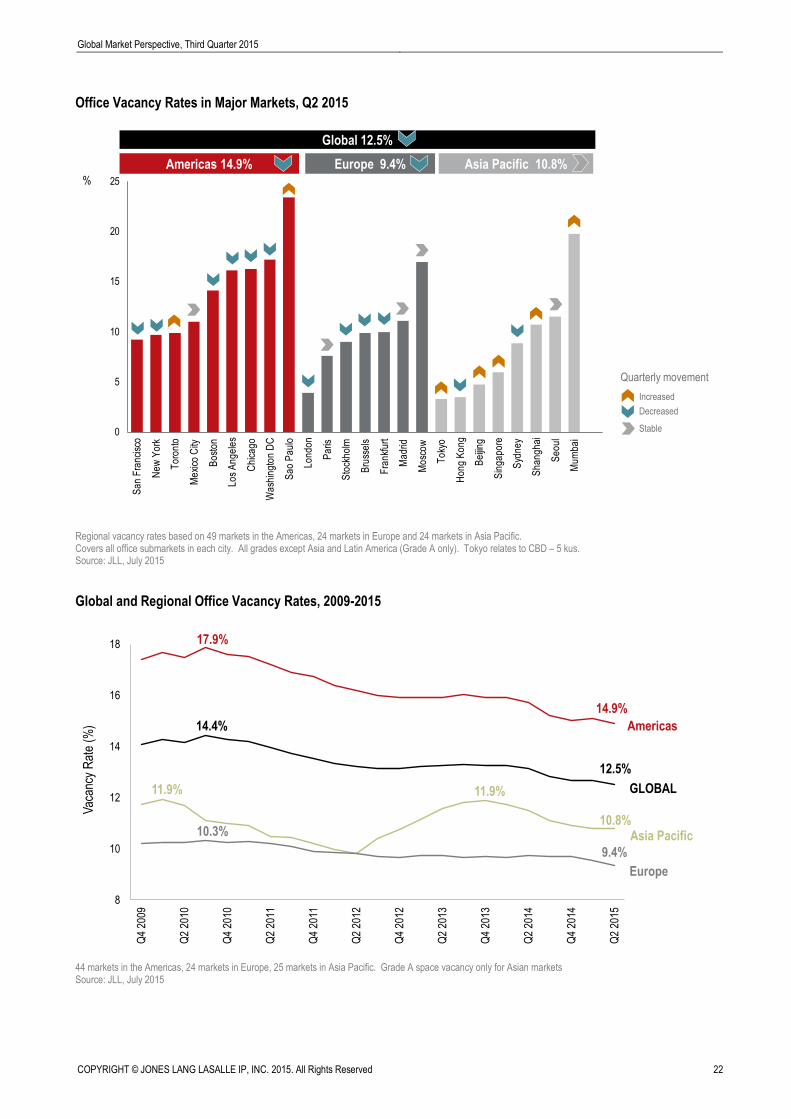
Office Vacancy
Vacancy rates fall steadily
The global office vacancy rate (across 98 markets) fell to 12.5% in Q2 and is projected to decline further, driven primarily
by a drop in U.S. vacancy rates. A shortage of space in many CBD markets is forcing higher occupier mobility, with
some companies now targeting a much wider range of submarkets to satisfy space requirements.
U.S. vacancy below 15% by year-end
U.S vacancy decreased to 15.3% in Q2, and rates are projected to fall below 15% by year-end. Stronger leasing activity
has led to vacancy declines across most U.S. cities. Single-digit direct vacancy is a feature of Salt Lake City, Portland,
San Francisco and New York, where low vacancy rates are forcing tenants to explore new markets.
Development surge in Canada pushes up vacancy
Despite positive absorption in the second quarter, Canada’s total office vacancy rate increased 30 bps during the
quarter to 10.3%. This was a result of new construction added to the inventory.
Large office development pipeline in Latin America
Upcoming new supply is still posing challenges for landlords across several office markets in Latin America, but is
introducing new space options for tenants at the same time. In Brazil, the market continues to become yet more tenant-
favourable. The total vacancy rate in Sao Paulo increased again in the second quarter, to 23.4%, up nearly 300 bps
from the level a year ago.
Europe’s vacancy falls again
The overall office vacancy rate in Europe has fallen for the second consecutive quarter (to 9.4% from 9.5% in Q1). In
many markets, the strengthening of occupier demand and a lack of speculative completions has resulted in a sharp drop
in supply. In Dublin, this effect has been most extreme with the vacancy rate plummeting from 16.6% to 8.6% over the
last 12 months. Meanwhile, in London, the vacancy rate has decreased to 3.9%. Strong occupier demand in Germany
has pushed vacancy rates to their lowest levels in over five years across the five largest markets.
New supply in Dubai
Much of the currently vacant office space in Dubai is in secondary-quality buildings, many of which are in strata-title
ownership and of little interest to major corporate occupiers. The lack of high-quality space will result in the delivery of a
number of new office projects during 2015.
Asia Pacific regional vacancy rate stable
Healthy demand led to lower vacancy in most Asian cities in the second quarter and the regional vacancy rate held
steady at 10.8%. However, vacancy rose in Beijing, Tokyo, Jakarta, Manila and Kuala Lumpur on the back of new
completions. The vacancy rate in Sydney’s CBD continued to fall, tightening to 7.5% from last quarter’s 9.9%.
COPYRIGHT © JONES LANG LASALLE IP, INC. 2015. All Rights Reserved 22
Global Market Perspective, Third Quarter 2015
Office Vacancy Rates in Major Markets, Q2 2015
Regional vacancy rates based on 49 markets in the Americas, 24 markets in Europe and 24 markets in Asia Pacific. Covers all office submarkets in each city. All grades except Asia and Latin America (Grade A only). Tokyo relates to CBD – 5 kus. Source: JLL, July 2015
Global and Regional Office Vacancy Rates, 2009-2015
44 markets in the Americas, 24 markets in Europe, 25 markets in Asia Pacific. Grade A space vacancy only for Asian markets Source: JLL, July 2015
0
5
10
15
20
25
Sa
n F
ran
cisc
o
Ne
w Y
ork
To
ron
to
Me
xico
City
Bo
sto
n
Lo
s A
ng
ele
s
Ch
ica
go
Wa
shin
gto
n D
C
Sa
o P
au
lo
Lo
nd
on
Pa
ris
Sto
ckh
olm
Bru
sse
ls
Fra
nkf
urt
Ma
drid
Mo
sco
w
To
kyo
Ho
ng
Ko
ng
Be
ijin
g
Sin
ga
po
re
Syd
ne
y
Sh
an
gh
ai
Se
ou
l
Mu
mb
ai
Europe 9.4% Asia Pacific 10.8%Americas 14.9%%
Quarterly movement
Increased
Decreased
Stable
Global 12.5%
8
10
12
14
16
18
Q4
2009
Q2
2010
Q4
2010
Q2
2011
Q4
2011
Q2
2012
Q4
2012
Q2
2013
Q4
2013
Q2
2014
Q4
2014
Q2
2015
Vac
ancy
Rat
e (%
) Americas
Asia Pacific
Europe
GLOBAL
17.9%
14.9%
14.4%
12.5%
11.9%
10.8%
11.9%
10.3%
9.4%
Global Market Perspective, Third Quarter 2015
COPYRIGHT © JONES LANG LASALLE IP, INC. 2015. All Rights Reserved 23
Office Rental Trends
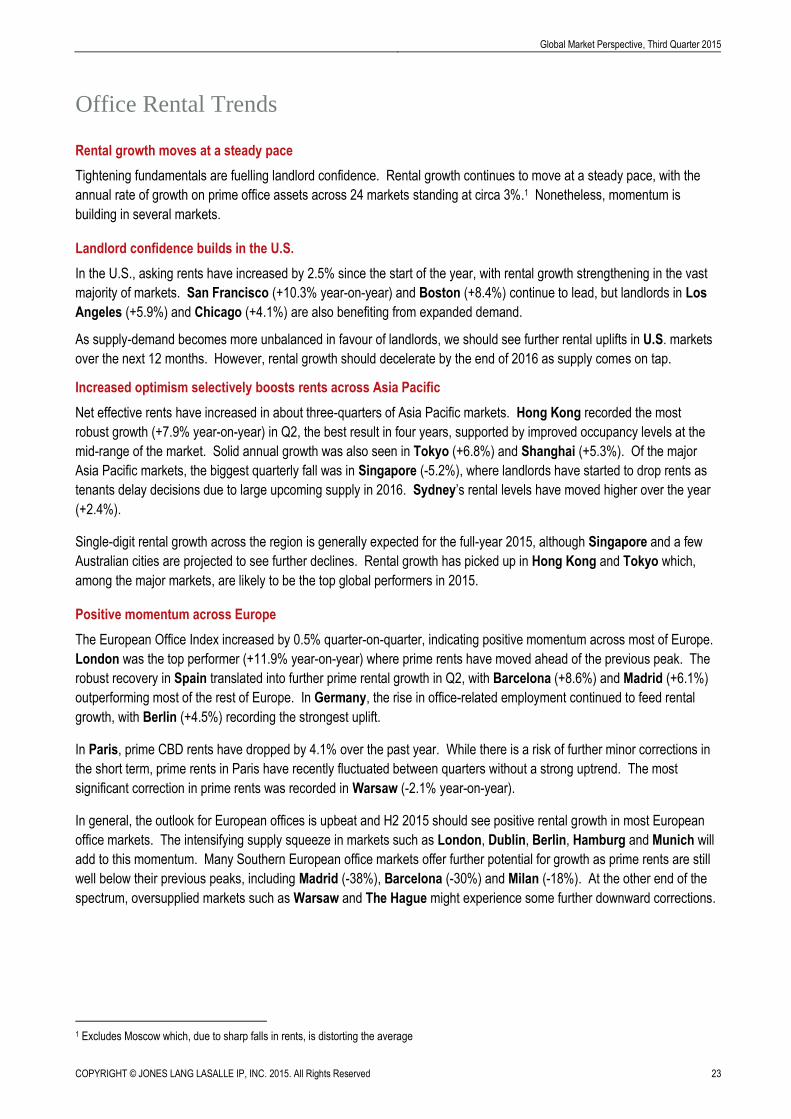
Rental growth moves at a steady pace
Tightening fundamentals are fuelling landlord confidence. Rental growth continues to move at a steady pace, with the
annual rate of growth on prime office assets across 24 markets standing at circa 3%.1 Nonetheless, momentum is
building in several markets.
Landlord confidence builds in the U.S.
In the U.S., asking rents have increased by 2.5% since the start of the year, with rental growth strengthening in the vast
majority of markets. San Francisco (+10.3% year-on-year) and Boston (+8.4%) continue to lead, but landlords in Los
Angeles (+5.9%) and Chicago (+4.1%) are also benefiting from expanded demand.
As supply-demand becomes more unbalanced in favour of landlords, we should see further rental uplifts in U.S. markets
over the next 12 months. However, rental growth should decelerate by the end of 2016 as supply comes on tap.
Increased optimism selectively boosts rents across Asia Pacific
Net effective rents have increased in about three-quarters of Asia Pacific markets. Hong Kong recorded the most
robust growth (+7.9% year-on-year) in Q2, the best result in four years, supported by improved occupancy levels at the
mid-range of the market. Solid annual growth was also seen in Tokyo (+6.8%) and Shanghai (+5.3%). Of the major
Asia Pacific markets, the biggest quarterly fall was in Singapore (-5.2%), where landlords have started to drop rents as
tenants delay decisions due to large upcoming supply in 2016. Sydney’s rental levels have moved higher over the year
(+2.4%).
Single-digit rental growth across the region is generally expected for the full-year 2015, although Singapore and a few
Australian cities are projected to see further declines. Rental growth has picked up in Hong Kong and Tokyo which,
among the major markets, are likely to be the top global performers in 2015.
Positive momentum across Europe
The European Office Index increased by 0.5% quarter-on-quarter, indicating positive momentum across most of Europe.
London was the top performer (+11.9% year-on-year) where prime rents have moved ahead of the previous peak. The
robust recovery in Spain translated into further prime rental growth in Q2, with Barcelona (+8.6%) and Madrid (+6.1%)
outperforming most of the rest of Europe. In Germany, the rise in office-related employment continued to feed rental
growth, with Berlin (+4.5%) recording the strongest uplift.
In Paris, prime CBD rents have dropped by 4.1% over the past year. While there is a risk of further minor corrections in
the short term, prime rents in Paris have recently fluctuated between quarters without a strong uptrend. The most
significant correction in prime rents was recorded in Warsaw (-2.1% year-on-year).
In general, the outlook for European offices is upbeat and H2 2015 should see positive rental growth in most European
office markets. The intensifying supply squeeze in markets such as London, Dublin, Berlin, Hamburg and Munich will
add to this momentum. Many Southern European office markets offer further potential for growth as prime rents are still
well below their previous peaks, including Madrid (-38%), Barcelona (-30%) and Milan (-18%). At the other end of the
spectrum, oversupplied markets such as Warsaw and The Hague might experience some further downward corrections.
1 Excludes Moscow which, due to sharp falls in rents, is distorting the average
COPYRIGHT © JONES LANG LASALLE IP, INC. 2015. All Rights Reserved 24
Global Market Perspective, Third Quarter 2015
Prime Offices – Rental Change, Q2 2014-Q2 2015
Based on rents for Grade A space in CBD or equivalent. In local currency. Source: JLL, July 2015
Prime Offices – Rental Change, 2010-2015
Prime office rental growth: unweighted average of 25 major markets. * 2015 forecast excludes Moscow Source: JLL, July 2015
-25 -20 -15 -10 -5 0 5 10 15
Moscow
Sao Paulo
Mumbai
Paris
Brussels
Seoul
Stockholm
Singapore
Frankfurt
Washington DC
Mexico City
Dubai
Sydney
New York
Toronto
Beijing
Chicago
Shanghai
Los Angeles
Madrid
Tokyo
Hong Kong
Boston
San Francisco
London
0
1
2
3
4
5
6
7
8
9
10
2010 2011 2012 2013 2014 2015
8.9%
7.9%
1.9%1.2%
Ren
tal c
hang
e (y
-o-y
%)
4%*
3.6%
Global Market Perspective, Third Quarter 2015
COPYRIGHT © JONES LANG LASALLE IP, INC. 2015. All Rights Reserved 25
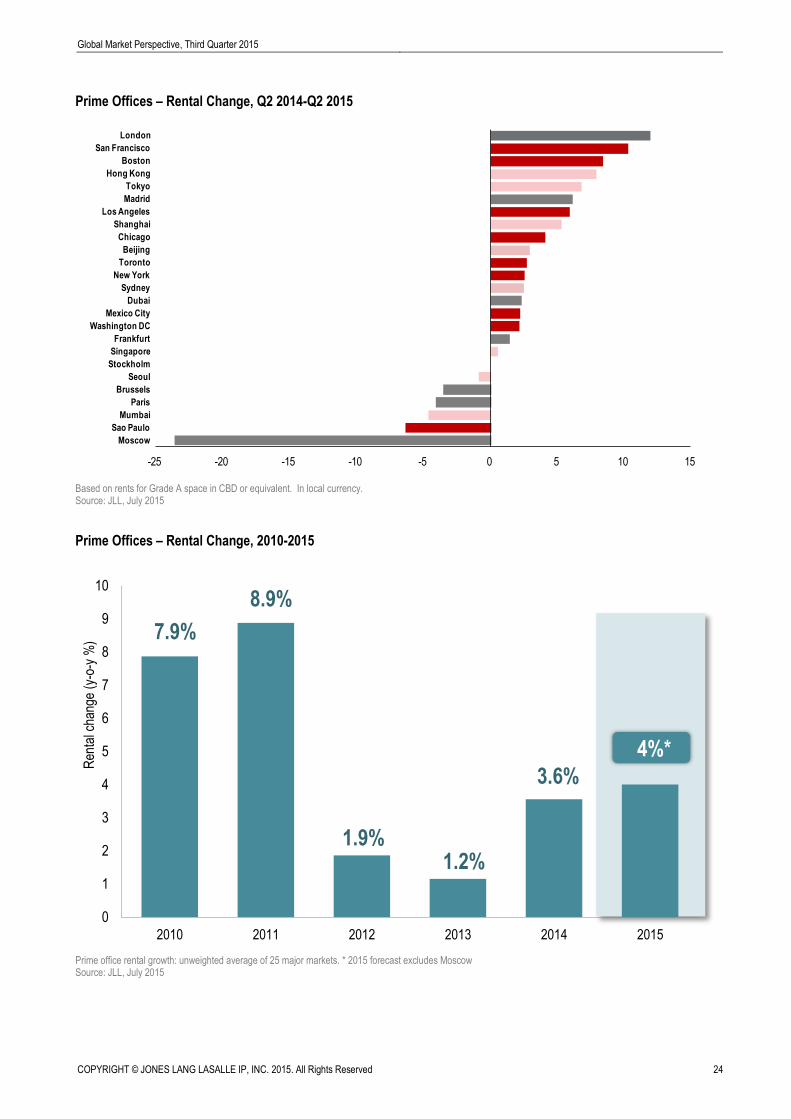
Prime Offices – Projected Changes in Values, 2015
*New York – Midtown, London – West End, Paris - CBD. Nominal rates in local currency. Source: JLL, July 2015
Prime Offices – Rental Clock, Q2 2015
Based on rents for Grade-A space in CBD or equivalent. U.S. positions relate to the overall market Source: JLL, July 2015
+ 10-20%
+ 5-10%
+ 0-5%
- 0-5%
- 5-10%
Sydney, London*, Shanghai Boston, Chicago, Los Angeles New York*, San FranciscoMadrid, Beijing
Hong Kong, Tokyo
Capital ValuesRental Values
Toronto, Dubai, Washington DCMexico City, Stockholm, Seoul Brussels, Frankfurt
Paris*, Sao Paulo, Mumbai
London*, Sydney, BostonChicago, Los Angeles, New York*San Francisco, Frankfurt, Shanghai
Toronto, Washington DCParis*, Beijing
Seoul, Hong Kong Dubai, Mexico CityBrussels, Stockholm
Mumbai, Singapore
Sao Paulo
- 10-20% Singapore, Moscow
Moscow
+ 20-30% Tokyo, Madrid
- 20-30%
Rental Values
Bottoming Out
Rental Growth
Slowing
Rental Values
Falling
Rental Growth
Accelerating
Americas
Asia Pacific
EMEA
New York
Moscow
Johannesburg, Dallas, San Francisco
Hong Kong
MilanParis, Brussels, Istanbul, Prague Mumbai, Washington DC
Sao Paulo
Delhi
Sydney, Chicago
Boston
London, Los AngelesTokyo, Beijing
WarsawAmsterdam
Madrid
Frankfurt
Mexico City
Toronto
Berlin
Singapore Houston
Shanghai
Stockholm
Zurich
Dubai, Seoul

COPYRIGHT © JONES LANG LASALLE IP, INC. 2015. All Rights Reserved 26
Global Market Perspective, Third Quarter 2015
Retail Markets
Slow pace of improvement continues in the United States
The U.S. retail market’s pace of improvement is much more gradual than in the country’s other property sectors – but it
continues to strengthen nonetheless. Retailer demand has comfortably exceeded supply for the past four quarters,
resulting not only in consistent vacancy compression to 5.9% in Q2, but also rising rents across most major markets.
Rents rose 0.5% from the first quarter, and grew 1.2% year-on-year in the quarter. Among U.S. shopping centre types,
power centres are still experiencing the tightest overall market conditions, with total vacancy of 4.7%. Several standout
markets, such as Miami, New York, Houston, Dallas, Fort Lauderdale, Boston and San Francisco, are maintaining
the healthiest growth conditions, as rents see assertive growth and vacancy continues to compress.
Increased consumer confidence as optimism boosts retail sales across Europe
Improved consumer confidence across Europe during the second quarter has fuelled optimism in the retail sector.
Reduced fuel and energy prices, decreasing unemployment and lower interest rates are boosting disposable incomes.
European retail sales are forecast to grow by 2.9% in 2015 and 2.0% in 2016. Up to 2017, this growth is expected to
remain especially robust in the UK, Turkey and Norway, as well as the CEE region.
Northern European cities record robust rental uplift
The strongest increases in high street rents in the second quarter were recorded in Birmingham (+8.8% quarter-on-
quarter), Brussels (+8.1%), Antwerp (+8.1%), Frankfurt (+3.3%) and Stockholm (+2.1%), although rents softened in
the main Dutch cities – Rotterdam (-2.8%) and Amsterdam (-1.7%). For the full-year 2015, London and Birmingham
as well as Dublin and the German cities of Frankfurt, Hamburg and Munich are anticipated to outperform.
Varied retailer demand picture in Asia Pacific
China witnessed steady demand for retail space in the second quarter, underpinned by mid-tier fashion brands and
F&B, whereas luxury brands remained cautious. At the same time, weaker retail trading conditions in Hong Kong have
seen retailers adopt a more wary stance. Several new brands entered Singapore in Q2, while some landlords have
readjusted their tenant mix amidst a challenging operating environment. Some foreigner retailers are exploring
decentralised locations and/or second-tier cities in emerging Southeast Asia for new store openings. Retail growth in
Australia continues to be driven by the F&B sector.
New-to-market foreign retailers and Chinese tourists support growth
Rents rose in around half of all Asian markets in the second quarter, with the biggest gains in Bangkok and Jakarta
(around 2% quarter-on-quarter). In contrast, falls in rents were seen in the Hong Kong ‘high street’ and Singapore
markets. For the next 12 months, new-to-market foreign retailers and the growth of inbound tourism (particularly
Chinese) should continue to support many markets around the region.
Global Market Perspective, Third Quarter 2015
COPYRIGHT © JONES LANG LASALLE IP, INC. 2015. All Rights Reserved 27
Prime Retail – Rental Clock, Q2 2015
Prime Industrial – Rental Clock, Q2 2015
Relates to prime space. U.S. positions relate to the overall market Source: JLL, July 2015
Rental Growth
Slowing
Rental Values
Falling
Rental Growth
Accelerating
Rental Values
Bottoming Out
Americas EMEA Asia Pacific
Delhi
Madrid, Milan
Mumbai, Washington DC
Singapore, Hong Kong
Los Angeles
Paris, Dubai
Beijing
Berlin
Sydney
Tokyo, San Francisco , Houston
Miami, New York, Boston
Moscow
Shanghai, London
Chicago
Rental Growth
SlowingRental Values
Falling
Rental Values
Bottoming Out
Warsaw
Americas EMEA Asia Pacific
Rental Growth
Accelerating
Amsterdam, Paris
Boston
Frankfurt
London, Tokyo, Chicago
Los Angeles
Singapore
Dallas
Shanghai
Hong Kong
New York, Atlanta, San Francisco
Sydney
Madrid, Beijing
Houston, Philadelphia
Moscow
COPYRIGHT © JONES LANG LASALLE IP, INC. 2015. All Rights Reserved 28
Global Market Perspective, Third Quarter 2015
Industrial Warehousing Markets
Absorption trumps completions in most major U.S. markets
Approximately 40% of the industrial stock in the U.S. is currently concentrated in seven major logistics corridors – Los
Angeles, the Inland Empire, Dallas/Fort Worth, Chicago, Philadelphia/Harrisburg, New Jersey and Atlanta – and
fundamentals have been strong in these trend-driving, population-centric markets. Their respective construction
deliveries have lagged their absorption totals, which, in turn, have caused vacancies to tighten and rents to increase.
Consequently, landlords have gained more leverage to push up rents.
U.S. vacancy at 10-year low
Based on active tenant requirements, nearly all U.S. markets have scenarios where their construction pipelines will be
unable to keep up with space needs during 2015. This suggests that national net absorption will continue to outpace
completions (as it did from 2010-2014) for its sixth consecutive year. Market conditions remain bullish, with national
vacancy finishing the quarter at 6.7% – a 10-year low. Average asking rents for warehouse space in Q2 were up 5%
year-on-year.
While absorption has exceeded completions in most U.S. cities, the spotlight fell on two major markets in Q2 –
Dallas/Fort Worth and Chicago – where vacancy rates have risen to 6.3% and 7.6% respectively on the back of
increasing speculative completions.
Industrial vacancy rates remain low over the rest of North America
In Canada, despite strong positive absorption in Q2, vacancy remained unchanged at 4.2%, mainly as a result of
speculative construction being added to the total inventory. Latest data for Mexico’s industrial market point to positive
trends – the national vacancy declined to 5.6% in the quarter, led by a particularly robust showing by the North Region.
European demand maintains momentum, but increasingly selective
The European logistics occupational market remains sturdy. Continued innovation in order-fulfilment and delivery is
driving further adaptation of logistics networks. Implementation of new strategies will support modest growth in annual
take-up this year. In addition, occupational demand has been further boosted by a strengthening manufacturing sector
across CEE (excluding Russia) and a recovery that is gaining momentum in Southern Europe. As a result, 2015 is likely
to see a new record in European take-up. Nonetheless, occupier demand is becoming increasingly selective, with a
rising focus on multimodal locations, automated facilities and facilities supporting efficient urban logistics.
Build-to-suit dominates in Europe
Speculative development in Europe remains thin overall, although speculative development starts in the UK have risen
markedly in recent months. This trend is expected to extend into the major Western European markets and, more
selectively, Central Europe. However, speculative development will continue to be limited overall and nowhere near pre-
GFC levels, supporting ongoing low vacancy over the medium term.
There is heavy pressure on the occupier side to maintain/reduce supply chain costs; a pressure that, in combination with
relative easy access to finance and low interest rates, is pushing more occupiers into owner-occupier development, if it
offers a cost premium on rental levels.
Third-party logistics companies and retailers support warehouse rents in Asia
Healthy leasing levels of logistics space in Asia were driven by third-party logistics companies and retailers in the second
quarter. Rents were stable or higher in most monitored markets apart from Singapore, where rising supply pressures
nudged rents down. Tokyo achieved the highest rental uplift (2.8% quarter-on-quarter), driven by strong tenant demand
and increasing construction costs.

Global Market Perspective, Third Quarter 2015
COPYRIGHT © JONES LANG LASALLE IP, INC. 2015. All Rights Reserved 29
Hotel Markets
Global hotel investment going from strength to strength
Continuing the robust growth from Q1 2015, global hotel transaction volumes have gone from strength to strength,
reaching a new high of US$42 billion in H1 2015, up 55% from the same period last year. Of the three regions, the
Americas takes top position with volumes at US$24 billion. It has also achieved the highest year-on-year growth at 73%,
followed by EMEA, up 55%. Conversely, Asia Pacific has seen a slight decline in investment volumes, down 6% to
US$4 billion.
Hotel Investment Volumes, 2014-2015
US$ billions
H1 2014 H1 2015 % change
Americas 13.7 23.6 73%
Asia Pacific 3.9 3.7 -6%
EMEA 9.4 14.6 55%
Total 27.0 42.0 55%
Source: JLL, July 2015
Cross-border investors remain active. EMEA is still a magnet for foreign investment, attracting the largest amount of
capital of all the regions, worth US$9 billion. Meanwhile, North America and Asia Pacific received US$4 billion and
US$2 billion respectively. Investors from the Middle East and mainland China have been the major exporters of capital.
Hotel Transactions: Capital Flows, H1 2015
Source: JLL, July 2015
($1.3)
($3.5)
($3.8)
($6.0)
$0.3
$8.7
$1.3
$4.2
Australasia
Europe
Asia
North America
Mainland China
Middle East
Outflows Inflows US$ billions
COPYRIGHT © JONES LANG LASALLE IP, INC. 2015. All Rights Reserved 30
Global Market Perspective, Third Quarter 2015
Chinese investors highly active
Mainland Chinese investors continue to play a major role in global hotel transactions. Their volumes rose from US$1
billion in 2014 to US$4 billion in the first half of 2015, equating to 80% of our 2015 forecast, and they are showing strong
interest in luxury properties in both North America and Europe. Australia is also seeing inflows from Chinese investors,
with the Hilton Sydney changing hands at the beginning of July.
China’s insurance companies have been the most dominant buyer, snapping up a total of US$2 billion of properties in
H1 2015 and accounting for 58% of all hotel transactions completed by Chinese investors. Investment volumes are
expected to grow, due to the Chinese government relaxing the investment threshold towards foreign investment. In
addition, only two out of the ten largest Chinese insurance companies have currently invested in hotels globally,
representing big opportunities ahead.
The Americas – private equity in the spotlight
For the first half of 2015, the Americas region witnessed a 73% year-on-year increase in deal volumes to US$24 billion
with 96% of transactions occurring in the United States. New York and San Francisco were the top two cities in terms
of volumes, at US$4 billion and US$1 billion respectively.
On the buy side, investment funds and private equity firms were the most dominant players in H1 2015, accounting for
42% of transaction volumes. Their primary focus was portfolio deals, which made up 65% of purchases.
Investment funds and private equity firms demonstrated an equally strong appetite in the seller market, representing
60% of total activity in the first half of the year, a big jump from the 44% share in the same period last year. This is their
strategy to make profit by recycling capital.
Investors from mainland China and the Middle East were the most prominent foreign investors into the U.S. market with
investment volumes in H1 2015 totalling US$4 billion, a staggering 308% uplift from H1 2014.
EMEA – UK steals the show
EMEA transaction volumes rose 55% or US$5 billion to US$15 billion in H1 2015, with the UK securing 54% of total deal
volumes, up 200% year-on-year. While London remains attractive, there were a high number of deals in UK regional
cities such as Edinburgh, Liverpool and Manchester. Trading performance (RevPAR) for hotels in the UK’s regions
has been stronger than London, making properties more desirable for potential investors.
Germany posted the second highest growth in hotel transactions in EMEA, up 29% to US$2 billion in H1 2015
compared to H1 2014, followed by Spain, increasing by 17% to US$1 billion.
Portfolio sales in the first half of 2015 accounted for 65% of total deals in the region, a significant increase from the 39%
in H1 2014. The largest portfolio deal in Q2 2015 was the sale of the Maybourne portfolio in London to a Middle Eastern
investor for c. US$2 billion. In addition, Accor disposed a number of properties in the UK and Germany as part of the
company’s asset-recycling strategy.
Investment funds and private equity firms were the most active buyers in H1, representing 30% of transactions, followed
by hotel operators (22%) and REITs (8%).
Global Market Perspective, Third Quarter 2015
COPYRIGHT © JONES LANG LASALLE IP, INC. 2015. All Rights Reserved 31
Asia Pacific – focus on single-asset deals
Investment volumes in Asia Pacific totalled US$4 billion in H1, a slight decline of 6% or US$0.2 billion from the same
period last year. Single-asset transactions dominated the Asia Pacific market, accounting for 82% (US$3 billion) of total
deal volumes.
Sovereign wealth funds were the most active buyers in Q2, thanks to the 50% sale to ADIA of three hotels in Hong
Kong (Renaissance Harbour View, Hyatt Regency Tsim Sha Tsui and Grand Hyatt) worth circa US$1 billion. These
transactions pushed Hong Kong to the top seat in terms of both transaction volumes and growth among Asian cities.
Japan came second in terms of deal volumes in H1 at US$1 billion, a drop of 4% compared to H1 2014. All transactions
continue to be acquired by domestic investors, with J-REITs dominating the buyer market, securing 38% of all sales.
The largest transaction in Q2 was the sale of the 5B portfolio which included five properties sold for US$170 million.
Outlook – on track to hit forecast
Six months into 2015, global hotel transactions total US$42 billion, equating to over 60% of JLL’s forecast volume of
US$68 billion for the full year. The future looks positive but there are some underlying apprehensions which add
uncertainty to the global hotel investment landscape.
In EMEA, the Greek debt crisis and its impact on the Eurozone are the key issues for the second half of 2015. While
short-term volatility may affect the financial market, it is highly likely that the ECB will impose measures to ensure
liquidity and low financing costs, and this will be beneficial to the investment market. Moreover, countries such as the
UK, Germany and France, with their solid economic fundamentals, are expected to be viewed as ‘safe havens’ by
potential investors.
The outlook remains upbeat for Asia Pacific, with Japan and Australia being the most active markets. The Maldives is
also attracting strong interest from Chinese investors and developers to undertake resort projects targeted purely at the
mainland Chinese market. With Chinese tourists accounting for almost a third of total tourism arrivals in Maldives, JLL
expects the strong appetite of Chinese investors here to continue.
The recent decline in China’s stock market may also represent greater domestic buying opportunities, pushing hotel
assets to the market for sale.
For the Americas, investors are attracted to the strength of the U.S. economy and stability of the dollar. Major cities such
as New York, San Francisco, Los Angeles, Chicago and Miami are all experiencing positive demand growth. All the
aforementioned factors translate to a buoyant market for the second half of 2015.
COPYRIGHT © JONES LANG LASALLE IP, INC. 2015. All Rights Reserved 32
Global Market Perspective, Third Quarter 2015
Residential Markets
Demographic trends and employment growth fuel demand for U.S. rental apartments
In spite of the recent report of the highest share of first-time buyers making home purchases since September 2012, the
U.S. homeownership rate has declined to 63.7%. This decrease continues a long-term structural movement away from
homeownership. And, partially as a result of this, national rental apartment unit demand continues to outpace deliveries,
maintaining a trend dating back to 2011.
The speed of development has accelerated in 2015 and is projected to carry on at a brisk pace. While vacancy rates
have inched up in certain markets, such as Boston and Houston, these gains haven’t dented the national rental
vacancy rate of 4.2%. Eight U.S. cities currently have more than 10,000 units under construction, a mix of both primary
markets such as Houston and New York as well as secondary markets like Austin and Denver. Even as numerous
markets are preparing to receive several thousand units delivered throughout 2015 and into 2016, strong demand
persists from renters. No markets have yet seen systemic overbuilding, as only seven major markets nationally have
seen five or more consecutive quarters of deliveries exceeding absorption, such as Washington DC and Raleigh-
Durham.
Growing appetite for institutional-grade product in the UK
The first few months of 2015 saw a degree of uncertainty in the UK residential market caused by the lack of a front
runner in the UK election. The decisive vote for a more pro-business Conservative government provided some renewed
optimism for the market.
In the year to May 2015, house prices increased by 4.6% across England and Wales and by 9.1% across Greater
London. This is down from 7% and 17% respectively for the full-year 2014. Expectations are for a continuing
moderation of price growth, averaging between 3% and 5% annually.
The IPD UK Annual Residential Property Index shows the private rented sector enjoyed 13.5% total returns in 2014,
which is up on the three-year average of 12.6%, as well as the ten-year average of 9.4%. There continues to be a
growing appetite for institutional-grade product in the UK residential market.
Investment in Germany at record levels
Greater interest from domestic and international investors in H1 2015 has boosted residential investment volumes in
Germany to a record high of €17.5 billion which compares with €6.5 billion in H1 2014. Volumes are well on track to
surpass the annual record of €19.8 billion set in 2005.
The level of investment has led to high development activity in the seven largest cities in Germany. Domestic operators
such as Deutsche Annington, Deutsche Wohnen, Adler and Patrizia continue to dominate the market but there is a
significant amount of international interest, especially from U.S. investors.
Prices have increased across the board but the greatest capital appreciation has been seen in B-locations and price
growth is also spreading out to C-locations. The majority of investors are targeting value-add and opportunistic
opportunities, as well moving into alternative assets such as micro apartments and student properties.
Momentum builds in the Netherlands
During 2014, investment volumes in the Dutch residential market increased towards the €2 billion mark, accounting for
20% of total real estate investment in the Netherlands. Momentum has continued into 2015 and by mid-year, volumes
stood at €1.6 billion.
The owner-occupied market in the Netherlands is also recovering. Both the number of sales and average sale price has
increased compared to the same period in 2014.

Global Market Perspective, Third Quarter 2015
COPYRIGHT © JONES LANG LASALLE IP, INC. 2015. All Rights Reserved 33
Highly active residential investment market in Sweden
The residential market in Sweden continues to be strong. Q2 2015 sales volumes of about SEK 5.6 billion are a few
percent below 2014, but this was an all-time high record year for transactions.
Patrizia left the Swedish market at the end of the quarter as a result of two transactions. The first deal comprised its
remaining properties in Stockholm which were sold to a national investor, with further holdings in Umeå sold to a local
investor. Sales of municipality stocks continue and Rikshem (institutional capital) is the most active investor in that
segment. In this case the municipality of Upplands-Väsby (a suburb about 25 km north of Stockholm) sold about 650
apartments to Rikshem for circa SEK 720 million (at a yield of 3.75%).
Sweden’s residential market remains extremely attractive. As investors continue to find new deals, we see newly
formed companies with different strategies, including new locations (cities and regions with lower growth) as well as
properties of lower quality.
Regulatory changes boost investment in Portugal
Since the end of 2013, the residential sales market in Portugal has recovered visibly, particularly in the metropolitan area
of Lisbon. Housing demand, driven mostly by foreign investment, has gained momentum during 2015.
Helping to boost market activity have been a number of legislative measures introduced in recent years. In particular,
amendments made to the Urban Lease Regime have paved the way for a liberalisation of the residential rental market,
making the sector a more attractive investment opportunity.
At the same time, the Residence Permit for Investment Activity in Portugal (ARI) introduced in Q4 2012, also known as
the ‘Golden Visa’ programme, has likewise helped to attract foreign demand for real estate properties.
Lisbon is the focus of the strongest international interest and recent changes in the fiscal system and new regulations
for ‘Estabelecimento de Alojamento’ (local lodging establishments), have also driven apartment purchases.
Dubai residential market sees continued decline in activity and prices
In Dubai, there has been a notable decline in residential sales, with data from the Dubai Land Department showing a
70% decline in volumes (H1 2015 saw 7,400 deals transacted compared to 23,800 in H1 2014). However, in testimony
to the market’s greater maturity, falls in both sale prices and rents have been modest in this cycle, down by -9% and -5%
respectively year-on-year. With over 70% of all sales in the Dubai market being made to foreign purchasers, the
strength of the U.S. dollar has had a major influence, making the Emirate relatively more expensive for those from other
currency blocks.
Slightly stronger sales activity in most Asian markets
Policy restrictions have remained in place in various Asian markets (e.g. HPR in China; extra stamp duties in Singapore
and Hong Kong; tighter regulations on bank credit in Singapore). However, China relaxed its down-payment rules for
buyers of second homes at the end of Q1. We expect stable or slightly stronger sales activity in most markets this year,
buoyed by prevailing low interest rates, with similar trends for prices.
In the residential leasing market, subdued demand from expatriates impacted take-up levels in Shanghai and Beijing in
the second quarter, while improved leasing activity in Hong Kong was driven in part by the finance sector. Most
markets saw stable or small increases in rents in Q2, a trend that is expected to continue over the short term.
COPYRIGHT © JONES LANG LASALLE IP, INC. 2015. All Rights Reserved 34
Global Market Perspective, Third Quarter 2015
Signs of capital growth moderation in Australian apartment market
House prices in Australia2 rose by 10% and apartment prices by 5% over the year to May 2015, both above the five and
ten-year annual average growth rate. Price rises have been particularly strong in Sydney due to the more pronounced
impact of lower mortgage rates on demand, a net housing shortage following a decade of below-trend construction, and
relatively strong population growth. Moreover, the end of the commodity boom has limited inter-state migration from
New South Wales to Queensland as mining jobs have disappeared.
Sydney, Melbourne and Brisbane have a large supply pipeline of residential apartments over the next two years, with a
particular concentration on inner-city locations. Although the majority of this stock will have been sold off-plan prior to
completion, the competition between the re-sales and off-plan markets is expected to moderate price growth. The
increasing cost of bank financing will also soften investor buyer activity.
Developers from Asia, particularly China, have entered the market with ambitious plans for apartment developments.
Many of these apartments have been sold off-plan to China-based buyers, but foreign investment rules are now being
more rigorously enforced and fees, albeit moderate, now apply to purchases by offshore purchasers. This may serve to
cool the market.
2 CoreLogic RPData, 8 capital cities across Australia.
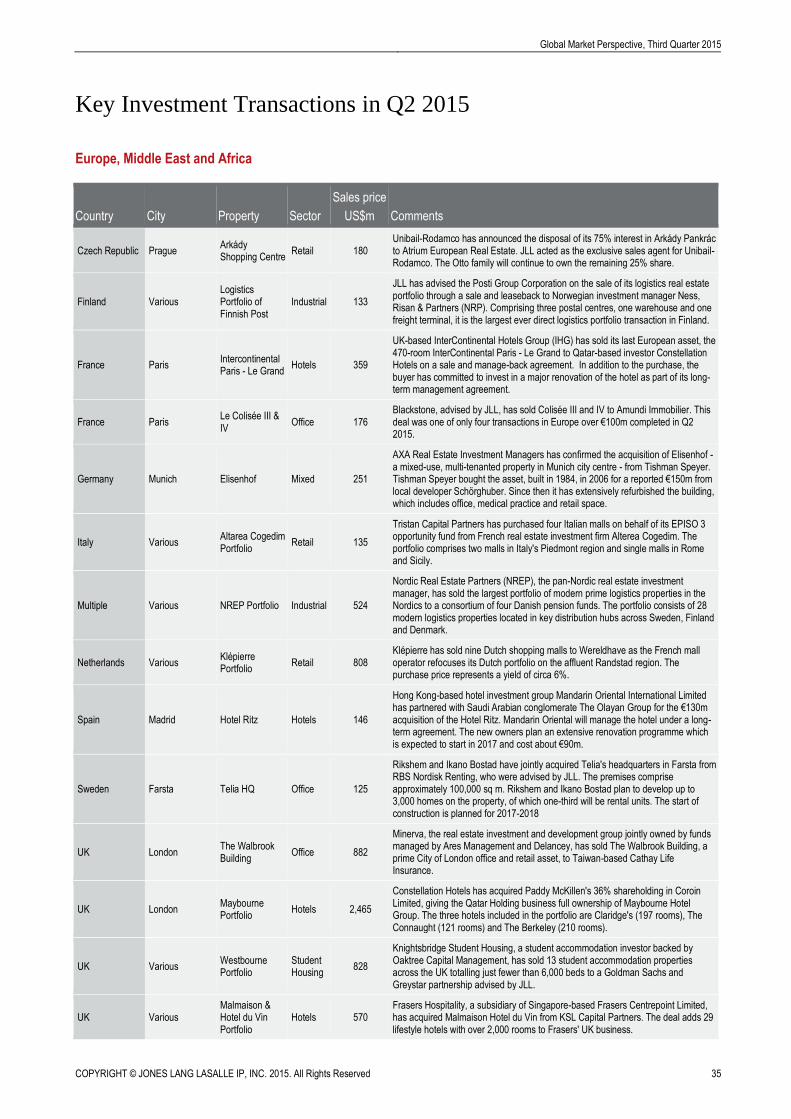
Global Market Perspective, Third Quarter 2015
COPYRIGHT © JONES LANG LASALLE IP, INC. 2015. All Rights Reserved 35
Key Investment Transactions in Q2 2015
Europe, Middle East and Africa
Country City Property Sector
Sales price
US$m Comments
Czech Republic Prague Arkády Shopping Centre
Retail 180 Unibail-Rodamco has announced the disposal of its 75% interest in Arkády Pankrác to Atrium European Real Estate. JLL acted as the exclusive sales agent for Unibail-Rodamco. The Otto family will continue to own the remaining 25% share.
Finland Various Logistics Portfolio of Finnish Post
Industrial 133
JLL has advised the Posti Group Corporation on the sale of its logistics real estate portfolio through a sale and leaseback to Norwegian investment manager Ness, Risan & Partners (NRP). Comprising three postal centres, one warehouse and one freight terminal, it is the largest ever direct logistics portfolio transaction in Finland.
France Paris Intercontinental Paris - Le Grand
Hotels 359
UK-based InterContinental Hotels Group (IHG) has sold its last European asset, the 470-room InterContinental Paris - Le Grand to Qatar-based investor Constellation Hotels on a sale and manage-back agreement. In addition to the purchase, the buyer has committed to invest in a major renovation of the hotel as part of its long-term management agreement.
France Paris Le Colisée III & IV
Office 176 Blackstone, advised by JLL, has sold Colisée III and IV to Amundi Immobilier. This deal was one of only four transactions in Europe over €100m completed in Q2 2015.
Germany Munich Elisenhof Mixed 251
AXA Real Estate Investment Managers has confirmed the acquisition of Elisenhof - a mixed-use, multi-tenanted property in Munich city centre - from Tishman Speyer. Tishman Speyer bought the asset, built in 1984, in 2006 for a reported €150m from local developer Schörghuber. Since then it has extensively refurbished the building, which includes office, medical practice and retail space.
Italy Various Altarea Cogedim Portfolio
Retail 135
Tristan Capital Partners has purchased four Italian malls on behalf of its EPISO 3 opportunity fund from French real estate investment firm Alterea Cogedim. The portfolio comprises two malls in Italy's Piedmont region and single malls in Rome and Sicily.
Multiple Various NREP Portfolio Industrial 524
Nordic Real Estate Partners (NREP), the pan-Nordic real estate investment manager, has sold the largest portfolio of modern prime logistics properties in the Nordics to a consortium of four Danish pension funds. The portfolio consists of 28 modern logistics properties located in key distribution hubs across Sweden, Finland and Denmark.
Netherlands Various Klépierre Portfolio
Retail 808 Klépierre has sold nine Dutch shopping malls to Wereldhave as the French mall operator refocuses its Dutch portfolio on the affluent Randstad region. The purchase price represents a yield of circa 6%.
Spain Madrid Hotel Ritz Hotels 146
Hong Kong-based hotel investment group Mandarin Oriental International Limited has partnered with Saudi Arabian conglomerate The Olayan Group for the €130m acquisition of the Hotel Ritz. Mandarin Oriental will manage the hotel under a long-term agreement. The new owners plan an extensive renovation programme which is expected to start in 2017 and cost about €90m.
Sweden Farsta Telia HQ Office 125
Rikshem and Ikano Bostad have jointly acquired Telia's headquarters in Farsta from RBS Nordisk Renting, who were advised by JLL. The premises comprise approximately 100,000 sq m. Rikshem and Ikano Bostad plan to develop up to 3,000 homes on the property, of which one-third will be rental units. The start of construction is planned for 2017-2018
UK London The Walbrook Building
Office 882
Minerva, the real estate investment and development group jointly owned by funds managed by Ares Management and Delancey, has sold The Walbrook Building, a prime City of London office and retail asset, to Taiwan-based Cathay Life Insurance.
UK London Maybourne Portfolio
Hotels 2,465
Constellation Hotels has acquired Paddy McKillen's 36% shareholding in Coroin Limited, giving the Qatar Holding business full ownership of Maybourne Hotel Group. The three hotels included in the portfolio are Claridge's (197 rooms), The Connaught (121 rooms) and The Berkeley (210 rooms).
UK Various Westbourne Portfolio
Student Housing
828
Knightsbridge Student Housing, a student accommodation investor backed by Oaktree Capital Management, has sold 13 student accommodation properties across the UK totalling just fewer than 6,000 beds to a Goldman Sachs and Greystar partnership advised by JLL.
UK Various Malmaison & Hotel du Vin Portfolio
Hotels 570 Frasers Hospitality, a subsidiary of Singapore-based Frasers Centrepoint Limited, has acquired Malmaison Hotel du Vin from KSL Capital Partners. The deal adds 29 lifestyle hotels with over 2,000 rooms to Frasers' UK business.

COPYRIGHT © JONES LANG LASALLE IP, INC. 2015. All Rights Reserved 36
Global Market Perspective, Third Quarter 2015
Asia Pacific
Country City Property Sector
Sales
price
US$m Comments
Australia Adelaide Myer Centre Adelaide
Mixed 223
YTL Starhill Global REIT has purchased the mixed-use property from Novion Retail Partnership at an initial yield of 6.6%. At A$288m this transaction is the second largest retail deal in the South Australian market to date. Myer Centre Adelaide has a NLA of 60,000 sq m of retail and 10,000 sq m of office space and recently renewed a long-term lease to the anchor tenant Myer.
Australia Brisbane 215 Adelaide Street
Office 174
Challenger Life has purchased 215 Adelaide Street from one of Pramerica's International Asia Property Funds. The property includes two adjoining buildings, a 33-storey A-Grade office tower and a 6-storey boutique office building offering a total NLA of 29,110 sq m as well as ground floor retail. The building houses groups such as Bendigo and Adelaide Bank and has a WALE of 4.4 years.
Australia Brisbane Waterfront Place Complex
Mixed 460
Dexus Property Group has acquired 1 Eagle Street, Brisbane's largest office tower and a riverfront retail complex. Dexus will partner with the Dexus Wholesale Property Fund to each purchase a 50% interest in the complex from Future Fund and Stockland.
Australia Cairns Pullman Cairns International
Hotels 66 The Pullman Cairns International hotel has been sold to a private equity group. The deal was secured by the Shakespeare Property Group, a relatively new investment vehicle headed by Melbourne’s Yong Quek.
Australia Melbourne 357 Collins Street
Office 173
Singapore-listed REIT Frasers Commercial Trust has made its maiden entry into the Melbourne CBD office market with the purchase of 357 Collins Street, a 25-storey, 31,920 sq m freehold property, from Australand Property Holdings, a wholly-owned trust of Frasers Australand, for S$223m.
Australia Sydney Telstra Plaza Office 156
Propertylink Holdings has purchased 320 Pitt Street from U.S. REIT Equity Commonwealth for A$200m at a yield of 8.3%. Telstra has a lease for the 30,000 sq m office block for five years, after which Propertylink has the option to retain it as a commercial building or look to convert it to residential.
China Shanghai Life Hub @ Kunshan
Office 509
Ivanhoé Cambridge and APG have jointly invested US$920m into Chongbang Development as part of its expansion in Shanghai. As part of the portfolio deal Life Hub @ Kunshan was purchased for US$509m. Chongbang Development is a Shanghai-based retail anchored mixed-use developer, owner and operator of 428,000 sq m of retail and commercial space in Shanghai with another 417,000 sq m under development.
China Shanghai Sandhill Plaza Office 304
Mapletree Greater China Commercial Trust (MGCCT) has acquired Sandhill Plaza for a purchase consideration of about RMB1.9bn. The premium-quality business park, located in Zhangjiang Hi-tech Park, has a GFA of approximately 83,800 sq m with a committed occupancy rate of about 96% and is MGCCT's first acquisition since listing in 2013.
China Shenzhen Zhengshun Plaza
Office 360
China Vanke has acquired the Zhengshun Plaza project, an unfinished building in Lowu District. The project was built by New Century Construction Development (Shenzhen) in 1993 but was suspended in 2000. The net site area of the project has a plot ratio-based GFA of approximately 130,000 sq m. Upon completion, part of the building will be turned into luxury apartments.
Hong Kong Hong Kong Grand Hyatt Hong Kong (50% Stake)
Hotels 593 The Abu Dhabi Investment Authority (ADIA) has acquired a 50% stake in the 539-room Grand Hyatt hotel from New World Development Company Limited.
Hong Kong Hong Kong
Hyatt Regency Tsim Sha Tsui Hong Kong (50% Stake)
Hotels 231 A 50% stake in the 381-room Hyatt Regency hotel has been sold by New World Development Company Limited to ADIA.
Hong Kong Hong Kong
Renaissance Harbour View Hong Kong (50% Stake)
Hotels 478 ADIA has bought a 50% stake in the 857-room Renaissance hotel. This deal, along with the acquisition of the Hyatt Regency and Grand Hyatt in Hong Kong, marks ADIA's largest investment in Asia to date.
Japan Osaka Honmachi Garden City
Office 319 Sekisui House REIT has purchased the office portion of the Honmachic Garden City complex from its parent company, Sekisui House, for a cap rate of 4.2%.
Japan Tokyo Akasaka Garden City
Office 343 Sekisui House REIT has acquired all floors except 5-10F on a strata-title basis from a JV of Westbrook Partners, GreenOak and their asset manager, Kenedix for an NOI yield of 2%.

Global Market Perspective, Third Quarter 2015
COPYRIGHT © JONES LANG LASALLE IP, INC. 2015. All Rights Reserved 37
Country City Property Sector
Sales
price
US$m Comments
Japan Yokohama Nisseki Yokohama Building
Office 205
Japan Excellent, Inc. has purchased the Nisseki Yokohama building from E Buildings GK. The property located in Minato Mirai 21 is situated a few minutes’ walk from Sakuragicho Station and has access to major metropolitan business centres as well as the Shinkansen and Haneda Airport. The property has a NLA of about 37,800 sq m and, as of 31 December 2014, is 91.8% leased.
Japan Various Daiwa Office REIT Portfolio
Office 415
Daiwa Office J-REIT has acquired the portfolio from the Tokyo Recovery Fund, a JV of JP Morgan Asset Management and PAG. Shibuya Glass City, which is considered to be the portfolio’s trophy asset, was transacted at a 4.1% cap rate.
Japan Various Ichigo REIT Portfolio
Office 369
Ichigo Real Estate Investment Corporation has purchased 12 Grade B office buildings predominantly located in the central 5-Kus wards of Tokyo at a blended NOI yield of 4.9%. Some of the assets were formally owned by G Real Estate.
Malaysia Kuala Lumpur Integra Tower @ The Intermark
Hotels 294
Kumpulan Wang Persaraan has acquired the 39-storey Integra office block from BlackRock at an annualised yield of 6%. The Intermark comprises four parcels: office blocks Integra Tower and Vista Tower, a DoubleTree hotel and the Intermark Mall. Two of the parcels were sold in Q2 2015, with negotiations over the Intermark Mall and Vista Tower ongoing and expected to close in H2 2015.
Singapore Singapore One Raffles Place
Mixed 848
OUE Commercial REIT has acquired a partial interest in One Raffles Place from sponsor OUE for a purchase consideration between S$1,000m and S$1,150m. Located in the heart of the CBD, One Raffles Place is an integrated commercial development comprising two Grade-A office buildings and a recently refurbished retail mall, One Raffles Place Shopping Mall.
Singapore Singapore Park Mall Retail 303
Suntec REIT has sold this mall to a newly-created JV consisting of a 30/70 equity split between Suntec REIT and SingHaiyi for S$412m. The integrated office, lifestyle and home furnishing retail mall located within the Orchard Road shopping belt will be rebuilt as a commercial development comprising two office blocks with an ancillary retail component. It has a remaining land lease tenure of 53 years.
South Korea Seoul Ferrum Tower Office 384 Dongkuk Steel has sold its headquarters building, near Myeong-dong in Seoul's downtown, to Samsung Life.
South Korea Seoul Tower 8 Mixed 292
Deutsche Asset & Wealth Management has purchased Tower 8 for €272m from South Korean property development company GS E&C. The 24-storey office and retail building is located in downtown CBD Chungjin 8 and has a NLA of 48,900 sq m.
South Korea Seoul D-Cube City Department Store
Retail 263
GIC and CPPIB have entered into a JV to acquire the D-Cube Retail Mall from Daesung Industries. D-Cube is situated next to Sindorim Station, a major transportation hub connecting Seoul with Incheon and other major metropolitan cities near the capital. The mall will be rebranded as Hyundai Department Store and will be operated by Hyundai.
Americas
Country City Property Sector
Sales
price
US$m Comments
Brazil Sao Paulo Mais Shopping Largo 13
Retail 26 Brazilian owner Bradesco Asset Management has sold a 40% interest in the over 13,000 sq m retail asset to Israel-based investor Gazit-Globe.
Canada Toronto Loblaws Industrial 66 REIT Choice Properties has acquired the 86,000 sq m warehouse asset located in the Pickering submarket from corporate owner Loblaw Companies at a reported 6.5% initial yield.
Canada Vancouver 1550 Alberni Street
Office 38 Property firm Westbank Projects has purchased the 9,300 sq m CBD office building from Wicklow West Holdings.

COPYRIGHT © JONES LANG LASALLE IP, INC. 2015. All Rights Reserved 38
Global Market Perspective, Third Quarter 2015
Country City Property Sector
Sales
price
US$m Comments
Mexico Mexico City Utah Office Office 67 Mexican REIT Fibra Uno has acquired the office asset located in the Bosques de las Lomas area at a reported 8.8% initial yield.
Mexico Guadalupe Rockwell Automation
Industrial 58 MMREIT has bought the industrial facility on Avenue Frisa from U.S. REIT Ridge Property Trust at a reported 9% initial yield.
U.S. Chicago 58-104 East Oak Street
Retail 176 Spanish investor Ponte Gadea has purchased the 5,400 sq m urban retail asset in the Gold Coast neighbourhood from DRW Trading.
U.S. Houston 1301 Fannin Office 150 Amerimar Properties has acquired the 74,000 sq m CBD office tower from Griffin Properties.
U.S. Key West
Waldorf Astoria Casa Marina Resort Key West
Hotels Undisclosed
JLL has advised Blackstone on the sale of the 311-room Waldorf Astoria Casa Marina Resort Key West to Hilton Worldwide. In a concurrent transaction, Hilton Worldwide has also acquired the 150-room Waldorf Astoria The Reach Resort Key West.
U.S. Las Vegas Showcase Mall III
Retail 140 Unilev Capital has sold the 9,000 sq m retail asset on the Strip from Nakash Holdings.
U.S. Los Angeles Dreamworks Animation
Industrial 185 Studio Dreamworks Animation has sold its over 33,000 sq m property on Flower Street in Glendale to SunTrust Banks.
U.S. Los Angeles Ace Hotel Downtown Los Angeles
Hotels 103 Chesapeake Lodging Trust has acquired the Ace Hotel from Greenfield Partners. Under the management agreement with Chesapeake Lodging, Ace Hotel Group will continue to brand and operate the hotel.
U.S. Miami Beach The Royal Palm Miami Beach
Hotels 278 Acting on behalf of KSL Resorts, JLL has sold the 393-room hotel to Chesapeake Lodging Trust.
U.S. New York 1095 Sixth Ave. Office 2,200 Caisse de dépôt has acquired the 96,000 sq m Midtown office tower from Blackstone.
U.S. New York Waldorf Astoria Hotels 1,950
Hilton Worldwide has completed the sale of the 1,413-room Waldorf Astoria to China-based Anbang Insurance Group. The hotel has been owned by Hilton for 65 years and, as part of the terms of sale, Hilton Worldwide will continue to operate the hotel under a 100-year management agreement.
U.S. New York Marriott New York East Side
Hotels 270 Morgan Stanley Real Estate Advisors has completed the sale of the 655-room Marriott hotel to Ashkenazy Acquisition Corporation. Marriott International reportedly will maintain management of the property.
U.S. Orlando, Phoenix 3-Hotel Paulson Portfolio
Hotels 1,300 Paulson & Co. has completed the sale of three hotels (JW Marriott Phoenix Dessert Ridge Resort & Spa, JW Marriott Orlando Grande Lakes, Ritz-Carlton Grande Lakes Resort) to Blackstone.
U.S. San Francisco 50 Fremont Street
Office 629 Institutional giant TIAA-CREF has sold the 76,000 sq m South Financial District office tower to technology industry tenant Salesforce.
U.S. Various Great Wolf Resorts Portfolio
Hotels 1,350
Affiliates of Centerbridge Partners, a leading private investment firm, have completed their acquisition of Great Wolf Resorts from funds managed by affiliates of Apollo Global Management. The portfolio includes a total of 10 properties located across the U.S.
U.S. Various
Crestwood Suites, Sun Suites & HTS Portfolio
Hotels 300
Starwood Capital Group has acquired a portfolio of 50 U.S. economy extended-stay locations from Mount Kellett Capital Management. The portfolio consists of 6,106 rooms primarily in the Southeast, including desirable markets in North Carolina, Florida, Texas, Georgia and Alabama.
U.S. Various 7-Hotel Marriott Portfolio
Hotels 214 Private equity investor Lone Star Funds has acquired a total of seven Marriott hotels located throughout the U.S. from Eagle Realty Group.
U.S. Various 11-Property Select Service Hotel Portfolio
Hotels 174 Wheelock Street Capital has completed the sale of 11 mid-scale properties to Capstone Development Partners.
U.S. Various Equity Inns Portfolio
Hotels 1,808
Whitehall Real Estate Funds has sold the 116-strong Equity Inns Portfolio to ARC Hospitality Trust. The portfolio includes 13,744 rooms across 31 states in the U.S., franchised by Hilton Worldwide, Marriott International and InterContinental Hotels Group.
U.S. Washington DC Arch Square Retail 109 Swiss investor AFIAA has purchased this more than 5,000 sq m urban retail property from property firm McCaffery Interests at a reported 3.5% initial yield.
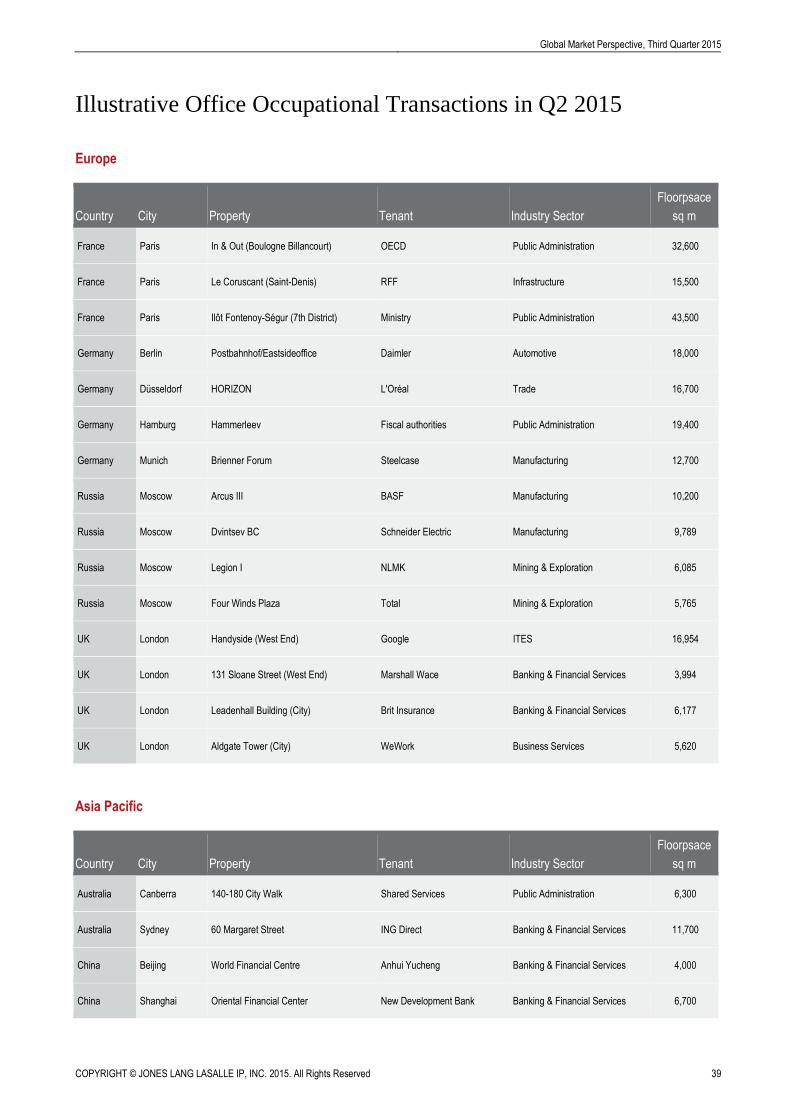
Global Market Perspective, Third Quarter 2015
COPYRIGHT © JONES LANG LASALLE IP, INC. 2015. All Rights Reserved 39
Illustrative Office Occupational Transactions in Q2 2015
Europe
Country City Property Tenant Industry Sector
Floorpsace
sq m
France Paris In & Out (Boulogne Billancourt) OECD Public Administration 32,600
France Paris Le Coruscant (Saint-Denis) RFF Infrastructure 15,500
France Paris Ilôt Fontenoy-Ségur (7th District) Ministry Public Administration 43,500
Germany Berlin Postbahnhof/Eastsideoffice Daimler Automotive 18,000
Germany Düsseldorf HORIZON L'Oréal Trade 16,700
Germany Hamburg Hammerleev Fiscal authorities Public Administration 19,400
Germany Munich Brienner Forum Steelcase Manufacturing 12,700
Russia Moscow Arcus III BASF Manufacturing 10,200
Russia Moscow Dvintsev BC Schneider Electric Manufacturing 9,789
Russia Moscow Legion I NLMK Mining & Exploration 6,085
Russia Moscow Four Winds Plaza Total Mining & Exploration 5,765
UK London Handyside (West End) Google ITES 16,954
UK London 131 Sloane Street (West End) Marshall Wace Banking & Financial Services 3,994
UK London Leadenhall Building (City) Brit Insurance Banking & Financial Services 6,177
UK London Aldgate Tower (City) WeWork Business Services 5,620
Asia Pacific
Country City Property Tenant Industry Sector
Floorpsace
sq m
Australia Canberra 140-180 City Walk Shared Services Public Administration 6,300
Australia Sydney 60 Margaret Street ING Direct Banking & Financial Services 11,700
China Beijing World Financial Centre Anhui Yucheng Banking & Financial Services 4,000
China Shanghai Oriental Financial Center New Development Bank Banking & Financial Services 6,700
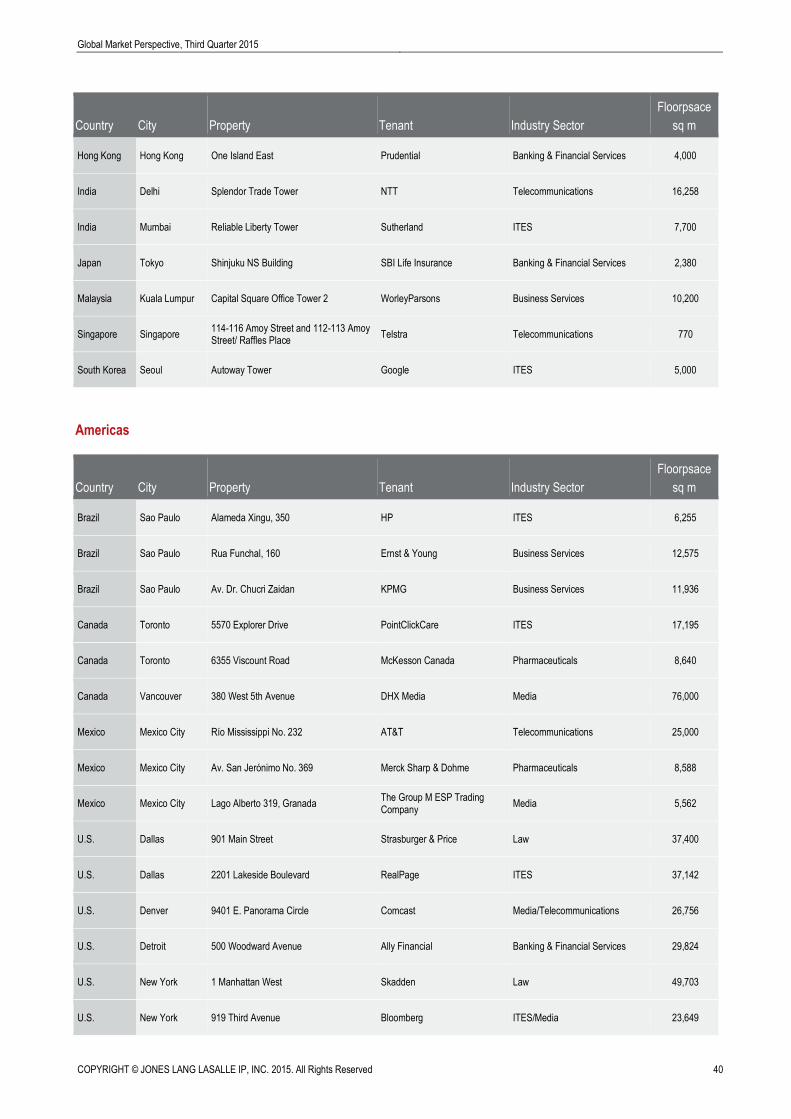
COPYRIGHT © JONES LANG LASALLE IP, INC. 2015. All Rights Reserved 40
Global Market Perspective, Third Quarter 2015
Country City Property Tenant Industry Sector
Floorpsace
sq m
Hong Kong Hong Kong One Island East Prudential Banking & Financial Services 4,000
India Delhi Splendor Trade Tower NTT Telecommunications 16,258
India Mumbai Reliable Liberty Tower Sutherland ITES 7,700
Japan Tokyo Shinjuku NS Building SBI Life Insurance Banking & Financial Services 2,380
Malaysia Kuala Lumpur Capital Square Office Tower 2 WorleyParsons Business Services 10,200
Singapore Singapore 114-116 Amoy Street and 112-113 Amoy Street/ Raffles Place
Telstra Telecommunications 770
South Korea Seoul Autoway Tower Google ITES 5,000
Americas
Country City Property Tenant Industry Sector
Floorpsace
sq m
Brazil Sao Paulo Alameda Xingu, 350 HP ITES 6,255
Brazil Sao Paulo Rua Funchal, 160 Ernst & Young Business Services 12,575
Brazil Sao Paulo Av. Dr. Chucri Zaidan KPMG Business Services 11,936
Canada Toronto 5570 Explorer Drive PointClickCare ITES 17,195
Canada Toronto 6355 Viscount Road McKesson Canada Pharmaceuticals 8,640
Canada Vancouver 380 West 5th Avenue DHX Media Media 76,000
Mexico Mexico City Río Mississippi No. 232 AT&T Telecommunications 25,000
Mexico Mexico City Av. San Jerónimo No. 369 Merck Sharp & Dohme Pharmaceuticals 8,588
Mexico Mexico City Lago Alberto 319, Granada The Group M ESP Trading Company
Media 5,562
U.S. Dallas 901 Main Street Strasburger & Price Law 37,400
U.S. Dallas 2201 Lakeside Boulevard RealPage ITES 37,142
U.S. Denver 9401 E. Panorama Circle Comcast Media/Telecommunications 26,756
U.S. Detroit 500 Woodward Avenue Ally Financial Banking & Financial Services 29,824
U.S. New York 1 Manhattan West Skadden Law 49,703
U.S. New York 919 Third Avenue Bloomberg ITES/Media 23,649

Global Market Perspective, Third Quarter 2015
COPYRIGHT © JONES LANG LASALLE IP, INC. 2015. All Rights Reserved 41
Country City Property Tenant Industry Sector
Floorpsace
sq m
U.S. San Francisco 510 Townsend Street Stripe ITES 27,871
U.S. San Francisco Peninsula
162 Jefferson Drive EMC ITES 25,141
U.S. Silicon Valley 3325 Scott Boulevard Palo Alto Networks ITES 67,072
U.S. Silicon Valley 2215-2225 Lawson Lane ServiceNow ITES 30,580
COPYRIGHT © JONES LANG LASALLE IP, INC. 2015.
This report has been prepared solely for information purposes and does not necessarily purport to be a complete analysis of the topics discussed, which are inherently unpredictable. It has been based on sources we believe to be reliable, but we have not independently verified those sources and we do not guarantee that the information in the report is accurate or complete. Any views expressed in the report reflect our judgment at this date and are subject to change without notice. Statements that are forward-looking involve known and unknown risks and uncertainties that may cause future realities to be materially different from those implied by such forward-looking statements. Advice we give to clients in particular situations may differ from
the views expressed in this report. No investment or other business decisions should be made based solely on the views expressed in this report