joan bloch, phd, crnp sarah cordivano, ms more than just bus fare: utilizing gis to deconstruct...
TRANSCRIPT
Joan Bloch, PhD, CRNPSarah Cordivano, MS
More Than Just Bus Fare: Utilizing GIS to Deconstruct Prenatal Care Travel
Funded by NINR Grant 5K23NR010747-02Funded by NINR Grant 5K23NR010747-02

Study ObjectiveDeconstruct the simple task of traveling to prenatal care using public transportation.
Address social determinants contributing to observed racial/ethnic perinatal health disparities related to preterm birth (PTB) among women living in neighborhoods that are disproportionately burdened with higher rates of PTB than other neighborhoods.
Translate previous health disparities research findings to meaningful implications at the point-of care
BackgroundPreterm Birth is a HUGE public health problem
Responsible for the embarrassing high infant mortality rate in the US
Having had a preterm birth is most predictive of having another
About 50% of all pregnancies are unplanned
‘Too short’ of an inter-conceptual period is a risk factor for PTB
Caregiving demands for mothers of PTB infants are greater than those of term infants
Despite decades of
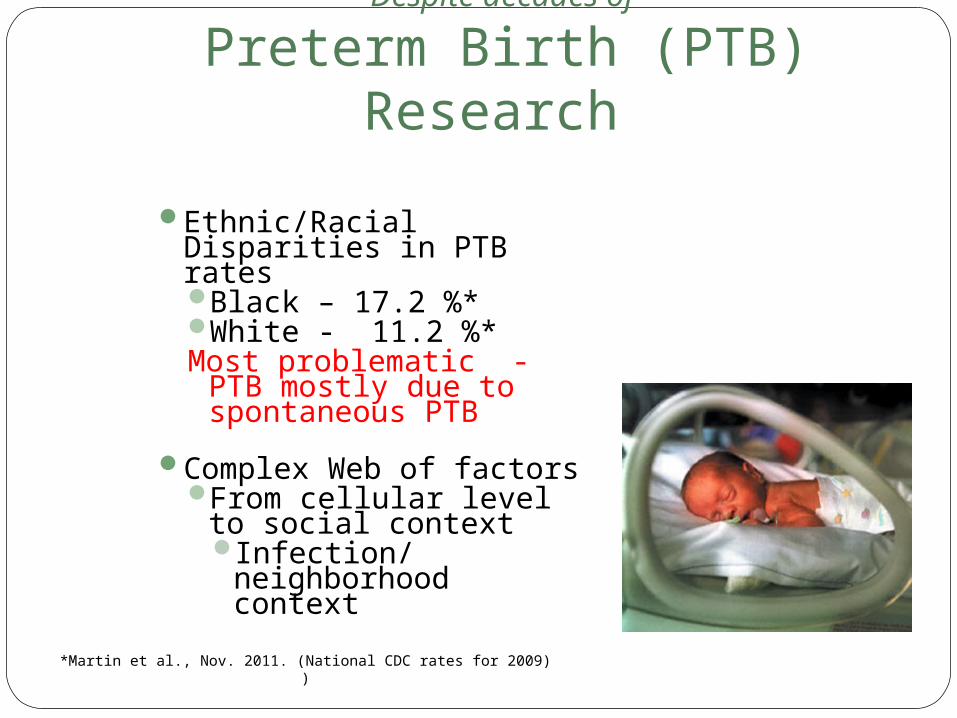
Preterm Birth (PTB) Research
4
Ethnic/Racial Disparities in PTB ratesBlack – 17.2 %*White - 11.2 %*Most problematic -
PTB mostly due to spontaneous PTB
Complex Web of factorsFrom cellular level to
social contextInfection/
neighborhood context
*Martin et al., Nov. 2011. (National CDC rates for 2009))

Theoretical framework: Anderson & Aday’s Model of Health Services Utilization (1978)
Access and use of healthcare services is a result of decisions made by the individual, which may be constrained by social class, material resources, and the context of all their real-life demands.

Research DesignDescriptive study using Geographical
Information Systems (GIS) as an exploratory tool with case vignette
GIS is a geographically rooted computer technology program that allows data to be displayed and analyzed spatially
Case Vignette simulate a typical case to address phenomenon in context*
*Yin, R.K. (1981). The case study as a serious research strategy. Knowledge: Creation, Diffusion, utilization, 3 (1):97-114.
Methods: Multi-level LensNeed new ways to look at old problems

MethodsThe setting: Philadelphia
About 23,000 births annually.Persistent Black/White racial disparities
in infant mortality, PTB ratesRacially segregated neighborhoodsDisproportionally high PTB rates in
neighborhoods with high Black ethnic density
Neighborhood*: 350 census tracts
*Krieger et al., (2003). Neighborhoods and Health

Rate of Preterm Births* – Neighborhood(Census Tract) Level
*Data source: 2003-2005 Resident Philadelphia Birth Records (n= 61, 303)
*GIS Maps created by Bloch & Cardivano
Here are findings from my previous descriptive work using GIS

Percent Below Poverty* – Census Tract Level
*Data source: 2000 Census data
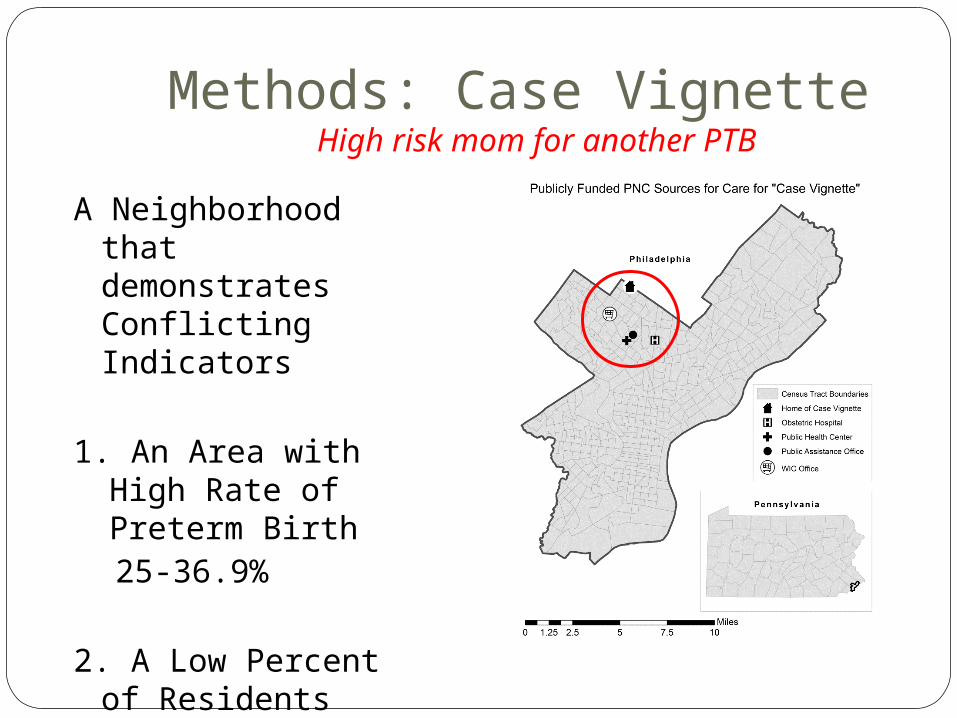
Methods: Case VignetteHigh risk mom for another PTB
A Neighborhood that demonstrates Conflicting Indicators
1. An Area with High Rate of Preterm Birth25-36.9%
2. A Low Percent of Residents Below Poverty
0-8%
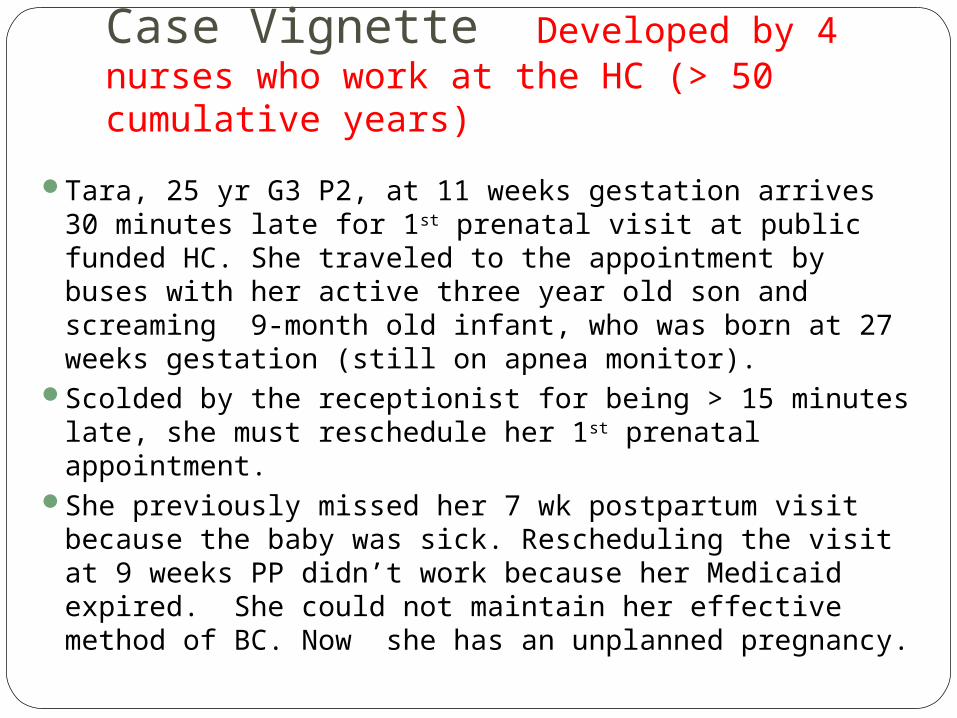
Case Vignette Developed by 4 nurses who work at the HC (> 50 cumulative years)
Tara, 25 yr G3 P2, at 11 weeks gestation arrives 30 minutes late for 1st prenatal visit at public funded HC. She traveled to the appointment by buses with her active three year old son and screaming 9-month old infant, who was born at 27 weeks gestation (still on apnea monitor).
Scolded by the receptionist for being > 15 minutes late, she must reschedule her 1st prenatal appointment.
She previously missed her 7 wk postpartum visit because the baby was sick. Rescheduling the visit at 9 weeks PP didn’t work because her Medicaid expired. She could not maintain her effective method of BC. Now she has an unplanned pregnancy.
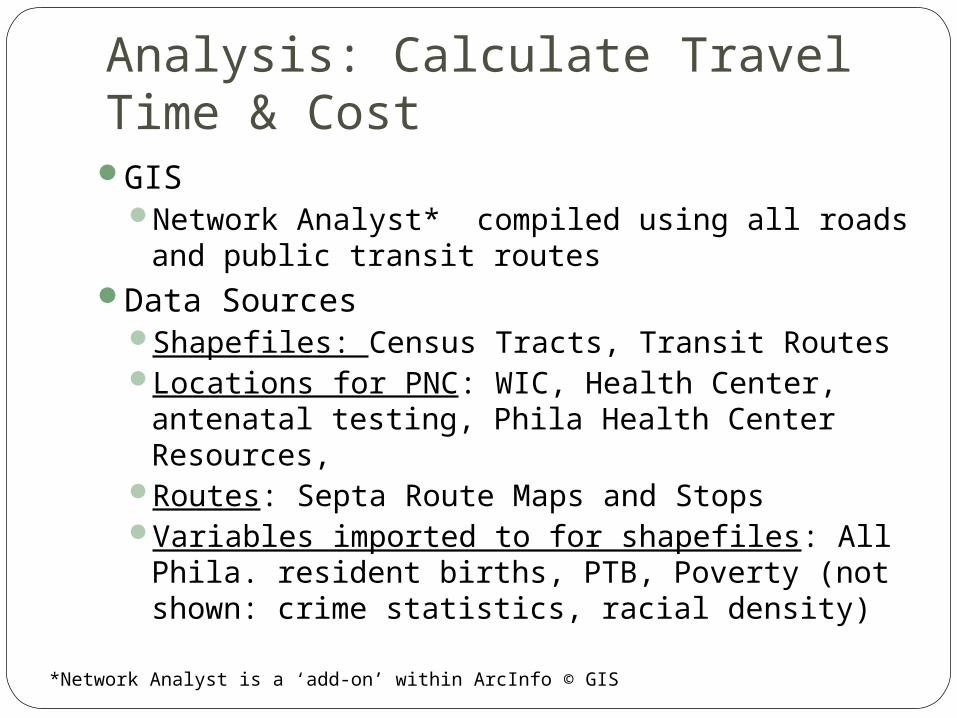
Analysis: Calculate Travel Time & CostGIS
Network Analyst* compiled using all roads and public transit routes
Data SourcesShapefiles: Census Tracts, Transit RoutesLocations for PNC: WIC, Health Center, antenatal testing,
Phila Health Center Resources, Routes: Septa Route Maps and Stops Variables imported to for shapefiles: All Phila. resident
births, PTB, Poverty (not shown: crime statistics, racial density)
*Network Analyst is a ‘add-on’ within ArcInfo © GIS
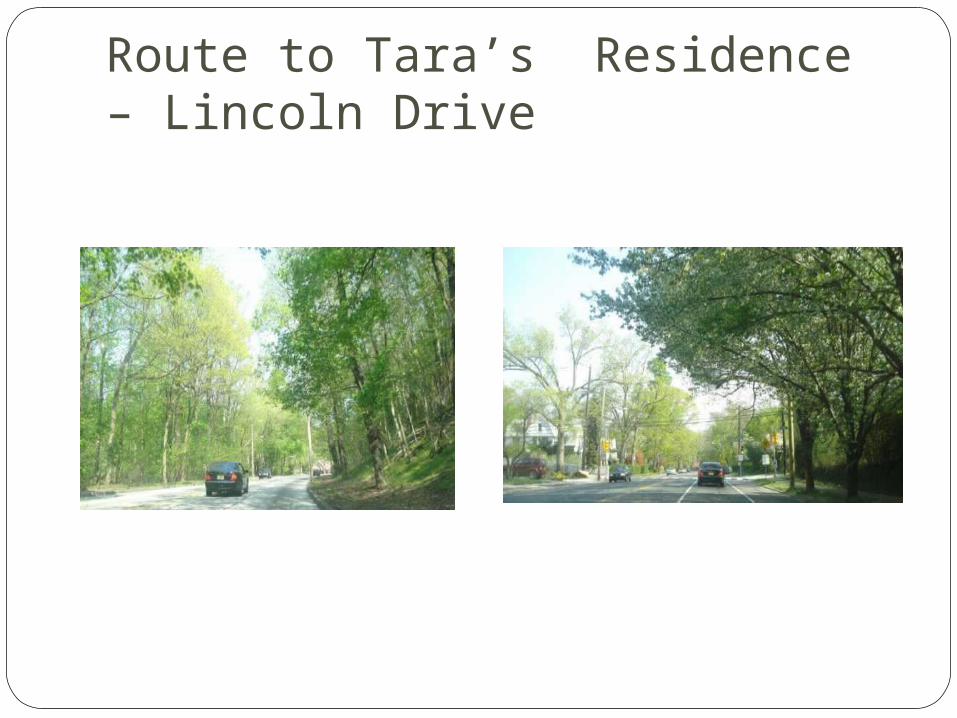
Route to Tara’s Residence – Lincoln Drive

Tara’s Residence (Cheltenham & Mt. Pleasant)
Rents range from $500 – $825 + utilities
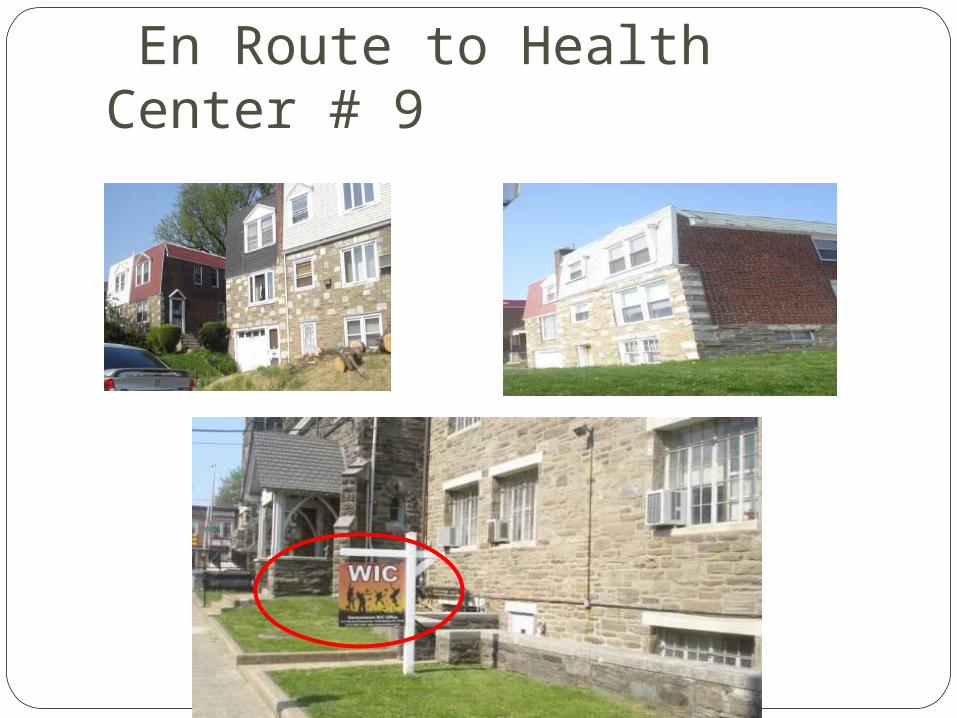
En Route to Health Center # 9

En Route to Health Center # 9

Physical and Built Environments – District Health Center # 9
No Lighting +
Blind Corner +
Trash = not a nice or safe neighborhood
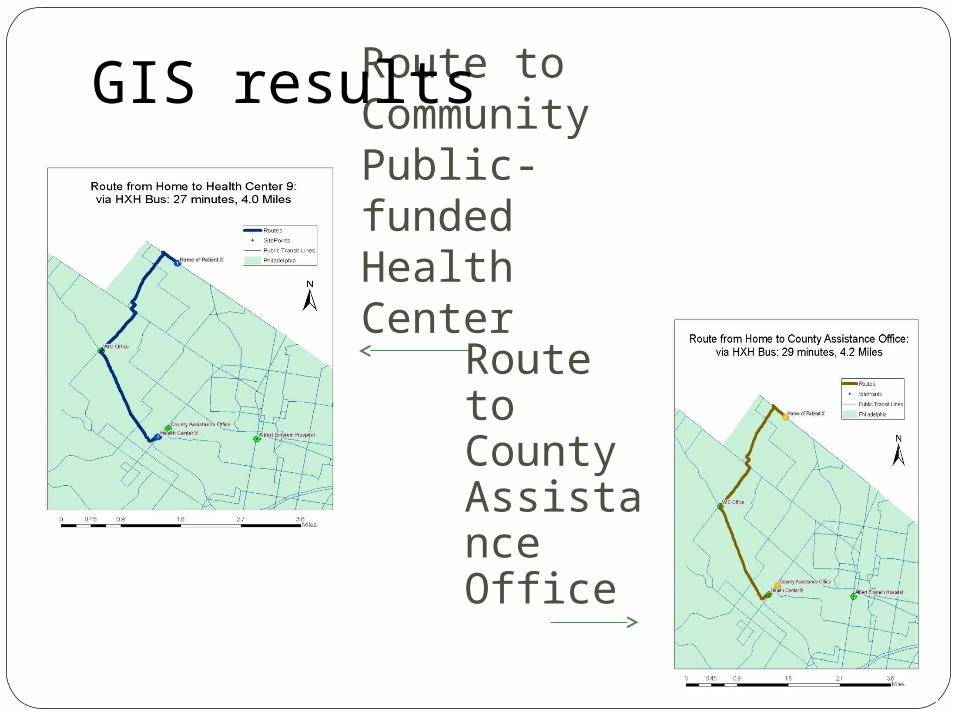
Route to Community Public-funded Health Center
Route toCounty Assistance Office
GIS results
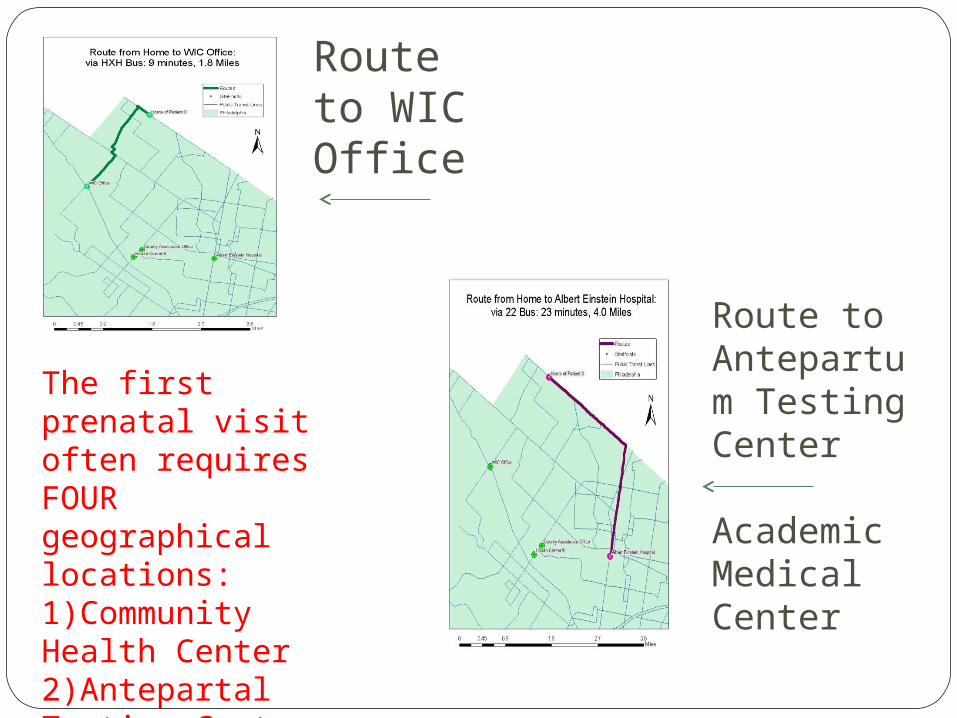
Route to WIC Office
The first prenatal visit often requires FOUR geographical locations:1)Community Health Center2)Antepartal Testing Center3)Public Assistance4)WIC
Route to Antepartum Testing Center
Academic Medical Center

Facility Number of Visits
Time Spent Traveling(minutes)
Miles Traveled
Cost for travel
Public Assistance
2 116 16.8 $6.20
WIC Office 3 54 10.8 $9.30
Antenatal testing
3 138 24 $9.30
Health Center (PNC)
13 702 104 $40.30
Totals 21Visits
16.8 Hours
155.6Miles
$65.10
Total Time and Cost of Travel per Pregnancy Normal –risk pregnancy

Facility Number of Visits
Time Spent Traveling(minutes)
Miles Traveled
Cost for travel
Public Assistance
2 116 16.8 $6.20
WIC Office 3 54 10.8 $9.30
Antenatal testing
12 552 96 $37.20
Health Center (PNC)
15 810 120 $46.50
Totals 32Visits
25.5 hours
243.6Miles
$99.20
Total Time and Cost of Travel per Pregnancy High –risk pregnancy “Case Vignette”

ConclusionsDeconstruction of travel ONLY to prenatal
careConsider ALL the places a mother must
travel to care for herself and her family
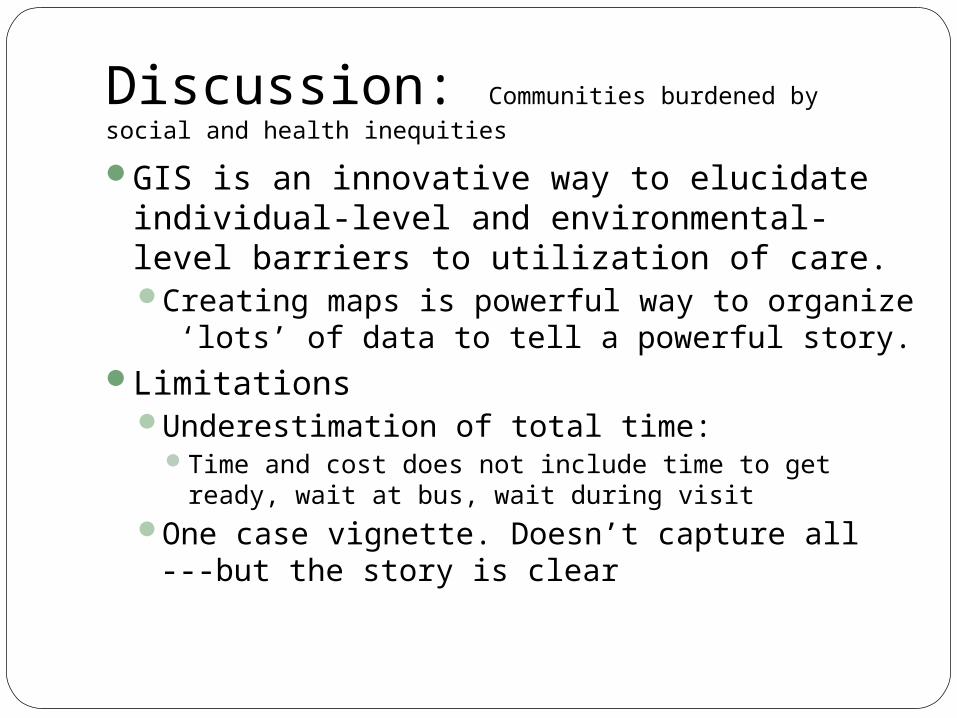
Discussion: Communities burdened by social and health inequities
GIS is an innovative way to elucidate individual-level and environmental-level barriers to utilization of care.Creating maps is powerful way to organize ‘lots’ of data
to tell a powerful story.Limitations
Underestimation of total time:Time and cost does not include time to get ready, wait at bus, wait
during visitOne case vignette. Doesn’t capture all ---but the story is
clear
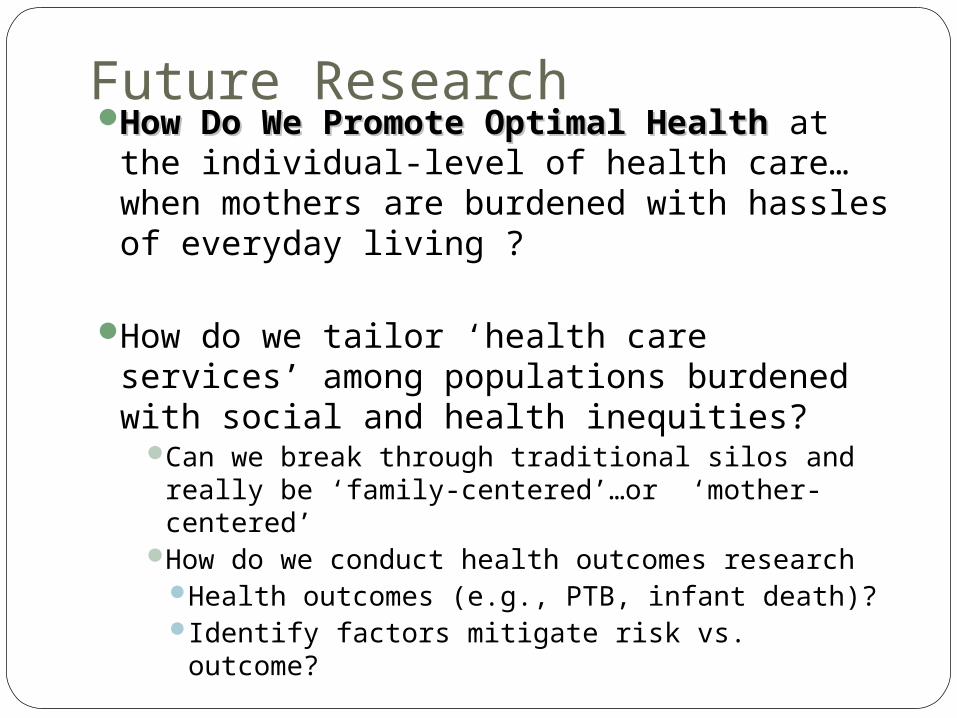
Future ResearchHow Do We Promote Optimal How Do We Promote Optimal
HealthHealth at the individual-level of health care… when mothers are burdened with hassles of everyday living ?
How do we tailor ‘health care services’ among populations burdened with social and health inequities?
Can we break through traditional silos and really be ‘family-centered’…or ‘mother-centered’
How do we conduct health outcomes researchHealth outcomes (e.g., PTB, infant death)?Identify factors mitigate risk vs. outcome?