job number 243020 type page no. i operator...
TRANSCRIPT

JOB TITLE Meritor 10-K REVISION 3 SERIAL DATE / TIME Friday, November 30, 2012 JOB NUMBER 243020 TYPE PAGE NO. i OPERATOR PM2
<12345678>

JOB TITLE Meritor 10-K REVISION 3 SERIAL DATE / TIME Friday, November 30, 2012 JOB NUMBER 243020 TYPE PAGE NO. ii OPERATOR PM2
<12345678>

JOB TITLE Meritor 10-K REVISION 3 SERIAL DATE / TIME Friday, November 30, 2012 JOB NUMBER 243020 TYPE PAGE NO. iii OPERATOR PM2
<12345678>

(This page intentionally left blank.)
JOB TITLE Meritor 10-K REVISION 3 SERIAL DATE / TIME Friday, November 30, 2012 JOB NUMBER 243020 TYPE PAGE NO. iv OPERATOR PM2
<12345678>

UNITED STATES SECURITIES AND EXCHANGE COMMISSION
WASHINGTON, D.C. 20549
FORM 10-KANNUAL REPORT PURSUANT TO SECTION 13 OR 15(d) OF
THE SECURITIES EXCHANGE ACT OF 1934 For the Fiscal Year Ended September 30, 2012
Commission file number 1-15983
MERITOR, INC.(Exact name of registrant as specified in its charter)
Indiana 38-3354643(State or other jurisdiction of incorporation
or organization)(I.R.S. Employer
identification no)
2135 West Maple Road Troy, Michigan 48084-7186
(Address of principal executive offices) (Zip Code)
Registrant’s telephone number, including area code: (248) 435-1000
SECURITIES REGISTERED PURSUANT TO SECTION 12(b) OF THE ACT:Title of each class Name of each exchange on which registered
Common Stock, $1 Par Value New York Stock Exchange
SECURITIES REGISTERED PURSUANT TO SECTION 12(g) OF THE ACT: None
Indicate by check mark whether the registrant is a well-known seasoned issuer, as defined in Rule 405 of the Securities Act. Yes No
Indicate by check mark if the registrant is not required to file reports pursuant to Section 13 or Section 15(d) of the Act. Yes No
Indicate by check mark whether the registrant (1) has filed all reports required to be filed by Section 13 or 15(d) of the Securities Exchange Act of 1934 during the preceding 12 months (or for such shorter period that the registrant was required to file such reports), and (2) has been subject to such filing requirements for the past 90 days. Yes No
Indicate by check mark whether the registrant has submitted electronically and posted on its corporate web site, if any, every Interactive Data File required to be submitted and posted pursuant to Rule 405 of Regulation S-T during the preceding twelve months (or for such shorter period that the registrant was required to submit and post such files). Yes No
Indicate by check mark if disclosure of delinquent filers pursuant to Item 405 of Regulation S-K is not contained herein, and will not be contained, to the best of registrant’s knowledge, in definitive proxy or information statements incorporated by reference in Part III of this Form 10-K or any amendment to this Form 10-K.
Indicate by check mark whether the registrant is a large accelerated filer, an accelerated filer, a non-accelerated filer or a smaller reporting company. See definitions of “accelerated filer”, “large accelerated filer” and “smaller reporting company” in Rule 12b-2 of the Exchange Act.
Large accelerated filer Accelerated filer
Non-accelerated filer (Do not check if a smaller reporting company) Smaller reporting company
Indicate by check mark whether the registrant is a shell company (as defined in Rule 12b-2 of the Exchange Act). Yes No
The aggregate market value of the registrant’s voting and non-voting common equity held by non-affiliates of the registrant on March 30, 2012 (the last business day of the most recently completed second fiscal quarter) was approximately $765,333,392.
96,524,636 shares of the registrant’s Common Stock, par value $1 per share, were outstanding on November 7, 2012.
DOCUMENTS INCORPORATED BY REFERENCE
Certain information contained in the definitive Proxy Statement for the Annual Meeting of Shareowners of the registrant to be held on January 24, 2013 is incorporated by reference into Part III.
JOB TITLE Meritor 10-K REVISION 3 SERIAL DATE / TIME Friday, November 30, 2012 JOB NUMBER 243020 TYPE PAGE NO. v OPERATOR PM2
<12345678>

Page No.
PART I.
Item 1. Business . . . . . . . . . . . . . . . . . . . . . . . . . . . . . . . . . . . . . . . . . . . . . . . . . . . . . . . . . . . . . . 1
Item 1A. Risk Factors . . . . . . . . . . . . . . . . . . . . . . . . . . . . . . . . . . . . . . . . . . . . . . . . . . . . . . . . . . . . 13
Item 1B. Unresolved Staff Comments . . . . . . . . . . . . . . . . . . . . . . . . . . . . . . . . . . . . . . . . . . . . . . . . 22
Item 2. Properties . . . . . . . . . . . . . . . . . . . . . . . . . . . . . . . . . . . . . . . . . . . . . . . . . . . . . . . . . . . . . 22
Item 3. Legal Proceedings . . . . . . . . . . . . . . . . . . . . . . . . . . . . . . . . . . . . . . . . . . . . . . . . . . . . . . . 23
Item 4. Mine Safety Disclosures . . . . . . . . . . . . . . . . . . . . . . . . . . . . . . . . . . . . . . . . . . . . . . . . . . . 24
Item 4A. Executive Officers of the Registrant . . . . . . . . . . . . . . . . . . . . . . . . . . . . . . . . . . . . . . . . . . . 25
PART II.
Item 5. Market for Registrant’s Common Equity, Related Stockholder Matters and
Issuer Purchases of Equity Securities . . . . . . . . . . . . . . . . . . . . . . . . . . . . . . . . . . . . . . . 26
Item 6. Selected Financial Data . . . . . . . . . . . . . . . . . . . . . . . . . . . . . . . . . . . . . . . . . . . . . . . . . . . . 28
Item 7. Management’s Discussion and Analysis of Financial Conditions and Results
of Operations . . . . . . . . . . . . . . . . . . . . . . . . . . . . . . . . . . . . . . . . . . . . . . . . . . . . . . . . 29
Item 7A. Quantitative and Qualitative Disclosures About Market Risk . . . . . . . . . . . . . . . . . . . . . . . . . . 57
Item 8. Financial Statements and Supplementary Data . . . . . . . . . . . . . . . . . . . . . . . . . . . . . . . . . . . 59
Item 9. Changes in and Disagreements with Accountants on Accounting and
Financial Disclosure . . . . . . . . . . . . . . . . . . . . . . . . . . . . . . . . . . . . . . . . . . . . . . . . . . . 126
Item 9A. Controls and Procedures . . . . . . . . . . . . . . . . . . . . . . . . . . . . . . . . . . . . . . . . . . . . . . . . . . . 126
Item 9B. Other Information . . . . . . . . . . . . . . . . . . . . . . . . . . . . . . . . . . . . . . . . . . . . . . . . . . . . . . . . 127
PART III.
Item 10. Directors, Executive Officers and Corporate Governance . . . . . . . . . . . . . . . . . . . . . . . . . . . . 128
Item 11. Executive Compensation . . . . . . . . . . . . . . . . . . . . . . . . . . . . . . . . . . . . . . . . . . . . . . . . . . . 128
Item 12. Security Ownership of Certain Beneficial Owners and Management and
Related Stockholder Matters . . . . . . . . . . . . . . . . . . . . . . . . . . . . . . . . . . . . . . . . . . . . . 128
Item 13. Certain Relationships and Related Transactions, and Director Independence . . . . . . . . . . . . . 129
Item 14. Principal Accountant Fees and Services . . . . . . . . . . . . . . . . . . . . . . . . . . . . . . . . . . . . . . . . 129
PART IV.
Item 15. Exhibits and Financial Statement Schedules . . . . . . . . . . . . . . . . . . . . . . . . . . . . . . . . . . . . . 130
Signatures . . . . . . . . . . . . . . . . . . . . . . . . . . . . . . . . . . . . . . . . . . . . . . . . . . . . . . . . . . . . . 136
JOB TITLE Meritor 10-K REVISION 3 SERIAL DATE / TIME Friday, November 30, 2012 JOB NUMBER 243020 TYPE PAGE NO. vi OPERATOR PM2
<12345678>

1
PART I
Item 1. Business.
Overview
Meritor, Inc., (the “company” or “Meritor”), headquartered in Troy, Michigan, is a premier global supplier of a broad range of integrated systems and components to original equipment manufacturers (“OEMs”) and the aftermarket for the commercial vehicle, transportation and industrial sectors. The company serves commercial truck, trailer, off-highway, military, bus and coach and other industrial OEMs and certain aftermarkets. Our principal products are axles, undercarriages, drivelines, brakes and braking systems.
Meritor was incorporated in Indiana in 2000 in connection with the merger of Meritor Automotive, Inc. (“Meritor Automotive”) and Arvin Industries, Inc. (“Arvin”). On March 30, 2011, we announced that we officially changed the company name from ArvinMeritor, Inc. to Meritor, Inc. and on that date, began trading our common stock on the New York Stock Exchange under the ticker symbol MTOR. As used in this Annual Report on Form 10-K, the terms “company,” “Meritor,” “we,” “us” and “our” include Meritor, its consolidated subsidiaries and its predecessors unless the context indicates otherwise.
Meritor serves a broad range of customers worldwide, including medium- and heavy-duty truck OEMs, specialty vehicle manufacturers, certain aftermarkets, and trailer producers. Our total sales from continuing operations in fiscal year 2012 were approximately $4.4 billion. Our ten largest customers accounted for approximately 71 percent of fiscal year 2012 sales from continuing operations. Sales from operations outside the United States (U.S.) accounted for approximately 62 percent of total sales from continuing operations in fiscal year 2012. Our continuing operations also participated in 6 unconsolidated joint ventures, which we accounted for under the equity method of accounting and that generated revenues of approximately $1.8 billion in fiscal year 2012.
The company’s fiscal year ends on the Sunday nearest to September 30. Fiscal year 2012 ended on September 30, 2012, fiscal year 2011 ended on October 2, 2011, and fiscal year 2010 ended on October 3, 2010. All year and quarter references relate to our fiscal year and fiscal quarters unless otherwise stated. For ease of presentation, September 30 is utilized consistently throughout this report to represent the fiscal year end.
Whenever an item in this Annual Report on Form 10-K refers to information under specific captions in Item 7. Management’s Discussion and Analysis of Financial Condition and Results of Operations or Item 8. Financial Statements and Supplementary Data, the information is incorporated in that item by reference.
References in this Annual Report on Form 10-K to our belief that we are a leading supplier or the world’s leading supplier, and other similar statements as to our relative market position are based principally on calculations we have made. These calculations are based on information we have collected, including company and industry sales data obtained from internal and available external sources as well as our estimates. In addition to such quantitative data, our statements are based on other competitive factors such as our technological capabilities, our engineering, research and development efforts, and our innovative solutions as well as the quality of our products and services, in each case relative to that of our competitors in the markets we address.
Recent Developments
On November 12, 2012, we announced a revised management reporting structure resulting in two business segments to drive efficiencies. Our new business segments are Commercial Truck & Industrial; and Aftermarket & Trailer. The discussion of our business set forth in this Report on Form 10-K will be of such business as it existed in fiscal year 2012 prior to this announcement.
Divestiture Activity
On January 2, 2012, we completed the sale of our Commercial Truck manufacturing facility located in St. Priest, France to Renault Trucks SAS, an affiliate of AB Volvo. This transaction did not have a significant impact on our sales as production was absorbed by our remaining manufacturing facilities in Europe. During fiscal year 2012, we recognized non-cash charges of $19 million, including an asset impairment charge of $17 million for the disposal group, in connection with the sale. In addition, other restructuring charges of approximately $5 million associated with employee headcount reduction and plant rationalization costs were recorded during fiscal year 2012.
JOB TITLE Meritor 10-K REVISION 3 SERIAL DATE / TIME Friday, November 30, 2012 JOB NUMBER 243020 TYPE PAGE NO. 1 OPERATOR PM2
<12345678>

2
As a result of the divestiture of our light vehicle systems business (“LVS”) prior to 2012, our company is now able to focus solely on commercial vehicle and industrial markets. See Note 3 of the Notes to Consolidated Financial Statements under Item 8. Financial Statements and Supplementary Data below for further information with respect to divestiture activity in 2011 and 2010 and changes in continuing and discontinued operations.
Our Business
Our reporting segments are as follows:
• The Commercial Truck segment supplies drivetrain systems and components, including axles, drivelines and braking and suspension systems, primarily for medium- and heavy-duty trucks in North America, South America and Europe.
• The Industrial segment supplies drivetrain systems including axles, brakes, drivelines and suspensions for off-highway, military, construction, bus and coach, fire and emergency, and other industrial applications. This segment also includes all of our original equipment (OE) businesses in Asia Pacific, including all on- and off-highway activities.
• The Aftermarket & Trailer segment supplies axles, brakes, drivelines, suspension parts and other replacement and remanufactured parts, including transmissions, to commercial vehicle and industrial aftermarket customers. This segment also supplies a wide variety of undercarriage products and systems for trailer applications in North America.
See Note 23 of the Notes to Consolidated Financial Statements under Item 8. Financial Statements and Supplementary Data for financial information by segment for continuing operations for each of the three years ended September 30, 2012, including information on sales and assets by geographic area. The heading “Products” below includes information on certain product sales for each of the three fiscal years ended September 30, 2012.
Business Strategies
We are currently a global supplier of a broad range of integrated systems, modules and components to OEMs and the aftermarket for the commercial vehicle, transportation and industrial sectors, and we believe we have developed market positions as a leader in many of the markets we serve. The unprecedented challenges in the last few years in the credit markets, deterioration and then rapid upturn in the commercial vehicle market and a worldwide recession have forced us to sharpen our business and operating strategies to align to these new business conditions and to better position our company for the future. We are working to enhance our leadership positions and capitalize on our existing customer, product and geographic strengths.
We expect production volumes in North America and Europe to soften compared to the levels experienced in fiscal year 2012. Beginning in second quarter of fiscal year 2012, production volumes in South America declined significantly as the industry transitioned to tighter emission standard requirements for commercial vehicles. The recovery of production volumes has been slower than previously expected and we expect production volumes in South America to remain at such low levels during the first half of fiscal year 2013, with a modest improvement expected in the second half of fiscal year 2013. Production volumes in the Asia-Pacific region, more specifically China and India, have decreased compared to levels experienced in fiscal year 2011, and there is no certainty as to when these volumes will return to the levels previously experienced.
Sales for our primary military program were at their peak during the third quarter of fiscal year 2012. This program is expected to wind down over the next few years beginning in fiscal year 2013. We are working to secure our participation in new military programs with various OEMs. However, failure to secure new military contracts could have a longer-term negative impact on our Industrial Segment. In addition, even if sales of our military programs do return to historic levels, the levels of profitability on these sales could be lower than what we have recognized in recent periods.
Our business continues to address a number of other challenging industry-wide issues including the following:
• Uncertainty around the global market outlook;
• Volatility in price and availability of steel, components and other commodities;
• Disruptions in the financial markets and their impact on the availability and cost of credit;
• Higher energy and transportation costs;
• Impact of currency exchange rate volatility;
• Consolidation and globalization of OEMs and their suppliers; and
• Significant pension and retiree medical health care costs.
JOB TITLE Meritor 10-K REVISION 3 SERIAL DATE / TIME Friday, November 30, 2012 JOB NUMBER 243020 TYPE PAGE NO. 2 OPERATOR PM2
<12345678>

3
Other
Other significant factors that could affect our results and liquidity in fiscal year 2013:
• Significant contract awards or losses of existing contracts or failure to negotiate acceptable terms in contract renewal negotiations;
• Ability to manage possible adverse effects on our European operations, or financing arrangements related thereto, in the event one or more countries exit the European monetary union;
• Ability to work with our customers to manage rapidly changing production volumes;
• Ability to recover and timing of recovery of steel price and other cost increases from our customers;
• Any unplanned extended shutdowns or production interruptions by us, our customers or our suppliers (including those caused by financial distress of our customers and suppliers);
• A significant deterioration or slowdown in economic activity in the key markets in which we operate;
• Higher than planned price reductions to our customers;
• Potential price increases from our suppliers;
• Additional restructuring actions and the timing and recognition of restructuring charges;
• Higher than planned warranty expenses, including the outcome of known or potential recall campaigns;
• Our ability to implement planned productivity, cost reduction, and other margin improvement initiatives; and
• Restrictive government actions by foreign countries (such as restrictions on transfer of funds and trade protection measures, including export duties and quotas and customs duties and tariffs).
Our specific business strategies are influenced by these industry factors and trends as well as by the recent global economic and financial crisis and are focused on leveraging our resources to continue to develop and produce competitive product offerings. We believe the following strategies will allow us to maintain a balanced portfolio of commercial truck, industrial and aftermarket businesses covering key global markets. See Item 1A. Risk Factors below for information on certain risks that could have an impact on our business, financial condition or results of operations in the future.
Financial and Operational Excellence
Strive to Manage the Cycle. The industries in which we operate have been characterized historically by periodic fluctuations in overall demand for medium- and heavy-duty trucks, and other vehicles for which we supply products, resulting in corresponding fluctuations in demand for our products. The length and timing of the cyclical nature of the commercial vehicle industry cannot be predicted with certainty. To effectively manage the cyclical nature of our business, we are focused on cost management and maintaining sufficient balance sheet flexibility. In addition, we expect to balance the on-highway commercial vehicle cycles with complementary business lines, including aftermarket, military, construction and industrial supply. We also attempt to utilize flexible manufacturing processes and plant footprints in our effort to take advantage of industry upturns and effectively manage industry downturns.
Drive a Continuous Improvement Culture. The company implemented Performance Plus, a long-term profit improvement and cost reduction initiative, in fiscal year 2007 to improve operational performance and increase cash flow, earnings and shareowner value. The actions and programs that are part of the Performance Plus initiatives include delivering cost improvements by focusing on operational excellence (materials; manufacturing; and overhead) and enhancing revenue by focusing on commercial excellence (engineering, research and development; product strategy and growth; and aftermarket).
In fiscal year 2007, as part of Performance Plus, we implemented the Meritor Production System, a lean manufacturing initiative that guides our pursuit of operational excellence. Meritor Production System integrates several of our previous performance improvement initiatives into a set of actions that focus on improving systems, processes, behaviors and capabilities. Throughout our company, continuous improvement teams work to achieve significant cost savings, increase productivity and efficiency, improve design and quality, streamline operations and improve workplace safety. Maintaining a continuous improvement culture is important to our business operations and to maintaining and improving our operating results.
JOB TITLE Meritor 10-K REVISION 3 SERIAL DATE / TIME Friday, November 30, 2012 JOB NUMBER 243020 TYPE PAGE NO. 3 OPERATOR PM2
<12345678>

4
Profitable Growth
Focus on Organic Growth While Reviewing Strategic Opportunities. Our long term goal is to grow businesses that offer attractive returns and are core to our operations as well as to diversify through complementary product lines, geographic expansion, and initiatives in adjacent markets. We have identified the areas of our business that we believe have the most potential for leveraging into other industries, products, markets and technologies, and we are focusing our resources on these areas. We also continue to review and evaluate on an ongoing basis all of our existing businesses to determine whether we need to modify, restructure, sell or otherwise discontinue any one of the businesses.
We believe that commercial vehicle and industrial suppliers continue to consolidate into larger, more efficient and more capable companies and collaborate with each other in an effort to better serve the global needs of OEM customers by being where these customers need them. We regularly evaluate various strategic and business development opportunities, including licensing agreements, marketing arrangements, joint ventures, acquisitions and dispositions. We remain committed to selectively pursuing alliances and acquisitions that would allow us to leverage our capabilities, gain access to new customers and technologies, expand our global presence, enter complementary product market segments and implement our business strategies.
Strengthen our Presence in Emerging Global Markets. Geographic expansion to meet the global sourcing needs of customers and to enter new markets is an important element of our growth strategy. We currently have wholly-owned operations and regional joint ventures in South America. We also have joint ventures and wholly-owned subsidiaries in China, India and Turkey and participate in programs to support customers as they establish and expand operations in those markets.
We plan to continue to grow and expand globally, with a keen focus on South America and Asia-Pacific (primarily China and India) because we believe these regions offer the greatest profit potential. Sales in these regions represented approximately 23 percent, 30 percent and 29 percent of total sales from continuing operations in fiscal years 2012, 2011 and 2010, respectively.
Product and Technology Focus
Deliver High Quality Products for All Markets we Serve. We believe the quality of our core product lines and our ability to service our products through our aftermarket capabilities give us a competitive advantage. A key part of delivering high quality products is delivering service through the entire life cycle of the product. We continue to invest in new product development as we seek to keep our core product lines continually refreshed and in step with evolving market requirements and continue to grow our complimentary product lines. Building upon the strength of these core technologies, we intend to expand our presence globally, and continue our growth in complementary product lines, such as military vehicle and off-highway markets. Our strategy involves diversifying on a geographic and product line basis through the aftermarket, off- and on-highway and added adjacencies that we will explore. Through implementation of our technology roadmap, complementary technologies such as electronics, controls and mechatronics are expected to be applied to traditional product lines to provide enhanced performance and expanded vehicle content.
Leverage Our Technology to Address Mobility, Safety and Environmental Provisions. In our opinion, another industry trend is the increasing amount of equipment required for changes in environmental and safety-related regulatory provisions. OEMs select suppliers based not only on the cost and quality of their products, but also on their ability to meet stringent environmental and safety requirements and to service and support the customer after the sale. We use our technological and market expertise to anticipate trends and to develop and engineer products that aim to address mobility, safety and environmental concerns.
To address safety, we have implemented a strategy of focusing on products and technologies that enhance overall vehicle braking performance. As part of this strategy, we are focusing on the integration of braking and stability products and suspension products as well as the development of electronic control capabilities. Through MeritorWabco, our joint venture with WABCO Holdings, Inc. (“WABCO”), we offer electronic braking systems that integrate anti-lock braking systems technology, automatic traction control, collision avoidance systems and other key vehicle control system components to improve braking performance and meet all required stopping distances for commercial vehicles.
Nurture Emerging Next-Generation Products. We continue to invest in advanced technologies and expanded product portfolios that address customer needs by improving fuel efficiency, optimizing products for specific vehicle applications, and enhancing driver/vehicle safety. Examples of these products being developed include:
• SMARTandemsingledriveaxlesolution: Using technologies developed in house to enhance the traction and fuel economy of a conventional 6x2 axle configuration, we developed a system which achieves up to a five-percent fuel economy benefit for line haul operators over a 6x4, improved traction over a conventional 6x2, while still providing the weight savings of a 6x2 over a 6x4 configuration. This product serves as platform for additional technologies as well, such as LogixDrive and tire inflation.
JOB TITLE Meritor 10-K REVISION 3 SERIAL DATE / TIME Friday, November 30, 2012 JOB NUMBER 243020 TYPE PAGE NO. 4 OPERATOR PM2
<12345678>

5
• Meritor(R)LogixDrive(TM): This axle system is enabled by electronic controls that continuously monitor oil temperature, vehicle speed, braking and torque conditions in order to manage and optimize the amount of lubrication in the axle. The LogixDrive system addresses the two main areas of power loss in axles: gear and bearing friction and oil churning due to gear rotation.
• MeritorTireInflationSystems: Meritor is utilizing a variant of its pneumatic control unit developed for SMARTandem to provide tire inflation capability to maintain tire pressures in on-highway applications. Properly maintained tire pressures not only provide fuel economy benefits, but also improve safety.
• NextGenerationAirDiskBrake: Building on the successful platform of our current Elsa disk brake, we are developing the next generation of brake targeted at more accurate performance characteristics, longer life, and increased efficiency. Simplification of internal mechanisms and a more robust manufacturing process will also drive increases in reliability and life.
• New,morepowerfulfrontandrearbrakes: We released more powerful front and rear brakes to deliver the new stopping distances mandated by the U.S. government’s FMVSS 121, which took effect in August 2011. The next phase of the legislation is targeted for August 2013 applies to more severe applications. Development of the new brakes are focused on daily driving characteristics as well as the more demanding performance required in an emergency stopping scenario.
• Fueleconomymodeling: Working with Oakridge National Labs, Meritor is developing models to predict and ultimately develop technologies aimed at providing significant improvements in drivetrain fuel economy.
• LightCommercialVehicledriveaxleforIndiamarket: Launching in 2013 will be a new light commercial vehicle single-drive axle targeted at the 5-7 GVW weight class range. Leveraging proven technology from Meritor’s medium and heavy duty axle range, this expands Meritor’s portfolio for the India market.
Products
Meritor designs, develops, manufactures, markets, distributes, sells, services and supports a broad range of products for use in the transportation and industrial sectors. In addition to sales of original equipment systems and components, we provide our original equipment, aftermarket and remanufactured products to vehicle OEMs, their dealers (who in turn sell to motor carriers and commercial vehicle users of all sizes), independent distributors, and other end-users in certain aftermarkets.
The following chart sets forth, for each of the three fiscal years with the most recent ended September 30, 2012, information about product sales comprising more than 10% of consolidated revenue in any of those years. A narrative description of our principal products follows the chart.
Product Sales:
Fiscal Year EndedSeptember 30,
2012 2011 2010
Axles, Undercarriage and Drivelines . . . . . . . . . . . . . . . . . . . . . . . . . . . . . . . . . 75% 78% 73%Brakes and Braking Systems . . . . . . . . . . . . . . . . . . . . . . . . . . . . . . . . . . . . . . 23% 21% 24%Other . . . . . . . . . . . . . . . . . . . . . . . . . . . . . . . . . . . . . . . . . . . . . . . . . . . . . . . 2% 1% 3%
Total: . . . . . . . . . . . . . . . . . . . . . . . . . . . . . . . . . . . . . . . . . . . . . . . . . . . . . 100% 100% 100%
The three segments included in our continuing operations manufacture and supply the products set forth and described below.
Axles, Undercarriage & Drivelines
We believe we are one of the world’s leading independent suppliers of axles for medium- and heavy-duty commercial vehicles, with the leading market position in axle manufacturing in North America, South America and Europe, and are one of the major axle manufacturers in the Asia-Pacific region. Our extensive truck axle product line includes a wide range of front steer axles and rear drive axles. Our front steer and rear drive axles can be equipped with our cam, wedge or air disc brakes, automatic slack adjusters, complete wheel-end equipment such as hubs, rotors and drums, and (through our WABCO joint venture) anti-lock braking systems (“ABS”) and vehicle stability control systems.
JOB TITLE Meritor 10-K REVISION 3 SERIAL DATE / TIME Friday, November 30, 2012 JOB NUMBER 243020 TYPE PAGE NO. 5 OPERATOR PM2
<12345678>

6
We supply heavy-duty axles in certain global regions, for use in numerous off-highway vehicle applications, including construction, material handling, and mining. We also supply axles for use primarily in medium- and heavy-duty military tactical wheeled vehicles, principally in North America. These products are designed to tolerate high tonnage and operate under extreme geographical and climate conditions. In addition, we have other off-highway vehicle products that are currently in development for certain other regions. We also supply axles for use in buses, coaches and recreational vehicles, fire trucks and other specialty vehicles in North America, Asia Pacific and Europe, and believe we are the leading supplier of bus and coach axles in North America.
We are one of the major manufacturers of heavy-duty trailer axles in North America. Our trailer axles are available in more than 40 models in capacities from 20,000 to 30,000 pounds for virtually all heavy trailer applications and are available with our broad range of suspension modules, brake products, including drum brakes, disc brakes, anti-lock and trailer stability control systems, and ABS (through our WABCO joint venture).
We supply universal joints and driveline components, including our Permalube™ universal joint and RPL Permalube™ driveline, which are low maintenance, permanently lubricated designs used often in the high mileage on-highway market. We supply drivelines in a variety of global regions, for use in numerous on-highway vehicle applications, including construction, material handling and mining. We supply transfer cases and drivelines for use in medium- and heavy-duty military tactical wheeled vehicles, principally in North America. We also supply transfer cases for use in specialty vehicles in North America. Anti-lock brakes and stability control systems (which we supply through our WABCO joint venture) are also used in military vehicles and specialty vehicles. In addition, we supply trailer air suspension systems and products with an increasing market presence in North America. We also supply advanced suspension modules for use in light-, medium- and heavy-duty military tactical wheeled vehicles, principally in North America.
Through a joint venture, we develop, manufacture and sell truck suspensions, trailer axles and suspensions and related wheel-end products in the South American market. We believe this joint venture has a number one product position in suspension and trailer axles in the South American market.
Brakes and Braking Systems
We believe we are one of the leading independent suppliers of air brakes to medium- and heavy-duty commercial vehicle manufacturers in North America and Europe. In Brazil, one of the largest truck and trailer markets in the world, we believe that Master Sistemas Automotivos Limitada, our 49%-owned joint venture with Randon S. A. Vehiculos e Implementos, is a leading supplier of brakes and brake-related products.
Through manufacturing facilities located in North America, Asia Pacific and Europe, we manufacture a broad range of foundation air brakes, as well as automatic slack adjusters for brake systems. Our foundation air brake products include cam drum brakes, which offer improved lining life and tractor/trailer interchangeability; wedge drum brakes, which are lightweight and provide automatic internal wear adjustment; air disc brakes, which provide enhanced stopping distance and improved fade resistance for demanding applications; and wheel-end components such as hubs, drums and rotors.
Our brakes and brake system components also are used in medium- and heavy-duty military tactical wheeled vehicles, principally in North America. We also supply brakes for use in buses, coaches and recreational vehicles, fire trucks and other specialty vehicles in North America and Europe, and we believe we are the leading supplier of bus and coach brakes in North America, and also supply brakes for commercial vehicles, buses and coaches in Asia Pacific.
U.S. Federal regulations require that new medium- and heavy-duty vehicles sold in the United States be equipped with ABS. We believe that, Meritor WABCO Vehicle Control Systems, our 50%-owned joint venture with WABCO, is a leading supplier of ABS and a supplier of other electronic and pneumatic control systems (such as stability control and collision avoidance systems) for North American heavy-duty commercial vehicles. The joint venture also supplies hydraulic ABS to the North American medium-duty truck market and produces stability control and collision mitigation systems for tractors and trailers, which are designed to help maintain vehicle stability and aid in reducing tractor-trailer rollovers and other incidents.
Other Products
In addition to the products discussed above, we sell other complimentary products, including third party and private label items, through our aftermarket distribution channels. These products are generally sold under master distribution or similar agreements with outside vendors and include brake shoes and friction materials; automatic slack adjusters; yokes and shafts; wheel-end hubs and drums; ABS and stability control systems; shock absorbers and air springs; air brakes, air systems, air dryers and compressors.
JOB TITLE Meritor 10-K REVISION 3 SERIAL DATE / TIME Friday, November 30, 2012 JOB NUMBER 243020 TYPE PAGE NO. 6 OPERATOR PM2
<12345678>

7
Customers; Sales and Marketing
Meritor has numerous customers worldwide and has developed long-standing business relationships with many of these customers. Our ten largest customers accounted for approximately 71 percent of our total sales from continuing operations in fiscal year 2012. Sales to AB Volvo, Daimler AG and Navistar International Corporation represented approximately 22 percent, 15 percent and 11 percent, respectively, of our sales in fiscal year 2012. No other customer accounted for 10% or more of our total sales in fiscal year 2012.
OEMs
In North America, we design, engineer, market and sell products principally to OEMs, dealers and distributors. While our North American sales are typically direct to the OEMs, our ultimate commercial truck customers include trucking and transportation fleets. Fleet customers may specify our components and integrated systems for installation in the vehicles they purchase from OEMs. We employ what we refer to as a “push-pull” marketing strategy. We “push” for being the standard product at the OEM. At the same time, our district field managers then call on fleets and OEM dealers to “pull-through” our components on specific truck purchases. For all other markets, we specifically design, engineer, market and sell products principally to OEMs for their market specific needs or product specifications.
For certain large OEM customers, our supply arrangements are generally negotiated on a long-term contract basis for a multi-year period that may require us to provide annual cost reductions (through price reductions or other cost benefits for the OEMs). If we are unable to generate sufficient cost savings in the future to offset such price reductions, our gross margins will be adversely affected. Sales to other OEMs are typically made through open order releases or purchase orders at market based prices which do not require the purchase of a minimum number of products. The customer typically has the right to cancel or delay these orders on reasonable notice. We generally compete for new business from OEMs as long term contracts expire.
We have established leading positions in many of the markets we serve as a global supplier of a broad range of drivetrain systems, brakes and components. Based on available industry data and internal company estimates, our market leading positions include independent truck drive axles (i.e. those manufactured by an independent, non-captive supplier) in North America, Europe, South America and India, truck drivelines in North America, truck air brakes in North America, South America (through a joint venture), Asia Pacific and Europe and military wheeled vehicle drivetrain, suspension and brakes in North America.
Our global customer portfolio includes companies such as AB Volvo, Daimler AG, Navistar International Corporation, Oshkosh, MAN, BAE Systems, Iveco, PACCAR, Inc, Ashok Leyland, and Ford.
Aftermarket
We market and sell truck, trailer, off-highway and other products principally to, and service such products principally for, OEMs, their parts marketing operations, their dealers and other independent distributors and service garages within the aftermarket industry. Our product sales are generated through long-term agreements with certain of our OEM customers, distribution agreements and sales to independent dealers and distributors. Sales to other OEMs are typically made through open order releases or purchase orders at market based prices which do not require the purchase of a minimum number of products. The customer typically has the right to cancel or delay these orders on reasonable notice.
Our product offerings allow us to service all stages of our customers’ vehicle ownership lifecycle. In North America, we stock and distribute hundreds of parts from top national brands to our customers or what we refer to as our “all makes” strategy. Also, as part of our growth strategy, we employ what we believe to be world class remanufacturing processes that allow us to offer highly engineered genuine remanufactured components to our customers in North America and Europe. Our district field managers call on our OEM and independent customers to market our full product line capabilities on a regular basis to seek to ensure that we satisfy our customers’ needs. Our aftermarket business sells products under the following brand names: Meritor; Meritor Wabco; Euclid; Trucktechnic; and Mascot Truck Parts.
Based on available industry data and internal company estimates, our North America aftermarket business has the overall market leadership position for the portfolio of products that we offer.
JOB TITLE Meritor 10-K REVISION 3 SERIAL DATE / TIME Friday, November 30, 2012 JOB NUMBER 243020 TYPE PAGE NO. 7 OPERATOR PM2
<12345678>

8
Competition
We compete worldwide with a number of North American and international providers of components and systems, some of which are owned by or associated with some of our customers. The principal competitive factors are price, quality, service, product performance, design and engineering capabilities, new product innovation and timely delivery. In addition, certain OEMs manufacture their own components that compete with the types of products we supply.
Our major competitors for axles are Dana Holding Corp. and, in certain markets, OEMs that manufacture axles for use in their own products. Emerging competitors for axles include Daimler Truck North America’s Detroit Axle, American Axle Corporation and in China, Hande and Ankai, to name a few. Our major competitors for brakes are WABCO, Brembo, Bendix/Knorr Bremse and, in certain markets, OEMs that manufacture brakes for use in their own products. Our major competitors for industrial applications are ZF, MAN, AxleTech International, Oshkosh, Marmon-Herrington, Dana Holding Corp., Knorr, Kessler & Co., Carraro, NAF, Sisu and, in certain markets, OEMs that manufacture industrial products for use in their own vehicles. Our major competitors for trailer applications are Hendrickson, BPW and SAF-Holland.
Item 1A. Risk Factors for information on certain risks associated with our competitive environment.
Raw Materials and Suppliers
Our purchases of raw materials and parts are concentrated over a limited number of suppliers, some of which have been adversely affected by weakening global economic conditions. We are dependent upon our suppliers’ ability to meet cost performance, quality specifications and delivery schedules. The inability of a supplier to meet these requirements, the loss of a significant supplier, or any other work stoppages, could have an adverse effect on our ability to meet our customers’ delivery requirements.
The cost of our core products is susceptible to changes in overall steel commodity prices, including ingredients used for various grades of steel. We have generally structured our major steel supplier and customer contracts to absorb and pass on normal index-related market fluctuations in steel prices. While we have had steel pricing adjustment programs in place with most major OE manufacturers, the price adjustment programs tend to lag the movement in steel costs and have generally not contemplated non-index related increases. We have instituted actions to increase the alignment with our supplier and customer agreements in order to further mitigate the impact of steel costs on our profitability.
Significant future volatility in the commodity markets or a continued deterioration in the demand may require us to pursue customer increases through surcharges or other pricing arrangements. In addition, if suppliers are inadequate for our needs, or if prices remain at current levels or increase and we are unable to either pass these prices to our customer base or otherwise mitigate the costs, our operating results could be further adversely affected.
We continuously work to address these competitive challenges by reducing costs and, as needed, restructuring operations. We manage supplier risk by conducting periodic assessments for all major suppliers and more frequent rigorous assessments of high-risk suppliers. On an ongoing basis, we monitor third party financial statements, conduct surveys through supplier questionnaires, and conduct site visits. We have developed a chronic supplier improvement process where we identify and develop actions to address ongoing financial, quality and delivery issues to further mitigate potential risk. We are proactive in managing our supplier relationships to avoid supply disruption. Our process employs dual sourcing and resourcing trigger points that cause us to take aggressive actions and then monitor the progress closely.
Divestitures and Restructuring
As described above, our business strategies are focused on enhancing our market position by continuously evaluating the competitive differentiation of our product portfolio, focusing on our strengths and core competencies, and growing the businesses that offer the most attractive returns. Implementing these strategies involves various types of strategic initiatives.
Divestitures
As part of our strategy to refocus our business and dedicate our resources to our core capabilities, we regularly review the prospects of our existing businesses to determine whether any of them should be modified, restructured, sold or otherwise discontinued. In an effort to execute our long-term strategy to transform our company away from the light vehicle business to focus on the commercial vehicle and industrial business, we completed the following initiatives since the beginning of fiscal year 2010 (see Note 3 of the Notes to Consolidated Financial Statements under Item 8. Financial Statements and Supplementary Data below):
• In fiscal year 2010, we completed the sale of our 57 percent interest in Meritor Suspension Systems Company (“MSSC”) to the joint venture partner, a subsidiary of Mitsubishi Steel Mfg. Co., LTD.
JOB TITLE Meritor 10-K REVISION 3 SERIAL DATE / TIME Friday, November 30, 2012 JOB NUMBER 243020 TYPE PAGE NO. 8 OPERATOR PM2
<12345678>

9
• In fiscal year 2010, we completed the sale of our module assembly operations in Belvidere, Illinois.
• In fiscal year 2011, we completed the sale of our Body Systems business to Inteva Products Holding Coöperatieve U.A., an assignee of 81 Acquisition LLC and an affiliate of Inteva Products, LLC.
• In fiscal year 2011, we completed the sale of Gabriel Europe (Bonneval) facility to TRW Automotive Holdings France.
• In fiscal year 2011, we closed our EU Trailer operations in Cwmbran, U.K. and related warehouses in Spain and Italy.
Restructuring Programs
Performance Plus: We implemented Performance Plus, a long-term profit improvement and cost reduction initiative, in fiscal year 2007. As part of this program, we identified significant restructuring actions intended to improve our global footprint and cost competitiveness by eliminating up to 2,800 positions in North America and Europe and consolidating and combining certain global facilities, with costs to be incurred over several years. Cumulative restructuring costs recorded for this program as of September 30, 2012 are $186 million, including $93 million reported in discontinued operations in the consolidated statement of income. These costs primarily relate to employee severance and related costs of $117 million, asset impairment charges of $41 million and $28 million primarily associated with pension termination benefits. The company’s Commercial Truck segment recognized cumulative restructuring costs associated with Performance Plus of $82 million. Cumulative restructuring costs of $11 million were recognized by corporate locations and the company’s Aftermarket & Trailer segment. All restructuring actions associated with Performance Plus were complete as of September 30, 2012.
See Note 5 of the Notes to Consolidated Financial Statements under Item 8. Financial Statements and Supplementary Data below for further information on our restructuring actions.
Restructuring costs – continuing operations
Performance Plus: In our continuing operations, we recorded restructuring costs of $24 million, $16 million and $5 million in fiscal years 2012, 2011 and 2010, respectively, related to Performance Plus. Total cumulative costs recorded in continuing operations for Performance Plus programs are $93 million. These costs primarily include $42 million for estimated employee severance benefits, $19 million, primarily associated with pension termination benefits, and $32 million of asset impairment charges associated with certain facility closures.
The company’s continuing operations recognized restructuring costs in its Commercial Truck segment of $24 million during fiscal year 2012. These costs include $19 million of non-cash charges, including an impairment charge of $17 million for assets held for sale at December 31, 2011. In addition, other restructuring charges of approximately $5 million associated with the employee headcount reduction and plant rationalization costs were recognized in fiscal year 2012 in connection with the sale of St. Priest facility.
Fiscal Year 2012 European Action: During the second quarter of fiscal year 2012, the company approved a European headcount reduction plan in response to the ongoing economic weakness and uncertainty in that region. In fiscal year 2012, the company recognized approximately $7 million of restructuring costs associated with this plan in its Commercial Truck Segment.
Other: The company is executing a variable labor headcount reduction program intended to reduce labor and other costs in response to market conditions in certain regions and recognized approximately $5 million of costs in its Commercial Truck segment associated with this program. The remaining restructuring costs incurred during the fiscal year 2012 were associated with the company’s previously announced executive headcount reduction.
Restructuring costs – discontinued operations
Performance Plus: We recorded restructuring costs in discontinued operations of $1 million in fiscal year 2011 and $3 million in fiscal year 2010 related to Performance Plus. Total cumulative costs recorded in discontinued operations for Performance Plus programs are $93 million. These costs primarily include $75 million for estimated employee severance benefits and $9 million of asset impairment charges associated with certain facility closures and $9 million for facility shutdown and other related costs, primarily pension termination benefits.
JOB TITLE Meritor 10-K REVISION 3 SERIAL DATE / TIME Friday, November 30, 2012 JOB NUMBER 243020 TYPE PAGE NO. 9 OPERATOR PM2
<12345678>

10
European Trailer: In the second quarter of fiscal year 2011, we announced the planned closure of our EU Trailer business and recognized approximately $8 million of restructuring costs during fiscal year 2011 and $1 million during fiscal year 2012 primarily associated with employee severance costs. At September 30, 2012, all restructuring activities related to this closure were complete.
Restructuring costs associated with discontinued operations are included in income (loss) from discontinued operations in the accompanying Consolidated Statement of Income in Item 8. Financial Statements and Supplementary Data.
See Item 1A. Risk Factors for information on certain risks associated with strategic initiatives.
Joint Ventures
As the industries in which we operate have become more globalized, joint ventures and other cooperative arrangements have become an important element of our business strategies. These strategic alliances provide for sales, product design, development and manufacturing in certain product and geographic areas. As of September 30, 2012, our continuing operations participated in the following non-consolidated joint ventures:
Key Products Country
Meritor WABCO Vehicle Control Systems . . . . . . . . . . . . . . . . . . . . . . . . . . Antilock braking and air systems U.S.Master Sistemas Automotivos Limitada . . . . . . . . . . . . . . . . . . . . . . . . . . . Braking systems BrazilSuspensys Sistemas Automotivos Ltda. . . . . . . . . . . . . . . . . . . . . . . . . . . . Suspensions, axles, hubs and drums BrazilSistemas Automotrices de Mexico S.A. de C.V.. . . . . . . . . . . . . . . . . . . . . . Axles, drivelines and brakes MexicoEge Fren Sanayii ve Ticaret A.S. . . . . . . . . . . . . . . . . . . . . . . . . . . . . . . . . Braking systems TurkeyAutomotive Axles Limited . . . . . . . . . . . . . . . . . . . . . . . . . . . . . . . . . . . . . Rear drive axle assemblies India
Aggregate sales of our non-consolidated joint ventures were $1,787 million, $1,977 million, and $1,474 million in fiscal years 2012, 2011 and 2010, respectively.
In accordance with accounting principles generally accepted in the United States, our consolidated financial statements include the financial position and operating results of those joint ventures in which we have control. For additional information of our unconsolidated joint ventures and percentage ownership thereof see Note 12 of the Notes to Consolidated Financial Statements under Item 8. Financial Statements and Supplementary Data below.
Research and Development
We have significant research, development, engineering and product design capabilities. We spent $73 million in fiscal years 2012 and 2011, and $66 million in fiscal year 2010 on company-sponsored research, development and engineering. We employ professional engineers and scientists globally, and have additional engineering capabilities through contract arrangements in low-cost countries. We also have advanced technical centers in North America, Europe and Asia Pacific (primarily in India and China). We recently expanded our technical center in Bangalore, India.
Patents and Trademarks
We own or license many United States and foreign patents and patent applications in our engineering and manufacturing operations and other activities. While in the aggregate these patents and licenses are considered important to the operation of our businesses, management does not consider them of such importance that the loss or termination of any one of them would materially affect a business segment or Meritor as a whole.
Our registered trademarks for Meritor® and the Bull design are important to our business. Other significant trademarks owned by us include Euclid®, Mascot™ and TRUCKTECHNIC® for aftermarket products.
JOB TITLE Meritor 10-K REVISION 3 SERIAL DATE / TIME Friday, November 30, 2012 JOB NUMBER 243020 TYPE PAGE NO. 10 OPERATOR PM2
<12345678>

11
Substantially all of our U.S. held intellectual property rights are subject to a first priority perfected security interest securing our obligations to the lenders under our credit facility. See Note 15 of the Notes to Consolidated Financial Statements under Item 8. Financial Statements and Supplementary Data below.
Employees
At September 30, 2012, we had approximately 9,300 full-time employees. At that date, 261 employees in the United States and Canada were covered by collective bargaining agreements and most of our facilities outside of the United States and Canada were unionized. We believe our relationship with unionized employees is satisfactory.
Environmental Matters
Federal, state and local requirements relating to the discharge of substances into the environment, the disposal of hazardous wastes and other activities affecting the environment have, and will continue to have, an impact on our operations. We record liabilities for environmental issues in the accounting period in which they are considered to be probable and the cost can be reasonably estimated. At environmental sites in which more than one potentially responsible party has been identified, we record a liability for our allocable share of costs related to our involvement with the site, as well as an allocable share of costs related to insolvent parties or unidentified shares. At environmental sites in which we are the only potentially responsible party, we record a liability for the total estimated costs of remediation before consideration of recovery from insurers or other third parties.
We have been designated as a potentially responsible party at nine Superfund sites, excluding sites as to which our records disclose no involvement or as to which our liability has been finally determined. In addition to Superfund sites, various other lawsuits, claims and proceedings have been asserted against us, alleging violations of federal, state and local environmental protection requirements or seeking remediation of alleged environmental impairments, principally at previously disposed-of properties. We have established reserves for these liabilities when they are considered to be probable and reasonably estimable. See Note 22 of the Notes to Consolidated Financial Statements under Item 8. Financial Statements and Supplementary Data below for information as to our estimates of the total reasonably possible costs we could incur and the amounts recorded as a liability as of September 30, 2012, and as to changes in environmental accruals during fiscal year 2012.
The process of estimating environmental liabilities is complex and dependent on physical and scientific data at the site, uncertainties as to remedies and technologies to be used, and the outcome of discussions with regulatory agencies. The actual amount of costs or damages for which we may be held responsible could materially exceed our current estimates because of uncertainties, including the financial condition of other potentially responsible parties, the success of the remediation and other factors that make it difficult to predict actual costs accurately. However, based on management’s assessment, after consulting with Vernon G. Baker, II, Esq., Meritor’s General Counsel, and with outside advisors who specialize in environmental matters, and subject to the difficulties inherent in estimating these future costs, we believe that our expenditures for environmental capital investment and remediation necessary to comply with present regulations governing environmental protection and other expenditures for the resolution of environmental claims will not have a material adverse effect on our business, financial condition or results of operations. In addition, in future periods, new laws and regulations, changes in remediation plans, advances in technology and additional information about the ultimate clean-up remedy could significantly change our estimates. Management cannot assess the possible effect of compliance with future requirements.
International Operations
We believe our international operations provide us with geographical diversity and help us to weather the cyclical nature of our business. Approximately 56 percent of our total assets as of September 30, 2012 and 62 percent of fiscal year 2012 sales from continuing operations were outside the U.S. See Note 23 of the Notes to Consolidated Financial Statements under Item 8. Financial Statements and Supplementary Data below for financial information by geographic area for the three fiscal years ended September 30, 2012.
Our international operations are subject to a number of risks inherent in operating abroad (see Item 1A. Risk Factors below). There can be no assurance that these risks will not have a material adverse impact on our ability to increase or maintain our foreign sales or on our financial condition or results of operations.
JOB TITLE Meritor 10-K REVISION 3 SERIAL DATE / TIME Friday, November 30, 2012 JOB NUMBER 243020 TYPE PAGE NO. 11 OPERATOR PM2
<12345678>

12
Our operations are also exposed to global market risks, including foreign currency exchange rate risk related to our transactions denominated in currencies other than the U.S. dollar. We have a foreign currency cash flow hedging program in place to help reduce the company’s exposure to changes in exchange rates. We use foreign currency forward contracts to manage the company’s exposures arising from foreign currency exchange risk. Gains and losses on the underlying foreign currency exposures are partially offset with gains and losses on the foreign currency forward contracts. The contracts generally mature within twelve months. It is our policy not to enter into derivative financial instruments for speculative purposes and, therefore, we hold no derivative instruments for trading purposes. See Item 7A. Quantitative and Qualitative Disclosures About Market Risk and Note 16 of the Notes to Consolidated Financial Statements under Item 8. Financial Statements and Supplementary Data below.
Seasonality; Cyclicality
We may experience seasonal variations in the demand for our products, to the extent OEM vehicle production fluctuates. Historically, for all of our operations, demand has been somewhat lower in the quarters ended September 30 and December 31, when OEM plants may close during summer shutdowns and holiday periods or when there are fewer selling days during the quarter. In addition, our aftermarket business and our operations in China generally experience higher than usual demand in the quarters ending March 31 and June 30.
In addition, the industries in which we operate have been characterized historically by periodic fluctuations in overall demand for trucks, trailers and other specialty vehicles for which we supply products, resulting in corresponding fluctuations in demand for our products. Production and sales of the vehicles for which we supply products generally depend on economic conditions and a variety of other factors that are outside of our control, including freight tonnage, customer spending and preferences, vehicle age, labor relations and regulatory requirements. See Item 1A. Risk Factors below. Cycles in the major vehicle industry markets of North America and Europe are not necessarily concurrent or related. It is part of our strategy to continue to seek to expand our operations globally to help mitigate the effect of periodic fluctuations in demand of the vehicle industry in one or more particular countries.
Fiscal year 2009 was extremely difficult for us and the industries in which we participate, with sharp declines in production and sales volumes in substantially all regions, which started in November 2008. In fiscal year 2010 we saw varying levels of improvement from fiscal year 2009 low points, as shown in the below table. In fiscal year 2011, the pace of the recovery of commercial truck volumes in North America and Europe, our largest markets, was more rapid than previously anticipated. In fiscal year 2012, production volumes in North America continued to strengthen through the first nine months. However, we saw significant volume declines in the second half of the year in most of our international markets. We expect production volumes in North America and Europe to soften compared to the levels experienced in fiscal year 2012. Beginning in second quarter of fiscal year 2012, production volumes in South America declined significantly as the industry transitioned to tighter emission standard requirements for commercial vehicles. The recovery of production volumes has been slower than previously expected and we expect production volumes in South America to remain at such low levels during the first half of fiscal year 2013, with a modest improvement expected in the second half of fiscal year 2013. Production volumes in the Asia-Pacific region, more specifically China and India, have decreased compared to levels experienced in fiscal year 2011, and there is no certainty as to when these volumes will return to the levels previously experienced.
The following table sets forth estimated truck production in principal markets we serve for the last five fiscal years based on available industry sources and management’s estimates:
Year Ended September 30,
2012 2011 2010 2009 2008
Estimated Commercial Truck production (in thousands): North America, Heavy-Duty Trucks . . . . . . . . . . . . . . . . . . . . . . . . . . . . . . . . . . . 296 224 147 129 194North America, Medium-Duty Trucks. . . . . . . . . . . . . . . . . . . . . . . . . . . . . . . . . . 182 159 114 101 171Europe, Heavy- and Medium-Duty Trucks . . . . . . . . . . . . . . . . . . . . . . . . . . . . . . 389 405 265 252 562South America, Heavy- and Medium- Duty Trucks . . . . . . . . . . . . . . . . . . . . . . . . 168 204 174 118 161
Available Information
We make available free of charge through our web site (www.Meritor.com) our Annual Report on Form 10-K, Quarterly Reports on Form 10-Q, Current Reports on Form 8-K, all amendments to those reports, and other filings we make with the Securities and Exchange Commission (“SEC”), as soon as reasonably practicable after they are filed.
JOB TITLE Meritor 10-K REVISION 3 SERIAL DATE / TIME Friday, November 30, 2012 JOB NUMBER 243020 TYPE PAGE NO. 12 OPERATOR PM2
<12345678>

13
Cautionary Statement
This Annual Report on Form 10-K contains statements relating to future results of the company (including certain projections and business trends) that are “forward-looking statements” as defined in the Private Securities Litigation Reform Act of 1995. Forward-looking statements are typically identified by words or phrases such as “believe,” “expect,” “anticipate,” “estimate,” “should,” “are likely to be,” “will” and similar expressions. Actual results may differ materially from those projected as a result of certain risks and uncertainties, including but not limited to reduced production for certain military programs and our ability to secure new military programs as our primary military programs wind down by design in future years; reliance on major original equipment manufacturer (“OEM”) customers and possible negative outcomes from contract negotiations with our major customers, including failure to negotiate acceptable terms in contract renewal negotiations; our ability to successfully manage rapidly changing volumes in the commercial truck markets and work with our customers to adjust their demands in view of rapid changes in production levels; global economic and market cycles and conditions, availability and sharply rising costs of raw materials, including steel, and our ability to manage or recover such costs; our ability to manage possible adverse effects on our European operations, or financing arrangements related thereto, in the event one or more countries exit the European monetary union; risks inherent in operating abroad (including foreign currency exchange rates, implications of foreign regulations relating to pensions and potential disruption of production and supply due to terrorist attacks or acts of aggression); rising costs of pension and other postretirement benefits; the ability to achieve the expected benefits of restructuring actions; the demand for commercial and specialty vehicles for which we supply products; whether our liquidity will be affected by declining vehicle productions in the future; OEM program delays; demand for and market acceptance of new and existing products; successful development of new products; labor relations of our company, our suppliers and customers, including potential disruptions in supply of parts to our facilities or demand for our products due to work stoppages; the financial condition of our suppliers and customers, including potential bankruptcies; possible adverse effects of any future suspension of normal trade credit terms by our suppliers; potential difficulties competing with companies that have avoided their existing contracts in bankruptcy and reorganization proceedings; potential impairment of long-lived assets, including goodwill; potential adjustment of the value of deferred tax assets; competitive product and pricing pressures; the amount of our debt; our ability to continue to comply with covenants in our financing agreements; our ability to access capital markets; credit ratings of our debt; the outcome of existing and any future legal proceedings, including any litigation with respect to environmental or asbestos-related matters; the outcome of actual and potential product liability, warranty and recall claims; and possible changes in accounting rules; as well as other substantial costs, risks and uncertainties, including but not limited to those detailed herein and from time to time in other filings of the company with the SEC. See also the following portions of this Annual Report on Form 10-K: Item 1. Business, “Customers; Sales and Marketing”; “Competition”; “Raw Materials and Supplies”; “Employees”; “Environmental Matters”; “International Operations”; and “Seasonality; Cyclicality”; Item 1A. Risk Factors; Item 3. Legal Proceedings; and Item 7. Management’s Discussion and Analysis of Financial Condition and Results of Operations. These forward-looking statements are made only as of the date hereof, and the company undertakes no obligation to update or revise the forward-looking statements, whether as a result of new information, future events or otherwise, except as otherwise required by law.
Item 1A. Risk Factors.
Our business, financial condition and results of operations can be impacted by a number of risks, including those described below and elsewhere in this Annual Report on Form 10-K, any one of which could cause our actual results to vary materially from recent results or from anticipated future results. Any of these individual risks could materially and adversely affect our business, financial condition and results of operations. This effect could be compounded if multiple risks were to occur.
Our primary military program is winding down and failure to secure new military contracts, which are subject to continued appropriations by Congress, could adversely affect our ability to maintain our sales and results of operations
We have significant sales to U.S. Government contractors in the military vehicle market. Sales for our primary military program were at their peak during the third quarter of fiscal year 2012. This program is expected to wind down over the next two years beginning in fiscal year 2013 and failure to secure new military contracts could have a longer-term negative impact to the company. In addition, even if sales of our military programs do return to historic levels, the levels of profitability on these sales could be lower than what we have recognized in recent periods.
JOB TITLE Meritor 10-K REVISION 3 SERIAL DATE / TIME Friday, November 30, 2012 JOB NUMBER 243020 TYPE PAGE NO. 13 OPERATOR PM2
<12345678>

14
Future sales from orders placed under contracts with U.S. Government contractors are reliant on the continuing availability of Congressional appropriations. If government defense spending decreases on selected programs or future defense budgets and appropriations for the military vehicles that our products supply are subject to budgeting constraints or differing priorities, reductions in appropriations for these military vehicles could adversely affect our ability to maintain our sales and results of operations.
We depend on large OEM customers, and loss of sales to these customers or failure to negotiate acceptable terms in contract renewal negotiations could have an adverse impact on our business.
We are dependent upon large OEM customers with substantial bargaining power with respect to price and other commercial terms. In addition, we have long-term contracts with certain of these suppliers that are subject to renegotiation and renewal from time to time. Loss of all or a substantial portion of sales to any of our large volume customers for whatever reason (including, but not limited to, loss of contracts or failure to negotiate acceptable terms in contract renewal negotiations, loss of market share by these customers, insolvency of such customers, reduced or delayed customer requirements, plant shutdowns, strikes or other work stoppages affecting production by such customers), or continued reduction of prices to these customers, could have a significant adverse effect on our financial results. There can be no assurance that we will not lose all or a portion of sales to our large volume customers, or that we will be able to offset continued reduction of prices to these customers with reductions in our costs.
During fiscal year 2012, sales to our three largest customers, AB Volvo, Daimler AG and Navistar International Corporation, represented approximately 22 percent, 15 percent and 11 percent, respectively, of our sales from continuing operations. No other customer accounted for 10% or more of our total sales from continuing operations in fiscal year 2012.
The level of our sales to large OEM customers, including the realization of future sales from awarded business, is inherently subject to a number of risks and uncertainties, including the number of vehicles that these OEM customers actually produce and sell. Several of our significant customers have major union contracts that expire periodically and are subject to renegotiation. Any strikes or other actions that affect our customers’ production during this process would also affect our sales. Further, to the extent that the financial condition, including bankruptcy or market share of any of our largest customers deteriorates or their sales otherwise continue to decline, our financial position and results of operations could be adversely affected. In addition, our customers generally have the right to replace us with another supplier under certain circumstances. Accordingly, we may not in fact realize all of the future sales represented by our awarded business. Any failure to realize these sales could have a material adverse effect on our financial condition and results of operations.
Ability to manage rapidly changing production and sales volume in the commercial vehicle market may adversely affect our results of operations.
Production and sales in the commercial vehicle market have been volatile in recent years. The pace of the recovery of commercial truck volumes in North America and Europe, our largest markets, was more rapid in 2011 than previously anticipated. However, we expect production volumes in North America to soften compared to levels experienced earlier in fiscal year 2012. Production volumes in Europe, South America and the Asia-Pacific region have decreased compared to levels experienced in fiscal year 2011, and there is no certainty as to when these volumes will return to the levels previously experienced.
Our business may experience difficulty in adapting to rapidly changing production and sales volumes. In an upturn of the cycle when demand increases from what had recently been a historical low for production, we may have difficulty in meeting such extreme or rapidly increasing demand. This difficulty may include not having sufficient manpower or working capital to meet the needs of our customers or relying on other suppliers who may not be able to respond quickly to a changed environment when demand increases rapidly. In contrast, in the downturn of the cycle, we may have difficulty sustaining profitable growth given fixed costs (as further discussed below).
A further downturn in the global economy could materially adversely affect our results of operations, financial condition and cash flows.
Although the global economy saw signs of improvement in 2010 and 2011, in the second half of 2012 we started to see signs of market weakening. The global economic recession that began in late 2008 and continued through 2009 had a significant adverse impact on our business, customers and suppliers. Our cash and liquidity needs were impacted by the level, variability and timing of our customers’ worldwide vehicle production and other factors outside of our control. If the global economy were to take another significant downturn, depending upon the length, duration and severity of another recession, our results of operations, financial condition and cash flow would be materially adversely affected again.
JOB TITLE Meritor 10-K REVISION 3 SERIAL DATE / TIME Friday, November 30, 2012 JOB NUMBER 243020 TYPE PAGE NO. 14 OPERATOR PM2
<12345678>

15
Our levels of fixed costs can make it difficult to adjust our cost base to the extent necessary, or to make such adjustments on a timely basis, and continued volume declines can result in non-cash impairment charges as the value of certain long-lived assets is reduced. As a result, our financial condition and results of operations have been and would be expected to continue to be adversely affected during periods of prolonged declining production and sales volumes in the commercial vehicle markets.
The negative impact on our financial condition and results of operations from continued volume declines could also have negative effects on our liquidity. If cash flows are not available from our operations, we may be required to rely on the banking and credit markets to meet our financial commitments and short-term liquidity needs; however, we cannot predict whether that funding will be available at all or on commercially reasonable terms. In addition, in the event of reduced sales, levels of receivables would decline, which would lead to a decline in funding available under our U.S. receivables facility or under our European factoring arrangements.
Our working capital requirements may negatively affect our liquidity and capital resources.
Our working capital requirements can vary significantly, depending in part on the level, variability and timing of our customers’ worldwide vehicle production and the payment terms with our customers and suppliers. As production volumes increase, our working capital requirements to support the higher volumes generally increase. If our working capital needs exceed our cash flows from operations, we would look to our cash balances and availability for borrowings under our borrowing arrangements to satisfy those needs, as well as potential sources of additional capital, which may not be available on satisfactory terms and in adequate amounts.
In addition, since many of our accounts receivable factoring programs support our working capital requirements in Europe, any dissolution of the European monetary union, if it were to occur, or any other termination of our European factoring agreements could have a material adverse effect on our liquidity if we were unable to renegotiate such agreements or find alternative sources of liquidity.
One of our consolidated joint ventures in China participates in bills of exchange programs to settle accounts receivable from its customers and obligations to its trade suppliers. These programs are common in China and generally require the participation of local banks. Any disruption in these programs, if it were to occur, could have a material adverse effect on our liquidity if we were unable to find alternative sources of liquidity.
Our liquidity, including our access to capital markets and financing, could be constrained by limitations in the overall credit market, our credit ratings, our ability to comply with financial covenants in our debt instruments, and our suppliers suspending normal trade credit terms on our purchases.
Our current revolving credit facility matures in 2017, but is subject to a springing maturity date in 2015 if certain of our outstanding bond indebtedness is not retired. Upon expiration of this facility, we will require a new or renegotiated facility (which may be smaller and have less favorable terms than our current facility) or other financing arrangements. Our ability to access additional capital in the long term will depend on availability of capital markets and pricing on commercially reasonable terms as well as our credit profile at the time we are seeking funds, and there is no guarantee that we will be able to access additional capital.
Standard & Poor’s current corporate credit rating, senior secured credit rating and senior unsecured credit rating for our company are B, BB- and B-, respectively. Moody’s Investors Service corporate credit rating, senior secured credit rating and senior unsecured credit rating for our company are B2, Ba2 and B3, respectively. There are a number of factors, including our ability to achieve the intended benefits from restructuring and other strategic activities on a timely basis, that could result in lowering of our credit ratings. The rating agencies’ opinions about our creditworthiness may also be affected by their views of industry conditions generally, including their views concerning the financial condition of our major OEM customers. If the credit rating agencies perceive further weakening in the industry, they could lower our ratings. Declines in our ratings could reduce our access to capital markets, further increase our borrowing costs and result in lower trading prices for our securities.
Our liquidity could also be adversely impacted if our suppliers were to suspend normal trade credit terms and require more accelerated payment terms, including payment in advance or payment on delivery of purchases. If this were to occur, we would be dependent on other sources of financing to bridge the additional period between payment of our suppliers and receipt of payments from our customers.
JOB TITLE Meritor 10-K REVISION 3 SERIAL DATE / TIME Friday, November 30, 2012 JOB NUMBER 243020 TYPE PAGE NO. 15 OPERATOR PM2
<12345678>

16
We operate in an industry that is cyclical and that has periodically experienced significant year-to-year fluctuations in demand for vehicles; we also experience seasonal variations in demand for our products.
The industries in which we operate have been characterized historically by significant periodic fluctuations in overall demand for medium- and heavy-duty trucks and other vehicles for which we supply products, resulting in corresponding fluctuations in demand for our products. The length and timing of any cycle in the vehicle industry cannot be predicted with certainty.
Production and sales of the vehicles for which we supply products generally depend on economic conditions and a variety of other factors that are outside our control, including freight tonnage, customer spending and preferences, vehicle age, labor relations and regulatory requirements. In particular, demand for our Commercial Truck segment products can be affected by a pre-buy before the effective date of new regulatory requirements, such as changes in emissions standards. Historically, implementation of new, more stringent, emissions standards, has increased heavy-duty truck demand prior to the effective date of the new regulations, and correspondingly decreased this demand after the new standards are implemented. However, it is uncertain as to whether this trend will continue. In addition, any expected increase in the heavy-duty truck demand prior to the effective date of new emissions standards may be offset by the current instability in the financial markets and resulting economic contraction in the U.S. and worldwide markets.
Sales from the aftermarket portion of our Aftermarket & Trailers segment depend on overall levels of truck ton miles and gross domestic product (GDP) and may be influenced by times of slower economic growth or economic contraction based on the average age of commercial truck fleets.
We may also experience seasonal variations in the demand for our products to the extent that vehicle production fluctuates. Historically, for our business, demand has been somewhat lower in the quarters ended September 30 and December 31, when OEM plants may close during model changeovers and vacation and holiday periods or when there are fewer selling days during the quarter. In addition, our aftermarket business and our operations in China generally experience higher than usual demand in the quarters ending March 31 and June 30.
Disruptions in the financial markets are adversely impacting the availability and cost of credit which could negatively affect our business.
Disruptions in the financial markets, including the bankruptcy, insolvency or restructuring of certain financial institutions, and the lack of liquidity generally continue to impact the availability and cost of incremental credit for many companies and may adversely affect the availability of credit already arranged. These disruptions also continue to adversely affect the U.S. and world economy, further negatively impacting consumer spending patterns in the transportation and industrial sectors. In addition, as our customers and suppliers respond to rapidly changing consumer preferences, they may require access to additional capital. If that capital is not available or its cost is prohibitively high, their business would be negatively impacted which could result in further restructuring or even reorganization under bankruptcy laws. Any such negative impact, in turn, could negatively affect our business either through loss of sales to any of our customers so affected or through inability to meet our commitments (or inability to meet them without excess expense) because of loss of supplies from any of our suppliers so affected. There are no assurances that government responses to these disruptions will restore consumer confidence or improve the liquidity of the financial markets.
In addition, disruptions in the capital and credit markets, as have been experienced in the past few years, could adversely affect our ability to draw on our revolving credit facility. Our access to funds under that credit facility is dependent on the ability of the banks that are parties to the facility to meet their funding commitments. Those banks may not be able to meet their funding commitments to us if they experience shortages of capital and liquidity or if they experience excessive volumes of borrowing requests from Meritor and other borrowers within a short period of time. Longer-term disruptions in the capital and credit markets as a result of uncertainty, changing or increased regulation, reduced alternatives, or failures of significant financial institutions could adversely affect our access to liquidity needed for our business. Any disruption could require us to take measures to conserve cash until the markets stabilize or until alternative credit arrangements or other funding for our business needs can be arranged.
Continued fluctuation in the prices of raw materials and transportation costs has adversely affected our business and, together with other factors, will continue to pose challenges to our financial results.
Prices of raw materials, primarily steel and oil, for our manufacturing needs and costs of transportation have fluctuated sharply in recent years, including rapid increases which have had a negative impact on our operating income for certain periods. The price of steel increased significantly in fiscal year 2011 and has generally remained around such relatively high levels since
JOB TITLE Meritor 10-K REVISION 3 SERIAL DATE / TIME Friday, November 30, 2012 JOB NUMBER 243020 TYPE PAGE NO. 16 OPERATOR PM2
<12345678>

17
that time. These steel price increases, along with increasing transportation costs, have created pressure on profit margins and could unfavorably impact our financial results in the future. While we have had steel pricing adjustment programs in place with most major OE manufacturers, the price adjustment programs have tended to lag the increase in steel costs and have generally not contemplated all non-index-related increases in steel costs. Raw material price fluctuation, together with the volatility of the commodity markets will continue to pose risks to our financial results. If we are unable to pass price increases on to our customer base or otherwise mitigate the costs, our operating income could be adversely affected.
Escalating price pressures from customers may adversely affect our business.
Pricing pressure by OEMs is a characteristic, to a certain extent, of the commercial vehicle industry. Virtually all OEMs have aggressive price reduction initiatives and objectives each year with their suppliers, and such actions are expected to continue in the future. Accordingly, we must be able to reduce our operating costs in order to maintain our current margins. Price reductions have impacted our margins and may do so in the future. There can be no assurance that we will be able to avoid future customer price reductions or offset future customer price reductions through improved operating efficiencies, new manufacturing processes, sourcing alternatives or other cost reduction initiatives.
We operate in a highly competitive industry.
Each of Meritor’s businesses operates in a highly competitive environment. We compete worldwide with a number of North American and international providers of components and systems, some of which are owned by or associated with some of our customers. Some of these competitors are larger and have greater financial resources or have established stronger relationships with significant customers. In addition, certain OEMs manufacture products for their own use that compete with the types of products we supply, and any future increase in this activity could displace Meritor’s sales.
Many companies in our industry have undertaken substantial changes in contractual obligations to current and former employees, primarily with respect to pensions and other postretirement benefits. The bankruptcy or insolvency of a major competitor could result in that company’s eliminating or reducing some or all of these obligations, which could give that competitor a cost advantage over us.
Exchange rate fluctuations could adversely affect our financial condition and results of operations.
As a result of our substantial international operations, we are exposed to foreign currency risks that arise from our normal business operations, including in connection with our transactions that are denominated in foreign currencies. While we employ financial instruments to hedge certain of our foreign currency exchange risks relating to these transactions, our efforts to manage these risks may not be successful. In addition, we translate sales and other results denominated in foreign currencies into U.S. dollars for purposes of our consolidated financial statements. As a result, appreciation of the U.S. dollar against these foreign currencies generally will have a negative impact on our reported revenues and operating income, while depreciation of the U.S. dollar against these foreign currencies will generally have a positive effect on reported revenues and operating income. For fiscal years 2011 and 2010, our reported financial results benefited from depreciation of the U.S. dollar against foreign currencies; whereas, during fiscal year 2012, our reported financial results were adversely affected by appreciation of the U.S. dollar against foreign currencies. We generally do not hedge against our foreign currency exposure related to translations to U.S. dollars of our financial results denominated in foreign currencies.
A disruption in supply of raw materials or parts could impact our production and increase our costs.
Some of our significant suppliers have experienced weak financial condition in recent years that resulted in filing for protection under the bankruptcy laws. In addition, some of our significant suppliers are located in developing countries. We are dependent upon the ability of our suppliers to meet performance and quality specifications and delivery schedules. The inability of a supplier to meet these requirements, the loss of a significant supplier, or any labor issues or work stoppages at a significant supplier could disrupt the supply of raw materials and parts to our facilities and could have an adverse effect on us.
Work stoppages or similar difficulties could significantly disrupt our operations.
A work stoppage at one or more of our manufacturing facilities could have a material adverse effect on our business. In addition, if a significant customer were to experience a work stoppage, that customer could halt or limit purchases of our products, which could result in shutting down the related manufacturing facilities. Also, a significant disruption in the supply of a key component due to a work stoppage at one of our suppliers could result in shutting down manufacturing facilities, which could have a material adverse effect on our business.
JOB TITLE Meritor 10-K REVISION 3 SERIAL DATE / TIME Friday, November 30, 2012 JOB NUMBER 243020 TYPE PAGE NO. 17 OPERATOR PM2
<12345678>

18
Our international operations are subject to a number of risks.
We have a significant number of facilities and operations outside the United States, including investments and joint ventures in developing countries. During fiscal 2012, approximately 62 percent of our sales were generated outside of the United States. Our strategy to grow in emerging markets may put us at risk due to the risks inherent in operating in such markets. In particular, we have grown over an extended period of time, and intend as part of our strategy to continue to grow, in China, India and Brazil. Our international operations are subject to a number of risks inherent in operating abroad, including, but not limited to:
• risks with respect to currency exchange rate fluctuations (as more fully discussed above);
• risks to our liquidity if the European monetary union were to dissolve and we were unable to renegotiate European factoring agreements;
• local economic and political conditions;
• disruptions of capital and trading markets;
• possible terrorist attacks or acts of aggression that could affect vehicle production or the availability of raw materials or supplies;
• restrictive governmental actions (such as restrictions on transfer of funds and trade protection measures, including export duties and quotas and customs duties and tariffs);
• changes in legal or regulatory requirements;
• import or export licensing requirements;
• limitations on the repatriation of funds;
• high inflationary conditions;
• difficulty in obtaining distribution and support;
• nationalization;
• the laws and policies of the United States affecting trade, foreign investment and loans;
• the ability to attract and retain qualified personnel;
• tax laws; and
• labor disruptions.
There can be no assurance that these risks will not have a material adverse impact on our ability to increase or maintain our foreign sales or on our financial condition or results of operations.
A violation of the financial covenant in our senior secured credit facility could result in a default thereunder and could lead to an acceleration of our obligations under this facility and, potentially, other indebtedness.
Our ability to borrow under our existing financing arrangements depends on our compliance with covenants in the related agreements, and on our performance against covenants in our bank credit facility that require compliance with certain financial ratios as of the end of each fiscal quarter. To the extent that we are unable to maintain compliance with these requirements or to perform against the financial ratio covenants due to one or more of the various risk factors discussed herein or otherwise, our ability to borrow, and our liquidity, would be adversely impacted.
Availability under the revolving credit facility is subject to a collateral test, performed quarterly, pursuant to which borrowings on the revolving credit facility cannot exceed 1.0x the collateral test value. Availability under the revolving credit facility is also subject to certain financial covenants based on (i) the ratio of the company’s priority debt (consisting principally of amounts outstanding under the revolving credit facility, U.S. accounts receivable securitization and factoring programs, and third-party non-working capital foreign debt) to EBITDA and (ii) the amount of annual capital expenditures. The company is required to maintain a total priority debt-to-EBITDA ratio, as defined in the agreement, of (i) 2.25 to 1 as of the last day of each fiscal quarter commencing with the fiscal quarter ending on or about December 31, 2012 through and including the fiscal quarter ended September 30, 2013 and (ii) 2.00 to 1 as of the last day of each fiscal quarter thereafter through maturity.
JOB TITLE Meritor 10-K REVISION 3 SERIAL DATE / TIME Friday, November 30, 2012 JOB NUMBER 243020 TYPE PAGE NO. 18 OPERATOR PM2
<12345678>

19
If an amendment or waiver is needed (in the event we do not meet one of these covenants) and not obtained, we would be in violation of that covenant, and the lenders would have the right to accelerate the obligations upon the vote of the lenders holding at least 51% of outstanding loans thereunder. A default under the senior secured credit facility could also constitute a default under our outstanding convertible notes as well as our U.S. receivables facility and could result in the acceleration of these obligations. In addition, a default under our senior secured credit facility could result in a cross-default or the acceleration of our payment obligations under other financing agreements. If our obligations under our senior secured credit facility and other financing arrangements are accelerated as described above, our assets and cash flow may be insufficient to fully repay these obligations, and the lenders under our senior secured credit facility could institute foreclosure proceedings against our assets.
Our strategic initiatives may be unsuccessful, may take longer than anticipated, or may result in unanticipated costs.
The success and timing of any future divestitures and acquisitions will depend on a variety of factors, many of which are not within our control. If we engage in acquisitions, we may finance these transactions by issuing additional debt or equity securities. The additional debt from any such acquisitions, if consummated, could increase our debt to capitalization ratio. In addition, the ultimate benefit of any acquisition would depend on our ability to successfully integrate the acquired entity or assets into our existing business and to achieve any projected synergies. There is no assurance that the total costs and total cash costs associated with any current and future restructuring will not exceed our estimates, or that we will be able to achieve the intended benefits of these restructurings.
We are exposed to environmental, health and safety and product liabilities.
Our business is subject to liabilities with respect to environmental and health and safety matters. In addition, we are required to comply with federal, state, local and foreign laws and regulations governing the protection of the environment and health and safety, and we could be held liable for damages arising out of human exposure to hazardous substances or other environmental or natural resource damages. Environmental health and safety laws and regulations are complex, change frequently and tend to be increasingly stringent. As a result, our future costs to comply with such laws may increase significantly. There is also an inherent risk of exposure to warranty and product liability claims, as well as product recalls, in the commercial and automotive vehicle industry if our products fail to perform to specifications or are alleged to cause property damage, injury or death.
With respect to environmental liabilities, we have been designated as a potentially responsible party at nine Superfund sites (excluding sites as to which our records disclose no involvement or as to which our liability has been finally determined). In addition to the Superfund sites, various other lawsuits, claims and proceedings have been asserted against us alleging violations of federal, state and local and foreign environmental protection requirements or seeking remediation of alleged environmental impairments. We have established reserves for these liabilities when we determine that the company has a probable obligation and we can reasonably estimate it, but the process of estimating environmental liabilities is complex and dependent on evolving physical and scientific data at the site, uncertainties as to remedies and technologies to be used, and the outcome of discussions with regulatory agencies. The actual amount of costs or damages for which we may be held responsible could materially exceed our current estimates because of these and other uncertainties which make it difficult to predict actual costs accurately. In future periods, new laws and regulations, changes in remediation plans, advances in technology and additional information about the ultimate clean-up remedy could significantly change our estimates and have a material impact on our financial position and results of operations. Management cannot assess the possible effect of compliance with future requirements.
We are exposed to asbestos litigation liability.
One of our subsidiaries, Maremont Corporation, manufactured friction products containing asbestos from 1953 through 1977, when it sold its friction product business. We acquired Maremont in 1986. Maremont and many other companies are defendants in suits brought by individuals claiming personal injuries as a result of exposure to asbestos-containing products. We, along with many other companies, have also been named as a defendant in lawsuits alleging personal injury as a result of exposure to asbestos used in certain components of products of Rockwell International Corporation. Liability for these claims was transferred to us at the time of the spin-off of Rockwell’s automotive business to Meritor in 1997.
The uncertainties of asbestos claim litigation, the outcome of litigation with insurance companies regarding the scope of coverage and the long-term solvency of our insurance carriers make it difficult to predict accurately the ultimate resolution of asbestos claims. The possibility of adverse rulings or new legislation affecting asbestos claim litigation or the settlement process increases that uncertainty. Although we have established reserves to address asbestos liability and corresponding receivables for recoveries from our insurance carriers, if our assumptions with respect to the nature of pending and future claims, the cost
JOB TITLE Meritor 10-K REVISION 3 SERIAL DATE / TIME Friday, November 30, 2012 JOB NUMBER 243020 TYPE PAGE NO. 19 OPERATOR PM2
<12345678>

20
to resolve claims and the amount of available insurance prove to be incorrect, the actual amount of liability for asbestos-related claims, and the effect on us, could differ materially from our current estimates and, therefore, could have a material impact on our financial position and results of operations.
We are exposed to the rising cost of pension and other postretirement benefits.
The commercial vehicle industry, like other industries, continues to be impacted by the rising cost of pension and other postretirement benefits. In estimating our expected obligations under our pension and postretirement benefit plans, we make certain assumptions as to economic and demographic factors, such as discount rates, investment returns and health care cost trends. If actual experience as to these factors is worse than our assumptions, our obligations could grow which could in turn increase the amount of mandatory contributions to these plans in the coming years. Our pension plans are under funded by $529 million as of September 30, 2012.
Impairment in the carrying value of long-lived assets and goodwill could negatively affect our operating results and financial condition.
We have a significant amount of long-lived assets and goodwill on our consolidated balance sheet. Under generally accepted accounting principles, long-lived assets, excluding goodwill, are required to be reviewed for impairment whenever adverse events or changes in circumstances indicate a possible impairment. If business conditions or other factors cause our operating results and cash flows to decline, we may be required to record non-cash impairment charges. Goodwill must be evaluated for impairment at least annually. If the carrying value of our reporting units exceeds their current fair value the goodwill is considered impaired and is reduced to fair value via a non-cash charge to earnings. Events and conditions that could result in impairment in the value of our long-lived assets and goodwill include changes in the industries in which we operate, particularly the impact of the current downturn in the global economy, as well as competition and advances in technology, adverse changes in the regulatory environment, or other factors leading to reduction in expected long-term sales or operating results. If the value of long-lived assets or goodwill is impaired, our earnings and financial condition could be adversely affected.
The value of our deferred tax assets could become impaired, which could materially and adversely affect our results of operations and financial condition.
In accordance with the Financial Accounting Standards Board (FASB) Accounting Standards Codification (ASC) Topic 740 “Income Taxes,” each quarter we determine the probability of the realization of deferred tax assets, using significant judgments and estimates with respect to, among other things, historical operating results, expectations of future earnings and tax planning strategies. If we determine in the future that there is not sufficient positive evidence to support the valuation of these assets, due to the risk factors described herein or other factors, we may be required to adjust the valuation allowance to reduce our deferred tax assets. Such a reduction could result in material non-cash expenses in the period in which the valuation allowance is adjusted and could have a material adverse effect on our results of operations and financial condition. In addition, future changes in laws or regulations could have a material impact on the company’s overall tax position.
Our overall effective tax rate is equal to our total tax expense as a percentage of our total earnings before tax. However, tax expenses and benefits are determined separately for each tax paying component (an individual entity) or group of entities that is consolidated for tax purposes in each jurisdiction. Losses in certain jurisdictions which have valuation allowances against their deferred tax assets provide no current financial statement tax benefit unless required under the intra-period allocation requirements of ASC Topic 740. As a result, changes in the mix of projected earnings between jurisdictions, among other factors, could have a significant impact on our overall effective tax rate.
Our unrecognized tax benefits recorded in accordance with FASB ASC Topic 740 could significantly change.
FASB ASC Topic 740, “Income Taxes,” defines the confidence level that a tax position must meet in order to be recognized in the financial statements. This topic requires that the tax effects of a position be recognized only if it is “more-likely-than-not” to be sustained based solely on its technical merits as of the reporting date. The more-likely-than-not threshold represents a positive assertion by management that a company is entitled to the economic benefits of a tax position. If a tax position is not considered more-likely-than-not to be sustained based solely on its technical merits, no benefits of the position are to be recognized. Moreover, the more-likely-than-not threshold must continue to be met in each reporting period to support continued recognition of a benefit. In the event that the more-likely-than-not threshold is not met, we would be required to change the relevant tax position which could have an adverse effect on our results of operations and financial condition.
JOB TITLE Meritor 10-K REVISION 3 SERIAL DATE / TIME Friday, November 30, 2012 JOB NUMBER 243020 TYPE PAGE NO. 20 OPERATOR PM2
<12345678>

21
Restriction on use of tax attributes from tax law “ownership change”
Section 382 of the U.S. Internal Revenue Code of 1986, as amended, limits the ability of a corporation that undergoes an “ownership change” to use its tax attributes, such as net operating losses and tax credits. In general, an “ownership change” occurs if five percent shareholders (applying certain look-through rules) of an issuer’s outstanding common stock, collectively, increase their ownership percentage by more than fifty percentage points within any three year period over such shareholders’ lowest percentage ownership during this period. If we were to issue new shares of stock, such new shares could contribute to such an “ownership change” under U.S. tax law. Moreover, not every event that could contribute to such an “ownership change” is within our control. If an “ownership change” under Section 382 were to occur, our ability to utilize tax attributes in the future may be limited.
Assertions against us or our customers relating to intellectual property rights could materially impact our business.
Our industry is characterized by companies that hold large numbers of patents and other intellectual property rights and that vigorously pursue, protect and enforce intellectual property rights. From time to time, third parties may assert against us and our customers and distributors their patent and other intellectual property rights to technologies that are important to our business.
Claims that our products or technology infringe third-party intellectual property rights, regardless of their merit or resolution, are frequently costly to defend or settle and divert the efforts and attention of our management and technical personnel. In addition, many of our supply agreements require us to indemnify our customers and distributors from third-party infringement claims, which have in the past and may in the future require that we defend those claims and might require that we pay damages in the case of adverse rulings. Claims of this sort also could harm our relationships with our customers and might deter future customers from doing business with us. We do not know whether we will prevail in these proceedings given the complex technical issues and inherent uncertainties in intellectual property litigation. If any pending or future proceedings result in an adverse outcome, we could be required to:
• cease the manufacture, use or sale of the infringing products or technology;
• pay substantial damages for infringement;
• expend significant resources to develop non-infringing products or technology;
• license technology from the third-party claiming infringement, which license may not be available on commercially reasonable terms, or at all;
• enter into cross-licenses with our competitors, which could weaken our overall intellectual property portfolio;
• lose the opportunity to license our technology to others or to collect royalty payments based upon successful protection and assertion of our intellectual property against others;
• pay substantial damages to our customers or end users to discontinue use or replace infringing technology with non-infringing technology; or
• relinquish rights associated with one or more of our patent claims, if our claims are held invalid or otherwise unenforceable.
Any of the foregoing results could have a material adverse effect on our business, financial condition and results of operations.
We utilize a significant amount of intellectual property in our business. If we are unable to protect our intellectual property, our business could be adversely affected.
Our success depends in part upon our ability to protect our intellectual property. To accomplish this, we rely on a combination of intellectual property rights, including patents, trademarks and trade secrets, as well as customary contractual protections with our customers, distributors, employees and consultants, and through security measures to protect our trade secrets. We cannot guarantee that:
• any of our present or future patents will not lapse or be invalidated, circumvented, challenged, abandoned or, in the case of third-party patents licensed or sub-licensed to us, be licensed to others;
• rights previously granted by third parties to intellectual property rights licensed or assigned to us, will not hamper our ability to assert our intellectual property rights against potential competitors or hinder the settlement of currently pending or future disputes;
JOB TITLE Meritor 10-K REVISION 3 SERIAL DATE / TIME Friday, November 30, 2012 JOB NUMBER 243020 TYPE PAGE NO. 21 OPERATOR PM2
<12345678>

22
• any of our pending or future patent applications will be issued or have the coverage originally sought;
• our intellectual property rights will be enforced in jurisdictions where competition may be intense or where legal protection may be weak; or
• any of the trademarks, trade secrets or other intellectual property rights that we presently employ in our business will not lapse or be invalidated, circumvented, challenged, abandoned or licensed to others.
In addition, we may not receive competitive advantages from the rights granted under our patents and other intellectual property rights. Our competitors may develop technologies that are similar or superior to our proprietary technologies, duplicate our proprietary technologies, or design around the patents we own or license. Our existing and future patents may be circumvented, blocked, licensed to others, or challenged as to inventorship, ownership, scope, validity or enforceability. Effective intellectual property protection may be unavailable or more limited in one or more relevant jurisdictions relative to those protections available in the United States, or may not be applied for in one or more relevant jurisdictions. If we pursue litigation to assert our intellectual property rights, an adverse decision in any of these legal actions could limit our ability to assert our intellectual property rights, limit the value of our technology or otherwise negatively impact our business, financial condition and results of operations.
We are a party to a number of patent and intellectual property license agreements. Some of these license agreements require us to make one-time or periodic payments. We may need to obtain additional licenses or renew existing license agreements in the future. We are unable to predict whether these license agreements can be obtained or renewed on acceptable terms.
We may be adversely affected by any disruption in our information technology systems.
Our operations are dependent upon our information technology systems, which encompass all of our major business functions. We rely upon such information technology systems to manage and replenish inventory, to fill and ship customer orders on a timely basis, to coordinate our sales activities across all of our products and services and to coordinate our administrative activities. A substantial disruption in our information technology systems for any prolonged time period could result in delays in receiving inventory and supplies or filling customer orders and adversely affect our customer service and relationships. Our systems might be damaged or interrupted by natural or man-made events (caused by us, by our service providers or others) or by computer viruses, physical or electronic break-ins and similar disruptions affecting the internet. Such delays, problems or costs could have a material effect on our business, financial condition and results of operations.
Item 1B. Unresolved Staff Comments.
None.
Item 2. Properties.
At September 30, 2012, our operating segments, including all joint ventures, had the following facilities in the United States, Europe, South America, Canada, Mexico and the Asia-Pacific region. For purposes of these numbers, multiple facilities in one geographic location are counted as one facility.
Manufacturing Facilities
Engineering Facilities, Sales Offices,
Warehouses and Service Centers
Commercial Truck. . . . . . . . . . . . . . . . . . . . . . . . . . . . . . . . . . . . . . 18 9Industrial . . . . . . . . . . . . . . . . . . . . . . . . . . . . . . . . . . . . . . . . . . . . 13 12Aftermarket & Trailer. . . . . . . . . . . . . . . . . . . . . . . . . . . . . . . . . . . . 8 9Other . . . . . . . . . . . . . . . . . . . . . . . . . . . . . . . . . . . . . . . . . . . . . . . — 4
Total. . . . . . . . . . . . . . . . . . . . . . . . . . . . . . . . . . . . . . . . . . . . . . . . 39 34
These facilities had an aggregate floor space of approximately 11 million square feet, substantially all of which is in use. We owned approximately 65 percent and leased approximately 35 percent of this floor space. Substantially all of our owned domestic plants and equipment are subject to liens securing our obligations under our revolving credit facility with a group of banks (see Note 15 of the Notes to Consolidated Financial Statements under Item 8. Financial Statements and Supplementary Data ). In the opinion of management, our properties have been well maintained, are in sound operating condition and contain all equipment and facilities necessary to operate at present levels.
JOB TITLE Meritor 10-K REVISION 3 SERIAL DATE / TIME Friday, November 30, 2012 JOB NUMBER 243020 TYPE PAGE NO. 22 OPERATOR PM2
<12345678>

23
A summary of floor space of these facilities at September 30, 2012, (including new space under construction) is as follows:
Owned Facilities Leased Facilities
LocationCommercial
TruckAftermarket
& Trailers Industrial OtherCommercial
TruckAftermarket
& Trailers Industrial Other Total
United States . . . 1,015,763 432,037 1,013,528 417,800 494,864 520,627 48,000 3,942,619Canada . . . . . . . 300,484 300,484Europe . . . . . . . . 1,870,150 68,326 619,572 35,613 19,749 2,613,410Asia Pacific. . . . . 680,700 87,883 1,297,163 2,065,746Latin America . . . 1,493,361 571,743 50,024 2,115,128
Total . . . . . . . 4,379,274 500,363 1,694,228 417,800 1,686,179 994,631 1,345,163 19,749 11,037,387
Item 3. Legal Proceedings
• See Note 19 of the Notes to Consolidated Financial Statements under Item 8. Financial Statements and Supplementary Data for information with respect to three class action lawsuits filed against the company as a result of modifications made to its retiree medical benefits.
• See Note 22 of the Notes to Consolidated Financial Statements under Item 8. Financial Statements and Supplementary Data for information with respect to asbestos-related litigation.
• See Item 1. Business, “Environmental Matters” and Note 22 of the Notes to Consolidated Financial Statements under Item 8. Financial Statements and Supplementary Data for information relating to environmental proceedings.
• On October 5, 2006, Meritor Transmission Corporation and ZF Meritor LLC, a joint venture between a Meritor, Inc. subsidiary and ZF Friedrichshafen AG filed a lawsuit against Eaton Corporation in the United States District Court for the District of Delaware, alleging that Eaton had engaged in exclusionary, anticompetitive conduct in the markets for heavy-duty truck transmissions, in violation of the U.S. antitrust laws and seeking an injunction prohibiting Eaton from engaging in such anticompetitive conduct and monetary damages. On October 8, 2009, the jury found that Eaton engaged in conduct that violated the Sherman and Clayton antitrust acts in the sale and marketing of heavy-duty truck transmissions. The jury did not address the amount of damages. The district court denied Eaton’s motion to overturn the jury verdict on March 10, 2011, awarded ZF Meritor zero dollars in damages on August 4, 2011, and issued a limited injunction, stayed pending appeal, against Eaton on August 19, 2011. The jury verdict, the district court’s October 20, 2009 entry of judgment on the verdict, and other district court orders became the subject of consolidated appeals before the Third Circuit Court of Appeals. On June 26, 2012, the Third Circuit heard oral argument on the appeals. On September 28, 2012, the Third Circuit issued an opinion affirming that sufficient evidence supported the jury’s finding that Eaton had engaged in anticompetitive conduct that injured Meritor and ZF Meritor. Further, the Circuit Court reversed the district court’s order denying Meritor and ZF Meritor the opportunity to present certain evidence concerning damages, and remanded the case to the district court for further proceedings on damages. On October 26, 2012, the Third Circuit denied an Eaton petition for rehearing on the appeals. Unless Eaton seeks and is granted appellate review before the United States Supreme Court, the case will be returned to the district court for further proceedings on damages.
JOB TITLE Meritor 10-K REVISION 3 SERIAL DATE / TIME Friday, November 30, 2012 JOB NUMBER 243020 TYPE PAGE NO. 23 OPERATOR PM2
<12345678>

24
• On March 31, 2008, S&E Quick Lube, a filter distributor, filed suit in U.S. District Court for the District of Connecticut alleging that several filter manufacturers and their affiliated corporate entities, including a prior subsidiary of the company, engaged in a conspiracy to fix prices, rig bids and allocate U.S. customers for aftermarket automotive filters. This suit is a purported class action on behalf of direct purchasers of filters from the defendants. Several parallel purported class actions, including on behalf of indirect purchasers of filters, have been filed by other plaintiffs in a variety of jurisdictions in the United States and Canada. The U.S. cases have been consolidated into a multi-district litigation proceeding in Federal court for the Northern District of Illinois. On April 16, 2009, the Attorney General of the State of Florida filed a complaint with the U.S. District Court for the Northern District of Illinois based on these same allegations. On May 25, 2010, the Office of the Attorney General for the State of Washington informed the company that it also was investigating the allegations raised in these suits. On August 9, 2010, the County of Suffolk, New York, filed a complaint in the Eastern District of New York based on the same allegations. The case was transferred to the multi-district litigation proceeding in Illinois, but has been dismissed without prejudice pursuant to a tolling agreement that continues until thirty days after the claims by the indirect purchasers in the multi-district litigation are terminated, settled, or dismissed. On April 14, 2011, the judge in that multi-district litigation granted a stay on discovery and depositions until July 25, 2011. The stay was subsequently extended until August 23, 2011 and, on October 12, 2011, was further extended pending the court’s ruling on various motions. On January 19, 2012, counsel for the defendants and counsel for all purported U.S. class plaintiffs participated in a settlement conference that was facilitated by the magistrate for the judge in the multi-district litigation. None of the parties were able to reach any agreement at that conference and, on January 20, 2012, the court ruled on the above-referenced motions and vacated the stay on discovery and depositions. In February 2012 the other remaining defendants reached preliminary settlement with all U.S. plaintiffs for $13 million, leaving the company as the sole remaining defendant. These preliminary settlements were allocated 65 percent to the direct purchasers and 35 percent to the remaining plaintiffs (indirect purchasers). In April 2012, the company settled with the U.S. indirect purchasers for $3.1 million. In August 2012, the company entered into a settlement agreement for the remaining claims with the U.S. direct purchasers for $8.3 million. Following the settlement, the only remaining plaintiffs in the litigation are those who filed the actions in Canada. The company believes any liability associated with the claims of such plaintiffs will be immaterial.
• On March 4, 2010, Gordon Bankhead and his spouse filed suit in Superior Court for Alameda County, California, against more than 40 defendants that Mr. Bankhead claims manufactured or supplied asbestos-containing products he allegedly was exposed to during his career as a janitor; as an ordnance specialist in the National Guard; and as an automotive parts-man. By the time trial began on October 27, 2010, Mr. and Mrs. Bankhead had settled with all defendants except for ArvinMeritor, Inc. (“AM”), a subsidiary of Meritor, and three other defendants. The claims against these four defendants were limited to Mr. Bankhead’s work as an automotive parts-man. On December 23, 2010, the jury ruled against all four defendants, including AM. AM was assessed $375,000 in compensatory damages for which it recorded a liability in fiscal year 2011. Additionally, AM was assessed $4.5 million in punitive damages. AM filed an appeal on the punitive damages award to the California Court of Appeals. On April 19, 2012, the California Court of Appeals affirmed the trial court judgment in its entirety. Given this, AM increased its liability for this matter to $5.6 million at March 31, 2012. On May 29, 2012, AM requested that the California Supreme Court hear arguments on the points of law raised in the courts below, but that court declined to do so on July 11, 2012. On September 24, 2012, the company entered into a settlement agreement regarding this matter and a separate wrongful death action by Mr. Bankhead’s spouse.
• Various other lawsuits, claims and proceedings have been or may be instituted or asserted against Meritor or our subsidiaries relating to the conduct of our business, including those pertaining to product liability, warranty or recall claims, intellectual property, safety and health, contract and employment matters. Although the outcome of litigation cannot be predicted with certainty and some lawsuits, claims or proceedings may be disposed of unfavorably to Meritor, management believes, after consulting with Vernon G. Baker, II, Esq., Meritor’s General Counsel, that the disposition of matters that are pending will not have a material effect on our business, financial condition or results of operations.
Item 4. Mine Safety Disclosures.
Not applicable.
JOB TITLE Meritor 10-K REVISION 3 SERIAL DATE / TIME Friday, November 30, 2012 JOB NUMBER 243020 TYPE PAGE NO. 24 OPERATOR PM2
<12345678>
25
Item 4A. Executive Officers of the Registrant.
The name, age, positions and offices held with Meritor and principal occupations and employment during the past five years of each of our executive officers as of November 12, 2012, are as follows:
Charles G. McClure, Jr., 59 – Chairman of the Board, Chief Executive Officer and President since August 2004. Chief Executive Officer of Federal-Mogul Corporation (automotive component supplier) from July 2003 to July 2004; and President and Chief Operating Officer of Federal-Mogul Corporation from January 2001 to July 2003.
Vernon G. Baker, II, 59 – Senior Vice President and General Counsel since July 2000.
Timothy E. Bowes, 49 – Vice President and President, Commercial Truck and Industrial since November 2012, and President, Commercial Truck, from July 2011 to November 2012 and Vice President and President, Industrial, from November 2009 until July 2011; Vice President and Managing Director, Asia Pacific from 2008 until November 2009; Vice President, Sales, Marketing & Product Strategy from 2007 – 2008; and General Manager, Specialty Sales & Service from 2005 – 2007. Prior to that he was Vice President, Sales, Hilite International.
Jeffrey A. Craig, 52 – Senior Vice President and Chief Financial Officer since January 2009 and Acting Controller from May 2008 to January 2009. Senior Vice President and Controller from July 2007 to May 2008. Vice President and Controller of Meritor from May 2006 to July 2007; and President and Chief Executive Officer of GMAC Commercial Finance (commercial lending business) from 2001 to May 2006.
Pedro N. Ferro, 53, – Vice President and President, Aftermarket and Trailer since November 2012 and President, Industrial, from July 2011 to November 2012 and Vice President and General Manager, Specialty, Brakes and Emissions from 2001 until 2007. President, Commercial Vehicle Undercarriage for The Marmon Group, a division of Berkshire Hathaway, from 2008 until 2011 and from 2007 until 2008 President, Webb Wheels Products Inc. for The Marmon Group.
Barbara G. Novak, 50 – Vice President and Secretary since January 2008. Senior Counsel, Securities of TRW Automotive Holdings Corp. (automotive) from 2002 to 2007.
Larry Ott, 53 – Senior Vice President, Human Resources since August 2010. Senior Vice president, GMAC Human Resources from 2006 – July 2010; Human Resources Director, Global Purchasing and Supply Chain, General Motors Corporation 2004-2005. Prior to that, held a variety of positions with General Motors Corporation since 1983.
There are no family relationships, as defined in Item 401 of Regulation S-K, between any of the above executive officers and any director, executive officer or person nominated to become a director or executive officer. No officer of Meritor was selected pursuant to any arrangement or understanding between him or her and any person other than Meritor. All executive officers are elected annually.
JOB TITLE Meritor 10-K REVISION 3 SERIAL DATE / TIME Friday, November 30, 2012 JOB NUMBER 243020 TYPE PAGE NO. 25 OPERATOR PM2
<12345678>

26
PART II
Item 5. Market for Registrant’s Common Equity, Related Stockholder Matters and Issuer Purchases of Equity Securities
Meritor’s common stock, par value $1 per share (“Common Stock”), is listed on the New York Stock Exchange (“NYSE”) and trades under the symbol “MTOR.” Prior to March 30, 3011, the Common Stock traded under the symbol “ARM”. On November 7, 2012, there were 20,532 shareowners of record of Meritor’s Common Stock.
The high and low sale prices per share of Meritor Common Stock for each quarter of fiscal years 2012 and 2011 were as follows:
Fiscal Year 2012 Fiscal Year 2011
Quarter Ended High Low High Low
December 31 . . . . . . . . . . . . . . . . . . . . . . . . . . . . . . . . . . . . . . . . . . . $10.31 $4.80 $21.77 $15.11March 31 . . . . . . . . . . . . . . . . . . . . . . . . . . . . . . . . . . . . . . . . . . . . . . 8.74 5.49 22.65 15.75June 30 . . . . . . . . . . . . . . . . . . . . . . . . . . . . . . . . . . . . . . . . . . . . . . . 8.30 4.78 18.36 13.93September 30 . . . . . . . . . . . . . . . . . . . . . . . . . . . . . . . . . . . . . . . . . . 5.60 3.98 17.33 6.36
There were no dividends declared and paid in fiscal year 2011 or in fiscal year 2012. Our payment of cash dividends and the amount of the dividend are subject to review and change at the discretion of our Board of Directors.
See Item 12. Security Ownership of Certain Beneficial Owners and Management and Related Stockholder Matters for information on securities authorized for issuance under equity compensation plans.
Issuer repurchases
The independent trustee of our 401(k) plans purchases shares in the open market to fund investments by employees in our common stock, one of the investment options available under such plans, and any matching contributions in company stock we provide under certain of such plans. In addition, our stock incentive plans permit payment of an option exercise price by means of cashless exercise through a broker and permit the satisfaction of the minimum statutory tax obligations upon exercise of options and the vesting of restricted stock units through stock withholding. However, the company does not believe such purchases or transactions are issuer repurchases for the purposes of this Item 5 of this Report on Form 10-K. In addition, our stock incentive plans also permit the satisfaction of tax obligations upon the vesting of restricted stock through stock withholding. There were no shares withheld in the fourth quarter of fiscal year 2012.
Shareowner Return Performance Presentation
The line graphs below compare the cumulative total shareowner return of the S&P 500 and each of the two peer groups of companies for the period from September 30, 2007 to September 30, 2012, assuming a fixed investment of $100 at the respective closing prices on the last day of each fiscal year and reinvestment of cash dividends.
JOB TITLE Meritor 10-K REVISION 3 SERIAL DATE / TIME Friday, November 30, 2012 JOB NUMBER 243020 TYPE PAGE NO. 26 OPERATOR PM2
<12345678>

27
COMPARISON OF 5 YEAR CUMULATIVE TOTAL RETURN*Among Meritor, Inc., the S&P 500 Index, and the Peer Group
*$100 invested on 9/30/07 in stock or index, including reinvestment of dividends. Fiscal year ending September 30. Copyright© 2012 S&P, a division of The McGraw-Hill Companies Inc. All rights reserved.
$0
$20
$40
$60
$80
$100
$120
$140
$160
9/129/119/109/099/089/07
Meritor, Inc. S&P 500 Peer Group
9/07 9/08 9/09 9/10 9/11 9/12
Meritor, Inc. . . . . . . . . . . . . . . . . . . . . . . . 100.00 79.91 49.72 98.81 44.89 26.96S&P 500 . . . . . . . . . . . . . . . . . . . . . . . . . 100.00 78.02 72.63 80.01 80.93 105.37Peer Group. . . . . . . . . . . . . . . . . . . . . . . . 100.00 69.33 65.94 131.71 117.09 137.29
The peer group consists of representative commercial vehicle suppliers of approximately comparable products to Meritor as Meritor believes is appropriate for comparing shareowner return given Meritor’s transformed business as discussed above. The peer group consists of Accuride Corporation, Commercial Vehicle Group, Inc., Cummins Inc., Dana Holding Corporation, Haldex AB, Modine Manufacturing Company, SAF-Holland SA, Stoneridge, Inc., and Wabco Holdings Inc.
The information included under the heading “Shareowner Return Performance Presentation” is not to be treated as “soliciting material” or as “filed” with the SEC, and is not incorporated by reference into any filing by the company under the Securities Act of 1933 or the Securities Exchange Act of 1934 that is made on, before or after the date of filing of this Annual Report on Form 10-K.
JOB TITLE Meritor 10-K REVISION 3 SERIAL DATE / TIME Friday, November 30, 2012 JOB NUMBER 243020 TYPE PAGE NO. 27 OPERATOR PM2
<12345678>

28
Item 6. Selected Financial Data.
The following sets forth selected consolidated financial data. The data should be read in conjunction with the information included under Item 7. Management’s Discussion and Analysis of Financial Condition and Results of Operations and Item 8. Financial Statements and Supplementary Data below.
Year Ended September 30,
2012 2011 2010 2009 2008
(in millions, except per share amounts)
SUMMARY OF OPERATIONSSales
Commercial Truck. . . . . . . . . . . . . . . . . . . . . . . . . . . . . . . . $2,717 $2,806 $ 1,960 $ 1,566 $2,922Industrial . . . . . . . . . . . . . . . . . . . . . . . . . . . . . . . . . . . . . . 1,001 1,113 951 888 1,117Aftermarket & Trailer. . . . . . . . . . . . . . . . . . . . . . . . . . . . . . 1,011 1,020 909 901 967Intersegment Sales . . . . . . . . . . . . . . . . . . . . . . . . . . . . . . . (311) (317) (290) (335) (404)
Total Sales . . . . . . . . . . . . . . . . . . . . . . . . . . . . . . . . . . . . . . . $4,418 $4,622 $ 3,530 $ 3,020 $4,602
Operating Income . . . . . . . . . . . . . . . . . . . . . . . . . . . . . . . . . . $ 173 $ 174 $ 132 $ 26 $ 180Income (Loss) Before Income Taxes . . . . . . . . . . . . . . . . . . . . . 137 159 76 (52) 131Net Income Attributable to Noncontrolling Interests . . . . . . . . . . (11) (17) (14) (12) (15)Net Income (Loss) Attributable to Meritor, Inc.:
Income (Loss) from Continuing Operations . . . . . . . . . . . . . . $ 70 $ 65 $ 14 $ (729) $ (40)Loss from Discontinued Operations . . . . . . . . . . . . . . . . . . . (18) (2) (2) (459) (65)
Net Income (Loss). . . . . . . . . . . . . . . . . . . . . . . . . . . . . . . . $ 52 $ 63 $ 12 $ (1,188) $ (105)
BASIC EARNINGS (LOSS) PER SHARE Continuing Operations. . . . . . . . . . . . . . . . . . . . . . . . . . . . . $ 0.73 $ 0.69 $ 0.16 $ (10.05) $ (0.55)Discontinued Operations . . . . . . . . . . . . . . . . . . . . . . . . . . . (0.19) (0.02) (0.02) (6.34) (0.91)
Basic Earnings (Loss) per Share . . . . . . . . . . . . . . . . . . . . . $ 0.54 $ 0.67 $ 0.14 $ (16.39) $ (1.46)
DILUTED EARNINGS (LOSS) PER SHARE Continuing Operations. . . . . . . . . . . . . . . . . . . . . . . . . . . . . $ 0.72 $ 0.67 $ 0.16 $ (10.05) $ (0.55)Discontinued Operations . . . . . . . . . . . . . . . . . . . . . . . . . . . (0.18) (0.02) (0.02) (6.34) (0.91)
Diluted Earnings (Loss) per Share . . . . . . . . . . . . . . . . . . . . $ 0.54 $ 0.65 $ 0.14 $ (16.39) $ (1.46)
Cash Dividends per Share . . . . . . . . . . . . . . . . . . . . . . . . . . . . $ — $ — $ — $ 0.10 $ 0.40
FINANCIAL POSITION AT SEPTEMBER 30 Total Assets . . . . . . . . . . . . . . . . . . . . . . . . . . . . . . . . . . . . . . $2,501 $2,663 $ 2,879 $ 2,505 $4,639Short-term Debt . . . . . . . . . . . . . . . . . . . . . . . . . . . . . . . . . . . 18 84 — 97 240Long-term Debt . . . . . . . . . . . . . . . . . . . . . . . . . . . . . . . . . . . 1,042 950 1,029 995 970
JOB TITLE Meritor 10-K REVISION 3 SERIAL DATE / TIME Friday, November 30, 2012 JOB NUMBER 243020 TYPE PAGE NO. 28 OPERATOR PM2
<12345678>

29
Income from continuing operations attributable to Meritor, Inc. in the selected financial data information presented above includes the following items specific to the period of occurrence (in millions):
Year Ended September 30,
2012 2011 2010 2009 2008
Pretax items: Restructuring costs. . . . . . . . . . . . . . . . . . . . . . . . . . . . . . . . . . . . . . . $ (39) $ (22) $ (6) $ (60) $ —Asset impairment charges. . . . . . . . . . . . . . . . . . . . . . . . . . . . . . . . . . — — — (14) —Environmental remediation charges . . . . . . . . . . . . . . . . . . . . . . . . . . . (4) (2) (6) (1) (3)Impact of pension plan freeze . . . . . . . . . . . . . . . . . . . . . . . . . . . . . . . — — 7 — —Gain on sale of property . . . . . . . . . . . . . . . . . . . . . . . . . . . . . . . . . . . 16 — — — —Asbestos-related liability remeasurement . . . . . . . . . . . . . . . . . . . . . . . (18) — — — —Non-operating gains, net. . . . . . . . . . . . . . . . . . . . . . . . . . . . . . . . . . . 7 10 2 — —
After tax items: Non-cash charge on repatriated earnings. . . . . . . . . . . . . . . . . . . . . . . — — — — (68)Deferred tax asset valuation allowance benefit (expense). . . . . . . . . . . . — — 9 (644) (46)
Loss from discontinued operations attributable to Meritor, Inc. in the selected financial data information presented above includes the following items specific to the period of occurrence (in millions):
Year Ended September 30,
2012 2011 2010 2009 2008
Pretax items: Gain (loss) on divestitures of businesses, net . . . . . . . . . . . . . . . . . . . . $ (1) $19 $ 5 $ (10 ) $ (16)Restructuring costs. . . . . . . . . . . . . . . . . . . . . . . . . . . . . . . . . . . . . . . (1) (9) (6 ) (41 ) (20)Asset impairment charges. . . . . . . . . . . . . . . . . . . . . . . . . . . . . . . . . . — — (2 ) (265 ) —Charge for contingency and indemnity obligation . . . . . . . . . . . . . . . . . (10) (4) — (28 ) —
After tax items: Non-cash charge on repatriated earnings. . . . . . . . . . . . . . . . . . . . . . . — — — — (69)
Item 7. Management’s Discussion and Analysis of Financial Conditions and Results of Operations.
Overview
Meritor, Inc. (the “company” or “Meritor”), headquartered in Troy, Michigan, is a premier global supplier of a broad range of integrated systems, modules and components to original equipment manufacturers (“OEMs”) and the aftermarket for the commercial vehicle, transportation and industrial sectors. The company serves commercial truck, trailer, off-highway, military, bus and coach and other industrial OEMs and certain aftermarkets. Meritor common stock is traded on the New York Stock Exchange under the ticker symbol MTOR.
Our sales for fiscal year 2012 were $4,418 million, down compared to $4,622 million in the prior year. We experienced a slowdown in sales volumes in all regions in which we operate compared to prior year volumes, other than in North America where the market remained strong. Income from continuing operations in fiscal year 2012 was $70 million, or $0.72 per diluted share, compared to $65 million, or $0.67 per diluted share, in the prior year. Net income for the year ended September 30, 2012 was $52 million compared to $63 million in the prior year. The decrease in net income is primarily due to lower sales, higher restructuring costs, charges related to remeasurement of asbestos-related liabilities and lower earnings from our unconsolidated joint ventures in South America, which were partially offset by improved gross margins, a gain associated with the sale of excess land at our facility in Cwmbran, Wales and a lower effective tax rate.
Adjusted EBITDA (see Non-GAAP Financial Measures below) for the fiscal year ended September 30, 2012 was $345 million compared to $347 million in fiscal year 2011. Our Adjusted EBITDA margin in fiscal year 2012 was 7.8 percent compared to 7.5 percent in the same period a year ago. The improvement in Adjusted EBITDA margin is due to key initiatives executed by the company during fiscal year 2012 including improved pricing and the sale of our St. Priest, France manufacturing facility, partially offset by lower sales.
JOB TITLE Meritor 10-K REVISION 3 SERIAL DATE / TIME Friday, November 30, 2012 JOB NUMBER 243020 TYPE PAGE NO. 29 OPERATOR PM2
<12345678>
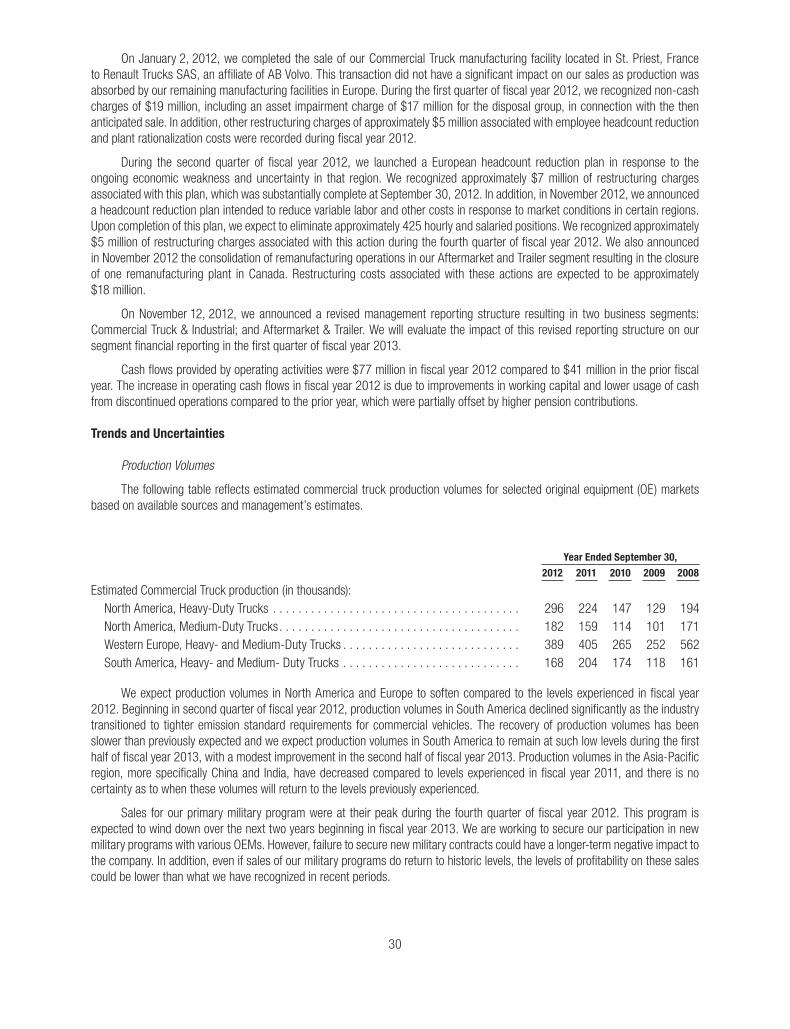
30
On January 2, 2012, we completed the sale of our Commercial Truck manufacturing facility located in St. Priest, France to Renault Trucks SAS, an affiliate of AB Volvo. This transaction did not have a significant impact on our sales as production was absorbed by our remaining manufacturing facilities in Europe. During the first quarter of fiscal year 2012, we recognized non-cash charges of $19 million, including an asset impairment charge of $17 million for the disposal group, in connection with the then anticipated sale. In addition, other restructuring charges of approximately $5 million associated with employee headcount reduction and plant rationalization costs were recorded during fiscal year 2012.
During the second quarter of fiscal year 2012, we launched a European headcount reduction plan in response to the ongoing economic weakness and uncertainty in that region. We recognized approximately $7 million of restructuring charges associated with this plan, which was substantially complete at September 30, 2012. In addition, in November 2012, we announced a headcount reduction plan intended to reduce variable labor and other costs in response to market conditions in certain regions. Upon completion of this plan, we expect to eliminate approximately 425 hourly and salaried positions. We recognized approximately $5 million of restructuring charges associated with this action during the fourth quarter of fiscal year 2012. We also announced in November 2012 the consolidation of remanufacturing operations in our Aftermarket and Trailer segment resulting in the closure of one remanufacturing plant in Canada. Restructuring costs associated with these actions are expected to be approximately $18 million.
On November 12, 2012, we announced a revised management reporting structure resulting in two business segments: Commercial Truck & Industrial; and Aftermarket & Trailer. We will evaluate the impact of this revised reporting structure on our segment financial reporting in the first quarter of fiscal year 2013.
Cash flows provided by operating activities were $77 million in fiscal year 2012 compared to $41 million in the prior fiscal year. The increase in operating cash flows in fiscal year 2012 is due to improvements in working capital and lower usage of cash from discontinued operations compared to the prior year, which were partially offset by higher pension contributions.
Trends and Uncertainties
Production Volumes
The following table reflects estimated commercial truck production volumes for selected original equipment (OE) markets based on available sources and management’s estimates.
Year Ended September 30,
2012 2011 2010 2009 2008
Estimated Commercial Truck production (in thousands): North America, Heavy-Duty Trucks . . . . . . . . . . . . . . . . . . . . . . . . . . . . . . . . . . . . . . . 296 224 147 129 194North America, Medium-Duty Trucks. . . . . . . . . . . . . . . . . . . . . . . . . . . . . . . . . . . . . . 182 159 114 101 171Western Europe, Heavy- and Medium-Duty Trucks . . . . . . . . . . . . . . . . . . . . . . . . . . . . 389 405 265 252 562South America, Heavy- and Medium- Duty Trucks . . . . . . . . . . . . . . . . . . . . . . . . . . . . 168 204 174 118 161
We expect production volumes in North America and Europe to soften compared to the levels experienced in fiscal year 2012. Beginning in second quarter of fiscal year 2012, production volumes in South America declined significantly as the industry transitioned to tighter emission standard requirements for commercial vehicles. The recovery of production volumes has been slower than previously expected and we expect production volumes in South America to remain at such low levels during the first half of fiscal year 2013, with a modest improvement in the second half of fiscal year 2013. Production volumes in the Asia-Pacific region, more specifically China and India, have decreased compared to levels experienced in fiscal year 2011, and there is no certainty as to when these volumes will return to the levels previously experienced.
Sales for our primary military program were at their peak during the fourth quarter of fiscal year 2012. This program is expected to wind down over the next two years beginning in fiscal year 2013. We are working to secure our participation in new military programs with various OEMs. However, failure to secure new military contracts could have a longer-term negative impact to the company. In addition, even if sales of our military programs do return to historic levels, the levels of profitability on these sales could be lower than what we have recognized in recent periods.
JOB TITLE Meritor 10-K REVISION 3 SERIAL DATE / TIME Friday, November 30, 2012 JOB NUMBER 243020 TYPE PAGE NO. 30 OPERATOR PM2
<12345678>

31
Industry-Wide Issues
Our business continues to address a number of other challenging industry-wide issues including the following:
• Uncertainty around the global market outlook;
• Volatility in price and availability of steel, components and other commodities;
• Disruptions in the financial markets and their impact on the availability and cost of credit;
• Higher energy and transportation costs;
• Impact of currency exchange rate volatility;
• Consolidation and globalization of OEMs and their suppliers; and
• Significant pension and retiree medical health care costs.
Other
Other significant factors that could affect our results and liquidity in fiscal year 2013 include:
• Significant contract awards or losses of existing contracts or failure to negotiate acceptable terms in contract renewal negotiations;
• Ability to manage possible adverse effects on our European operations, or financing arrangements related thereto, in the event one or more countries exit the European monetary union;
• Ability to work with our customers to manage rapidly changing production volumes;
• Ability to recover and timing of recovery of steel price and other cost increases from our customers;
• Any unplanned extended shutdowns or production interruptions by us, our customers or our suppliers;
• A significant deterioration or slowdown in economic activity in the key markets in which we operate;
• Higher than planned price reductions to our customers;
• Potential price increases from our suppliers;
• Additional restructuring actions and the timing and recognition of restructuring charges;
• Higher than planned warranty expenses, including the outcome of known or potential recall campaigns;
• Our ability to implement planned productivity, cost reduction, and other margin improvement initiatives; and
• Restrictive government actions by foreign countries (such as restrictions on transfer of funds and trade protection measures, including export duties and quotas and customs duties and tariffs).
Non-GAAP Financial Measures
In addition to the results reported in accordance with accounting principles generally accepted in the United States (GAAP), we have provided information regarding non-GAAP financial measures. These non-GAAP financial measures include Adjusted income (loss) from continuing operations and Adjusted diluted earnings (loss) per share from continuing operations, Adjusted EBITDA, Adjusted EBITDA margin, Free cash flow and Free cash flow from continuing operations before restructuring payments.
Adjusted income (loss) from continuing operations and Adjusted diluted earnings (loss) per share from continuing operations are defined as reported income or loss from continuing operations and reported diluted earnings or loss per share from continuing operations before restructuring expenses, asset impairment charges and other special items as determined by management. Adjusted EBITDA is defined as income (loss) from continuing operations before interest, income taxes, depreciation and amortization, non-controlling interests in consolidated joint ventures, loss on sale of receivables, restructuring expenses, asset impairment charges and other special items as determined by management. Adjusted EBITDA margin is defined as Adjusted EBITDA divided by consolidated sales. Free cash flow is defined as cash flows provided by (used for) operating activities less capital expenditures.
JOB TITLE Meritor 10-K REVISION 3 SERIAL DATE / TIME Friday, November 30, 2012 JOB NUMBER 243020 TYPE PAGE NO. 31 OPERATOR PM2
<12345678>

32
Management believes Adjusted EBITDA and Adjusted income (loss) from continuing operations are meaningful measures of performance as they are commonly utilized by management and investors to analyze ongoing operating performance and entity valuation. Management, the investment community and banking institutions routinely use Adjusted EBITDA and Adjusted EBITDA margin, together with other measures, to measure operating performance in our industry. Further, management uses Adjusted EBITDA for planning and forecasting future periods. In addition, we use Segment EBITDA as the primary basis to evaluate the performance of each of our reportable segments. Management believes that Free cash flow is useful in analyzing our ability to service and repay debt.
Adjusted income (loss) from continuing operations and Adjusted diluted earnings (loss) per share from continuing operations and Adjusted EBITDA should not be considered a substitute for the reported results prepared in accordance with GAAP and should not be considered as an alternative to net income as an indicator of our operating performance or to cash flows as a measure of liquidity. Free cash flow should not be considered a substitute for cash provided by (used for) operating activities, or other cash flow statement data prepared in accordance with GAAP, or as a measure of financial position or liquidity. In addition, these non-GAAP cash flow measures do not reflect cash used to service debt or cash received from the divestitures of businesses or sales of other assets and thus do not reflect funds available for investment or other discretionary uses. These non-GAAP financial measures, as determined and presented by the company, may not be comparable to related or similarly titled measures reported by other companies. Set forth below are reconciliations of these non-GAAP financial measures to the most directly comparable financial measures calculated in accordance with GAAP.
Adjusted income from continuing operations and Adjusted diluted earnings per share are reconciled to income from continuing operations and diluted earnings per share below (in millions, except per share amounts).
Year Ended September 30,
2012 2011 2010
Adjusted income from continuing operations. . . . . . . . . . . . . . . . . . . . . . . . . . . . . . . . . . . . . . . . $ 111 $ 82 $ 18Restructuring costs. . . . . . . . . . . . . . . . . . . . . . . . . . . . . . . . . . . . . . . . . . . . . . . . . . . . . . . . (39) (22) (6 )Gain on sale of property . . . . . . . . . . . . . . . . . . . . . . . . . . . . . . . . . . . . . . . . . . . . . . . . . . . . 16 — —Asbestos-related liability remeasurement . . . . . . . . . . . . . . . . . . . . . . . . . . . . . . . . . . . . . . . . (18) — —Gain on settlement of note receivable . . . . . . . . . . . . . . . . . . . . . . . . . . . . . . . . . . . . . . . . . . — 5 6Loss on debt extinguishment . . . . . . . . . . . . . . . . . . . . . . . . . . . . . . . . . . . . . . . . . . . . . . . . . — — (13 )Income tax benefit . . . . . . . . . . . . . . . . . . . . . . . . . . . . . . . . . . . . . . . . . . . . . . . . . . . . . . . . — — 9
Income from continuing operations . . . . . . . . . . . . . . . . . . . . . . . . . . . . . . . . . . . . . . . . . . $ 70 $ 65 $ 14
Adjusted diluted earnings per share from continuing operations. . . . . . . . . . . . . . . . . . . . . . . . . . $ 1.14 $ 0.85 $ 0.21Impact of adjustments on diluted earnings per share. . . . . . . . . . . . . . . . . . . . . . . . . . . . . . . . (0.42) (0.18) (0.05 )
Diluted earnings per share from continuing operations . . . . . . . . . . . . . . . . . . . . . . . . . . . . . . . . $ 0.72 $ 0.67 $ 0.16
Free cash flow and Free cash flow from continuing operations before restructuring payments are reconciled to cash flows provided by operating activities below (in millions).
Year Ended September 30,
2012 2011 2010
Cash provided by operating activities – continuing operations . . . . . . . . . . . . . . . . . . . . . . . . . . . . . $ (89) $ 98 $147Capital expenditures – continuing operations . . . . . . . . . . . . . . . . . . . . . . . . . . . . . . . . . . . . . . . . . 89 (105) (55 )
Free cash flow – continuing operations . . . . . . . . . . . . . . . . . . . . . . . . . . . . . . . . . . . . . . . . . . . — (7) 92Cash provided by (used for) operating activities – discontinued operations . . . . . . . . . . . . . . . . . . . . (12) (57) 64Capital expenditures – discontinued operations . . . . . . . . . . . . . . . . . . . . . . . . . . . . . . . . . . . . . . . — (6) (34 )
Free cash flow – discontinued operations. . . . . . . . . . . . . . . . . . . . . . . . . . . . . . . . . . . . . . . . . . (12) (63) 30Free cash flow – total company . . . . . . . . . . . . . . . . . . . . . . . . . . . . . . . . . . . . . . . . . . . . . . . . . $ (12) $ (70) $122
Free cash flow – continuing operations . . . . . . . . . . . . . . . . . . . . . . . . . . . . . . . . . . . . . . . . . . . . . $ — $ (7) $ 92Restructuring payments – continuing operations. . . . . . . . . . . . . . . . . . . . . . . . . . . . . . . . . . . . . . . 22 13 14
Free cash flow from continuing operations before restructuring payments . . . . . . . . . . . . . . . . . . $ 22 $ 6 $106
JOB TITLE Meritor 10-K REVISION 3 SERIAL DATE / TIME Friday, November 30, 2012 JOB NUMBER 243020 TYPE PAGE NO. 32 OPERATOR PM2
<12345678>

33
Adjusted EBITDA is reconciled to net income attributable to Meritor, Inc. in “Results of Operations” below.
Results of Operations
The following is a summary of our financial results for the last three fiscal years.
Year Ended September 30,
2012 2011 2010
(in millions, except per share amounts)
Sales: Commercial Truck. . . . . . . . . . . . . . . . . . . . . . . . . . . . . . . . . . . . . . . . . . . . . . . . . . $2,717 $2,806 $1,960Industrial . . . . . . . . . . . . . . . . . . . . . . . . . . . . . . . . . . . . . . . . . . . . . . . . . . . . . . . . 1,001 1,113 951Aftermarket & Trailer. . . . . . . . . . . . . . . . . . . . . . . . . . . . . . . . . . . . . . . . . . . . . . . . 1,011 1,020 909Intersegment Sales . . . . . . . . . . . . . . . . . . . . . . . . . . . . . . . . . . . . . . . . . . . . . . . . . (311) (317) (290 )
SALES . . . . . . . . . . . . . . . . . . . . . . . . . . . . . . . . . . . . . . . . . . . . . . . . . . . . . . . . . . . . $4,418 $4,622 $3,530SEGMENT EBITDA:
Commercial Truck. . . . . . . . . . . . . . . . . . . . . . . . . . . . . . . . . . . . . . . . . . . . . . . . . . $ 190 $ 171 $ 85Industrial . . . . . . . . . . . . . . . . . . . . . . . . . . . . . . . . . . . . . . . . . . . . . . . . . . . . . . . . 68 74 94Aftermarket & Trailer. . . . . . . . . . . . . . . . . . . . . . . . . . . . . . . . . . . . . . . . . . . . . . . . 93 113 83
SEGMENT EBITDA . . . . . . . . . . . . . . . . . . . . . . . . . . . . . . . . . . . . . . . . . . . . . . . . . . . 351 358 262Unallocated legacy and corporate costs, net (1) . . . . . . . . . . . . . . . . . . . . . . . . . . . . (6) (11) (2 )
ADJUSTED EBITDA. . . . . . . . . . . . . . . . . . . . . . . . . . . . . . . . . . . . . . . . . . . . . . . . . . . 345 347 260Interest expense, net. . . . . . . . . . . . . . . . . . . . . . . . . . . . . . . . . . . . . . . . . . . . . . . . (95) (95) (106 )Provision for income taxes. . . . . . . . . . . . . . . . . . . . . . . . . . . . . . . . . . . . . . . . . . . . (56) (77) (48 )Depreciation and amortization . . . . . . . . . . . . . . . . . . . . . . . . . . . . . . . . . . . . . . . . . (63) (66) (69 )Restructuring costs. . . . . . . . . . . . . . . . . . . . . . . . . . . . . . . . . . . . . . . . . . . . . . . . . (39) (22) (6 )Loss on sale of receivables . . . . . . . . . . . . . . . . . . . . . . . . . . . . . . . . . . . . . . . . . . . (9) (10) (3 )Gain on sale of property . . . . . . . . . . . . . . . . . . . . . . . . . . . . . . . . . . . . . . . . . . . . . 16 — —Asbestos-related liability remeasurement . . . . . . . . . . . . . . . . . . . . . . . . . . . . . . . . . (18) — —Other, net. . . . . . . . . . . . . . . . . . . . . . . . . . . . . . . . . . . . . . . . . . . . . . . . . . . . . . . . — 5 —Noncontrolling interests. . . . . . . . . . . . . . . . . . . . . . . . . . . . . . . . . . . . . . . . . . . . . . (11) (17) (14 )
INCOME FROM CONTINUING OPERATIONS, attributable to Meritor, Inc. . . . . . . . . . . . . 70 65 14LOSS FROM DISCONTINUED OPERATIONS, net of tax,
attributable to Meritor, Inc. . . . . . . . . . . . . . . . . . . . . . . . . . . . . . . . . . . . . . . . . . . (18) (2) (2 )
NET INCOME attributable to Meritor, Inc. . . . . . . . . . . . . . . . . . . . . . . . . . . . . . . . . . . . $ 52 $ 63 $ 12DILUTED EARNINGS (LOSS) PER SHARE, attributable to Meritor, Inc.
Continuing operations . . . . . . . . . . . . . . . . . . . . . . . . . . . . . . . . . . . . . . . . . . . . . . . $ 0.72 $ 0.67 $ 0.16Discontinued operations . . . . . . . . . . . . . . . . . . . . . . . . . . . . . . . . . . . . . . . . . . . . . (0.18) (0.02) (0.02 )
Diluted earnings per share. . . . . . . . . . . . . . . . . . . . . . . . . . . . . . . . . . . . . . . . . . . . . . $ 0.54 $ 0.65 $ 0.14DILUTED AVERAGE COMMON SHARES OUTSTANDING . . . . . . . . . . . . . . . . . . . . . . . . 97.2 96.9 87.6
(1) Unallocated legacy and corporate costs, net represents items that are not directly related to our business segments. These costs primarily include pension and retiree medical costs associated with recently sold businesses and other legacy costs for environmental and product liability. In fiscal year 2010, we recognized approximately $7 million of income as a result of the pension curtailment triggered by the freeze of our U.K. pension plan, of which $6 million is included in unallocated legacy and corporate costs, net.
JOB TITLE Meritor 10-K REVISION 3 SERIAL DATE / TIME Friday, November 30, 2012 JOB NUMBER 243020 TYPE PAGE NO. 33 OPERATOR PM2
<12345678>

34
Fiscal Year 2012 Compared to Fiscal Year 2011
Sales
The following table reflects total company and business segment sales for fiscal years 2012 and 2011. The reconciliation is intended to reflect the trend in business segment sales and to illustrate the impact that changes in foreign currency exchange rates, volumes and other factors had on sales (in millions). Business segment sales include intersegment sales (in millions).
Dollar Change Due To
2012 2011Dollar
Change%
Change CurrencyVolume/
Other
Sales:Commercial Truck. . . . . . . . . . . . . . . . . . . $2,717 $2,806 $ (89) (3)% $(123) $ 34Industrial . . . . . . . . . . . . . . . . . . . . . . . . . 1,001 1,113 (112) (10)% (24) (88)Aftermarket & Trailer. . . . . . . . . . . . . . . . . 1,011 1,020 (9) (1)% (23) 14Intersegment Sales . . . . . . . . . . . . . . . . . . (311) (317) 6 (2)% 21 (15)
TOTAL SALES. . . . . . . . . . . . . . . . . . . . . . . . $4,418 $4,622 $(204) (4)% $(149) $ (55)
Commercial Truck sales were $2,717 million in fiscal year 2012, down 3 percent from fiscal year 2011. The effects of foreign currency exchange rates decreased sales by $123 million compared to prior year. North American industry-wide production volumes for heavy- and medium-duty trucks increased by approximately 25 percent in fiscal year 2012 as compared to the prior year. However, the increase in sales in North America associated with the higher production volumes was substantially offset by lower sales in South America and Europe as industry-wide production volumes in these regions decreased by approximately 18 percent and 4 percent, respectively, compared to the same period in the prior year. In South America, the industry transitioned to tighter emission standard requirements for commercial vehicles resulting in lower production volumes beginning in our second quarter of fiscal year 2012. The recovery of production volumes in South America has been slower than previously expected, and we expect these production volumes to be lower in the first half of fiscal year 2013 compared to the first half of fiscal year 2012.
Industrial sales were $1,001 million in fiscal year 2012, down from $1,113 million in fiscal year 2011. The decrease in sales was due to lower sales in the Asia-Pacific region, primarily China and India, and lower sales from Caiman and other non-FMTV defense programs as compared to the same period in the prior year, partially offset by higher sales in our FMTV defense program.
Aftermarket & Trailer sales were $1,011 million in fiscal year 2012, slightly down from $1,020 million in fiscal year 2012. The decrease in sales is primarily due to the impact of foreign currency translation, which decreased sales by $23 million compared to the prior year. Excluding the effects of foreign currency, sales increased by $14 million primarily due to higher sales of aftermarket and trailer products in North America, partially offset by lower sales of aftermarket products in Europe.
Cost of Sales and Gross Profit
Cost of sales primarily represents materials, labor and overhead production costs associated with the company’s products and production facilities. Cost of sales for the fiscal year 2012 was $3,933 million compared to $4,146 million in the prior year. The decrease in costs of sales is primarily due to lower sales, which decreased by 4 percent, and the lower fixed costs resulting from the rationalization of our European manufacturing footprint as well as improvements in our operations. Total cost of sales was approximately 89.0 percent of sales in fiscal year 2012 compared to 89.7 percent in the prior year.
The following table summarizes significant factors contributing to the changes in costs of sales for the fiscal year 2012 compared to prior year (in millions):
Cost of Sales
Fiscal year ended September 30, 2011 . . . . . . . . . . . . . . . . . . . . . . . . . . . . . . . . . . . . . . . . . . . . . . . . . . . . . . . . . $4,146Volume, mix and other, net . . . . . . . . . . . . . . . . . . . . . . . . . . . . . . . . . . . . . . . . . . . . . . . . . . . . . . . . . . . . . . . . (79)Foreign exchange . . . . . . . . . . . . . . . . . . . . . . . . . . . . . . . . . . . . . . . . . . . . . . . . . . . . . . . . . . . . . . . . . . . . . . . (134)
Fiscal year ended September 30, 2012 . . . . . . . . . . . . . . . . . . . . . . . . . . . . . . . . . . . . . . . . . . . . . . . . . . . . . . . . . $3,933
JOB TITLE Meritor 10-K REVISION 3 SERIAL DATE / TIME Friday, November 30, 2012 JOB NUMBER 243020 TYPE PAGE NO. 34 OPERATOR PM2
<12345678>

35
Changes in the components of cost of sales year over year are summarized as follows (in millions):
Lower material costs. . . . . . . . . . . . . . . . . . . . . . . . . . . . . . . . . . . . . . . . . . . . . . . . . . . . . . . . . . . . . . . . . . . . . . . . $(147)Lower labor and overhead costs . . . . . . . . . . . . . . . . . . . . . . . . . . . . . . . . . . . . . . . . . . . . . . . . . . . . . . . . . . . . . . . (65)Other . . . . . . . . . . . . . . . . . . . . . . . . . . . . . . . . . . . . . . . . . . . . . . . . . . . . . . . . . . . . . . . . . . . . . . . . . . . . . . . . . . . (1)
Total decrease in costs of sales . . . . . . . . . . . . . . . . . . . . . . . . . . . . . . . . . . . . . . . . . . . . . . . . . . . . . . . . . . . . . . $(213)
Material costs represent the majority of our cost of sales and include raw materials, composed primarily of steel and purchased components. Material costs for the fiscal year 2012 decreased by approximately $147 million compared to last year, primarily as a result of lower sales.
Labor and overhead costs decreased by $65 million compared to the prior fiscal year. The decrease was primarily due to lower sales compared to the prior year. In addition, savings associated with the rationalization of our European manufacturing operations, including the sale of the St. Priest, France facility, as well as continuous improvement initiatives contributed to the decrease in labor and overhead costs.
As a result of the above, gross profit for the fiscal year 2012 was $485 million compared to $476 million in 2011. Gross margins increased to 11.0 percent for fiscal year 2012 compared to 10.3 percent in the prior year.
Other Income Statement Items
Selling, general and administrative expenses (SG&A) for the fiscal years 2012 and 2011 are summarized as follows (in millions):
2012 2011 Increase (Decrease)
Amount % of sales Amount % of sales
SG&ALoss on sale of receivables . . . . . . . . . . . . . . . . . . . $ 9 0.2% $ 10 0.2% $ (1) —Short- and long-term variable compensation . . . . . . 23 0.6% 27 0.6% (4) —Charge for legal contingency . . . . . . . . . . . . . . . . . . 6 0.1% — — 6 0.1 ptsAsbestos-related liability remeasurement . . . . . . . . . 18 0.4% — — 18 0.4 ptsAll other SG&A . . . . . . . . . . . . . . . . . . . . . . . . . . . . 229 5.2% 241 5.2% (12) —
Total SG&A. . . . . . . . . . . . . . . . . . . . . . . . . . . . . . . . . $285 6.5% $278 6.0% $ 7 0.5 pts
Included in selling, general and administrative expenses in fiscal year 2012 are $6 million of charges for a legal contingency. In fiscal year 2012, the company recognized an $18 million charge associated with the valuation and remeasurement of asbestos-related liabilities (see Critical Accounting Policies below). All other SG&A represents normal selling, general and administrative expenses.
Restructuring costs of $39 million were recognized during the fiscal year ended September 30, 2012 compared to $22 million in the prior year. Restructuring costs in the fiscal year 2012 include $24 million recognized in our Commercial Truck segment in connection with the January 2012 sale of our St. Priest, France manufacturing facility to Renault Trucks SAS. These costs included non-cash charges of $19 million recognized in the first quarter of fiscal year 2012, of which $17 million relate to impairments of assets held for sale at December 31, 2011. In addition, in fiscal year 2012, we recognized $5 million of costs associated with employee headcount reductions and facility rationalization actions. During the second quarter of fiscal year 2012, we approved a European headcount reduction plan in response to the ongoing economic weakness and uncertainty in that region and recognized approximately $7 million of restructuring costs associated with this plan in fiscal year 2012. During the fourth quarter of fiscal year 2012, we recognized approximately $5 million of costs associated with employee headcount reductions. The remaining restructuring costs recognized during the fiscal year 2012 were primarily associated with the company’s previously announced executive headcount reduction. In fiscal year 2011, we recognized $16 million of restructuring charges primarily associated with employee headcount reductions at our St. Priest, France manufacturing facility and $6 million of charges associated with executive headcount reduction at certain corporate locations.
Gain on sale of property of $16 million recognized during fiscal year 2012 is associated with the sale of excess land at our facility in Cwmbran, Wales.
JOB TITLE Meritor 10-K REVISION 3 SERIAL DATE / TIME Friday, November 30, 2012 JOB NUMBER 243020 TYPE PAGE NO. 35 OPERATOR PM2
<12345678>

36
Operating income for fiscal year 2012 was $173 million compared to $174 million in the prior year. Key items impacting operating income are previously discussed.
Equity in earnings of affiliates was $52 million in fiscal year 2012, compared to $70 million in the prior year. The decrease is due to lower earnings from our affiliates in South America as the industry transitioned to tighter emission standard requirements, and our affiliate in India, which were partially offset by higher earnings from our affiliates in North America.
Provision for income taxes was $56 million in fiscal year 2012 compared to $77 million in fiscal year 2011. The decrease in provision for income taxes was primarily due to lower earnings in taxpaying jurisdictions. Income tax expense in fiscal year 2011 was favorably impacted by a $14 million tax benefit recorded in continuing operations that was required to offset a tax expense recorded against the income in other comprehensive loss resulting from the year-end re-measurement of our retiree healthcare obligations. In fiscal year 2012, our effective tax rate was 41 percent compared to 48 percent in the prior year. Generally, we expect our effective tax rate to remain at inflated levels in the near term until we can generate income in certain jurisdictions in which we are recognizing valuation allowances against our deferred tax assets. In these jurisdictions, we are not able to recognize tax benefits related to current operating losses.
Income from continuing operations (before noncontrolling interests) for fiscal year 2012 was $81 million, compared to $82 million in the prior year. Key items impacting income from continuing operations are previously discussed.
Loss from discontinued operations was $18 million in fiscal year 2012, compared to loss of $2 million in the prior year. Significant items included in results from discontinued operations in fiscal years 2012 and 2011 include the following:
Year Ended September 30,
2012 2011
Operating income, net. . . . . . . . . . . . . . . . . . . . . . . . . . . . . . . . . . . . . . . . . . . . . . . . . . . . . . . . . . . . . . . . $ — $ 11Gain (loss) on sale of business, net . . . . . . . . . . . . . . . . . . . . . . . . . . . . . . . . . . . . . . . . . . . . . . . . . . . . . . (1) 19Restructuring costs. . . . . . . . . . . . . . . . . . . . . . . . . . . . . . . . . . . . . . . . . . . . . . . . . . . . . . . . . . . . . . . . . . (1) (9)Charge for legal contingency and indemnity obligation . . . . . . . . . . . . . . . . . . . . . . . . . . . . . . . . . . . . . . . . (10) (4)Environmental remediation charges . . . . . . . . . . . . . . . . . . . . . . . . . . . . . . . . . . . . . . . . . . . . . . . . . . . . . . (3) (4)Other, net . . . . . . . . . . . . . . . . . . . . . . . . . . . . . . . . . . . . . . . . . . . . . . . . . . . . . . . . . . . . . . . . . . . . . . . . . (6) (12)
Income (loss) before income taxes . . . . . . . . . . . . . . . . . . . . . . . . . . . . . . . . . . . . . . . . . . . . . . . . . . . . . (21) 1Benefit (provision) for income taxes . . . . . . . . . . . . . . . . . . . . . . . . . . . . . . . . . . . . . . . . . . . . . . . . . . . . . . 3 (3)
Net loss from discontinued operations attributable to Meritor, Inc. . . . . . . . . . . . . . . . . . . . . . . . . . . . . . . $ (18) $ (2)
Operating income, net from discontinued operations represents income from normal operating activities of the businesses included in discontinued operations.
Gain on sale of businesses, net: The loss on sale of business in fiscal year 2012 relates to the sale of our damper business located in Leicester, England during the first quarter. During the second quarter of fiscal year 2011, we recognized a pre-tax gain of $32 million ($32 million after-tax) on the sale of our Body Systems business and a pre-tax loss of $13 million ($13 million after tax) on the sale our Gabriel Europe business.
Restructuring costs: We recognized $1 million and $8 million of restructuring charges associated with the closure of our EU Trailer business in fiscal years 2012 and 2011, respectively. These charges were primarily related to employee severance benefits. The remaining restructuring charges in fiscal year 2011 were related to employee severance costs at our Gabriel Europe business prior to the sale in the second quarter.
Charge for legal contingency and indemnity obligation: On March 31, 2008, S&E Quick Lube, a filter distributor, filed suit in U.S. District Court for the District of Connecticut alleging that several filter manufacturers and their affiliated corporate entities, including a prior subsidiary of the company, engaged in a conspiracy to fix prices, rig bids and allocate U.S. customers for aftermarket automotive filters. This suit was a purported class action on behalf of direct purchasers of filters from the defendants. Several parallel purported class actions, including on behalf of indirect purchasers of filters, were filed by other plaintiffs in a variety of jurisdictions in the United States and Canada. The U.S. cases were consolidated into a multi-district litigation proceeding in Federal court for the Northern District of Illinois. On April 16, 2009, the Attorney General of the State of Florida filed a complaint with the U.S. District Court for the Northern District of Illinois based on these same allegations. In April 2012, the company settled
JOB TITLE Meritor 10-K REVISION 3 SERIAL DATE / TIME Friday, November 30, 2012 JOB NUMBER 243020 TYPE PAGE NO. 36 OPERATOR PM2
<12345678>

37
with the U.S. indirect purchasers for $3.1 million resolving their portion of the suit. In August 2012, the company entered into a settlement agreement for the remaining claims with the U.S. direct purchasers for $8.3 million. The liability for the settlement agreement with the U.S. direct purchasers is included in other current liabilities in the consolidated balance sheet. Following this settlement, the only remaining plaintiffs in the litigation are those who filed their actions in Canada.
Other, net: Other primarily relates to charges for changes in estimates and adjustments related to certain assets and liabilities retained from previously sold businesses and indemnities provided at the time of sale. Also included in other charges are costs associated with the sale of our EU Trailer business.
Net income attributable to noncontrolling interests for fiscal year 2012 was $11 million compared to $17 million for fiscal year 2011. Noncontrolling interests represent our minority partners’ share of income or loss associated with our less than 100 percent owned consolidated joint ventures.
Net income attributable to Meritor, Inc. was $52 million for fiscal year ended September 30, 2012 compared to $63 million for 2011. The reasons for the change are discussed above.
Segment EBITDA and EBITDA Margins
Segment EBITDA is defined as income (loss) from continuing operations before interest expense, income taxes, depreciation and amortization, noncontrolling interests in consolidated joint ventures, loss on sale of receivables, restructuring costs and asset impairment charges. We use Segment EBITDA as the primary basis for the Chief Operating Decision Maker (CODM) to evaluate the performance of each of our reportable segments.
The following table reflects Segment EBITDA and Segment EBITDA margins for fiscal year ended September 30, 2012 and 2011 (dollars in millions).
Segment EBITDA Segment EBITDA Margins
2012 2011$
Change%
Change 2012 2011 Change
Commercial Truck. . . . . . . . . . . . . . . . . . . . . . . . . . $190 $171 $ 19 11% 7.0% 6.1% 0.9ptsIndustrial . . . . . . . . . . . . . . . . . . . . . . . . . . . . . . . . 68 74 (6) (8)% 6.8% 6.6% 0.2ptsAftermarket & Trailer. . . . . . . . . . . . . . . . . . . . . . . . 93 113 (20) (18)% 9.2% 11.1% -1.9pts
Segment EBITDA . . . . . . . . . . . . . . . . . . . . . . . . $351 $358 $ (7) (2)% 7.9% 7.7% 0.2pts
Significant items impacting year over year Segment EBITDA include the following:
Commercial Truck Industrial
Aftermarket & Trailer TOTAL
Segment EBITDA – Fiscal year ended September 30, 2011 . . . . . . . . . . . . $171 $74 $113 $358Lower earnings from unconsolidated affiliates . . . . . . . . . . . . . . . . . . . . (9) (1) (8) (18)Lower pension and retiree medical costs . . . . . . . . . . . . . . . . . . . . . . . . 4 4 3 11Foreign exchange - transaction and translation. . . . . . . . . . . . . . . . . . . . (41) (6) (7) (54)Accrual for value added tax contingency . . . . . . . . . . . . . . . . . . . . . . . . — — (6) (6)Volume, mix, pricing and other, net . . . . . . . . . . . . . . . . . . . . . . . . . . . . 65 (3) (2) 60
Segment EBITDA – Fiscal year ended September 30, 2012 . . . . . . . . . . . . $190 68 93 351
Commercial Truck Segment EBITDA was $190 million in fiscal year 2012, up $19 million compared to prior year. Segment EBITDA margin increased to 7.0 percent compared to 6.1 percent in the prior year. The increase in Segment EBITDA and Segment EBITDA margin is primarily attributable to improvements in pricing, material performance and lower fixed costs resulting from the rationalization of our European manufacturing footprint, primarily the sale of our St. Priest, France manufacturing facility, in the second quarter of fiscal year 2012. In addition, North American industry-wide production volumes for heavy- and medium-duty trucks increased 25 percent in fiscal year 2012 as compared to prior year resulting in improvement in Segment EBITDA. The increase in Segment EBITDA and Segment EBITDA margin attributable to these items was partially offset by the adverse impact of geographic sales mix, including lower sales in South America, lower earnings from our unconsolidated joint ventures and
JOB TITLE Meritor 10-K REVISION 3 SERIAL DATE / TIME Friday, November 30, 2012 JOB NUMBER 243020 TYPE PAGE NO. 37 OPERATOR PM2
<12345678>

38
unfavorable foreign currency translation (primarily associated with the Brazilian Real). Industry-wide production volumes in South America decreased by approximately 18 percent in fiscal year 2012 as compared to prior year due to the impact of commercial vehicle industry transitioning to tighter emission standards.
Industrial Segment EBITDA was $68 million in fiscal year 2012, down $6 million compared to prior year. The decrease in Segment EBITDA was a result of the lower sales in the Asia-Pacific region, primarily China, and lower sales associated with the Caiman defense program, partially offset by higher sales for the FMTV defense program and the favorable impact of pricing adjustments related to products associated with certain military and non-military programs.
Aftermarket & Trailer Segment EBITDA was $93 million in fiscal year 2012, down $20 million compared to prior year. The decrease in Segment EBITDA is primarily due to deterioration in earnings related to lower volumes in our European aftermarket business, lower earnings from our unconsolidated trailer joint venture in Brazil, accrual for value added tax contingency associated with certain sales transaction and the impact of foreign currency translation.
Fiscal Year 2011 Compared to Fiscal Year 2010
Sales
The following table reflects total company and business segment sales for fiscal years 2011 and 2010. The reconciliation is intended to reflect the trend in business segment sales and to illustrate the impact that changes in foreign currency exchange rates, volumes and other factors had on sales. Business segment sales include intersegment sales (in millions).
Dollar Change Due To
2011 2010Dollar
Change%
Change CurrencyVolume/
Other
Sales:Commercial Truck. . . . . . . . . . . . . . . . . . . . . . . . $2,806 $1,960 $ 846 43% $ 70 $ 776Industrial . . . . . . . . . . . . . . . . . . . . . . . . . . . . . . 1,113 951 162 17% 31 131Aftermarket & Trailer. . . . . . . . . . . . . . . . . . . . . . 1,020 909 111 12% 21 90Intersegment Sales . . . . . . . . . . . . . . . . . . . . . . . (317) (290) (27) (9)% 5 (32)
TOTAL SALES. . . . . . . . . . . . . . . . . . . . . . . . . . . . . $4,622 $3,530 $1,092 31% $127 $ 965
Commercial Truck sales were $2,806 million in fiscal year 2011, up 43 percent from fiscal year 2010. The effect of foreign currency translation increased sales by $70 million. Excluding the effects of foreign currency, sales increased by $776 million or 40 percent. The increase in sales was primarily due to higher OE production volumes in all regions. Production volumes in the North American Class 8 commercial vehicle truck markets were higher by 52 percent compared to the prior year. European heavy- and medium-duty truck production volumes increased 53 percent compared to the prior year and South American commercial truck volumes increased approximately 17 percent.
Industrial sales were $1,113 million in fiscal year 2011, up 17 percent from fiscal year 2010. The effect of foreign currency translation increased sales by $31 million. Excluding the effects of foreign currency, sales increased by $131 million or 14 percent. The increase in sales was primarily due to higher sales in the Asia-Pacific region, which increased approximately 29 percent from the prior year, and higher sales of products associated with the Caiman defense program. The increases were partially offset by lower sales associated with the Family of Medium Tactical Vehicles (FMTV) defense program as production shifted to a new prime contractor during 2011.
Aftermarket & Trailer sales were $1,020 million in fiscal year 2011, up 12 percent from fiscal year 2010. Excluding the effects of foreign currency, sales increased by $90 million or 10 percent. The increase in sales was due to higher sales of our core aftermarket replacement products in regions across the globe and our products for trailer applications. These increases were partially offset by lower sales of our military service parts.
Cost of Sales and Gross Profit
Cost of sales primarily represents materials, labor and overhead production costs associated with the company’s products and production facilities. Cost of sales for the fiscal year ended September 30, 2011 was $4,146 million compared to $3,105 million in the prior year, representing an increase of 34 percent. The increase in costs of sales was primarily due to the increase in sales volumes discussed above.
JOB TITLE Meritor 10-K REVISION 3 SERIAL DATE / TIME Friday, November 30, 2012 JOB NUMBER 243020 TYPE PAGE NO. 38 OPERATOR PM2
<12345678>

39
Total cost of sales was approximately 89.7 percent of sales for the fiscal year ended September 30, 2011 compared to approximately 88.0 percent for the prior fiscal year.
The following table summarizes significant factors contributing to the changes in costs of sales during fiscal year 2011 compared to the prior fiscal year (in millions):
Cost of Sales
Fiscal year ended September 30, 2010 . . . . . . . . . . . . . . . . . . . . . . . . . . . . . . . . . . . . . . . . . . . . . . . . . . . . . . . . $3,105Volumes, mix and other, net . . . . . . . . . . . . . . . . . . . . . . . . . . . . . . . . . . . . . . . . . . . . . . . . . . . . . . . . . . . . . . 939Foreign exchange . . . . . . . . . . . . . . . . . . . . . . . . . . . . . . . . . . . . . . . . . . . . . . . . . . . . . . . . . . . . . . . . . . . . . . 102
Fiscal year ended September 30, 2011 . . . . . . . . . . . . . . . . . . . . . . . . . . . . . . . . . . . . . . . . . . . . . . . . . . . . . . . . $4,146
Changes in the components of cost of sales year over year are summarized as follows (in millions):
Higher material costs . . . . . . . . . . . . . . . . . . . . . . . . . . . . . . . . . . . . . . . . . . . . . . . . . . . . . . . . . . . . . . . . . . . . . $ 872Higher labor and overhead costs . . . . . . . . . . . . . . . . . . . . . . . . . . . . . . . . . . . . . . . . . . . . . . . . . . . . . . . . . . . . . 156Other, net . . . . . . . . . . . . . . . . . . . . . . . . . . . . . . . . . . . . . . . . . . . . . . . . . . . . . . . . . . . . . . . . . . . . . . . . . . . . . . 13
Total increase in costs of sales . . . . . . . . . . . . . . . . . . . . . . . . . . . . . . . . . . . . . . . . . . . . . . . . . . . . . . . . . . . . $1,041
Material costs represent the majority of our cost of sales and include raw materials, composed primarily of steel and purchased components. Material costs increased by $872 million compared to the prior year, primarily as a result of higher sales volumes, rising cost of steel, freight and other premium costs. Global steel prices increased significantly during fiscal year 2011.
Labor and overhead costs increased by $156 million compared to the prior year. The increase was primarily due to the higher sales volumes, partially offset by lower labor and overhead costs associated with continuous improvement and rationalization of operations.
As a result of the above, gross profit for the fiscal year ended September 30, 2011 was $476 million compared to $425 million in the same period last year. Gross margins decreased to 10.3 percent for the fiscal year ended September 30, 2011 compared to 12.0 percent last fiscal year.
Other Income Statement Items
Selling, general and administrative expenses (SG&A) for fiscal years 2011 and 2010 are summarized as follows (in millions):
2011 2010 Increase (Decrease)
Amount % of sales Amount % of sales
SG&A Loss on sale of receivables . . . . . . . . . . . . . . . . . . . . $ 10 0.2% $ 3 0.1% $ 7 0.1 ptsShort- and long-term variable compensation . . . . . . . 27 0.6% 57 1.6% (30) (1.0) ptsAll other SG&A . . . . . . . . . . . . . . . . . . . . . . . . . . . . . 241 5.2% 221 6.3% 20 (1.1) pts
Total SG&A. . . . . . . . . . . . . . . . . . . . . . . . . . . . . . . . . . $278 6.0% $ 281 8.0% $ (3) (2.0) pts
In fiscal year 2011, short- and long-term variable compensation pay has been accrued based on fiscal year 2011 financial results and target payout rates. All other SG&A represents normal selling, general and administrative expense. Despite the overall increase in all other SG&A expense as compared to fiscal year 2010, it has decreased as a percentage of sales compared to the prior year. This decrease in normal selling, general and administrative expenses as a percentage of sales was a result of our continuing efforts to control costs.
Restructuring costs were $22 million in fiscal year 2011 compared to $6 million in fiscal year 2010. Our Commercial Truck segment recognized $16 million and $5 million of restructuring costs related to Performance Plus actions in fiscal years 2011 and 2010, respectively. These costs were related to the rationalization of a manufacturing facility in Europe and primarily consist of employee headcount reductions and asset write-downs. The remaining restructuring costs of $6 million recognized in fiscal year 2011 were related to executive headcount reduction actions at our corporate locations. Our Industrial segment recognized $1 million of restructuring costs in fiscal year 2010.
JOB TITLE Meritor 10-K REVISION 3 SERIAL DATE / TIME Friday, November 30, 2012 JOB NUMBER 243020 TYPE PAGE NO. 39 OPERATOR PM2
<12345678>

40
Operating income for fiscal year 2011 was $174 million, compared to $132 million in fiscal year 2010. The improved operating results were a result of the items previously discussed.
Equity in earnings of affiliates was $70 million in fiscal year 2011, compared to $48 million in the prior year. The increase was due to higher earnings from our joint venture affiliates in all regions. The improved earnings were primarily due to higher volumes in their respective truck and trailer markets.
Interest expense, net was $95 million and $106 million in fiscal years 2011 and 2010, respectively. Included in interest expense, net for fiscal year 2010 was a net loss on debt extinguishment of approximately $13 million partially offset by a $6 million gain on the collection of a note receivable from the sale of our Emissions Technologies business in fiscal year 2007.
Provision for income taxes was $77 million in fiscal year 2011 compared to $48 million in fiscal year 2010. The increase in provision for income taxes was primarily due to higher income before income taxes, which increased to $159 million in fiscal year 2011 compared to $76 million in fiscal year 2010. Income tax expense in fiscal year 2011 was favorably impacted by a $14 million tax benefit recorded in continuing operations that was required to offset a tax expense recorded against the income in other comprehensive loss resulting from the year-end re-measurement of our retiree healthcare obligations. In fiscal year 2011, our effective tax rate was 48 percent compared to 63 percent in the prior year. Generally, we expect our effective tax rate to remain at inflated levels in the near term until we can generate income in certain jurisdictions in which we are recognizing valuation allowances against our deferred tax assets. In these jurisdictions, we are not able to recognize tax benefits related to current operating losses.
Income from continuing operations (before noncontrolling interests) for fiscal year 2011 was $82 million compared to $28 million in fiscal year 2010. The reasons for the improvement are previously discussed.
Loss from discontinued operations for fiscal year 2011 was $2 million, compared to a loss of $2 million in the prior year. Significant items included in results from discontinued operations in fiscal year 2011 and 2010 include the following:
Year EndedSeptember 30,
2011 2010
Operating income, net. . . . . . . . . . . . . . . . . . . . . . . . . . . . . . . . . . . . . . . . . . . . . . . . . . . . . . $ 11 $ 27Gain on sale of businesses, net . . . . . . . . . . . . . . . . . . . . . . . . . . . . . . . . . . . . . . . . . . . . . . . 19 5Long-lived asset impairment charges . . . . . . . . . . . . . . . . . . . . . . . . . . . . . . . . . . . . . . . . . . . — (2)Restructuring costs. . . . . . . . . . . . . . . . . . . . . . . . . . . . . . . . . . . . . . . . . . . . . . . . . . . . . . . . (9) (6)LVS divestiture costs . . . . . . . . . . . . . . . . . . . . . . . . . . . . . . . . . . . . . . . . . . . . . . . . . . . . . . . (1) (9)Other . . . . . . . . . . . . . . . . . . . . . . . . . . . . . . . . . . . . . . . . . . . . . . . . . . . . . . . . . . . . . . . . . . (19) (15)
Income before income taxes . . . . . . . . . . . . . . . . . . . . . . . . . . . . . . . . . . . . . . . . . . . . . . . 1 —Provision for income taxes. . . . . . . . . . . . . . . . . . . . . . . . . . . . . . . . . . . . . . . . . . . . . . . . . . . (3) (2)
Loss from discontinued operations attributable to Meritor, Inc. . . . . . . . . . . . . . . . . . . . . . . $ (2) $ (2)
Operating income, net from discontinued operations represents income from normal operating activities of businesses included in discontinued operations.
Net gain on sale of businesses: During the second quarter of fiscal year 2011, we recognized a pre-tax gain of $32 million ($32 million after tax) on the sale of our Body Systems business and a pre-tax loss of $13 million ($13 million after tax) on the sale of our Gabriel Europe business.
In October 2009, we completed the sale of our 57 percent interest in Meritor Suspension Systems Company (MSSC), a joint venture, to our joint venture partner, a subsidiary of Mitsubishi Steel Mfg. Co., LTD. In connection with the sale of our interest in MSSC, we recognized a pre-tax gain on sale of $16 million ($16 million after tax), net of estimated indemnity obligations, in the first quarter of fiscal year 2010. We also recognized $3 million of pre-tax losses ($3 million after tax) on the sale of certain other LVS businesses during the fourth quarter of fiscal year 2010. Also included in net gain on sale of businesses for the fiscal year 2010 are $8 million of charges associated with the Gabriel North America Ride Control business working capital adjustments recognized in the first quarter of fiscal year 2010.
JOB TITLE Meritor 10-K REVISION 3 SERIAL DATE / TIME Friday, November 30, 2012 JOB NUMBER 243020 TYPE PAGE NO. 40 OPERATOR PM2
<12345678>

41
Long-lived asset impairment charges: During fiscal year 2010, we recognized $2 million of long-lived asset impairment charges in our EU Trailer business.
Restructuring costs: In fiscal year 2011, we recognized $8 million of restructuring charges associated with the closure of our EU Trailer business. These charges were primarily related to employee severance benefits. The remaining restructuring charges in fiscal year 2011 were related to employee severance costs at our Gabriel Europe business prior to the sale in the second quarter. Restructuring costs recognized in fiscal year 2010 primarily relate to charges associated with actions in our Body Systems and Gabriel Europe businesses.
LVS divestiture costs are related to actions in connection with the separation of our LVS businesses and include third-party costs associated with divestiture activities.
Other: During the fourth quarter of fiscal year 2011, we recognized $2 million of losses associated with the sale of certain assets in connection with the closure of our EU Trailer business. We also recognized $4 million of costs associated with the sale of Body Systems business subsequent to the sale of this business and a charge of $4 million associated with an indemnity provided to a third party to reimburse the payment of health and prescription drug benefits to a group of retired employees. The charge was determined based on revised demographic data for the retiree population covered by the benefits. The remaining charges primarily relate to changes in estimates and adjustments related to certain assets and liabilities retained from previously sold businesses and other indemnities provided at the time of sale.
Net income attributable to noncontrolling interests was $17 million in fiscal year 2011 compared to $14 million in fiscal year 2010. Noncontrolling interests represent our minority partners’ share of income or loss associated with our less than 100 percent owned consolidated joint ventures.
Net income attributable to Meritor, Inc. was $63 million for fiscal year 2011 compared to a net income of $12 million for fiscal year 2010. The increase in income was attributable to reasons previously discussed.
Segment EBITDA and EBITDA Margins
Segment EBITDA is defined as income (loss) from continuing operations before interest expense, income taxes, depreciation and amortization, noncontrolling interests in consolidated joint ventures, loss on sale of receivables, restructuring expense and asset impairment charges. We use Segment EBITDA as the primary basis for the Chief Operating Decision Maker (CODM) to evaluate the performance of each of our reportable segments.
The following table reflects segment EBITDA and EBITDA margins for fiscal years 2011 and 2010 (dollars in millions).
Segment EBITDA Segment EBITDA Margins
2011 2010$
Change%
Change 2011 2010 Change
Commercial Truck. . . . . . . . . . . . . . . . . . . . . . . . . . . . . $171 $ 85 $ 86 101% 6.1% 4.3 % 1.8 ptsIndustrial . . . . . . . . . . . . . . . . . . . . . . . . . . . . . . . . . . . 74 94 (20) (21)% 6.6% 9.9 % (3.3) ptsAftermarket & Trailer. . . . . . . . . . . . . . . . . . . . . . . . . . . 113 83 30 36% 11.1% 9.1 % 2.0 pts
Segment EBITDA . . . . . . . . . . . . . . . . . . . . . . . . . . . $358 $262 $ 96 37% 7.7% 7.4 % 0.3 pts
Significant items impacting year-over-year segment EBITDA include the following:
CommercialTruck Industrial
Aftermarket& Trailer TOTAL
Segment EBITDA–Year ended September 30, 2010 . . . . . . . . . . . . . . . . . $ 85 $ 94 $ 83 $262Higher earnings from unconsolidated affiliates . . . . . . . . . . . . . . . . . . . 18 2 2 22Lower variable compensation costs . . . . . . . . . . . . . . . . . . . . . . . . . . . 24 7 13 44Lower pension and retiree medical costs . . . . . . . . . . . . . . . . . . . . . . . 4 7 3 14Impact of foreign currency exchange rates . . . . . . . . . . . . . . . . . . . . . . 18 2 6 26Volume, performance, mix and other, net of cost reductions . . . . . . . . . 22 (38) 6 (10)
Segment EBITDA – Year ended September 30, 2011 . . . . . . . . . . . . . . . . $171 $ 74 $113 $358
JOB TITLE Meritor 10-K REVISION 3 SERIAL DATE / TIME Friday, November 30, 2012 JOB NUMBER 243020 TYPE PAGE NO. 41 OPERATOR PM2
<12345678>

42
Commercial Truck Segment EBITDA was $171 million in fiscal year 2011 compared to $85 million in the prior fiscal year. Segment EBITDA margin increased to 6.1 percent in fiscal year 2011 compared to 4.3 percent in the prior fiscal year. The increase in Segment EBITDA was attributable to higher commercial truck production volumes in all regions compared to the prior year and higher earnings from our unconsolidated joint ventures. In addition, Segment EBITDA was favorably impacted by foreign currency translation, primarily due to the movement in Brazilian real compared to the U.S. dollar and net gains of $5 million associated with foreign currency option contracts and lower variable incentive compensation costs in the current fiscal year. The favorable impact of the higher sales volumes on Segment EBITDA margin was partially offset by the rising cost of steel and certain other costs to meet current production volumes.
Industrial Segment EBITDA was $74 million in fiscal year 2011, down $20 million compared to the prior year. Segment EBITDA margin decreased to 6.6 percent in fiscal year compared to 9.9 percent in the prior fiscal year. The favorable impact of higher sales in our Asia-Pacific region and Caiman defense program was more than offset by lower FMTV military sales compared to the prior year as production shifted to a new prime contractor during 2011. In addition, segment EBITDA in fiscal year 2011 was unfavorably impacted by rising steel and certain other costs.
Aftermarket & Trailer Segment EBITDA was $113 million in fiscal year 2011, up $30 million compared to the prior fiscal year. Segment EBITDA margin increased to 11.1 percent in the current fiscal year compared to 9.1 percent in fiscal year 2010. The increase in Segment EBITDA and Segment EBITDA margin was due to the favorable impact of a number of factors, including higher sales in our core aftermarket products, higher sales of products for trailer applications, lower variable compensation costs and the impact of foreign currency translation, partially offset by rising steel costs.
Non-Consolidated Joint Ventures
At September 30, 2012, our continuing operations included investments in 6 joint ventures that were not majority-owned or controlled and were accounted for under the equity method of accounting. Our investments in non-consolidated joint ventures totaled $169 million and $174 million at September 30, 2012 and 2011, respectively.
These strategic alliances provide for sales, product design, development and/or manufacturing in certain product and geographic areas. Aggregate sales of our non-consolidated joint ventures were $1,787 million, $1,977 million and $1,474 million in fiscal years 2012, 2011 and 2010, respectively.
Our equity in the earnings of affiliates was $52 million, $70 million and $48 million in fiscal years 2012, 2011 and 2010, respectively. We received cash dividends from our affiliates of $47 million, $45 million and $11 million in fiscal years 2012, 2011 and 2010, respectively.
For more information about our non-consolidated joint ventures, see Note 12 of the Notes to Consolidated Financial Statements in Item 8. Financial Statements and Supplementary Data.
JOB TITLE Meritor 10-K REVISION 3 SERIAL DATE / TIME Friday, November 30, 2012 JOB NUMBER 243020 TYPE PAGE NO. 42 OPERATOR PM2
<12345678>

43
Financial Condition
Cash Flows (in millions)
Fiscal Year Ended September 30,
2012 2011 2010
OPERATING CASH FLOWS Income from continuing operations . . . . . . . . . . . . . . . . . . . . . . . . . . . . . . . . . . . . . . . . . $ 81 $ 82 $ 28Adjustments to income from continuing operations:
Depreciation and amortization . . . . . . . . . . . . . . . . . . . . . . . . . . . . . . . . . . . . . . . . . . . 63 66 69Loss on debt extinguishment . . . . . . . . . . . . . . . . . . . . . . . . . . . . . . . . . . . . . . . . . . . . — — 13Deferred income tax expense (benefit) . . . . . . . . . . . . . . . . . . . . . . . . . . . . . . . . . . . . . 13 25 (16)Pension and retiree medical expense . . . . . . . . . . . . . . . . . . . . . . . . . . . . . . . . . . . . . . 53 71 81
Gain on sale of property . . . . . . . . . . . . . . . . . . . . . . . . . . . . . . . . . . . . . . . . . . . . . . . . . (16) — —Equity in earnings of affiliates . . . . . . . . . . . . . . . . . . . . . . . . . . . . . . . . . . . . . . . . . . . (52) (70) (48)Restructuring costs. . . . . . . . . . . . . . . . . . . . . . . . . . . . . . . . . . . . . . . . . . . . . . . . . . . 39 22 6
Dividends received from equity method investments . . . . . . . . . . . . . . . . . . . . . . . . . . . . . 47 45 11Pension and retiree medical contributions . . . . . . . . . . . . . . . . . . . . . . . . . . . . . . . . . . . . (140) (71) (114)Restructuring payments . . . . . . . . . . . . . . . . . . . . . . . . . . . . . . . . . . . . . . . . . . . . . . . . . (22) (13) (14)Proceeds from termination of interest rate swaps and interest on note receivable . . . . . . . . — — 19Decrease (increase) in working capital . . . . . . . . . . . . . . . . . . . . . . . . . . . . . . . . . . . . . . . 37 (177) (57)Changes in sale of receivables. . . . . . . . . . . . . . . . . . . . . . . . . . . . . . . . . . . . . . . . . . . . . (24) 144 63Other, net. . . . . . . . . . . . . . . . . . . . . . . . . . . . . . . . . . . . . . . . . . . . . . . . . . . . . . . . . . . . 10 (26) 106
Cash flows provided by continuing operations. . . . . . . . . . . . . . . . . . . . . . . . . . . . . . . . . . . . 89 98 147Cash flows provided by (used for) discontinued operations. . . . . . . . . . . . . . . . . . . . . . . . . . . (12) (57) 64
CASH FLOWS PROVIDED BY OPERATING ACTIVITIES . . . . . . . . . . . . . . . . . . . . . . . . . . . . . $ 77 $ 41 $ 211
Cash provided by operating activities for fiscal year 2012 was $77 million compared to $41 million in fiscal year 2011 and $211 million in fiscal year 2010. The increase in cash provided by operations in fiscal year 2012 compared to fiscal year 2011 was a result of improvements in working capital and lower utilization of cash flows used by discontinued operations. This impact was partially offset by higher pension and retiree medical contributions and higher restructuring payments.
The operating cash flow in fiscal year 2011 was adversely impacted by higher investments in working capital, primarily inventory and receivables, resulting from the strengthening commercial vehicle and industrial markets and variable compensation payments made in the first quarter of fiscal year 2011 relating to our fiscal year 2010 performance partially offset by lower pension and retiree medical contributions. In fiscal year 2010, we received $12 million of interest proceeds on the collection of a note receivable related to the sale of our Emissions Technologies business in fiscal year 2007 and $7 million from the termination of interest rate swaps entered into in fiscal year 2010.
Cash flow used by discontinued operations in fiscal year 2012 were $12 million compared to cash flow used of $57 million in fiscal year 2011 and cash provided of $64 million in fiscal year 2010. Cash used by discontinued operations in fiscal year 2011 primarily relates to working capital investments and the settlement of certain indemnities related to a previously divested business. Cash flows provided by discontinued operations in fiscal year 2010 were impacted by improved working capital and lower restructuring payments.
JOB TITLE Meritor 10-K REVISION 3 SERIAL DATE / TIME Friday, November 30, 2012 JOB NUMBER 243020 TYPE PAGE NO. 43 OPERATOR PM2
<12345678>

44
Fiscal Year Ended September 30,
2012 2011 2010
INVESTING CASH FLOWS Capital expenditures . . . . . . . . . . . . . . . . . . . . . . . . . . . . . . . . . . . . . . . . . . . . . . . . . . . . . $ (89) $(105) $ (55)Proceeds from sale of property . . . . . . . . . . . . . . . . . . . . . . . . . . . . . . . . . . . . . . . . . . . . . 18 — —Other investing activities, net. . . . . . . . . . . . . . . . . . . . . . . . . . . . . . . . . . . . . . . . . . . . . . . 3 2 5Net investing cash flows provided by (used for) discontinued operations. . . . . . . . . . . . . . . . 28 (69) (14)
CASH USED FOR INVESTING ACTIVITIES. . . . . . . . . . . . . . . . . . . . . . . . . . . . . . . . . . . . . . . . $ (40) $(172) $ (64)
Cash used for investing activities was $40 million in fiscal year 2012, compared to cash used of $172 million and $64 million in fiscal year 2011 and 2010, respectively. Capital expenditures were $89 million in fiscal year 2012 compared to $105 million in fiscal year 2011 and $55 million in fiscal year 2010. Proceeds from sale of property are related to the sale of excess land at our Commercial Truck facility at Cwmbran, Wales. Investing cash flows provided by discontinued operations in fiscal year 2012 include $27 million of cash received from the purchaser of our Body Systems business. We received $24 million, net of tax withholdings, of cash balances which were held at Body Systems entities in China and Brazil at the time of sale, and which the company was entitled to receive as these balances became available for distribution from those jurisdictions. We also received $3 million for the first installment on the note receivable, which was issued at the time of sale as part of the purchase consideration.
Net investing cash flows used for discontinued operations in fiscal year 2011 include $50 million related to the divestiture of our Body Systems business, including the cash outflow of $33 million of cash held at the time of sale in China and Brazil and $15 million of transaction costs. Also included in net investing cash flows used by discontinued operations in fiscal year 2011 was a $15 million capital contribution made prior to the sale of our chassis operations in Bonneval, France and $6 million capital expenditures in our Body Systems business in the first quarter of fiscal year 2011.
Cash flow used for discontinued operations in fiscal year 2010 was primarily related to capital expenditures of $33 million in our LVS businesses, offset by $10 million for the collection of the principal amount of a note receivable related to the sale of our ET business in fiscal year 2007. In addition, we received $10 million associated with the sale of certain properties and LVS businesses in fiscal year 2010.
Fiscal Year September 30,
2012 2011 2010
FINANCING CASH FLOWS Payments on new accounts receivable securitization program . . . . . . . . . . . . . . . . . . . . . . . . . $ — $ — $ (83)Payments on revolving credit facility, net . . . . . . . . . . . . . . . . . . . . . . . . . . . . . . . . . . . . . . . . — — (28)Repayment of notes and term loan. . . . . . . . . . . . . . . . . . . . . . . . . . . . . . . . . . . . . . . . . . . . . (86) — (193)Proceeds from debt issuance . . . . . . . . . . . . . . . . . . . . . . . . . . . . . . . . . . . . . . . . . . . . . . . . 100 — 245Borrowings on lines of credit and other . . . . . . . . . . . . . . . . . . . . . . . . . . . . . . . . . . . . . . . . . — — 5
Net change in debt . . . . . . . . . . . . . . . . . . . . . . . . . . . . . . . . . . . . . . . . . . . . . . . . . . . . . . 14 — (54)Issuance and debt extinguishment costs . . . . . . . . . . . . . . . . . . . . . . . . . . . . . . . . . . . . . . . . (12) — (45)Proceeds from stock issuance . . . . . . . . . . . . . . . . . . . . . . . . . . . . . . . . . . . . . . . . . . . . . . . . — — 209Other financing activities . . . . . . . . . . . . . . . . . . . . . . . . . . . . . . . . . . . . . . . . . . . . . . . . . . . . — 6 (1)Net cash used for discontinued operations . . . . . . . . . . . . . . . . . . . . . . . . . . . . . . . . . . . . . . . — — (12)
CASH PROVIDED BY FINANCING ACTIVITIES . . . . . . . . . . . . . . . . . . . . . . . . . . . . . . . . . . . . . . . $ 2 $ 6 $ 97
JOB TITLE Meritor 10-K REVISION 3 SERIAL DATE / TIME Friday, November 30, 2012 JOB NUMBER 243020 TYPE PAGE NO. 44 OPERATOR PM2
<12345678>

45
Cash provided by financing activities was $2 million in fiscal year 2012 compared to $6 million in fiscal year 2011. In the second quarter of fiscal year 2012, we retired the remaining $84 million of outstanding 8-3/4 percent notes due 2012 at par value. In the third quarter of fiscal year 2012, we entered into a new five-year term loan agreement as part of the amendment and extension of our revolving credit facility and borrowed $100 million under the term loan. During the third and fourth quarters of fiscal year 2012, we made the required repayments under the new term loan in the amount of $2 million. Further information about the term loan is discussed in “Liquidity” below. Debt issuance costs of $12 million in fiscal year 2012 were related to fees associated with the amendment and extension of our revolving credit facility and the new term loan agreement.
In the second quarter of fiscal year 2010, we issued debt and equity securities generating proceeds of $454 million. We used a portion of these proceeds to repurchase $175 million of our outstanding notes due in 2012 and pay down outstanding amounts under our revolving credit facility and our U.S. accounts receivable securitization program. We paid approximately $45 million in issuance, debt extinguishment and revolver renewal and extension costs related to the above transactions. These costs include $17 million paid in excess of par to repurchase the $175 million of 2012 notes. In addition, during the third quarter of fiscal year 2010, we purchased in the open market $17 million of our 8-3/4 percent notes due 2012 and $1 million of our 8-1/8 percent notes due 2015.
Contractual Obligations
As of September 30, 2012 we are contractually obligated to make payments as follows (in millions):
Total 2013 2014 20152016- 2017 Thereafter (2)
Total debt (1) . . . . . . . . . . . . . . . . . . . . . . . . . . . . . . . . . . . $1,112 $ 18 $11 $262 $ 71 $750Operating leases. . . . . . . . . . . . . . . . . . . . . . . . . . . . . . . . . 91 17 14 13 24 23Interest payments on long-term debt . . . . . . . . . . . . . . . . . . 507 69 69 68 97 204
Total . . . . . . . . . . . . . . . . . . . . . . . . . . . . . . . . . . . . . . . $1,710 $104 $94 $343 $192 $977
(1) See additional discussion under “Liquidity” below. Total debt excludes the unamortized gain on swap termination of $10 million, unamortized discount on convertible notes of $58 million, discount of $3 million on the 10-5/8 percent notes due March 15, 2018, and discount of $1 million on the 8-1/8 percent notes dues September 15, 2015.
(2) Includes our 4.625 percent and 4.0 percent convertible notes which contain a put and call feature that allows for earlier redemption beginning in 2016 and 2019, respectively (for further discussion, refer to Note 15 in the Notes to Consolidated Financial Statements in Item 8. Financial Statements and Supplementary Data Convertible Securities below).
We also sponsor defined benefit pension plans that cover most of our U.S. employees and certain non-U.S. employees. Our funding practice provides that annual contributions to the pension trusts will be at least equal to the minimum amounts required by ERISA in the U.S. and the actuarial recommendations or statutory requirements in other countries. Management expects funding for our retirement pension plans of approximately $73 million in fiscal year 2013.
We also sponsor retirement medical plans that cover certain of our U.S. and non-U.S. employees and retirees, including certain employees of divested businesses, and provide for medical payments to eligible employees and dependents upon retirement. Management expects retiree medical plan benefit payments of approximately $46 million in fiscal year 2013; $45 million in fiscal years 2014, 2015, and 2016; and $44 million in fiscal year 2017.
Contractual obligations identified in the table above do not include liabilities associated with uncertain tax positions of $27 million due to the high degree of uncertainty regarding the future cash outflows associated with these amounts. For additional discussion of uncertain tax positions, refer to Note 21 in the Notes to Consolidated Financial Statements in Item 8. Financial Statements and Supplementary Data.
JOB TITLE Meritor 10-K REVISION 3 SERIAL DATE / TIME Friday, November 30, 2012 JOB NUMBER 243020 TYPE PAGE NO. 45 OPERATOR PM2
<12345678>

46
Liquidity
Our outstanding debt, net of discounts where applicable, is summarized below (in millions). For a detailed discussion of terms and conditions related to this debt, see Note 15 in the Notes to Consolidated Financial Statements in Item 8. Financial Statements and Supplementary Data.
September 30,
2012 2011
Fixed-rate debt securities . . . . . . . . . . . . . . . . . . . . . . . . . . . . . . . . . . . . . . . . $ 497 $ 580Fixed-rate convertible notes. . . . . . . . . . . . . . . . . . . . . . . . . . . . . . . . . . . . . . . 500 500Term Loan . . . . . . . . . . . . . . . . . . . . . . . . . . . . . . . . . . . . . . . . . . . . . . . . . . . 98 —Unamortized discount on convertible notes. . . . . . . . . . . . . . . . . . . . . . . . . . . . (58) (68)Unamortized gain on interest rate swap termination . . . . . . . . . . . . . . . . . . . . . 10 14Lines of credit and other . . . . . . . . . . . . . . . . . . . . . . . . . . . . . . . . . . . . . . . . . 13 8
Total debt. . . . . . . . . . . . . . . . . . . . . . . . . . . . . . . . . . . . . . . . . . . . . . . . . . $1,060 $1,034
Overview — Our principal operating and capital requirements are for working capital needs, capital expenditure requirements, debt service requirements, funding of pension and retiree medical costs, restructuring and product development programs. We expect fiscal year 2013 capital expenditures to be in the range of $65 million to $75 million.
We generally fund our operating and capital needs with cash on hand, cash flow from operations, our various accounts receivable securitization and factoring arrangements and availability under our revolving credit facility. Cash in excess of local operating needs is generally used to reduce amounts outstanding, if any, under our revolving credit facility or U.S. accounts receivable securitization program. Our ability to access additional capital in the long term will depend on availability of capital markets and pricing on commercially reasonable terms as well as our credit profile at the time we are seeking funds. We continuously evaluate our capital structure to ensure the most appropriate and optimal structure and may, from time to time, retire, repurchase, exchange or redeem outstanding indebtedness, issue new equity or debt securities or enter into new lending arrangements if conditions warrant.
In February 2012, we filed a shelf registration statement with the Securities and Exchange Commission, which was amended in November 2012, registering up to $750 million of debt and/or equity securities that we may offer in one or more series on terms to be determined at the time of sale.
We believe our current financing arrangements provide us with the financial flexibility required to maintain our operations and fund future growth, including actions required to improve our market share and further diversify our global operations, through the term of our revolving credit facility, which matures in April 2017 but is subject to a springing maturity in June or November 2015 under certain circumstances (see further discussion below related to amendment and extension of our Revolving Credit Facility maturing in April 2017).
JOB TITLE Meritor 10-K REVISION 3 SERIAL DATE / TIME Friday, November 30, 2012 JOB NUMBER 243020 TYPE PAGE NO. 46 OPERATOR PM2
<12345678>

47
Sources of liquidity as of September 30, 2012, in addition to cash on hand, are as follows (in millions):
Total Facility
SizeUnused as of
9/30/12 Current Expiration
On-balance sheet arrangements:Revolving credit facility (1) . . . . . . . . . . . . . . . . . . . . . . . . . . . . . . . . . . . . . . $429 $428 April 2017 (1)Committed U.S. accounts receivable securitization (2). . . . . . . . . . . . . . . . . . 100 100 June 2015
Total on-balance sheet arrangements . . . . . . . . . . . . . . . . . . . . . . . . . . . 529 528
Off-balance sheet arrangements: (2) Swedish Factoring Facility . . . . . . . . . . . . . . . . . . . . . . . . . . . . . . . . . . . . . . 194 40 June 2013U.S. Factoring Facility . . . . . . . . . . . . . . . . . . . . . . . . . . . . . . . . . . . . . . . . . 84 18 October 2013U.K. Factoring Facility . . . . . . . . . . . . . . . . . . . . . . . . . . . . . . . . . . . . . . . . . 32 20 February 2013Italy Factoring Facility . . . . . . . . . . . . . . . . . . . . . . . . . . . . . . . . . . . . . . . . . 39 23 June 2017Other uncommitted factoring facilities . . . . . . . . . . . . . . . . . . . . . . . . . . . . . 26 19 VariousLetter of credit facility . . . . . . . . . . . . . . . . . . . . . . . . . . . . . . . . . . . . . . . . . 30 — November 2015
Total off-balance sheet arrangements . . . . . . . . . . . . . . . . . . . . . . . . . . . 405 120
Total available sources . . . . . . . . . . . . . . . . . . . . . . . . . . . . . . . . . . . . $934 $648
(1) The availability under the revolving credit facility is subject to a collateral test as discussed under “Revolving Credit Facility” below. On April 23, 2012, we entered into an agreement to amend and extend the revolving credit facility through April 2017 (with a springing maturity date of 2015 under certain circumstances). See further discussion below under “Revolving Credit Facility”.
(2) Availability subject to adequate eligible accounts receivable available for sale.
Cash and Liquidity Needs — Our cash and liquidity needs have been impacted by the level, variability and timing of our customers’ worldwide vehicle production and other factors outside of our control. At September 30, 2012, we had $257 million in cash and cash equivalents.
Our availability under the revolving credit facility is subject to a collateral test and a priority debt to EBITDA ratio covenant, as defined in the agreement, which may limit our borrowings under the agreement as of each quarter end. As long as we are in compliance with this covenant as of the quarter end, we have full availability under the revolving credit facility every other day during the quarter. Our future liquidity is subject to a number of factors, including access to adequate funding under our revolving credit facility, vehicle production schedules and customer demand and access to other borrowing arrangements such as factoring or securitization facilities. Even taking into account these and other factors, management expects to have sufficient liquidity to fund our operating requirements through the term of our revolving credit facility.
Debt Repurchase Program — On April 26, 2012, our Board of Directors approved a repurchase program for up to $150 million of any of our public debt securities (including without limitation convertible debt securities) from time to time through open market purchases or privately negotiated transactions or otherwise, subject to necessary approvals, including further approval by a specified committee of the Board. On May 24, 2012, such committee of the Board approved repurchases of up to $50 million under this program from time to time until December 15, 2012.
Revolving Credit Facility — At March 31, 2012, we had a revolving credit facility of $441 million which was slated to mature in January 2014. The availability under this facility was dependent upon various factors, including principally performance against certain financial covenants. The $441 million revolving credit facility included $100 million of availability for the issuance of letters of credit.
On April 23, 2012, we amended and restated our revolving credit facility. Pursuant to the revolving credit facility agreement as amended, we have a $429 million revolving credit facility, $14 million of which matures in January 2014 for a bank not electing to extend its commitments under the revolving credit facility existing at March 31, 2012 and the remaining $415 million of which matures in April 2017. The April 2017 maturity date is also subject to the following springing maturity conditions: if on June 1, 2015, the outstanding principal amount of our $250 million bonds due 2015 is greater than $100 million, the maturity
JOB TITLE Meritor 10-K REVISION 3 SERIAL DATE / TIME Friday, November 30, 2012 JOB NUMBER 243020 TYPE PAGE NO. 47 OPERATOR PM2
<12345678>

48
date becomes June 10, 2015, and if on November 1, 2015, the outstanding principal amount of our $300 million 4.625 percent convertibles notes due 2026 is greater than $100 million and the conversion price of $20.98 is greater than the then current Meritor common stock price, the maturity date becomes November 15, 2015. The availability under this facility is dependent upon various factors, including principally performance against certain financial covenants as highlighted below.
No borrowings were outstanding under the revolving credit facility at September 30, 2012 and 2011. The amended and extended revolving credit facility includes $100 million of availability for the issuance of letters of credit. At September 30, 2012, $1 million of letters of credit were outstanding under the revolving credit facility. No letters of credit were outstanding on September 30, 2011. At certain times during any given month, we could draw on our revolving credit facility to fund intra-month working capital needs. In such months, we would then typically utilize the cash we receive from our customers throughout the month to repay borrowings under the facility. Accordingly, during any given month, we may draw down on this facility in amounts exceeding the amounts shown as outstanding at fiscal quarter ends.
The availability under the revolving credit facility is subject to certain financial covenants based on (i) the ratio of our priority debt (consisting principally of amounts outstanding under the revolving credit facility, U.S. accounts receivable securitization and factoring programs, and third-party non-working capital foreign debt) to EBITDA and (ii) the amount of annual capital expenditures. We are required to maintain a total priority-debt-to-EBITDA ratio, as defined in the agreement, of (i) 2.50 to 1.00 as of the last day of the fiscal quarter commencing with the fiscal quarter ending on or about March 31, 2012 through and including the fiscal quarter ending on or about September 30, 2012, (ii) 2.25 to 1.00 as of the last day of each fiscal quarter commencing with the fiscal quarter ending on or about December 31, 2012 through and including the fiscal quarter ending on or about September 30, 2013, and (iii) 2.00 to 1.00 as of the last day of each fiscal quarter thereafter. At September 30, 2012, we were in compliance with all covenants under our credit agreement with a ratio of approximately 0.55x for the priority debt-to-EBITDA covenant.
Availability under the amended and extended revolving credit facility is also subject to a collateral test, pursuant to which borrowings on the revolving credit facility cannot exceed 1.0x the collateral test value. The collateral test is performed on a quarterly basis. At September 30, 2012, the revolving credit facility was collateralized by approximately $611 million of the company’s assets, primarily consisting of eligible domestic U.S. accounts receivable, inventory, plant, property and equipment, intellectual property and the company’s investment in all or a portion of certain of its wholly-owned subsidiaries.
Borrowings under the revolving credit facility are subject to interest based on quoted LIBOR rates plus a margin and a commitment fee on undrawn amounts, both of which are based upon our current corporate credit rating for the senior secured facilities. At September 30, 2012, the margin over LIBOR rate was 425 basis points, and the commitment fee was 50 basis points. Although a majority of our revolving credit loans are LIBOR based, overnight revolving credit loans are at the prime rate plus a margin of 325 basis points.
Certain of the company’s subsidiaries, as defined in the credit agreement, irrevocably and unconditionally guarantee amounts outstanding under the revolving credit facility. Similar subsidiary guarantees are provided for the benefit of the holders of the publicly-held notes outstanding under the company’s indentures (see Note 27 of the Notes to Consolidated Financial Statements in Item 8. Financial Statements and Supplementary Data).
Term Loan — As part of the amendment and restatement of our revolving credit facility, on April 23, 2012, we also entered into a $100 million term loan agreement with a maturity date of April 23, 2017. The maturity date of April 23, 2017 is also subject to the same springing maturity conditions discussed under “Revolving Credit Facility” above. The term loan will amortize over a period of 5 years from the effective date as follows: $5 million principal to be repaid during year one; $10 million principal to be repaid in each of the years two, three and four; and the remaining principal balance to be paid in year five. Principal payments will be made on a quarterly basis for the duration of the term loan. As of the effective date of the term loan, the margin over LIBOR rate was 425 basis points. We have the ability to prepay the term loan at any time without penalty or premium. At September 30, 2012, the outstanding balance of the term loan was $98 million.
New U.S. Securitization Program — On June 18, 2012, we entered into a new $100 million U.S. accounts receivables securitization facility, which expires on June 18, 2015. This program is provided by PNC Bank, National Association (PNC), as Administrator, Market Street Funding, LLC, and the other Purchasers and Purchaser Agents from time to time (participating lenders), which are party to the agreement. Under this program, we have the ability to sell an undivided percentage ownership interest in substantially all of our trade receivables (excluding the receivables due from AB Volvo and subsidiaries eligible for sale under the U.S. Factoring Facility and certain other receivables) of certain U.S. subsidiaries to ArvinMeritor Receivables Corporation (ARC), a wholly-owned, special purpose subsidiary. ARC funds these purchases with borrowings from participating lenders under a loan agreement. This program also includes a letter of credit facility pursuant to which ARC may request the issuance of letters of credit issued for our U.S. subsidiaries (originators) or their designees, which when issued will constitute a utilization of the facility
JOB TITLE Meritor 10-K REVISION 3 SERIAL DATE / TIME Friday, November 30, 2012 JOB NUMBER 243020 TYPE PAGE NO. 48 OPERATOR PM2
<12345678>

49
for the amount of letters of credit issued. Amounts outstanding under this agreement are collateralized by eligible receivables purchased by ARC and are reported as short-term debt in the consolidated balance sheet. At September 30, 2012, no amounts, including letters of credit, were outstanding under this program. This program contains a financial covenant related to our priority-debt-to-EBITDA ratio, which is identical to the corresponding covenant in our revolving credit facility as it exists on the date of the agreement. In addition, this securitization program contains a cross default to our revolving credit facility. At certain times during any given month, we may sell eligible accounts receivable under this program to fund intra-month working capital needs. In such months, we would then typically utilize the cash we receive from our customers throughout the month to repay the borrowings under the program. Accordingly, during any given month, we may borrow under this program in amounts exceeding the amounts shown as outstanding at fiscal quarter ends.
At September 30, 2011, we had a $125 million U.S. accounts receivables financing arrangement which was provided on a committed basis by a syndicate of financial institutions led by Ally Commercial Finance LLC, which was due to expire in October 2013. In connection with entering into the new U.S. Securitization Program discussed above, we terminated this receivables financing arrangement on June 18, 2012. No amounts were outstanding under this program at September 30, 2011.
Capital Leases — On March 20, 2012, we entered into an arrangement to finance equipment acquisitions at our various U.S. locations. Under this arrangement, we can request financing from GE Capital Commercial, Inc. (GE Capital) for progress payments for equipment under construction, not to exceed $10 million at any point in time. The financing rate is equal to the 30-day LIBOR plus 575 basis points per annum. Under this arrangement, we can also enter into lease arrangements with GE Capital for completed equipment. The lease term is 60 months and the lease interest rate is equal to the 5-year Swap Rate published by the Federal Reserve Board plus 564 basis points. As of September 30, 2012, we had $6 million outstanding under these arrangements.
Credit Ratings — At September 30, 2012, Standard & Poor’s corporate credit rating, senior secured credit rating, and senior unsecured credit rating for our company were B, BB- and B-, respectively. Moody’s Investors Service corporate credit rating, senior secured credit rating, and senior unsecured credit rating for our company were B2, Ba2 and B3, respectively. Any lowering of our credit ratings could increase our cost of future borrowings and could reduce our access to capital markets and result in lower trading prices for our securities.
Off-Balance Sheet Arrangements
Accounts Receivable Factoring Arrangements — We participate in accounts receivable factoring programs with total amounts utilized at September 30, 2012 of approximately $255 million, of which $248 was attributable to committed factoring facilities involving the sale of AB Volvo accounts receivables in Sweden, U.S., U.K. and Italy. The remaining amount of $7 million was related to factoring by certain of our European subsidiaries under uncommitted factoring facilities with financial institutions. The receivables under all of these programs are sold at face value and are excluded from the consolidated balance sheet. Total facility size, unused amounts and expiration dates for each of these programs are shown in the earlier table in the “Liquidity” section under “Overview.”
The Sweden and U.S. factoring facilities are backed by 364-day liquidity commitments from Nordea Bank which were renewed through October 2013. Commitments under all of our factoring facilities are subject to standard terms and conditions for these types of arrangements (including, in case of the U.K. and Italy commitments, a sole discretion clause whereby the bank retains the right to not purchase receivables, which has not been invoked since the inception of the respective programs).
Since many of our accounts receivable factoring programs support our working capital requirements in Europe, we are monitoring developments with respect to the European monetary union. If the European monetary union were to dissolve and we were unable to renegotiate our European factoring agreements or find alternative sources of funding, it could have a material adverse effect on our liquidity.
Letter of Credit Facilities — We entered into a five-year credit agreement dated as of November 18, 2010 with Citicorp USA, Inc., as administrative agent and issuing bank, the other lenders party thereto and the Bank of New York Mellon, as paying agent. Under the terms of this credit agreement, as amended, the company has the right to obtain the issuance, renewal, extension and increase of letters of credit up to an aggregate availability of $30 million. This facility contains covenants and events of default generally similar to those existing in our public debt indentures. At September 30, 2012 and 2011, we had $30 million of letters of credit outstanding under this facility. In addition, we had another $18 million and $2 million of letters of credit outstanding through other letter of credit facilities at September 30, 2012 and 2011, respectively.
JOB TITLE Meritor 10-K REVISION 3 SERIAL DATE / TIME Friday, November 30, 2012 JOB NUMBER 243020 TYPE PAGE NO. 49 OPERATOR PM2
<12345678>

50
Other — One of our consolidated joint ventures in China participates in a bills of exchange program to settle its obligations with its trade suppliers. These programs are common in China and generally require the participation of local banks. Under these programs, our joint venture issues notes payable through the participating banks to its trade suppliers. If the company does not settle the issued notes payable on their respective due dates, such non-payment could constitute an event of default under the company’s revolving credit facility if the defaulted amount exceeds $35 million.
Contingencies
Contingencies related to environmental, asbestos and other matters are discussed in Note 22 of the Notes to Consolidated Financial Statements in Item 8. Financial Statements and Supplementary Data.
Critical Accounting Policies
Critical accounting policies are those that are most important to the portrayal of the company’s financial condition and results of operations. These policies require management’s most difficult, subjective or complex judgments in the preparation of the financial statements and accompanying notes. Management makes estimates and assumptions about the effect of matters that are inherently uncertain, relating to the reporting of assets, liabilities, revenues, expenses and the disclosure of contingent assets and liabilities. Our most critical accounting policies are discussed below.
Pensions — Our pension obligations are determined annually on an actuarial basis and were measured as of September 30, 2012 and 2011. The U.S. plans include a qualified and non-qualified pension plan. The most significant non-U.S. plan is located in the United Kingdom. Other non-U.S. plans are located in Germany, Canada and Switzerland. The following are the significant assumptions used in the measurement of the projected benefit obligation (PBO) and net periodic pension expense:
2012
2011
U.S. Non-U.S. U.S. Non-U.S.
Assumptions as of September 30:Discount rate (1) . . . . . . . . . . . . . . . . . . . . . . . . . . . . . . . . . . . . 4.20% 2.10% – 4.60% 4.85% 2.25% – 5.20%Assumed return on plan assets (beginning of the year) (1)(2) . . . . 8.00% 2.50% – 7.50% 8.50% 2.50% – 8.00%
(1) The discount rate for the company’s U.K. pension plan was 4.60 percent for fiscal year 2012, and 5.00 percent for fiscal years 2011 and 2010. The assumed return on plan assets for this plan was 7.50 percent for fiscal year 2012, and 8.00 percent for fiscal years 2011 and 2010.
(2) The assumed return on plan assets for fiscal year 2013 is 8.00 percent for the U.S. plan and 7.25 percent for the U.K. plan.
The discount rate is used to calculate the present value of the PBO. The rate is determined based on high-quality fixed income investments that match the duration of expected benefit payments. The company uses a portfolio of long-term corporate AA/Aa bonds that match the duration of the expected benefit payments to establish the discount rate for this assumption.
The assumed return on plan assets is used to determine net periodic pension expense. The rate of return assumptions are based on projected long-term market returns for the various asset classes in which the plans are invested, weighted by the target asset allocations. An incremental amount for diversification, rebalancing and active management, where appropriate, is included in the rate of return assumption. The return assumption is reviewed annually.
The rate of compensation increase represents the long-term assumption for expected increases to salaries for pay-related plans.
JOB TITLE Meritor 10-K REVISION 3 SERIAL DATE / TIME Friday, November 30, 2012 JOB NUMBER 243020 TYPE PAGE NO. 50 OPERATOR PM2
<12345678>

51
These assumptions reflect our historical experience and our best judgments regarding future expectations. The effects of the indicated increase and decrease in selected assumptions, assuming no changes in benefit levels and no amortization of gains or losses for the plans in 2012, are shown below (in millions):
Effect on All Plans – September 30, 2012
Percentage
Point Change
Increase (Decrease)
in PBO
Increase (Decrease) in Pension Expense
Assumption: Discount rate . . . . . . . . . . . . . . . . . . . . . . . . . . . -0.5 pts $ 150 $ 2 +0.5 pts (137) (2)Assumed return on plan assets . . . . . . . . . . . . . . -1.0 pts NA (1) 15 +1.0 pts NA (1) (15)
(1) Not Applicable
Accounting guidance applicable to pensions does not require immediate recognition of the effects of a deviation between actual and assumed experience and the revision of an estimate. This approach allows the favorable and unfavorable effects that fall within an acceptable range to be netted and disclosed as an unrecognized gain or loss in the footnotes. Based on the September 30, 2012 and 2011 measurement dates, we had an unrecognized loss of $953 million and $888 million, respectively. A portion of this loss is amortized into earnings each fiscal year. Unrecognized losses for the U.S. and U.K. plans are being amortized into net periodic pension expense over the average life expectancy of the inactive participants of approximately 28 years.
In recognition of the long-term nature of the liabilities of the pension plans, we have targeted an asset allocation strategy designed to promote asset growth while maintaining an acceptable level of risk over the long term. Asset-liability studies are performed periodically to validate the continued appropriateness of these asset allocation targets. The asset allocation ranges for the U.S. plan are 30–50 percent equity investments, 30–50 percent fixed income investments and 10–30 percent alternative investments. Alternative investments include private equities, real estate, hedge funds and partnership interests. The target asset allocation ranges for the non-U.S. plans are 15–40 percent equity investments, 30–60 percent fixed income investments, 0–10 percent real estate and 15–40 percent alternative investments. The asset class mix and the percentage of securities in any asset class or market may vary as the risk/return characteristics of either individual market or asset classes vary over time.
The investment strategies for the pension plans are designed to achieve an appropriate diversification of investments as well as safety and security of the principal invested. Assets invested are allocated to certain global sub-asset categories within prescribed ranges in order to promote international diversification across security type, issuer type, investment style, industry group, and economic sector. Assets of the plans are both actively and passively managed. Policy limits are placed on the percentage of plan assets that can be invested in a security of any single issuer and minimum credit quality standards are established for debt securities. Meritor securities did not comprise any of the value of our worldwide pension assets as of September 30, 2012.
Based on current assumptions, the fiscal year 2013 net pension expense is estimated to be zero. In addition, in 2013, we will be winding-up and annuitizing one of our significant Canadian pension plans as required under Canadian pension rules and regulations. The one-time settlement costs related to this wind-up are expected to be in the range of $30 million to $35 million.
Retiree Medical — We have retirement medical plans that cover certain of our U.S. and non-U.S. employees and provide for medical payments to eligible employees and dependents upon retirement. Our retiree medical obligations were measured as of September 30, 2012 and September 30, 2011.
The following are the significant assumptions used in the measurement of the accumulated postretirement benefit obligation (APBO):
2012 2011
Assumptions as of September 30: Discount rate . . . . . . . . . . . . . . . . . . . . . . . . . . . . . . . . . . . 3.90% 4.60%Health care cost trend rate . . . . . . . . . . . . . . . . . . . . . . . . . 7.20% 7.50%Ultimate health care trend rate. . . . . . . . . . . . . . . . . . . . . . . 5.00% 5.00%Year ultimate rate is reached . . . . . . . . . . . . . . . . . . . . . . . . 2023 2023
JOB TITLE Meritor 10-K REVISION 3 SERIAL DATE / TIME Friday, November 30, 2012 JOB NUMBER 243020 TYPE PAGE NO. 51 OPERATOR PM2
<12345678>

52
The discount rate is the rate used to calculate the present value of the APBO. The rate is determined based on high-quality fixed income investments that match the duration of expected benefit payments. We used the corporate AA/Aa bond rate for this assumption.
The health care cost trend rate represents the company’s expected annual rates of change in the cost of health care benefits. The trend rate noted above represents a forward projection of health care costs as of the measurement date. Our projection for fiscal year 2013 is an increase in health care costs of 7.20 percent. For measurement purposes, the annual increase in health care costs was assumed to decrease gradually to 5.00 percent by fiscal year 2023 and remain at that level thereafter.
A one-percentage point change in the assumed health care cost trend rate for all years to, and including, the ultimate rate would have the following effects (in millions):
2012 2011
Effect on total of service and interest cost 1% Increase . . . . . . . . . . . . . . . . . . . . . . . . . . . . . . . . . . $ 3 $ 3 1% Decrease . . . . . . . . . . . . . . . . . . . . . . . . . . . . . . . . . (3) (2)
Effect on APBO 1% Increase . . . . . . . . . . . . . . . . . . . . . . . . . . . . . . . . . . 66 65 1% Decrease . . . . . . . . . . . . . . . . . . . . . . . . . . . . . . . . . (59) (53)
Based on current assumption, fiscal year 2013 retiree medical expense is estimated to be approximately $41 million.
Product Warranties — Our business segments record estimated product warranty costs at the time of shipment of products to customers. Liabilities for product recall campaigns are recorded at the time the company’s obligation is known and can be reasonably estimated. Product warranties, including recall campaigns, not expected to be paid within one year are recorded as a non-current liability.
Significant factors and information used by management when estimating product warranty liabilities include:
• Past claims experience;
• Sales history;
• Product manufacturing and industry developments; and
• Recoveries from third parties, where applicable.
Asbestos — Maremont Corporation (“Maremont”) — Maremont, a subsidiary of Meritor, manufactured friction products containing asbestos from 1953 through 1977, when it sold its friction product business. Arvin Industries, Inc., a predecessor of the company, acquired Maremont in 1986. Maremont and many other companies are defendants in suits brought by individuals claiming personal injuries as a result of exposure to asbestos-containing products. Maremont had approximately 5,000 and 21,000 pending asbestos-related claims at September 30, 2012 and 2011, respectively. The decrease in pending claims is primarily due to reclassification of claims to dismissed but not documented status. Although Maremont has been named in these cases, very few cases allege actual injury and, in the cases where actual injury has been alleged, very few claimants have established that a Maremont product caused their injuries. Plaintiffs’ lawyers often sue dozens or even hundreds of defendants in individual lawsuits on behalf of hundreds or thousands of claimants, seeking damages against all named defendants irrespective of the disease or injury and irrespective of any causal connection with a particular product. For these reasons, Maremont does not consider the number of claims filed or the damages alleged to be a meaningful factor in determining its asbestos-related liability.
Prior to February 2001, Maremont participated in the Center for Claims Resolution (“CCR”) and shared with other CCR members in the payment of defense and indemnity costs for asbestos-related claims. The CCR handled the resolution and processing of asbestos claims on behalf of its members until February 2001, when it was reorganized and discontinued negotiating shared settlements. Since the CCR was reorganized in 2001, Maremont has handled asbestos-related claims through its own defense counsel and has taken a more aggressive defensive approach that involves examining the merits of each asbestos-related claim. Although we expect legal defense costs to continue at higher levels than when we participated in the CCR, we believe our litigation strategy has reduced the average indemnity cost per claim.
JOB TITLE Meritor 10-K REVISION 3 SERIAL DATE / TIME Friday, November 30, 2012 JOB NUMBER 243020 TYPE PAGE NO. 52 OPERATOR PM2
<12345678>

53
Maremont engages Bates White LLC (Bates White), a consulting firm with extensive experience estimating costs associated with asbestos litigation, to assist with determining the estimated cost of resolving pending and future asbestos-related claims that have been, and could reasonably be expected to be, filed against Maremont. Bates White advised Maremont that it would be possible to determine an estimate of a reasonable forecast of the probable settlement and defense costs of resolving pending and future asbestos-related claims, based on historical data and certain assumptions with respect to events that occur in the future.
Bates White provided an estimate of the reasonably possible range of Maremont’s obligation for asbestos personal injury claims over the next ten years of $72 million to $88 million. After consultation with Bates White, Maremont determined that as of September 30, 2012 the most likely and probable liability for pending and future claims over the next ten years is $72 million. The ultimate cost of resolving pending and future claims is estimated based on the history of claims and expenses for plaintiffs represented by law firms in jurisdictions with an established history with Maremont.
The following assumptions were made by Maremont after consultation with Bates White and are included in their study:
• Pending and future claims were estimated for a ten-year period ending in fiscal year 2022. The ten-year assumption is considered appropriate as Maremont has reached certain longer-term agreements with key plaintiff law firms, and filings of mesothelioma claims have been relatively stable over the last few years resulting in an improvement in the reliability of future projections over a longer time period;
• Maremont believes that the litigation environment will change significantly beyond ten years, and that the reliability of estimates of future probable expenditures in connection with asbestos-related personal injury claims declines for each year further in the future. As a result, estimating a probable liability beyond ten years is difficult and uncertain;
• Defense and processing costs for pending and future claims will be at the level consistent with Maremont’s prior experience;
• Potential payments made to claimants from other sources, including other defendants and 524(g) trusts favorably impact Maremont’s estimated liability in the future; and
• The ultimate indemnity cost of resolving nonmalignant claims with plaintiff’s law firms in jurisdictions without an established history with Maremont cannot be reasonably estimated.
Maremont has insurance that reimburses a substantial portion of the costs incurred defending against asbestos-related claims. The coverage also reimburses Maremont for any indemnity paid on those claims. The coverage is provided by several insurance carriers based on insurance agreements in place. Incorporating historical information with respect to buy-outs and settlements of coverage, the insurance receivable related to asbestos-related liabilities is $67 million as of September 30, 2012. The difference between the estimated liability and insurance receivable is primarily related to proceeds received from settled insurance policies. Certain insurance policies have been settled in cash prior to the ultimate settlement of related asbestos liabilities. Amounts received from insurance settlements generally reduce recorded insurance receivables. No amounts have been recorded for policies in dispute.
The amounts recorded for the asbestos-related reserves and recoveries from insurance companies are based upon assumptions and estimates derived from currently known facts. All such estimates of liabilities and recoveries for asbestos-related claims are subject to considerable uncertainty because such liabilities and recoveries are influenced by variables that are difficult to predict. The future litigation environment for Maremont could change significantly from its past experience, due, for example, to changes in the mix of claims filed against Maremont in terms of plaintiffs’ law firm, jurisdiction and disease; legislative or regulatory developments; Maremont’s approach to defending claims; or payments to plaintiffs from other defendants. Estimated recoveries are influenced by coverage issues among insurers, and the continuing solvency of various insurance companies. If the assumptions with respect to the estimation period, nature of pending and future claims, the cost to resolve claims and the amount of available insurance prove to be incorrect, the actual amount of liability for Maremont’s asbestos-related claims, and the effect on the company, could differ materially from current estimates and, therefore, could have a material impact on our financial position and results of operations.
Asbestos — Rockwell International (Rockwell) — ArvinMeritor, Inc. (AM), a subsidiary of Meritor, along with many other companies, has also been named as a defendant in lawsuits alleging personal injury as a result of exposure to asbestos used in certain components of Rockwell products many years ago. Liability for these claims was transferred at the time of the spin-off of the Rockwell automotive business from Rockwell in 1997. At September 30, 2012 and 2011, there were approximately 2,500 and 4,200 pending active asbestos claims in lawsuits that name AM, together with many other companies, as defendants.
JOB TITLE Meritor 10-K REVISION 3 SERIAL DATE / TIME Friday, November 30, 2012 JOB NUMBER 243020 TYPE PAGE NO. 53 OPERATOR PM2
<12345678>

54
A significant portion of the claims do not identify any of Rockwell’s products or specify which of the claimants, if any, were exposed to asbestos attributable to Rockwell’s products, and past experience has shown that the vast majority of the claimants will likely never identify any of Rockwell’s products. Historically, AM has been dismissed from the vast majority of similar claims filed in the past with no payments to claimants. For those claimants who do show that they worked with Rockwell’s products, we nevertheless believe we have meritorious defenses, in substantial part due to the integrity of the products involved and the lack of any impairing medical condition on the part of many claimants. For these reasons, we do not consider the number of claims filed or the damages alleged to be a meaningful factor in determining asbestos-related liabilities. We defend these cases vigorously.
We engage Bates White to assist with determining whether it would be possible to estimate the cost of resolving pending and future Rockwell legacy asbestos-related claims that have been, and could reasonably be expected to be, filed against the company. Bates White provided an estimate that consisted of a range of equally likely possibilities of Rockwell’s obligation for asbestos personal injury claims over the next ten years of $37 million to $45 million. We recorded a liability of $37 million at September 30, 2012 compared to a four-year period forecast of $19 million at September 30, 2011. We began estimating the Rockwell asbestos obligation utilizing a ten-year forecast period as of September 30, 2012. We utilized a four-year forecast period through fiscal year 2011 due to significant volatility in defense and processing costs and lack of substantive history related to Rockwell asbestos claims. The ultimate cost of resolving pending and future claims is estimated based on the history of claims and expenses for plaintiffs represented by law firms in jurisdictions with an established history with Rockwell.
The following assumptions were made by the company after consultation with Bates White and are included in their study:
• Pending and future claims were estimated for a ten-year period ending in fiscal year 2022. The forecast period used to estimate a reasonably possible range of claims was increased from four years at September 30, 2011 to ten years at September 30, 2012. Rockwell has reached certain longer-term agreements with key plaintiff law firms that make payments beyond the four-year period more reasonably estimable. In addition, filings of mesothelioma claims have been relatively stable over the last few years resulting in an improvement in the reliability of future projections over a longer time period;
• The company believes that the litigation environment will change significantly beyond ten years, and that the reliability of estimates of future probable expenditures in connection with asbestos-related personal injury claims declines for each year further in the future. As a result, estimating a probable liability beyond ten years is difficult and uncertain;
• Defense and processing costs for pending and future claims, will be at the level consistent with the company’s longer-term experience and will not have the significant volatility experienced in the recent years;
• Potential payments made to claimants from other sources, including other defendants and 524(g) trusts favorably impact the company’s estimated liability in the future; and
• The ultimate indemnity cost of resolving nonmalignant claims with plaintiff’s law firms in jurisdictions without an established history with Rockwell cannot be reasonably estimated.
Rockwell maintained insurance coverage that management believes covers indemnity and defense costs, over and above self-insurance retentions, for most of these claims. The company has initiated claims against these carriers to enforce the insurance policies, which are currently being disputed. The company expects to recover some portion of defense and indemnity costs it has incurred to date, over and above self-insured retentions, and some portion of the costs for defending asbestos claims going forward. Based on consultations with its advisors and underlying analysis performed by management, the company has recorded an insurance receivable related to Rockwell legacy asbestos liabilities of $7 million and $9 million at September 30, 2012 and 2011, respectively. If the assumptions with respect to the estimation period, nature of pending and future claims, the cost to resolve claims and the amount of available insurance prove to be incorrect, the actual amount of liability for Rockwell asbestos-related claims, and the effect on the company, could differ materially from current estimates and, therefore, could have a material impact on our financial condition and results of operations.
Environmental — We record liabilities for environmental issues in the accounting period in which they are considered to be probable and the cost can be reasonably estimated. At environmental sites in which more than one potentially responsible party has been identified, we record a liability for our allocable share of costs related to our involvement with the site, as well as an allocable share of costs related to insolvent parties or unidentified shares. At environmental sites in which we are the only potentially responsible party, a liability is recorded for the total estimated costs of remediation before consideration of recovery from insurers or other third parties. The ultimate cost with respect to our environmental obligations could significantly exceed the costs we have recorded as liabilities and therefore could have a material impact on our financial condition and results of operations.
JOB TITLE Meritor 10-K REVISION 3 SERIAL DATE / TIME Friday, November 30, 2012 JOB NUMBER 243020 TYPE PAGE NO. 54 OPERATOR PM2
<12345678>

55
Significant factors considered by management when estimating environmental reserves include:
• Evaluations of current law and existing technologies;
• The outcome of discussions with regulatory agencies;
• Physical and scientific data at the site;
• Government requirements and legal standards; and
• Proposed remedies and technologies.
Goodwill — Goodwill is reviewed for impairment annually or more frequently if certain indicators arise. If business conditions or other factors cause the operating results and cash flows of a reporting unit to decline, we may be required to record impairment charges for goodwill at that time. Previous guidance required an entity to test goodwill for impairment using a two-step process on at least an annual basis. Step one consists of a comparison of the fair value of a reporting unit with its carrying amount. An impairment loss may be recognized if the review indicates that the carrying value of a reporting unit exceeds its fair value. Estimates of fair value are primarily determined by using discounted cash flows and market multiples on earnings. If the carrying amount of a reporting unit exceeds its fair value, step two requires the fair value of the reporting unit to be allocated to the underlying assets and liabilities of that reporting unit, resulting in an implied fair value of goodwill. If the carrying amount of the goodwill of the reporting unit exceeds the implied fair value, an impairment charge is recorded equal to the excess.
Under the revised guidance issued by the Financial Accounting Standards Board, an entity has the option to first assess qualitative factors to determine whether the existence of events or circumstances leads the entity to determine that it is more-likely-than-not that the fair value of its reporting units is less than its carrying amount. If after assessing the totality of events or circumstances, an entity determines that it is not more likely than not that the fair value of the reporting unit is less than its carrying amount, then the two-step impairment test is unnecessary. If the entity concludes otherwise, then it is required to test goodwill for impairment under the two-step process.
The impairment review is highly judgmental and involves the use of significant estimates and assumptions. These estimates and assumptions have a significant impact on the amount of any impairment charge recorded. Discounted cash flow methods are dependent upon assumptions of future sales trends, market conditions and cash flows of each reporting unit over several years. Actual cash flows in the future may differ significantly from those previously forecasted. Other significant assumptions include growth rates and the discount rate applicable to future cash flows.
Impairment of Long-Lived Assets — Long-lived assets, excluding goodwill, to be held and used are reviewed for impairment whenever adverse events or changes in circumstances indicate a possible impairment. An impairment loss is recognized when the long-lived assets’ carrying value exceeds the fair value. If business conditions or other factors cause the operating results and cash flows to decline, we may be required to record impairment charges at that time. Long-lived assets held for sale are recorded at the lower of their carrying amount or fair value less cost to sell. Significant judgments and estimates used by management when evaluating long-lived assets for impairment include:
• An assessment as to whether an adverse event or circumstance has triggered the need for an impairment review;
• Undiscounted future cash flows generated by the asset; and
• Probability and estimated future cash flows associated with alternative courses of action that are being considered to recover the carrying amount of a long-lived asset.
Income Taxes — Deferred income tax assets and liabilities are recognized for the future tax consequences attributable to differences between financial statement carrying amounts of existing assets and liabilities and their respective tax bases and operating loss and tax credit carryforwards. Deferred tax assets and liabilities are measured using enacted tax rates expected to apply to taxable income in the years in which those temporary differences are expected to be recovered or settled. If it is more-likely-than-not that the deferred tax asset will be realized, no valuation allowance is recorded. Management judgment is required in determining the company’s provision for income taxes, deferred tax assets and liabilities and the valuation allowance recorded against the company’s net deferred tax assets. The valuation allowance would need to be adjusted in the event future taxable income is materially different than amounts estimated. Significant judgments, estimates and factors considered by management in its determination of the probability of the realization of deferred tax assets include:
• Historical operating results;
• Expectations of future earnings;
JOB TITLE Meritor 10-K REVISION 3 SERIAL DATE / TIME Friday, November 30, 2012 JOB NUMBER 243020 TYPE PAGE NO. 55 OPERATOR PM2
<12345678>

56
• Tax planning strategies; and
• The extended period of time over which retirement medical and pension liabilities will be paid.
In prior years, the company established valuation allowances against its U.S. net deferred tax assets and the net deferred tax assets of its 100 percent owned subsidiaries including France, Germany, Italy, Sweden, U.K. and certain other countries. In evaluating the ability to recover these net deferred tax assets, the company utilizes a consistent approach which considers its three-year historical cumulative income (loss) including an assessment of the degree to which any gains or losses are driven by items that are unusual in nature. In addition, the company reviews changes in near-term market conditions and other factors that impact future operating results. Both positive and negative evidence are considered in the analysis. As of September 30, 2012, the company maintains the valuation allowances in these jurisdictions as the company believes the negative evidence continues to outweigh the positive evidence.
The expiration periods for $754 million of deferred tax assets related to net operating losses and tax credit carryforwards are as follows: $26 million between fiscal years 2013 and 2017; $248 million between fiscal years 2018 and 2027; $162 million between fiscal years 2028 and 2032; and $318 million can be carried forward indefinitely. The company has provided valuation allowances on these deferred tax assets of approximately $26 million, $246 million, $160 million and $318 million, respectively.
New Accounting Pronouncements
New accounting standards to be implemented
In June 2011, the FASB issued ASU No. 2011-05, Comprehensive Income (Topic 220): Presentation of Comprehensive Income. The new guidance allows an entity to present components of net income and other comprehensive income in one continuous statement, referred to as the statement of comprehensive income, or in two separate, but consecutive statements. The guidance eliminates the current option to report other comprehensive income and its components in the statement of changes in equity. While the new guidance changes the presentation of comprehensive income, there are no changes to the components that are recognized in net income or other comprehensive income under current accounting guidance. This new guidance is effective for fiscal years, and interim periods within those years, beginning after December 15, 2011. We plan to adopt this guidance at the beginning of the first quarter of fiscal year 2013. We do not believe the adoption of the new guidance will have a significant impact on the company’s consolidated financial statements.
In July 2012, the FASB issued ASU No. 2012-02, Intangibles - Goodwill and Other (Topic 350): Testing Indefinite-Lived Intangible Assets for Impairment. The guidance provides an option for companies to use a qualitative approach to test indefinite-lived intangible assets for impairment if certain conditions are met. The amendment is effective for annual and interim impairment tests of indefinite-lived intangible assets for fiscal years beginning after September 15, 2012. We do not believe the adoption of the new guidance will have a significant impact on the company’s consolidated financial statements.
Accounting standards implemented in fiscal year 2012
In September 2011, the Financial Accounting Standards Board (the FASB) issued Accounting Standards Update (ASU) No. 2011-08: Testing Goodwill for Impairment. Under the revised guidance, entities testing for goodwill impairment have an option of performing a qualitative assessment before calculating the fair value for the reporting unit, i.e., Step 1 of the goodwill impairment test. If an entity determines, on the basis of qualitative factors, that the fair value of the reporting unit is more-likely-than-not less than the carrying amount, the first step of the two-step impairment test would be required. If it is not more-likely-than-not that the fair value of the reporting unit is less than the carrying value, then goodwill is not considered to be impaired. ASU No. 2011-08 does not change how goodwill is calculated or assigned to reporting units, nor does it revise the requirement to test goodwill at least annually for impairment. This ASU is effective for interim and annual periods beginning after December 15, 2011 with early adoption permitted. We have adopted the revised guidance provided in this ASU effective with our second quarter of fiscal year 2012 and have started applying it accordingly. The adoption of this new guidance did not have any effect on our goodwill impairment assessments.
In May 2011, the FASB issued ASU No. 2011-04, Fair Value Measurement (Topic 820): Amendments to Achieve Common Fair Value Measurement and Disclosure Requirements in U.S. generally accepted accounting principles (GAAP) and International Financial Reporting Standards (IFRS). This ASU is intended to result in convergence between U.S. GAAP and IFRS requirements for measurement of and disclosures about fair value. The guidance amends current fair value measurement and disclosure guidance
JOB TITLE Meritor 10-K REVISION 3 SERIAL DATE / TIME Friday, November 30, 2012 JOB NUMBER 243020 TYPE PAGE NO. 56 OPERATOR PM2
<12345678>

57
to include increased transparency around valuation inputs and investment categorization. This new guidance is effective for fiscal years and interim periods beginning after December 15, 2011. We have adopted this new guidance effective with our second quarter of fiscal year 2012 and have provided required disclosures in Note 16 and 20 to the consolidated financial statements.
International Operations
Approximately 56 percent of the company’s total assets as of September 30, 2012 and 62 percent of fiscal year 2012 sales from continuing operations were outside the United States. Management believes that international operations have significantly benefited the financial performance of the company. However, our international operations are subject to a number of risks inherent in operating abroad. There can be no assurance that these risks will not have a material adverse impact on our ability to increase or maintain our foreign sales or on our financial condition or results of operations.
Item 7A. Quantitative and Qualitative Disclosures About Market Risk
We are exposed to certain global market risks, including foreign currency exchange risk and interest rate risk associated with our debt.
As a result of our substantial international operations, we are exposed to foreign currency risks that arise from our normal business operations, including in connection with our transactions that are denominated in foreign currencies. In addition, we translate sales and financial results denominated in foreign currencies into U.S. dollars for purposes of our consolidated financial statements. As a result, appreciation of the U.S. dollar against these foreign currencies generally will have a negative impact on our reported revenues and operating income while depreciation of the U.S. dollar against these foreign currencies will generally have a positive effect on reported revenues and operating income. For fiscal year 2012, our reported financial results were adversely affected by appreciation of the U.S. dollar against foreign currencies. For fiscal years 2011 and 2010, our reported financial results benefited from depreciation of the U.S. dollar against foreign currencies.
We use foreign currency forward contracts to minimize the earnings exposures arising from foreign currency exchange risk on foreign currency purchases and sales. Gains and losses on the underlying foreign currency exposures are partially offset with gains and losses on the foreign currency forward contracts. Under this cash flow hedging program, we designate the foreign currency contracts (the contracts) as cash flow hedges of underlying foreign currency forecasted purchases and sales. The effective portion of changes in the fair value of the contracts is recorded in Accumulated Other Comprehensive Loss (AOCL) in the statement of shareowners’ equity and is recognized in operating income when the underlying forecasted transaction impacts earnings. The contracts generally mature within 12 months.
We generally have not hedged against our foreign currency exposure related to translations to U.S. dollars of our financial results denominated in foreign currencies. However, in the fourth quarter of fiscal years 2011 and 2010, due to the volatility of the Brazilian real as compared to the U.S. dollar, we entered into foreign currency option contracts to reduce volatility in the translation of Brazilian real earnings to U.S. dollars. Gains and losses on these option contracts are recorded in other income (expense), net, in the consolidated statement of income, generally reducing the exposure to translation volatility during a full-year period. During fiscal year 2011, we recognized net gains of approximately $5 million associated with our Brazilian real foreign currency option contracts, which is included in other income in the consolidated statement of income. We did not have any outstanding option contracts at September 30, 2012.
Interest rate risk relates to the gain/increase or loss/decrease we could incur in our debt balances and interest expense. To manage this risk, we enter into interest rate swaps from time to time to economically convert portions of our fixed-rate debt into floating rate exposure, ensuring that the sensitivity of the economic value of debt falls within our corporate risk tolerances. It is our policy not to enter into derivative instruments for speculative purposes, and therefore, we hold no derivative instruments for trading purposes. In the fourth quarter of fiscal year 2012, we entered into a four-year interest rate swap arrangement whereby we convert the variable interest rate on our term-loan expressed as LIBOR-rate into a variable interest rate based on U.S. federal funds rate. The notional amount of the arrangement is $50 million, which is approximately 50-percent of the amount outstanding under our term-loan. The arrangement does not meet the hedge accounting requirements, therefore, the mark-to-market adjustments related to the fair value of derivative are recorded as interest expense in the consolidated statement of income.
JOB TITLE Meritor 10-K REVISION 3 SERIAL DATE / TIME Friday, November 30, 2012 JOB NUMBER 243020 TYPE PAGE NO. 57 OPERATOR PM2
<12345678>

58
Included below is a sensitivity analyses to measure the potential gain (loss) in the fair value of financial instruments with exposure to market risk. The model assumes a 10% hypothetical change (increase or decrease) in exchange rates and instantaneous, parallel shifts of 50 basis points in interest rates.
Market Risk
Assuming a 10% Increase
in Rates
Assuming a 10% Decrease
in Rates
Increase /(Decrease)
In
Foreign Currency Sensitivity: Forward contracts in USD (1). . . . . . . . . . . . . . . . . . . . . . . . . . . . . . . . . . 1.4 (1.4) Fair ValueForeign currency denominated debt . . . . . . . . . . . . . . . . . . . . . . . . . . . . . 0.7 (0.7) Fair ValueForward contracts in EUR (1) . . . . . . . . . . . . . . . . . . . . . . . . . . . . . . . . . . (4.7) 4.7 Fair Value
Assuming a 50 BPS Increase
in Rates
Assuming a 50 BPS Decrease
in Rates
Increase /(Decrease)
In
Interest Rate Sensitivity:Debt - fixed rate . . . . . . . . . . . . . . . . . . . . . . . . . . . . . . . . . . . . . . . . . . . $(28.7) $30.2 Fair ValueDebt - variable rate . . . . . . . . . . . . . . . . . . . . . . . . . . . . . . . . . . . . . . . . . $(0.5) $0.5 Cash Flow
(1) Includes only the risk related to the derivative instruments and does not include the risk related to the underlying exposure. The analysis assumes overall derivative instruments and debt levels remain unchanged for each hypothetical scenario.
At September 30, 2012 a 10% decrease in quoted currency exchange rates would result in a potential loss of approximately $0.7 million in foreign currency denominated debt.
At September 30, 2012 the fair value of debt outstanding was approximately $1,053 million. A 50 basis points decrease in quoted interest rates would result in an increase of $30 million in the fair value of fixed-rate debt.
JOB TITLE Meritor 10-K REVISION 3 SERIAL DATE / TIME Friday, November 30, 2012 JOB NUMBER 243020 TYPE PAGE NO. 58 OPERATOR PM2
<12345678>

59
Item 8. Financial Statements and Supplementary Data.
REPORT OF INDEPENDENT REGISTERED PUBLIC ACCOUNTING FIRM
To the Board of Directors and Shareowners of Meritor, Inc.Troy, Michigan
We have audited the accompanying consolidated balance sheets of Meritor, Inc. and subsidiaries (the “Company”) as of September 30, 2012 and October 2, 2011, and the related consolidated statements of income, equity (deficit), and cash flows for each of the three years in the period ended September 30, 2012. Our audits also included the financial statement schedule listed in the Index at Item 15(a)(2). These financial statements and financial statement schedule are the responsibility of the Company’s management. Our responsibility is to express an opinion on the financial statements and financial statement schedule based on our audits.
We conducted our audits in accordance with the standards of the Public Company Accounting Oversight Board (United States). Those standards require that we plan and perform the audit to obtain reasonable assurance about whether the financial statements are free of material misstatement. An audit includes examining, on a test basis, evidence supporting the amounts and disclosures in the financial statements. An audit also includes assessing the accounting principles used and significant estimates made by management, as well as evaluating the overall financial statement presentation. We believe that our audits provide a reasonable basis for our opinion.
In our opinion, such consolidated financial statements present fairly, in all material respects, the financial position of Meritor, Inc. and subsidiaries as of September 30, 2012 and October 2, 2011, and the results of their operations and their cash flows for each of the three years in the period ended September 30, 2012, in conformity with accounting principles generally accepted in the United States of America. Also, in our opinion, such financial statement schedule, when considered in relation to the basic consolidated financial statements taken as a whole, presents fairly, in all material respects, the information set forth therein.
We have also audited, in accordance with the standards of the Public Company Accounting Oversight Board (United States), the Company’s internal control over financial reporting as of September 30, 2012, based on the criteria established in Internal Control—Integrated Framework issued by the Committee of Sponsoring Organizations of the Treadway Commission and our report dated November 21, 2012 expressed an unqualified opinion on the Company’s internal control over financial reporting.
/s/ DELOITTE & TOUCHE LLP DELOITTE & TOUCHE LLP
Detroit, MichiganNovember 21, 2012
JOB TITLE Meritor 10-K REVISION 3 SERIAL DATE / TIME Friday, November 30, 2012 JOB NUMBER 243020 TYPE PAGE NO. 59 OPERATOR PM2
<12345678>

60
MERITOR, INC.
CONSOLIDATED STATEMENT OF INCOME (In millions, except per share amounts)
See Notes to Consolidated Financial Statements.
Year Ended September 30,
2012 2011 2010
Sales . . . . . . . . . . . . . . . . . . . . . . . . . . . . . . . . . . . . . . . . . . . . . . . . . . . . . . . . . . . . . $ 4,418 $ 4,622 $ 3,530Cost of sales. . . . . . . . . . . . . . . . . . . . . . . . . . . . . . . . . . . . . . . . . . . . . . . . . . . . . . . . (3,933) (4,146) (3,105)GROSS MARGIN. . . . . . . . . . . . . . . . . . . . . . . . . . . . . . . . . . . . . . . . . . . . . . . . . . . . . 485 476 425
Selling, general and administrative. . . . . . . . . . . . . . . . . . . . . . . . . . . . . . . . . . . . . . (285) (278) (281)Restructuring costs. . . . . . . . . . . . . . . . . . . . . . . . . . . . . . . . . . . . . . . . . . . . . . . . . (39) (22) (6)Gain on sale of property . . . . . . . . . . . . . . . . . . . . . . . . . . . . . . . . . . . . . . . . . . . . . 16 — —Other operating expense, net. . . . . . . . . . . . . . . . . . . . . . . . . . . . . . . . . . . . . . . . . . (4) (2) (6)
OPERATING INCOME . . . . . . . . . . . . . . . . . . . . . . . . . . . . . . . . . . . . . . . . . . . . . . . . . 173 174 132Other income, net. . . . . . . . . . . . . . . . . . . . . . . . . . . . . . . . . . . . . . . . . . . . . . . . . . 7 10 2Equity in earnings of affiliates . . . . . . . . . . . . . . . . . . . . . . . . . . . . . . . . . . . . . . . . . 52 70 48Interest expense, net. . . . . . . . . . . . . . . . . . . . . . . . . . . . . . . . . . . . . . . . . . . . . . . . (95) (95) (106)
INCOME BEFORE INCOME TAXES . . . . . . . . . . . . . . . . . . . . . . . . . . . . . . . . . . . . . . . . 137 159 76Provision for income taxes. . . . . . . . . . . . . . . . . . . . . . . . . . . . . . . . . . . . . . . . . . . . (56) (77) (48)
INCOME FROM CONTINUING OPERATIONS . . . . . . . . . . . . . . . . . . . . . . . . . . . . . . . . . 81 82 28LOSS FROM DISCONTINUED OPERATIONS, net of tax . . . . . . . . . . . . . . . . . . . . . . . . . (18) (2) (2)NET INCOME . . . . . . . . . . . . . . . . . . . . . . . . . . . . . . . . . . . . . . . . . . . . . . . . . . . . . . . 63 80 26Less: Net income attributable to noncontrolling interests . . . . . . . . . . . . . . . . . . . . . . . . (11) (17) (14)
NET INCOME ATTRIBUTABLE TO MERITOR, INC.. . . . . . . . . . . . . . . . . . . . . . . . . . . . . $ 52 $ 63 $ 12NET INCOME (LOSS) ATTRIBUTABLE TO MERITOR, INC.
Net income from continuing operations . . . . . . . . . . . . . . . . . . . . . . . . . . . . . . . . . . $ 70 $ 65 $ 14Loss from discontinued operations. . . . . . . . . . . . . . . . . . . . . . . . . . . . . . . . . . . . . . (18) (2) (2)
Net income. . . . . . . . . . . . . . . . . . . . . . . . . . . . . . . . . . . . . . . . . . . . . . . . . . . . . . . $ 52 $ 63 $ 12BASIC EARNINGS (LOSS) PER SHARE
Continuing operations . . . . . . . . . . . . . . . . . . . . . . . . . . . . . . . . . . . . . . . . . . . . . . . $ 0.73 $ 0.69 $ 0.16Discontinued operations . . . . . . . . . . . . . . . . . . . . . . . . . . . . . . . . . . . . . . . . . . . . . (0.19) (0.02) (0.02)
Basic earnings per share. . . . . . . . . . . . . . . . . . . . . . . . . . . . . . . . . . . . . . . . . . . . . $ 0.54 $ 0.67 $ 0.14DILUTED EARNINGS (LOSS) PER SHARE
Continuing operations . . . . . . . . . . . . . . . . . . . . . . . . . . . . . . . . . . . . . . . . . . . . . . . $ 0.72 $ 0.67 $ 0.16Discontinued operations . . . . . . . . . . . . . . . . . . . . . . . . . . . . . . . . . . . . . . . . . . . . . (0.18) (0.02) (0.02)
Diluted earnings per share. . . . . . . . . . . . . . . . . . . . . . . . . . . . . . . . . . . . . . . . . . . . $ 0.54 $ 0.65 $ 0.14
Basic average common shares outstanding . . . . . . . . . . . . . . . . . . . . . . . . . . . . . . . . . 95.9 94.1 84.7
Diluted average common shares outstanding . . . . . . . . . . . . . . . . . . . . . . . . . . . . . . . . 97.2 96.9 87.6
JOB TITLE Meritor 10-K REVISION 3 SERIAL DATE / TIME Friday, November 30, 2012 JOB NUMBER 243020 TYPE PAGE NO. 60 OPERATOR PM2
<12345678>

61
See Notes to Consolidated Financial Statements.
MERITOR, INC.
CONSOLIDATED BALANCE SHEET (In millions)
September 30,
2012 2011
ASSETS CURRENT ASSETS:
Cash and cash equivalents . . . . . . . . . . . . . . . . . . . . . . . . . . . . . . . . . . . . . . . . . . . . . . . . . . . . . . $ 257 $ 217Receivables, trade and other, net. . . . . . . . . . . . . . . . . . . . . . . . . . . . . . . . . . . . . . . . . . . . . . . . . . 542 712Inventories . . . . . . . . . . . . . . . . . . . . . . . . . . . . . . . . . . . . . . . . . . . . . . . . . . . . . . . . . . . . . . . . . . 438 460Other current assets . . . . . . . . . . . . . . . . . . . . . . . . . . . . . . . . . . . . . . . . . . . . . . . . . . . . . . . . . . . 61 70
TOTAL CURRENT ASSETS . . . . . . . . . . . . . . . . . . . . . . . . . . . . . . . . . . . . . . . . . . . . . . . . . . . . 1,298 1,459NET PROPERTY . . . . . . . . . . . . . . . . . . . . . . . . . . . . . . . . . . . . . . . . . . . . . . . . . . . . . . . . . . . . . . . . 417 421GOODWILL. . . . . . . . . . . . . . . . . . . . . . . . . . . . . . . . . . . . . . . . . . . . . . . . . . . . . . . . . . . . . . . . . . . . 433 431OTHER ASSETS . . . . . . . . . . . . . . . . . . . . . . . . . . . . . . . . . . . . . . . . . . . . . . . . . . . . . . . . . . . . . . . . 353 352
TOTAL ASSETS . . . . . . . . . . . . . . . . . . . . . . . . . . . . . . . . . . . . . . . . . . . . . . . . . . . . . . . . . . . . $ 2,501 $ 2,663
LIABILITIES AND EQUITY (DEFICIT) CURRENT LIABILITIES:
Short-term debt . . . . . . . . . . . . . . . . . . . . . . . . . . . . . . . . . . . . . . . . . . . . . . . . . . . . . . . . . . . . . . $ 18 $ 84Accounts and notes payable . . . . . . . . . . . . . . . . . . . . . . . . . . . . . . . . . . . . . . . . . . . . . . . . . . . . . 697 841Other current liabilities . . . . . . . . . . . . . . . . . . . . . . . . . . . . . . . . . . . . . . . . . . . . . . . . . . . . . . . . . 313 328
TOTAL CURRENT LIABILITIES . . . . . . . . . . . . . . . . . . . . . . . . . . . . . . . . . . . . . . . . . . . . . . . . . . 1,028 1,253LONG-TERM DEBT . . . . . . . . . . . . . . . . . . . . . . . . . . . . . . . . . . . . . . . . . . . . . . . . . . . . . . . . . . . . . . 1,042 950RETIREMENT BENEFITS . . . . . . . . . . . . . . . . . . . . . . . . . . . . . . . . . . . . . . . . . . . . . . . . . . . . . . . . . . 1,075 1,096OTHER LIABILITIES. . . . . . . . . . . . . . . . . . . . . . . . . . . . . . . . . . . . . . . . . . . . . . . . . . . . . . . . . . . . . . 338 325EQUITY (DEFICIT):
Common stock (September 30, 2012 and 2011, 96.5 and 94.6 shares issued and outstanding, respectively). . . . . . . . . . . . . . . . . . . . . . . . . . . . . . . . . . . . . . . . . . . . . 96 94
Additional paid-in capital. . . . . . . . . . . . . . . . . . . . . . . . . . . . . . . . . . . . . . . . . . . . . . . . . . . . . . . . 901 897Accumulated deficit . . . . . . . . . . . . . . . . . . . . . . . . . . . . . . . . . . . . . . . . . . . . . . . . . . . . . . . . . . . (1,105) (1,157)Accumulated other comprehensive loss . . . . . . . . . . . . . . . . . . . . . . . . . . . . . . . . . . . . . . . . . . . . . (915) (829)
Total deficit attributable to Meritor, Inc. . . . . . . . . . . . . . . . . . . . . . . . . . . . . . . . . . . . . . . . . . . . (1,023) (995)Noncontrolling interests. . . . . . . . . . . . . . . . . . . . . . . . . . . . . . . . . . . . . . . . . . . . . . . . . . . . . . . . . 41 34
TOTAL DEFICIT. . . . . . . . . . . . . . . . . . . . . . . . . . . . . . . . . . . . . . . . . . . . . . . . . . . . . . . . . . . . . (982) (961)
TOTAL LIABILITIES AND DEFICIT . . . . . . . . . . . . . . . . . . . . . . . . . . . . . . . . . . . . . . . . . . . . . . . $ 2,501 $ 2,663
JOB TITLE Meritor 10-K REVISION 3 SERIAL DATE / TIME Friday, November 30, 2012 JOB NUMBER 243020 TYPE PAGE NO. 61 OPERATOR PM2
<12345678>

62
See Notes to Consolidated Financial Statements.
MERITOR, INC.
CONSOLIDATED STATEMENT OF CASH FLOWS (In millions)
Year Ended September 30,
2012 2011 2010
OPERATING ACTIVITIES CASH PROVIDED BY OPERATING ACTIVITIES (see Note 25) . . . . . . . . . . . . . . . . . . . . . . . . $ 77 $ 41 $ 211
INVESTING ACTIVITIES Capital expenditures . . . . . . . . . . . . . . . . . . . . . . . . . . . . . . . . . . . . . . . . . . . . . . . . . . . . . (89) (105) (55)Proceeds from sale of property . . . . . . . . . . . . . . . . . . . . . . . . . . . . . . . . . . . . . . . . . . . . . 18 — —Other investing cash flows. . . . . . . . . . . . . . . . . . . . . . . . . . . . . . . . . . . . . . . . . . . . . . . . . 3 2 5
Net investing cash flows used for continuing operations . . . . . . . . . . . . . . . . . . . . . . . . . (68) (103) (50)
Net investing cash flows provided by (used for) discontinued operations. . . . . . . . . . . . . . . . 28 (69) (14)
CASH USED FOR INVESTING ACTIVITIES. . . . . . . . . . . . . . . . . . . . . . . . . . . . . . . . . . . . . . (40) (172) (64)FINANCING ACTIVITIES
Proceeds from debt issuance . . . . . . . . . . . . . . . . . . . . . . . . . . . . . . . . . . . . . . . . . . . . 100 — 245Repayment of notes and term loan . . . . . . . . . . . . . . . . . . . . . . . . . . . . . . . . . . . . . . . . (86) — (193)Payments on accounts receivable securitization program . . . . . . . . . . . . . . . . . . . . . . . . — — (83)Payments on revolving credit facility, net . . . . . . . . . . . . . . . . . . . . . . . . . . . . . . . . . . . . — — (28)Borrowings on lines of credit and other . . . . . . . . . . . . . . . . . . . . . . . . . . . . . . . . . . . . . — — 5
Net change in debt . . . . . . . . . . . . . . . . . . . . . . . . . . . . . . . . . . . . . . . . . . . . . . . . . . . . . . 14 — (54)Proceeds from stock issuance . . . . . . . . . . . . . . . . . . . . . . . . . . . . . . . . . . . . . . . . . . . . . . — — 209Debt and stock issuance and debt extinguishment costs . . . . . . . . . . . . . . . . . . . . . . . . . . . (12) — (45)Other financing cash flows . . . . . . . . . . . . . . . . . . . . . . . . . . . . . . . . . . . . . . . . . . . . . . . . — 6 (1)
Net financing cash flows provided by continuing operations. . . . . . . . . . . . . . . . . . . . . . . 2 6 109Net financing cash flows used for discontinued operations . . . . . . . . . . . . . . . . . . . . . . . . . — — (12)CASH PROVIDED BY FINANCING ACTIVITIES. . . . . . . . . . . . . . . . . . . . . . . . . . . . . . . . . . . 2 6 97
EFFECT OF CURRENCY EXCHANGE RATES ON CASH AND CASH EQUIVALENTS . . . . . . . . . . 1 (1) 4CHANGE IN CASH AND CASH EQUIVALENTS. . . . . . . . . . . . . . . . . . . . . . . . . . . . . . . . . . . . . 40 (126) 248CASH AND CASH EQUIVALENTS AT BEGINNING OF YEAR . . . . . . . . . . . . . . . . . . . . . . . . . . . 217 343 95
CASH AND CASH EQUIVALENTS AT END OF YEAR . . . . . . . . . . . . . . . . . . . . . . . . . . . . . . . . $257 $ 217 $ 343
JOB TITLE Meritor 10-K REVISION 3 SERIAL DATE / TIME Friday, November 30, 2012 JOB NUMBER 243020 TYPE PAGE NO. 62 OPERATOR PM2
<12345678>

63
See Notes to Consolidated Financial Statements.
MERITOR, INC.
CONSOLIDATED STATEMENT OF EQUITY (DEFICIT) (In millions)
CommonStock
AdditionalPaid-inCapital
AccumulatedDeficit
AccumulatedOther
ComprehensiveLoss
Total DeficitAttributable to
Meritor, Inc.
Non-controllingInterests Total
Beginning balance at September 30, 2011 . . . . . . . . . . . . . $94 $ 897 $(1,157) $ (829) $ (995) $ 34 $ (961)
Net income. . . . . . . . . . . . . . . . . . . . . . . . . . . . . . . . . . . . . — — 52 — 52 11 63
Foreign currency translation adjustments . . . . . . . . . . . . . . — — — (17) (17) (1) (18)
Employee benefit adjustments (net of tax of $2). . . . . . . . . . — — — (68) (68) — (68)
Other . . . . . . . . . . . . . . . . . . . . . . . . . . . . . . . . . . . . . . . . . — — — (1) (1) — (1)
Comprehensive income (loss) . . . . . . . . . . . . . . . . . . . . (34) 10 (24)
Issuance of restricted stock . . . . . . . . . . . . . . . . . . . . . . . . 2 (2) — — — — —
Equity based compensation expense. . . . . . . . . . . . . . . . . . — 6 — — 6 — 6
Non-controlling interest dividends . . . . . . . . . . . . . . . . . . . . — — — — — (3) (3)
Ending balance at September 30, 2012 . . . . . . . . . . . . . . . . $96 $ 901 $(1,105) $ (915) $(1,023) $ 41 $ (982)
Beginning balance at September 30, 2010 . . . . . . . . . . . . . $92 $ 886 $(1,220) $ (812) $(1,054) $ 31 $(1,023)
Net income. . . . . . . . . . . . . . . . . . . . . . . . . . . . . . . . . . . . . — — 63 — 63 17 80
Foreign currency translation adjustments . . . . . . . . . . . . . . — — — (7) (7) — (7)
Impact of sale of business. . . . . . . . . . . . . . . . . . . . . . . . . . — — — (53) (53) — (53)
Employee benefit adjustments (net of tax of $2). . . . . . . . . . — — — 44 44 — 44
Other . . . . . . . . . . . . . . . . . . . . . . . . . . . . . . . . . . . . . . . . . — — — (1) (1) — (1)
Comprehensive income . . . . . . . . . . . . . . . . . . . . . . . . . 46 17 63
Equity based compensation expense. . . . . . . . . . . . . . . . . . — 7 — — 7 — 7
Exercise of stock options . . . . . . . . . . . . . . . . . . . . . . . . . . 2 4 — — 6 — 6
Non-controlling interest dividends . . . . . . . . . . . . . . . . . . . . — — — — — (14) (14)
Ending balance at September 30, 2011 . . . . . . . . . . . . . . . . $94 $ 897 $(1,157) $ (829) $ (995) $ 34 $ (961)
Beginning balance at September 30, 2009 . . . . . . . . . . . . . $72 $ 699 $(1,232) $ (734) $(1,195) $ 29 $(1,166)
Net income. . . . . . . . . . . . . . . . . . . . . . . . . . . . . . . . . . . . . — — 12 — 12 14 26
Foreign currency translation adjustments . . . . . . . . . . . . . . — — — 44 44 — 44
Impact of sale of business. . . . . . . . . . . . . . . . . . . . . . . . . . — — — 31 31 — 31
Employee benefit adjustments (net of tax of $2). . . . . . . . . . — — — (157) (157) — (157)
Other . . . . . . . . . . . . . . . . . . . . . . . . . . . . . . . . . . . . . . . . . — — — 4 4 — 4
Comprehensive income (loss) . . . . . . . . . . . . . . . . . . . . (66) 14 (52)
Issuance of common stock . . . . . . . . . . . . . . . . . . . . . . . . . 20 180 — — 200 — 200
Equity based compensation expense. . . . . . . . . . . . . . . . . . — 7 — — 7 — 7
Non-controlling interest dividends . . . . . . . . . . . . . . . . . . . . — — — — — (12) (12)
Ending balance at September 30, 2010 . . . . . . . . . . . . . . . . $92 $ 886 $(1,220) $ (812) $(1,054) $ 31 $(1,023)
JOB TITLE Meritor 10-K REVISION 3 SERIAL DATE / TIME Friday, November 30, 2012 JOB NUMBER 243020 TYPE PAGE NO. 63 OPERATOR PM2
<12345678>

64
MERITOR, INC.
NOTES TO CONSOLIDATED FINANCIAL STATEMENTS
1. BASIS OF PRESENTATION
Meritor, Inc. (the “company” or “Meritor”), headquartered in Troy, Michigan, is a premier global supplier of a broad range of integrated systems and components to original equipment manufacturers (“OEMs”) and the aftermarket for the commercial vehicle, transportation and industrial sectors. The company serves commercial truck, trailer, off-highway, military, bus and coach and other industrial OEMs and certain aftermarkets. The consolidated financial statements are those of the company and its consolidated subsidiaries.
Certain businesses are reported in discontinued operations in the consolidated statement of operations, statement of cash flows and related notes for all periods presented. Additional information regarding discontinued operations is discussed in Note 3.
The company’s fiscal year ends on the Sunday nearest September 30. The 2012, 2011 and 2010 fiscal years ended on September 30, 2012, October 2, 2011, and October 3, 2010. All year and quarter references relate to the company’s fiscal year and fiscal quarters, unless otherwise stated. For ease of presentation, September 30 is used consistently throughout this report to represent the fiscal year end.
The company has evaluated subsequent events through the date that the consolidated financial statements were issued (see Note 26).
2. SIGNIFICANT ACCOUNTING POLICIES
Use of Estimates
The preparation of financial statements in accordance with accounting principles generally accepted in the United States of America (U.S.) (GAAP) requires the use of estimates and assumptions related to the reporting of assets, liabilities, revenues, expenses and related disclosures. Actual results could differ from these estimates. Significant estimates and assumptions were used to value goodwill and other long-lived assets, including impairment charges (see Notes 4 and 10), costs associated with the company’s restructuring actions (see Note 5), product warranty liabilities (see Note 13), long-term incentive compensation plan obligations (see Note 18), retiree medical and pension obligations (see Notes 19 and 20), income taxes (see Note 21), and contingencies including asbestos and environmental matters (see Note 22).
Consolidation and Joint Ventures
The consolidated financial statements include the accounts of the company and those subsidiaries in which the company has control. All intercompany balances and transactions are eliminated in consolidation. The results of operations of controlled subsidiaries are included in the consolidated financial statements and are offset by a related noncontrolling interest recorded for the noncontrolling partners’ ownership. Investments in affiliates that are not controlled or majority-owned are reported using the equity method of accounting (see Note 12).
Foreign Currency
Local currencies are generally considered the functional currencies for operations outside the U.S. For operations reporting in local currencies, assets and liabilities are translated at year-end exchange rates with cumulative currency translation adjustments included as a component of Accumulated Other Comprehensive Loss in the consolidated balance sheet. Income and expense items are translated at average rates of exchange during the year.
Impairment of Long-Lived Assets
Long-lived assets, excluding goodwill, to be held and used are reviewed for impairment whenever adverse events or changes in circumstances indicate a possible impairment. An impairment loss is recognized when a long-lived asset’s carrying value exceeds the fair value.
Long-lived assets held for sale are recorded at the lower of their carrying amount or estimated fair value less cost to sell.
JOB TITLE Meritor 10-K REVISION 3 SERIAL DATE / TIME Friday, November 30, 2012 JOB NUMBER 243020 TYPE PAGE NO. 64 OPERATOR PM2
<12345678>

65
MERITOR, INC.
NOTES TO CONSOLIDATED FINANCIAL STATEMENTS — (Continued)
Discontinued Operations
A business component that either has been disposed of or is classified as held for sale is reported as discontinued operations if the cash flows of the component have been or will be eliminated from the ongoing operations of the company and the company will no longer have any significant continuing involvement in the business component. The results of discontinued operations are aggregated and presented separately in the consolidated statement of income and consolidated statement of cash flows. Assets and liabilities of the disposal group, are aggregated and reported separately as assets and liabilities of discontinued operations in the consolidated balance sheet (see Note 3).
Revenue Recognition
Revenues are recognized upon shipment of product and transfer of ownership to the customer. Provisions for customer sales allowances and incentives are recorded as a reduction of sales at the time of product shipment.
Allowance for Doubtful Accounts
An allowance for uncollectible trade receivables is recorded when accounts are deemed uncollectible based on consideration of write-off history, aging analysis, and any specific, known troubled accounts.
Earnings per Share
Basic earnings (loss) per share is calculated using the weighted average number of shares outstanding during each year. The diluted earnings (loss) per share calculation includes the impact of dilutive common stock options, restricted stock, and convertible securities, if applicable.
A reconciliation of basic average common shares outstanding to diluted average common shares outstanding is as follows (in millions):
Year Ended September 30,
2012 2011 2010
Basic average common shares outstanding . . . . . . . . . . . . . . . . . . . . . . . . . . . . . . . 95.9 94.1 84.7Impact of stock options . . . . . . . . . . . . . . . . . . . . . . . . . . . . . . . . . . . . . . . . . . . . . . — 0.1 —Impact of restricted shares and share units . . . . . . . . . . . . . . . . . . . . . . . . . . . . . . . 1.3 2.7 2.9Diluted average common shares outstanding . . . . . . . . . . . . . . . . . . . . . . . . . . . . . . 97.2 96.9 87.6
At September 30, 2012, 2011, and 2010 options to purchase 0.7 million, 0.5 million, and 1.4 million shares of common stock, respectively, were not included in the computation of diluted earnings per share because their exercise price exceeded the average market price for the twelve month period and thus their inclusion would be anti-dilutive. The company’s convertible senior unsecured notes are excluded from the computation of diluted earnings per share for each period presented, as the company’s average stock price during each period is less than the conversion price.
Other
Other significant accounting policies are included in the related notes, specifically, goodwill (Note 4), inventories (Note 8), property and depreciation (Note 10), capitalized software (Note 11), product warranties (Note 13), financial instruments (Note 16), equity based compensation (Note 18), retirement medical plans (Note 19), retirement pension plans (Note 20), income taxes (Note 21) and environmental and asbestos-related liabilities (Note 22).
JOB TITLE Meritor 10-K REVISION 3 SERIAL DATE / TIME Friday, November 30, 2012 JOB NUMBER 243020 TYPE PAGE NO. 65 OPERATOR PM2
<12345678>

66
MERITOR, INC.
NOTES TO CONSOLIDATED FINANCIAL STATEMENTS — (Continued)
New accounting standards to be implemented
In June 2011, the Financial Accounting Standards Board (FASB) issued Accounting Standards Update (ASU) No. 2011-05, Comprehensive Income (Topic 220): Presentation of Comprehensive Income. The new guidance allows an entity to present components of net income and other comprehensive income in one continuous statement, referred to as the statement of comprehensive income, or in two separate, but consecutive statements. The guidance eliminates the current option to report other comprehensive income and its components in the statement of changes in equity. While the new guidance changes the presentation of comprehensive income, there are no changes to the components that are recognized in net income or other comprehensive income under current accounting guidance. This new guidance is effective for fiscal years, and interim periods within those years, beginning after December 15, 2011. The company plans to adopt this guidance at the beginning of its first quarter of fiscal year 2013. The company does not believe the adoption of the new guidance will have a significant impact on the company’s consolidated financial statements.
In July 2012, the FASB issued ASU No. 2012-02, Intangibles - Goodwill and Other (Topic 350): Testing Indefinite-Lived Intangible Assets for Impairment. The guidance provides an option for companies to use a qualitative approach to test indefinite-lived intangible assets for impairment if certain conditions are met. The amendment is effective for annual and interim impairment tests of indefinite-lived intangible assets for fiscal years beginning after September 15, 2012. The company does not believe the adoption of the new guidance will have a significant impact on the company’s consolidated financial statements.
Accounting standards implemented in fiscal year 2012
In September 2011, the Financial Accounting Standards Board (the FASB) issued ASU No. 2011-08: Testing Goodwill for Impairment. Under the revised guidance, entities testing for goodwill impairment have an option of performing a qualitative assessment before calculating the fair value for the reporting unit, i.e., Step 1 of the goodwill impairment test. If an entity determines, on the basis of qualitative factors, that the fair value of the reporting unit is more-likely-than-not less than the carrying amount, the first step of the two-step impairment test would be required. If it is not more-likely-than-not that the fair value of the reporting unit is less than the carrying value, then goodwill is not considered to be impaired. ASU No. 2011-08 does not change how goodwill is calculated or assigned to reporting units, nor does it revise the requirement to test goodwill at least annually for impairment. This ASU is effective for interim and annual periods beginning after December 15, 2011 with early adoption permitted. The company has adopted the revised guidance provided in this ASU effective with its second quarter of fiscal year 2012 and has started applying it accordingly. The adoption of this new guidance did not have any effect on the company’s goodwill impairment assessments.
In May 2011, the FASB issued ASU No. 2011-04, Fair Value Measurement (Topic 820): Amendments to Achieve Common Fair Value Measurement and Disclosure Requirements in U.S. GAAP and International Financial Reporting Standards (IFRS). This ASU is intended to result in convergence between U.S. GAAP and IFRS requirements for measurement of and disclosures about fair value. The guidance amends current fair value measurement and disclosure guidance to include increased transparency around valuation inputs and investment categorization. This new guidance is effective for fiscal years and interim periods beginning after December 15, 2011. The company has adopted this new guidance effective with its second quarter of fiscal year 2012 and has provided required disclosures in Note 16 and 20 to the consolidated financial statements.
JOB TITLE Meritor 10-K REVISION 3 SERIAL DATE / TIME Friday, November 30, 2012 JOB NUMBER 243020 TYPE PAGE NO. 66 OPERATOR PM2
<12345678>

67
MERITOR, INC.
NOTES TO CONSOLIDATED FINANCIAL STATEMENTS — (Continued)
3. DISCONTINUED OPERATIONS
Results of the discontinued operations are summarized as follows (in millions):
Year Ended September 30,
2012 2011 2010
Sales . . . . . . . . . . . . . . . . . . . . . . . . . . . . . . . . . . . . . . . . . . . . . . . . . . . . . . . . $ 2 $368 $1,353Operating income, net. . . . . . . . . . . . . . . . . . . . . . . . . . . . . . . . . . . . . . . . . . . . $ — $ 11 $ 27Net gain (loss) on sales of businesses . . . . . . . . . . . . . . . . . . . . . . . . . . . . . . . . (1) 19 5Long-lived asset impairment charges . . . . . . . . . . . . . . . . . . . . . . . . . . . . . . . . . — — (2)Charge for contingency and indemnity obligation (see Note 22) . . . . . . . . . . . . . . (10) (4) —Restructuring costs. . . . . . . . . . . . . . . . . . . . . . . . . . . . . . . . . . . . . . . . . . . . . . (1) (9) (6)Environmental remediation charges (see Note 22). . . . . . . . . . . . . . . . . . . . . . . . (3) (4) (2)LVS divestiture costs . . . . . . . . . . . . . . . . . . . . . . . . . . . . . . . . . . . . . . . . . . . . . — (1) (9)Other . . . . . . . . . . . . . . . . . . . . . . . . . . . . . . . . . . . . . . . . . . . . . . . . . . . . . . . . (6) (11) (13)
Income (loss) before income taxes . . . . . . . . . . . . . . . . . . . . . . . . . . . . . . . . . (21) 1 —Benefit (provision) for income taxes . . . . . . . . . . . . . . . . . . . . . . . . . . . . . . . . . . 3 (3) (2)
Loss from discontinued operations attributable to Meritor, Inc. . . . . . . . . . . . . $ (18) $ (2) $ (2)
In conjunction with the company’s long-term strategic objective to focus on supplying the commercial vehicle on- and off-highway markets for original equipment manufacturers, aftermarket and industrial customers, the company divested its Light Vehicle Systems (LVS) business groups in various transactions. In November 2011, the company sold its damper business located in Leicester, England. With the sale of this business, the company completed the divestiture of its LVS businesses. Results of the company’s LVS businesses are reflected in discontinued operations for all periods presented.
Prior Period Divestitures
EU Trailer
In the second quarter of fiscal year 2011, the company announced the planned closure of its EU Trailer business which was part of the company’s Aftermarket & Trailer segment. All manufacturing operations and use of productive assets ceased prior to September 30, 2011. The company sold certain long-lived and current assets of the business to a third party and recognized a loss of approximately $2 million during the fourth quarter of fiscal year 2011 in connection with the sale. In addition, the company recognized $8 million of restructuring charges associated with the closure of EU Trailer business in fiscal year 2011. Additional restructuring charges of $1 million were recognized in fiscal year 2012. These charges are included in loss from discontinued operations in the accompanying consolidated statement of income. Total sales from this business were $59 million and $64 million in fiscal years 2011 and 2010, respectively.
Gabriel Europe
On February 6, 2011, the company sold its Gabriel Europe (Bonneval) facility to TRW Automotive Holdings France. Gabriel Europe manufactured ride control parts (shock absorbers) for sale in Europe. In connection with the sale, the company made a cash capital contribution of $15 million to Gabriel Europe prior to the completion of the sale transaction. This capital contribution is included in net investing cash flows used for discontinued operations in the accompanying consolidated statement of cash flows. In connection with the sale of Gabriel Europe business, the company recognized a pre-tax loss of $13 million ($13 million after tax) in fiscal year 2011.
JOB TITLE Meritor 10-K REVISION 3 SERIAL DATE / TIME Friday, November 30, 2012 JOB NUMBER 243020 TYPE PAGE NO. 67 OPERATOR PM2
<12345678>

68
MERITOR, INC.
NOTES TO CONSOLIDATED FINANCIAL STATEMENTS — (Continued)
Body Systems
On January 3, 2011, the company completed the sale of its Body Systems business to Inteva Products Holding Coöperatieve U.A., an assignee of 81 Acquisition LLC and an affiliate of Inteva Products, LLC. Pursuant to the sale agreement signed in August 2010, total consideration was approximately $35 million, subject to certain potential adjustments for items such as working capital fluctuations. The actual purchase price at the closing was $27 million (excluding estimated closing expenses for outside advisory fees of $12 million), consisting of $12 million in cash at closing (adjusted for estimated balances in working capital and other items at the time of the closing) and a five-year, 8-percent promissory note for $15 million, payable in five annual installments beginning in January 2012. The current portion of the promissory note is included in receivables, trade and other, net in the accompanying consolidated balance sheet. The long-term portion of the note is included in other assets in the accompanying consolidated balance sheet.
In addition to the purchase price, the company was entitled to receive the cash held at the time of the sale by the Body Systems entities operating in China and Brazil of approximately $33 million, before applicable taxes and other withholding, at such time as it becomes available for distribution, as provided in the sale agreement. At September 30, 2011, the company recognized a receivable of approximately $28 million, net of applicable taxes and other withholding, for cash balances available for distribution based on the then-current distribution capacity. The company expects to recognize a receivable for the remaining amount of approximately $3 million, before applicable taxes and other withholding, at such time when the balance becomes available for distribution by the respective entities. During fiscal year 2012, the company received approximately $24 million, net of withholdings, of cash balances for which a receivable was recorded at September 30, 2011. The receivable recognized at September 30, 2012 and 2011 is included in receivables, trade and other, net in the accompanying consolidated balance sheet. Cash flows associated with the receipt of cash balances in fiscal year 2012 and outflows associated with the sale of Body Systems are included in net investing cash flows provided by (used for) for discontinued operations in the accompanying consolidated statement of cash flows.
In connection with the sale of Body Systems business, the company recognized a pre-tax gain of $32 million ($32 million after tax) in fiscal year 2011. Upon sale of the Body Systems business, net accumulated foreign currency translation gains of $62 million were recognized into income and included in the gain on sale of this business. These net accumulated foreign currency translation gains were previously deferred and included in accumulated other comprehensive loss in the condensed consolidated statement of equity (deficit).
The sale agreement contains certain customary representations, warranties and covenants of the seller and the purchaser as further set forth in the agreement. The agreement also includes provisions governing post-closing indemnities between the seller and the purchaser for losses arising from specified events. At September 30, 2012 and 2011, the company has recognized estimates for such indemnities, primarily related to income tax matters, of $4 million and $5 million, respectively. This amount is included in other liabilities in the accompanying consolidated balance sheet.
Meritor Suspension Systems Company (MSSC)
On June 24, 2009, the company entered into a binding letter of intent to sell its 57 percent interest in MSSC, a joint venture that manufactured and supplied automotive coil springs, torsion bars and stabilizer bars in North America, to the joint venture partner, a subsidiary of Mitsubishi Steel Mfg. Co., LTD (MSM). The sale transaction closed in October 2009. The purchase price was $13 million, which included a cash dividend of $12 million received by the company in June 2009. The remaining purchase price was received by the company at the time of closing. In connection with the sale of its interest in MSSC, the company provided certain indemnifications to the buyer for its share of potential obligations related to pension funding shortfall, environmental and other contingencies, and valuation of certain accounts receivable and inventories. The company’s estimated exposure under these indemnities at September 30, 2012 and September 30, 2011 is approximately $14 million and $15 million, respectively, and is included in other current liabilities and other liabilities in the consolidated balance sheet.
JOB TITLE Meritor 10-K REVISION 3 SERIAL DATE / TIME Friday, November 30, 2012 JOB NUMBER 243020 TYPE PAGE NO. 68 OPERATOR PM2
<12345678>

69
MERITOR, INC.
NOTES TO CONSOLIDATED FINANCIAL STATEMENTS — (Continued)
The following summarizes significant items included in loss from discontinued operations in the consolidated statement of income for the fiscal years ended September 30, 2012, 2011 and 2010:
Sales from discontinued operations in fiscal years 2012, 2011 and 2010 were $2 million, $368 million and $1,353 million, respectively. Sales in fiscal year 2012 were related to our damper business located in Leicester, England, which was sold in November 2011. Sales in the fiscal year 2011 included $298 million in Body Systems and $59 million in EU Trailer. The remaining sales in fiscal year 2011 were in Gabriel Europe and the damper business in Leicester, England. Sales in the fiscal year 2010 included $1,186 million in Body Systems, $64 million in EU Trailer and remainder in other LVS businesses.
Operating loss, net from discontinued operations represents income from normal operating activities of businesses included in discontinued operations.
Net gain (loss) on sale of business: The loss on sale of business in fiscal year 2012 relates to the sale of the company’s damper business located in Leicester, England during the first quarter. During the second quarter of fiscal year 2011, the company recognized a pre-tax gain of $32 million ($32 million after tax) on the sale of its Body Systems business and a pre-tax loss of $13 million ($13 million after tax) on the sale of its Gabriel Europe business.
In connection with the sale of the company’s interest in MSSC, the company recognized a pre-tax gain on sale of $16 million ($16 million after tax), net of estimated indemnity obligations as described above during fiscal year 2010. The company recognized $3 million of pre-tax losses ($3 million after tax) on the sale of certain other LVS businesses during the fourth quarter of fiscal year 2010. Also included in net gain on sale of businesses for the fiscal year 2010 are $8 million of charges associated with the Gabriel Ride Control working capital adjustments recognized in the first quarter of fiscal year 2010. Gabriel Ride Control business was sold in fiscal year 2009.
Long-lived asset impairment charges: During fiscal year 2010, the company recognized $2 million of long-lived asset impairment charges in its EU Trailer business.
Restructuring costs: In fiscal years 2012 and 2011, the company recognized $1 million and $8 million, respectively, of restructuring charges associated with the closure of its EU Trailer business. The remaining restructuring charges in fiscal year 2011 were related to employee severance costs at the company’s Gabriel Europe business prior to the sale in the second quarter. Restructuring costs recognized in fiscal year 2010 were related to charges associated with actions in the company’s Body Systems business and other LVS businesses.
LVS divestiture costs are related to actions in connection with the separation of the LVS businesses from the company, and include third-party costs associated with divestiture activities and costs associated with the previously planned spin-off of the LVS business.
Other: During the fourth quarter of fiscal year 2011, the company recognized $2 million of losses associated with the sale of certain assets in connection with the closure of its EU Trailer business. The company also recognized $4 million of costs associated with the sale of Body Systems business during the second quarter of fiscal year 2011. The remaining charges primarily relate to changes in estimates and adjustments to certain assets and liabilities retained from previously sold businesses and indemnities provided at the time of sale.
4. GOODWILL
In accordance with FASB Accounting Standards Codification (ASC) Topic 350-20, “Intangibles – Goodwill and Other”, goodwill is reviewed for impairment annually during the fourth quarter of the fiscal year or more frequently if certain indicators arise. If business conditions or other factors cause the operating results and cash flows of a reporting unit to decline, the company may be required to record impairment charges for goodwill at that time.
In September 2011, the FASB issued revised guidance which allows entities to perform an initial qualitative evaluation to determine whether it is more likely than not that the fair value of a reporting unit is less than its carrying amount. The results of this qualitative assessment determine whether it is necessary to perform step one of the required two-step impairment test.
JOB TITLE Meritor 10-K REVISION 3 SERIAL DATE / TIME Friday, November 30, 2012 JOB NUMBER 243020 TYPE PAGE NO. 69 OPERATOR PM2
<12345678>

70
MERITOR, INC.
NOTES TO CONSOLIDATED FINANCIAL STATEMENTS — (Continued)
Excluding the qualitative evaluation discussed above, the goodwill impairment review is a two-step process. Step one consists of a comparison of the fair value of a reporting unit with its carrying amount. An impairment loss may be recognized if the review indicates that the carrying value of a reporting unit exceeds its fair value. Estimates of fair value are primarily determined by using discounted cash flows and market multiples on earnings. If the carrying amount of a reporting unit exceeds its fair value, step two requires the fair value of the reporting unit to be allocated to the underlying assets and liabilities of that reporting unit, resulting in an implied fair value of goodwill. If the carrying amount of the goodwill of the reporting unit exceeds the implied fair value, an impairment charge is recorded equal to the excess.
The impairment review is highly judgmental and involves the use of significant estimates and assumptions. These estimates and assumptions have a significant impact on the amount of any impairment charge recorded. Discounted cash flow methods are dependent upon assumptions of future sales trends, market conditions and cash flows of each reporting unit over several years. Actual cash flows in the future may differ significantly from those previously forecasted. Other significant assumptions include growth rates and the discount rate applicable to future cash flows. For fiscal years 2012, 2011 and 2010, the fair value of the company’s reporting units exceeded their carrying values.
A summary of the changes in the carrying value of goodwill is presented below (in millions):
CommercialTruck Industrial
Aftermarket & Trailer Total
Balance at September 30, 2010 . . . . . . . . . . . . . . . . . . . . . . . . . . . . . . $151 $109 $172 $ 432Foreign currency translation . . . . . . . . . . . . . . . . . . . . . . . . . . . . . . . (1) — — (1)
Balance at September 30, 2011 . . . . . . . . . . . . . . . . . . . . . . . . . . . . . . 150 109 172 431Foreign currency translation . . . . . . . . . . . . . . . . . . . . . . . . . . . . . . . 3 — (1) 2
Balance at September 30, 2012 . . . . . . . . . . . . . . . . . . . . . . . . . . . . . . $153 $109 $171 $ 433
5. RESTRUCTURING COSTS
At September 30, 2012 and 2011, $15 million and $19 million, respectively, of restructuring reserves primarily related to unpaid employee termination benefits remained in the consolidated balance sheet. Asset impairment charges relate to manufacturing facilities that will be closed or sold and machinery and equipment that became idle and obsolete as a result of these actions.
JOB TITLE Meritor 10-K REVISION 3 SERIAL DATE / TIME Friday, November 30, 2012 JOB NUMBER 243020 TYPE PAGE NO. 70 OPERATOR PM2
<12345678>

71
MERITOR, INC.
NOTES TO CONSOLIDATED FINANCIAL STATEMENTS — (Continued)
The following table summarizes changes in restructuring reserves (in millions):
EmployeeTermination
BenefitsAsset
Impairment
PlantShutdown
& Other Total
Balance at September 30, 2009 . . . . . . . . . . . . . . . . . . . . . . . . . . . . . . $ 28 $ — $ — $ 28Activity during the period:
Charges to continuing operations, net of reversals of $1 . . . . . . . . . . . 3 2 1 6Charges to discontinued operations, net of reversals of $3 (1) . . . . . . . 6 — — 6Asset write-offs . . . . . . . . . . . . . . . . . . . . . . . . . . . . . . . . . . . . . . . . — (2) — (2)Reclassifications to liabilities of discontinued operations . . . . . . . . . . . (6) — — (6)Cash payments – continuing operations. . . . . . . . . . . . . . . . . . . . . . . (13) — (1) (14)Other (2) . . . . . . . . . . . . . . . . . . . . . . . . . . . . . . . . . . . . . . . . . . . . . (7) — — (7)
Balance at September 30, 2010 . . . . . . . . . . . . . . . . . . . . . . . . . . . . . . 11 — — 11Activity during the period:
Charges to continuing operations. . . . . . . . . . . . . . . . . . . . . . . . . . . . 19 2 1 22Charges to discontinued operations, net of reversals of $1 (1) . . . . . . . 7 — 2 9Asset write-offs . . . . . . . . . . . . . . . . . . . . . . . . . . . . . . . . . . . . . . . . — (2) — (2)Cash payments – continuing operations. . . . . . . . . . . . . . . . . . . . . . . (12) — (1) (13)Cash payments – discontinued operations . . . . . . . . . . . . . . . . . . . . . (6) — (2) (8)
Balance at September 30, 2011 . . . . . . . . . . . . . . . . . . . . . . . . . . . . . . 19 — — 19Activity during the period:
Charges to continuing operations. . . . . . . . . . . . . . . . . . . . . . . . . . . . 18 19 2 39Charges to discontinued operations (1). . . . . . . . . . . . . . . . . . . . . . . . — — 1 1Asset write-offs . . . . . . . . . . . . . . . . . . . . . . . . . . . . . . . . . . . . . . . . — (19) — (19)Cash payments – continuing operations. . . . . . . . . . . . . . . . . . . . . . . (20) — (2) (22)Cash payments – discontinued operations . . . . . . . . . . . . . . . . . . . . . (2) — (1) (3)Total restructuring reserves, end of year . . . . . . . . . . . . . . . . . . . . . . 15 — — 15
Less: non-current restructuring reserves . . . . . . . . . . . . . . . . . . . . . . . . (4) — — (4)
Restructuring reserves – current, at September 30, 2012. . . . . . . . . . . . $ 11 $ — $ — $ 11
(1) Charges to discontinued operations are included in discontinued operations in the consolidated statement of income.
(2) Includes $8 million of payments associated with restructuring reserves for discontinued operations.
JOB TITLE Meritor 10-K REVISION 3 SERIAL DATE / TIME Friday, November 30, 2012 JOB NUMBER 243020 TYPE PAGE NO. 71 OPERATOR PM2
<12345678>

72
MERITOR, INC.
NOTES TO CONSOLIDATED FINANCIAL STATEMENTS — (Continued)
Restructuring costs included in the company’s business segment results during fiscal years 2012, 2011 and 2010 are as follows (in millions):
CommercialTruck
Aftermarket & Trailer Industrial Total(1)
Fiscal year 2012:Performance Plus actions . . . . . . . . . . . . . . . . . . . . . . . . . . . . . . . . . . . . . $ 24 $ — $ — 24Fiscal Year 2012 European Action . . . . . . . . . . . . . . . . . . . . . . . . . . . . . . . 7 — — 7Variable Labor Reductions. . . . . . . . . . . . . . . . . . . . . . . . . . . . . . . . . . . . . 5 — — 5Other . . . . . . . . . . . . . . . . . . . . . . . . . . . . . . . . . . . . . . . . . . . . . . . . . . . . — 2 — 2
Total restructuring costs . . . . . . . . . . . . . . . . . . . . . . . . . . . . . . . . . . . . $ 36 $ 2 $ — $ 38Fiscal year 2011:
Performance Plus actions . . . . . . . . . . . . . . . . . . . . . . . . . . . . . . . . . . . . . $ 16 $ — $ — $ 16Fiscal year 2010:
Performance Plus actions . . . . . . . . . . . . . . . . . . . . . . . . . . . . . . . . . . . . . $ 5 $ — $ — $ 5Other . . . . . . . . . . . . . . . . . . . . . . . . . . . . . . . . . . . . . . . . . . . . . . . . . . . . — — 1 1
Total restructuring costs . . . . . . . . . . . . . . . . . . . . . . . . . . . . . . . . . . . . $ 5 $ — $ 1 $ 6
(1) Total segment restructuring costs do not include those recorded at the company’s corporate locations. These costs were $1 million and $6 million in fiscal years 2012 and 2011, respectively, primarily related to employee termination benefits. There were no corporate restructuring costs in fiscal year 2010.
Performance Plus: During fiscal year 2007, the company launched a long-term profit improvement and cost reduction initiative called “Performance Plus.” As part of this program, the company identified significant restructuring actions which would eliminate up to 2,800 positions in North America and Europe and consolidate and combine certain global facilities. The company’s continuing operations recognized restructuring costs in its Commercial Truck segment of $24 million, $16 million and $5 million in fiscal years 2012, 2011 and 2010, respectively, related to Performance Plus. Fiscal year 2012 Performance Plus costs include $19 million of non-cash charges, including an impairment charge of $17 million for assets held for sale at December 31, 2011. In connection with the then-planned sale of St. Priest, France manufacturing facility to Renault Trucks SAS, the company classified certain assets and associated liabilities as held for sale (collectively the “Disposal Group”) at December 31, 2011. Upon comparing the carrying value of the Disposal Group to its fair value less cost to sell, an impairment was identified. The sale of Disposal Group was completed on January 2, 2012. In addition, other restructuring charges of approximately $5 million associated with employee headcount reduction and plant rationalization costs were recognized in connection with the sale of St. Priest facility. Performance Plus costs recognized in fiscal years 2011 and 2010 were also related to employee headcount reductions, asset write-downs and facility rationalization at the company’s St. Priest location.
Cumulative restructuring costs recorded for this program as of September 30, 2012 are $186 million, including $93 million reported in discontinued operations in the consolidated statement of income. These costs primarily relate to employee severance and related costs of $117 million, asset impairment charges of $41 million and $28 million primarily associated with pension termination benefits. The company’s Commercial Truck segment has recognized cumulative restructuring costs associated with Performance Plus of $82 million. Cumulative restructuring costs of $11 million were recognized by corporate locations and the company’s Aftermarket & Trailer segment. Restructuring actions associated with Performance Plus were complete as of September 30, 2012.
Fiscal Year 2012 European Action: During the second quarter of fiscal year 2012, the company approved a European headcount reduction plan in response to the ongoing economic weakness and uncertainty in that region. The company recognized approximately $7 million of restructuring costs associated with this plan in its Commercial Truck segment. Restructuring actions associated with this plan were substantially complete as of September 30, 2012.
JOB TITLE Meritor 10-K REVISION 3 SERIAL DATE / TIME Friday, November 30, 2012 JOB NUMBER 243020 TYPE PAGE NO. 72 OPERATOR PM2
<12345678>

73
MERITOR, INC.
NOTES TO CONSOLIDATED FINANCIAL STATEMENTS — (Continued)
Variable Labor Reductions: The company is executing a variable labor headcount reduction program in response to market conditions in certain regions and recognized approximately $5 million of costs in its Commercial Truck segment associated with employee terminations in fiscal year 2012 (see Note 26).
Other Actions: The remaining restructuring costs incurred during the fiscal year 2012 were primarily associated with the company’s previously announced executive headcount reduction.
6. ACCOUNTS RECEIVABLE FACTORING AND SECURITIZATION
Off-balance sheet arrangements
Sweden Factoring Facility: The company has an arrangement to sell trade receivables due from AB Volvo through one of its European subsidiaries. Under this arrangement, which was renewed on June 19, 2012, and which now terminates on June 28, 2013, the company can sell up to, at any point in time, €150 million of eligible trade receivables. The receivables under this program are sold at face value and are excluded from the consolidated balance sheet. The company had utilized €119 million ($154 million) and €107 million ($146 million) of this accounts receivable factoring facility as of September 30, 2012 and 2011, respectively.
U.S. Factoring Facility: The company has an arrangement to sell trade receivables due from AB Volvo and its subsidiaries. Under this arrangement, which was renewed on September 28, 2012, and which now terminates on October 29, 2013, the company can sell up to, at any point in time, €65 million ($84 million) of eligible trade receivables. The receivables under this program are sold at face value and are excluded from the consolidated balance sheet. The company had utilized €51 million ($66 million) and €46 million ($62 million) of this accounts receivable factoring facility as of September 30, 2012 and 2011, respectively.
The above facilities are backed by 364-day liquidity commitments from Nordea Bank which were renewed through October 2013. The commitments are subject to standard terms and conditions for these types of arrangements.
United Kingdom Factoring Facility: On February 2, 2012, the company entered into an arrangement to sell trade receivables from AB Volvo and its European subsidiaries through one of its United Kingdom subsidiaries. Under this arrangement, which expires in February 2013, the company can sell up to, at any point in time, €25 million of eligible trade receivables. The receivables under this program are sold at face value and are excluded from the consolidated balance sheet. The company had utilized €9 million ($12 million) of this accounts receivable factoring facility as of September 30, 2012. The commitment is subject to standard terms and conditions for these types of arrangements including a sole discretion clause whereby the bank retains the right to not purchase receivables, which has not been invoked since the inception of the program.
Italy Factoring Facility: On March 15, 2012, the company entered into an arrangement to sell trade receivables from AB Volvo and its European subsidiaries through one of its Italian subsidiaries. Under this arrangement, which expires in June 2017, the company can sell up to, at any point in time, €30 million of eligible trade receivables. The receivables under this program are sold at face value and are excluded from the consolidated balance sheet. The company had utilized €13 million ($16 million) of this accounts receivable factoring facility as of September 30, 2012. The commitment is subject to standard terms and conditions for these types of arrangements including a sole discretion clause whereby the bank retains the right to not purchase receivables, which has not been invoked since the inception of the program.
In addition, several of the company’s subsidiaries, primarily in Europe, factor eligible accounts receivable with financial institutions. Certain receivables are factored without recourse to the company and are excluded from accounts receivable in the consolidated balance sheet. The amount of factored receivables excluded from accounts receivable was $7 million and $8 million at September 30, 2012 and 2011, respectively.
Total costs associated with these off-balance sheet arrangements were $9 million, $10 million and $3 million in fiscal years 2012, 2011 and 2010, respectively, and are included in selling, general and administrative expenses in the consolidated statement of income.
JOB TITLE Meritor 10-K REVISION 3 SERIAL DATE / TIME Friday, November 30, 2012 JOB NUMBER 243020 TYPE PAGE NO. 73 OPERATOR PM2
<12345678>

74
MERITOR, INC.
NOTES TO CONSOLIDATED FINANCIAL STATEMENTS — (Continued)
On-balance sheet arrangements
On June 18, 2012, the company entered into a new $100 million U.S. accounts receivables securitization facility, which expires on June 18, 2015. This program is provided by PNC Bank, National Association (PNC), as Administrator, Market Street Funding, LLC, and the other Purchasers and Purchaser Agents from time to time (participating lenders), which are party to the agreement. Under this program, the company has the ability to sell an undivided percentage ownership interest in substantially all of its trade receivables (excluding the receivables due from AB Volvo and subsidiaries eligible for sale under the U.S. Factoring Facility and certain other receivables) of certain U.S. subsidiaries to ArvinMeritor Receivables Corporation (ARC), a wholly-owned, special purpose subsidiary. ARC funds these purchases with borrowings from participating lenders under a loan agreement. This program also includes a letter of credit facility pursuant to which ARC may request the issuance of letters of credit issued for the company’s U.S. subsidiaries (originators) or their designees, which when issued will constitute a utilization of the facility for the amount of letters of credit issued. Amounts outstanding under this agreement are collateralized by eligible receivables purchased by ARC and are reported as short-term debt in the consolidated balance sheet. At September 30, 2012, no amounts, including letters of credit, were outstanding under this program. This program contains a financial covenant related to the company’s priority-debt-to-EBITDA ratio, which is identical to the corresponding covenant in the company’s revolving credit facility as it exists on the date of the agreement. In addition, this securitization program contains a cross default to the company’s revolving credit facility.
At September 30, 2011, the company had a $125 million U.S. accounts receivables financing arrangement which was provided on a committed basis by a syndicate of financial institutions led by Ally Commercial Finance LLC and was due to expire in October 2013. In connection with entering into the new U.S. Securitization Program discussed above, the company terminated this receivables financing arrangement. No amounts were outstanding under this program at September 30, 2011.
7. GAIN ON SALE OF PROPERTY, OTHER OPERATING EXPENSE, NET AND OTHER INCOME, NET
The company recognized a gain on sale of property of $16 million during fiscal year 2012. This gain is associated with the sale of excess land at the company’s facility at Cwmbran, Wales.
Other operating expense, net for fiscal years 2012, 2011 and 2010 primarily relates to environmental remediation costs incurred by the company (see Note 22).
Other income, net for fiscal year 2012 includes a $3 million non-operating gain related to the sale of the company’s remaining ownership interest in Gabriel India, Ltd during the first quarter of fiscal year 2012. The company’s ownership interest in Gabriel India, Ltd was a legacy investment accounted for under the cost method that the company deemed non-core upon the completion of the sale of its light vehicle businesses.
Other income, net for fiscal year 2011 includes a $5 million non-operating gain on the collection of a note receivable related to a previously divested business and a $5 million non-operating gain on the termination of certain foreign currency option contracts.
8. INVENTORIES
Inventories are stated at the lower of cost (using FIFO or average methods) or market (determined on the basis of estimated realizable values) and are summarized as follows (in millions):
September 30,
2012 2011
Finished goods . . . . . . . . . . . . . . . . . . . . . . . . . . . . . . . . . . . . . . . . . . . . . . . . . . . . . . . . . . . . $185 $183Work in process . . . . . . . . . . . . . . . . . . . . . . . . . . . . . . . . . . . . . . . . . . . . . . . . . . . . . . . . . . . 48 63Raw materials, parts and supplies . . . . . . . . . . . . . . . . . . . . . . . . . . . . . . . . . . . . . . . . . . . . . . 205 214
Total . . . . . . . . . . . . . . . . . . . . . . . . . . . . . . . . . . . . . . . . . . . . . . . . . . . . . . . . . . . . . . . . . $438 $460
JOB TITLE Meritor 10-K REVISION 3 SERIAL DATE / TIME Friday, November 30, 2012 JOB NUMBER 243020 TYPE PAGE NO. 74 OPERATOR PM2
<12345678>

75
MERITOR, INC.
NOTES TO CONSOLIDATED FINANCIAL STATEMENTS — (Continued)
9. OTHER CURRENT ASSETS
Other current assets are summarized as follows (in millions):
September 30,
2012 2011
Current deferred income tax assets (see Note 21). . . . . . . . . . . . . . . . . . . . . . . . . . . . . . . . . . . . $ 27 $ 28Asbestos-related recoveries (see Note 22) . . . . . . . . . . . . . . . . . . . . . . . . . . . . . . . . . . . . . . . . . 11 9Deposits and collateral . . . . . . . . . . . . . . . . . . . . . . . . . . . . . . . . . . . . . . . . . . . . . . . . . . . . . . . 4 11Prepaid and other . . . . . . . . . . . . . . . . . . . . . . . . . . . . . . . . . . . . . . . . . . . . . . . . . . . . . . . . . . . 19 18Assets of discontinued operations . . . . . . . . . . . . . . . . . . . . . . . . . . . . . . . . . . . . . . . . . . . . . . . — 4
Other current assets . . . . . . . . . . . . . . . . . . . . . . . . . . . . . . . . . . . . . . . . . . . . . . . . . . . . . . . $ 61 $ 70
10. NET PROPERTY
Property is stated at cost. Depreciation of property is based on estimated useful lives, generally using the straight-line method. Estimated useful lives for buildings and improvements range from 10 to 50 years and estimated useful lives for machinery and equipment range from 3 to 20 years. Significant improvements are capitalized, and disposed or replaced property is written off. Maintenance and repairs are charged to expense in the period they are incurred. Company-owned tooling is classified as property and depreciated over the shorter of its expected life or the life of the related vehicle platform, generally not to exceed three years.
In accordance with the FASB guidance on property, plant and equipment, the company reviews the carrying value of long-lived assets, excluding goodwill, to be held and used, for impairment whenever events or changes in circumstances indicate a possible impairment. An impairment loss is recognized when a long-lived asset’s carrying value is not recoverable and exceeds estimated fair value.
Net property at September 30, 2012 and 2011 is summarized as follows (in millions):
September 30,
2012 2011
Property at cost: Land and land improvements. . . . . . . . . . . . . . . . . . . . . . . . . . . . . . . . . . . . . . . . . . $ 39 $ 47Buildings . . . . . . . . . . . . . . . . . . . . . . . . . . . . . . . . . . . . . . . . . . . . . . . . . . . . . . . . 253 264Machinery and equipment . . . . . . . . . . . . . . . . . . . . . . . . . . . . . . . . . . . . . . . . . . . . 909 897Company-owned tooling . . . . . . . . . . . . . . . . . . . . . . . . . . . . . . . . . . . . . . . . . . . . . 156 153Construction in progress . . . . . . . . . . . . . . . . . . . . . . . . . . . . . . . . . . . . . . . . . . . . . 65 74
Total. . . . . . . . . . . . . . . . . . . . . . . . . . . . . . . . . . . . . . . . . . . . . . . . . . . . . . . . . . . . . . 1,422 1,435Less accumulated depreciation . . . . . . . . . . . . . . . . . . . . . . . . . . . . . . . . . . . . . . . . . . (1,005) (1,014)
Net property. . . . . . . . . . . . . . . . . . . . . . . . . . . . . . . . . . . . . . . . . . . . . . . . . . . . . . $ 417 $ 421
JOB TITLE Meritor 10-K REVISION 3 SERIAL DATE / TIME Friday, November 30, 2012 JOB NUMBER 243020 TYPE PAGE NO. 75 OPERATOR PM2
<12345678>

76
MERITOR, INC.
NOTES TO CONSOLIDATED FINANCIAL STATEMENTS — (Continued)
11. OTHER ASSETS
Other assets are summarized as follows (in millions):
September 30,
2012 2011
Investments in non-consolidated joint ventures (see Note 12) . . . . . . . . . . . . . . . . . . . . . . . . . $169 $174Asbestos-related recoveries (see Note 22) . . . . . . . . . . . . . . . . . . . . . . . . . . . . . . . . . . . . . . . 63 67Unamortized debt issuance costs (see Note 15) . . . . . . . . . . . . . . . . . . . . . . . . . . . . . . . . . . . 29 25Capitalized software costs, net . . . . . . . . . . . . . . . . . . . . . . . . . . . . . . . . . . . . . . . . . . . . . . . 29 23Non-current deferred income tax assets (see Note 21) . . . . . . . . . . . . . . . . . . . . . . . . . . . . . . 12 12Prepaid pension costs (see Note 20) . . . . . . . . . . . . . . . . . . . . . . . . . . . . . . . . . . . . . . . . . . . 11 9Other . . . . . . . . . . . . . . . . . . . . . . . . . . . . . . . . . . . . . . . . . . . . . . . . . . . . . . . . . . . . . . . . . . 40 42
Other assets. . . . . . . . . . . . . . . . . . . . . . . . . . . . . . . . . . . . . . . . . . . . . . . . . . . . . . . . . . . $353 $352
In accordance with FASB ASC Topic 350-40, costs relating to internally developed or purchased software in the preliminary project stage and the post-implementation stage are expensed as incurred. Costs in the application development stage that meet the criteria for capitalization are capitalized and amortized using the straight-line basis over the estimated economic useful life of the software.
12. INVESTMENTS IN NON-CONSOLIDATED JOINT VENTURES
The company’s non-consolidated joint ventures and related direct ownership interest at September 30, 2012 are as follows:
Meritor WABCO Vehicle Control Systems (Commercial Truck) . . . . . . . . . . . . . . . . . . . . . . . . 50%Master Sistemas Automotivos Ltda. (Commercial Truck) . . . . . . . . . . . . . . . . . . . . . . . . . . . . 49%Suspensys Sistemas Automotivos Ltda. (1) (Aftermarket & Trailer) . . . . . . . . . . . . . . . . . . . . . 24%Sistemas Automotrices de Mexico S.A. de C.V. (Commercial Truck) . . . . . . . . . . . . . . . . . . . . 50%Ege Fren Sanayii ve Ticaret A.S. (Commercial Truck). . . . . . . . . . . . . . . . . . . . . . . . . . . . . . . 49%Automotive Axles Limited (Industrial) . . . . . . . . . . . . . . . . . . . . . . . . . . . . . . . . . . . . . . . . . . 36%
(1) Total direct and indirect ownership interest of 50 percent.
The company’s investments in non-consolidated joint ventures are as follows (in millions):
September 30,
2012 2011
Commercial Truck. . . . . . . . . . . . . . . . . . . . . . . . . . . . . . . . . . . . . . . . . . . . . . . . $121 $123Industrial . . . . . . . . . . . . . . . . . . . . . . . . . . . . . . . . . . . . . . . . . . . . . . . . . . . . . . 20 19Aftermarket & Trailer. . . . . . . . . . . . . . . . . . . . . . . . . . . . . . . . . . . . . . . . . . . . . . 28 32
Total investments in non-consolidated joint ventures . . . . . . . . . . . . . . . . . . . . . $169 $174
The company’s equity in earnings of non-consolidated joint ventures is as follows (in millions):
Year Ended September 30,
2012 2011 2010
Commercial Truck. . . . . . . . . . . . . . . . . . . . . . . . . . . . . . . . . . . . . . . . . $ 42 $ 51 $ 33Industrial . . . . . . . . . . . . . . . . . . . . . . . . . . . . . . . . . . . . . . . . . . . . . . . 3 5 3Aftermarket & Trailer. . . . . . . . . . . . . . . . . . . . . . . . . . . . . . . . . . . . . . . 7 14 12
Total equity in earnings of affiliates . . . . . . . . . . . . . . . . . . . . . . . . . . $ 52 $ 70 $ 48
JOB TITLE Meritor 10-K REVISION 3 SERIAL DATE / TIME Friday, November 30, 2012 JOB NUMBER 243020 TYPE PAGE NO. 76 OPERATOR PM2
<12345678>

77
MERITOR, INC.
NOTES TO CONSOLIDATED FINANCIAL STATEMENTS — (Continued)
The summarized financial information presented below represents the combined accounts of the company’s non-consolidated joint ventures related to its continuing operations (in millions):
September 30,
2012 2011
Current assets . . . . . . . . . . . . . . . . . . . . . . . . . . . . . . . . . . . . . . . . . . . . . . . . . . $510 $652Non-current assets . . . . . . . . . . . . . . . . . . . . . . . . . . . . . . . . . . . . . . . . . . . . . . . 292 273
Total assets . . . . . . . . . . . . . . . . . . . . . . . . . . . . . . . . . . . . . . . . . . . . . . . . . . $802 $925
Current liabilities . . . . . . . . . . . . . . . . . . . . . . . . . . . . . . . . . . . . . . . . . . . . . . . . . $266 $387Non-current liabilities . . . . . . . . . . . . . . . . . . . . . . . . . . . . . . . . . . . . . . . . . . . . . 146 124
Total liabilities. . . . . . . . . . . . . . . . . . . . . . . . . . . . . . . . . . . . . . . . . . . . . . . . . $412 $511
Year Ended September 30,
2012 2011 2010
Sales . . . . . . . . . . . . . . . . . . . . . . . . . . . . . . . . . . . . . . . . . . . . . . $1,787 $1,977 $1,474Gross profit . . . . . . . . . . . . . . . . . . . . . . . . . . . . . . . . . . . . . . . . . 215 274 216Net income. . . . . . . . . . . . . . . . . . . . . . . . . . . . . . . . . . . . . . . . . . 123 177 126
Dividends received from the company’s non-consolidated joint ventures were $47 million in fiscal year 2012, $45 million in fiscal year 2011 and $11 million in fiscal year 2010.
The company had sales to its non-consolidated joint ventures of approximately $6 million, $8 million and $5 million in fiscal years 2012, 2011 and 2010, respectively. These sales exclude sales of $165 million, $182 million and $96 million in fiscal years 2012, 2011 and 2010, respectively, to a joint venture in the company’s Commercial Truck segment, which are eliminated as the company purchases these components back after value add provided by the joint venture. The company had purchases from its non-consolidated joint ventures of approximately $973 million, $1,161 million and $612 million in fiscal years 2012, 2011 and 2010, respectively. Additionally, the company leases space and provides certain administrative and technical services to various non-consolidated joint ventures. The company collected $3 million, $1 million and $1 million for such leases and services during fiscal years 2012, 2011 and 2010, respectively.
Amounts due from the company’s non-consolidated joint ventures were $18 million and $48 million at September 30, 2012 and 2011, respectively, and are included in Receivables, trade and other, net in the consolidated balance sheet. Amounts due to the company’s non-consolidated joint ventures were $83 million and $125 million at September 30, 2012 and 2011, respectively and are included in Accounts payable in the consolidated balance sheet.
The fair value of the company’s investment in its Automotive Axles Limited joint venture was approximately $42 million at September 30, 2012 and 2011 based on quoted market prices as this joint venture is listed and publicly traded on the Bombay Stock Exchange in India.
The company holds a variable interest in a joint venture accounted for under the equity method of accounting. The joint venture manufactures components for commercial vehicle applications primarily on behalf of the company. The variable interest relates to a supply arrangement between the company and the joint venture whereby the company supplies certain components to the joint venture on a cost-plus basis. The company is not the primary beneficiary of the joint venture, as the joint venture partner has shared or absolute control over key manufacturing operations, labor relationships, financing activities and certain other functions of the joint venture. Therefore, the company does not consolidate the joint venture. At September 30, 2012, the company’s investment in the joint venture was $38 million representing the company’s maximum exposure to loss. This amount is included in investments in non-consolidated joint ventures (see Note 11).
JOB TITLE Meritor 10-K REVISION 3 SERIAL DATE / TIME Friday, November 30, 2012 JOB NUMBER 243020 TYPE PAGE NO. 77 OPERATOR PM2
<12345678>

78
MERITOR, INC.
NOTES TO CONSOLIDATED FINANCIAL STATEMENTS — (Continued)
13. OTHER CURRENT LIABILITIES
Other current liabilities are summarized as follows (in millions):
September 30,
2012 2011
Compensation and benefits . . . . . . . . . . . . . . . . . . . . . . . . . . . . . . . . . . . . . . . . . . . . . . . . . . $136 $148Income taxes . . . . . . . . . . . . . . . . . . . . . . . . . . . . . . . . . . . . . . . . . . . . . . . . . . . . . . . . . . . . 15 23Taxes other than income taxes. . . . . . . . . . . . . . . . . . . . . . . . . . . . . . . . . . . . . . . . . . . . . . . . 41 38Product warranties . . . . . . . . . . . . . . . . . . . . . . . . . . . . . . . . . . . . . . . . . . . . . . . . . . . . . . . . 16 19Restructuring (see Note 5). . . . . . . . . . . . . . . . . . . . . . . . . . . . . . . . . . . . . . . . . . . . . . . . . . . 11 16Asbestos-related liabilities (see Note 22) . . . . . . . . . . . . . . . . . . . . . . . . . . . . . . . . . . . . . . . . 19 18Other . . . . . . . . . . . . . . . . . . . . . . . . . . . . . . . . . . . . . . . . . . . . . . . . . . . . . . . . . . . . . . . . . . 75 66
Other current liabilities . . . . . . . . . . . . . . . . . . . . . . . . . . . . . . . . . . . . . . . . . . . . . . . . . . . $313 $328
The company records estimated product warranty costs at the time of shipment of products to customers. Warranty reserves are primarily based on factors that include past claims experience, sales history, product manufacturing and engineering changes and industry developments. Liabilities for product recall campaigns are recorded at the time the company’s obligation is known and can be reasonably estimated. Product warranties, including recall campaigns, not expected to be paid within one year are recorded as a non-current liability.
A summary of the changes in product warranties is as follows (in millions):
2012 2011 2010
Total product warranties – beginning of year . . . . . . . . . . . . . . . . . . . . . . . . . . . . $ 48 $ 54 $109Accruals for product warranties . . . . . . . . . . . . . . . . . . . . . . . . . . . . . . . . . . . . 22 23 23Payments. . . . . . . . . . . . . . . . . . . . . . . . . . . . . . . . . . . . . . . . . . . . . . . . . . . . (18) (22) (28)Change in estimates and other . . . . . . . . . . . . . . . . . . . . . . . . . . . . . . . . . . . . (8) (7) (11)Product warranty activity related to discontinued operations (1) . . . . . . . . . . . . . — — 1Reclassifications to liabilities of discontinued operations . . . . . . . . . . . . . . . . . . — — (40)
Total product warranties – end of year . . . . . . . . . . . . . . . . . . . . . . . . . . . . . . . . . 44 48 54Less: non-current product warranties (see Note 14) . . . . . . . . . . . . . . . . . . . . . . . (28) (29) (26)
Product warranties – current . . . . . . . . . . . . . . . . . . . . . . . . . . . . . . . . . . . . . . $ 16 $ 19 28
(1) Product warranty activity related to discontinued operations includes accruals for product warranties of $10 million and payments of $9 million in fiscal year 2010.
JOB TITLE Meritor 10-K REVISION 3 SERIAL DATE / TIME Friday, November 30, 2012 JOB NUMBER 243020 TYPE PAGE NO. 78 OPERATOR PM2
<12345678>

79
MERITOR, INC.
NOTES TO CONSOLIDATED FINANCIAL STATEMENTS — (Continued)
14. OTHER LIABILITIES
Other liabilities are summarized as follows (in millions):
September 30,
2012 2011
Asbestos-related liabilities (see Note 22) . . . . . . . . . . . . . . . . . . . . . . . . . . . . . . . . . . . . . . . . $ 93 $ 78Non-current deferred income tax liabilities (see Note 21). . . . . . . . . . . . . . . . . . . . . . . . . . . . . 101 92Liabilities for uncertain tax positions (see Note 21) . . . . . . . . . . . . . . . . . . . . . . . . . . . . . . . . . 27 35Product warranties (see Note 13) . . . . . . . . . . . . . . . . . . . . . . . . . . . . . . . . . . . . . . . . . . . . . . 28 29Environmental (see Note 22) . . . . . . . . . . . . . . . . . . . . . . . . . . . . . . . . . . . . . . . . . . . . . . . . . 10 9Indemnity obligations (see Note 22) . . . . . . . . . . . . . . . . . . . . . . . . . . . . . . . . . . . . . . . . . . . . 32 41Other . . . . . . . . . . . . . . . . . . . . . . . . . . . . . . . . . . . . . . . . . . . . . . . . . . . . . . . . . . . . . . . . . . 47 41
Other liabilities . . . . . . . . . . . . . . . . . . . . . . . . . . . . . . . . . . . . . . . . . . . . . . . . . . . . . . . . . $338 $325
15. LONG-TERM DEBT
Long-Term Debt, net of discounts where applicable, is summarized as follows (in millions):
September 30,
2012 2011
8-3/4 percent notes due 2012 (1) . . . . . . . . . . . . . . . . . . . . . . . . . . . . . . . . . . . . . . . . . $ — $ 848-1/8 percent notes due 2015. . . . . . . . . . . . . . . . . . . . . . . . . . . . . . . . . . . . . . . . . . . . 250 25010-5/8 percent notes due 2018 . . . . . . . . . . . . . . . . . . . . . . . . . . . . . . . . . . . . . . . . . . 247 2464.625 percent convertible notes due 2026 (2) . . . . . . . . . . . . . . . . . . . . . . . . . . . . . . . . 300 3004.0 percent convertible notes due 2027 (2) . . . . . . . . . . . . . . . . . . . . . . . . . . . . . . . . . . 200 200Term loan. . . . . . . . . . . . . . . . . . . . . . . . . . . . . . . . . . . . . . . . . . . . . . . . . . . . . . . . . . . 98 —Lines of credit and other . . . . . . . . . . . . . . . . . . . . . . . . . . . . . . . . . . . . . . . . . . . . . . . . 13 8Unamortized gain on interest rate swap termination . . . . . . . . . . . . . . . . . . . . . . . . . . . . 10 14Unamortized discount on convertible notes. . . . . . . . . . . . . . . . . . . . . . . . . . . . . . . . . . . (58) (68)
Subtotal . . . . . . . . . . . . . . . . . . . . . . . . . . . . . . . . . . . . . . . . . . . . . . . . . . . . . . . . . . 1,060 1,034Less: current maturities. . . . . . . . . . . . . . . . . . . . . . . . . . . . . . . . . . . . . . . . . . . . . . . . . (18) (84)
Long-term debt . . . . . . . . . . . . . . . . . . . . . . . . . . . . . . . . . . . . . . . . . . . . . . . . . . . . $1,042 $ 950
(1) During the quarter ended March 31, 2012, the company retired its $84 million 8-3/4 percent notes due 2012 at par value.
(2) The 4.625 percent and 4 percent convertible notes contain a put and call feature, which allows for earlier redemption beginning in 2016 and 2019, respectively.
Revolving Credit Facility
At September 30, 2011, the company had a revolving credit facility of $441 million which was slated to mature in January 2014. The availability under this facility was dependent upon various factors, including principally performance against certain financial covenants. The $441 million revolving credit facility included $100 million of availability for the issuance of letters of credit.
On April 23, 2012, the company amended and restated its revolving credit facility. Pursuant to the revolving credit facility agreement as amended, the company has a $429 million revolving credit facility, $14 million of which matures in January 2014 for a bank not electing to extend its commitments under the revolving credit facility existing at September 30, 2011 and the remaining $415 million of which matures in April 2017. The April 2017 maturity date is also subject to the following springing maturity conditions: if on June 1, 2015, the outstanding principal amount of the company’s $250 million bonds due 2015 is greater than $100 million, the maturity date becomes June 10, 2015, and if on November 1, 2015, the outstanding principal
JOB TITLE Meritor 10-K REVISION 3 SERIAL DATE / TIME Friday, November 30, 2012 JOB NUMBER 243020 TYPE PAGE NO. 79 OPERATOR PM2
<12345678>

80
MERITOR, INC.
NOTES TO CONSOLIDATED FINANCIAL STATEMENTS — (Continued)
amount of the company’s $300 million 4.625 percent convertibles notes due 2026 is greater than $100 million and the conversion price of $20.98 is greater than the then current Meritor common stock price, the maturity date becomes November 15, 2015. The availability under this facility is dependent upon various factors, including principally performance against certain financial covenants as highlighted below.
The availability under the revolving credit facility is subject to certain financial covenants based on (i) the ratio of the company’s priority debt (consisting principally of amounts outstanding under the revolving credit facility, U.S. accounts receivable securitization and factoring programs, and third-party non-working capital foreign debt) to EBITDA and (ii) the amount of annual capital expenditures. The company is required to maintain a total priority-debt-to-EBITDA ratio, as defined in the agreement, of (i) 2.50 to 1.00 as of the last day of the fiscal quarter commencing with the fiscal quarter ending on or about March 31, 2012 through and including the fiscal quarter ending on or about September 30, 2012, (ii) 2.25 to 1.00 as of the last day of each fiscal quarter commencing with the fiscal quarter ending on or about December 31, 2012 through and including the fiscal quarter ending on or about September 30, 2013, and (iii) 2.00 to 1.00 as of the last day of each fiscal quarter thereafter. At September 30, 2012, the company was in compliance with all covenants under its credit agreement with a ratio of approximately 0.55x for the priority debt-to-EBITDA covenant.
Availability under the amended and extended revolving credit facility is also subject to a collateral test, pursuant to which borrowings on the revolving credit facility cannot exceed 1.0x the collateral test value. The collateral test is performed on a quarterly basis. At September 30, 2012, the revolving credit facility was collateralized by approximately $611 million of the company’s assets, primarily consisting of eligible domestic U.S. accounts receivable, inventory, plant, property and equipment, intellectual property and the company’s investment in all or a portion of certain of its wholly-owned subsidiaries.
Borrowings under the revolving credit facility are subject to interest based on quoted LIBOR rates plus a margin and a commitment fee on undrawn amounts, both of which are based upon the company’s current corporate credit rating for senior secured facilities. At September 30, 2012, the margin over LIBOR rate was 425 basis points, and the commitment fee was 50 basis points. Although a majority of our revolving credit loans are LIBOR based, overnight revolving credit loans are at the prime rate plus a margin of 325 basis points.
Certain of the company’s subsidiaries, as defined in the credit agreement, irrevocably and unconditionally guarantee amounts outstanding under the revolving credit facility. Similar subsidiary guarantees are provided for the benefit of the holders of the publicly-held notes outstanding under the company’s indentures (see Note 27).
No borrowings were outstanding under the revolving credit facility at September 30, 2012 and September 30, 2011. The amended and extended revolving credit facility includes $100 million of availability for the issuance of letters of credit. At September 30, 2012, $1 million of letters of credit were outstanding under the revolving credit facility. No letters of credit were outstanding on September 30, 2011.
Term Loan
As part of the amendment and restatement of the revolving credit facility, on April 23, 2012 the company entered into a $100 million term loan agreement with a maturity date of April 23, 2017. The maturity date of April 23, 2017 is also subject to the same springing maturity conditions discussed under “Revolving Credit Facility” above. The term loan will amortize over a period of 5 years from the effective date as follows: $5 million principal to be repaid during year one, $10 million principal to be repaid in each of the years two, three and four; and the remaining principal balance to be paid in year five. Principal payments will be made on a quarterly basis for the duration of the term loan. As of the effective date of the term loan, the margin over LIBOR rate was 425 basis points. The company has the ability to prepay the term loan at any time without penalty or premium. At September 30, 2012, the outstanding balance on the term loan was $98 million.
Debt Securities
On March 3, 2010, the company completed a public offering of debt securities consisting of the issuance of $250 million 8-year fixed rate 10-5/8 percent notes due March 15, 2018. The offering was made pursuant to a shelf registration statement filed with the Securities and Exchange Commission on November 20, 2009, which became effective December 23, 2009, registering $750 million aggregate debt and/or equity securities that may be offered in one or more series on terms to be determined at the
JOB TITLE Meritor 10-K REVISION 3 SERIAL DATE / TIME Friday, November 30, 2012 JOB NUMBER 243020 TYPE PAGE NO. 80 OPERATOR PM2
<12345678>

81
MERITOR, INC.
NOTES TO CONSOLIDATED FINANCIAL STATEMENTS — (Continued)
time of sale. The notes were issued at a discounted price of 98.024 percent of their principal amount. The proceeds from the sale of the notes, net of discount, were $245 million and were primarily used to repurchase $175 million of the company’s previously outstanding $276 million 8-3/4 percent notes due 2012.
On March 23, 2010, the company completed the debt tender offer for its 8-3/4 percent notes due March 1, 2012. The notes were repurchased at 109.75 percent of their principal amount. The repurchase of $175 million of 8-3/4 percent notes was accounted for as an extinguishment of debt and, accordingly, the company recognized a net loss on debt extinguishment of approximately $13 million, which is included in interest expense, net in the consolidated statement of income. The loss on debt extinguishment was primarily related to the $17 million paid in excess of par to repurchase the $175 million of 8-3/4 percent notes, partially offset by a $6 million gain associated with the acceleration of previously deferred unamortized interest rate swap gains associated with the 8-3/4 percent notes.
On June 15, 2010, the company purchased in the open market $17 million of its 8-3/4 percent notes due March 1, 2012. The notes were repurchased at 104.875 percent of their principal amount. On June 17, 2010, the company purchased in the open market $1 million of its 8-1/8 percent notes due September 15, 2015. The notes were repurchased at 94.000 percent of their principal amount.
In February 2012, we filed a shelf registration statement with the Securities and Exchange Commission, which was amended in November 2012, registering up to $750 million of debt and/or equity securities that we may offer in one or more series on terms to be determined at the time of sale.
Convertible Securities
In February 2007, the company issued $200 million of 4.00 percent convertible senior unsecured notes due 2027 (the 2007 convertible notes). In March 2006, the company issued $300 million of 4.625 percent convertible senior unsecured notes due 2026 (the 2006 convertible notes). The 2007 convertible notes bear cash interest at a rate of 4.00 percent per annum from the date of issuance through February 15, 2019, payable semi-annually in arrears on February 15 and August 15 of each year. After February 15, 2019, the principal amount of the notes will be subject to accretion at a rate that provides holders with an aggregate annual yield to maturity of 4.00 percent. The 2006 convertible notes bear cash interest at a rate of 4.625 percent per annum from the date of issuance through March 1, 2016, payable semi-annually in arrears on March 1 and September 1 of each year. After March 1, 2016, the principal amount of the notes will be subject to accretion at a rate that provides holders with an aggregate annual yield to maturity of 4.625 percent.
In May 2008, the FASB issued guidance contained in Accounting Standards Codification (ASC) Topic 470-20, “Debt with Conversion and Other Options” which applies to all convertible debt instruments that have a “net settlement feature”, which means that such convertible debt instruments, by their terms, may be settled either wholly or partially in cash upon conversion. This topic requires issuers of convertible debt instruments that may be settled wholly or partially in cash upon conversion to separately account for the liability and equity components in a manner reflective of the issuers’ nonconvertible debt borrowing rate.
This guidance impacted the company’s accounting for the convertible notes issued in 2006 and 2007. On October 1, 2009, the company adopted this guidance and applied its impact retrospectively to all periods presented. Upon adoption, the company recognized the estimated equity component of the convertible notes of $108 million ($69 million after tax) in additional paid-in capital. In addition, the company allocated $4 million of unamortized debt issuance costs to the equity component and recognized this amount as a reduction to additional paid-in capital. The company also recognized a discount on convertible notes of $108 million, which is being amortized as non-cash interest expense over periods of ten and twelve years for the 2006 convertible notes and 2007 convertible notes, respectively.
Upon recognition of the equity component of the convertible notes, the company also recognized a deferred tax liability of $39 million as the tax effect of the basis difference between carrying and notional values of the convertible notes. The carrying value of this deferred tax liability was offset with certain net deferred tax assets in the first quarter of fiscal year 2009 for determining valuation allowances against those deferred tax assets (see Note 21).
JOB TITLE Meritor 10-K REVISION 3 SERIAL DATE / TIME Friday, November 30, 2012 JOB NUMBER 243020 TYPE PAGE NO. 81 OPERATOR PM2
<12345678>
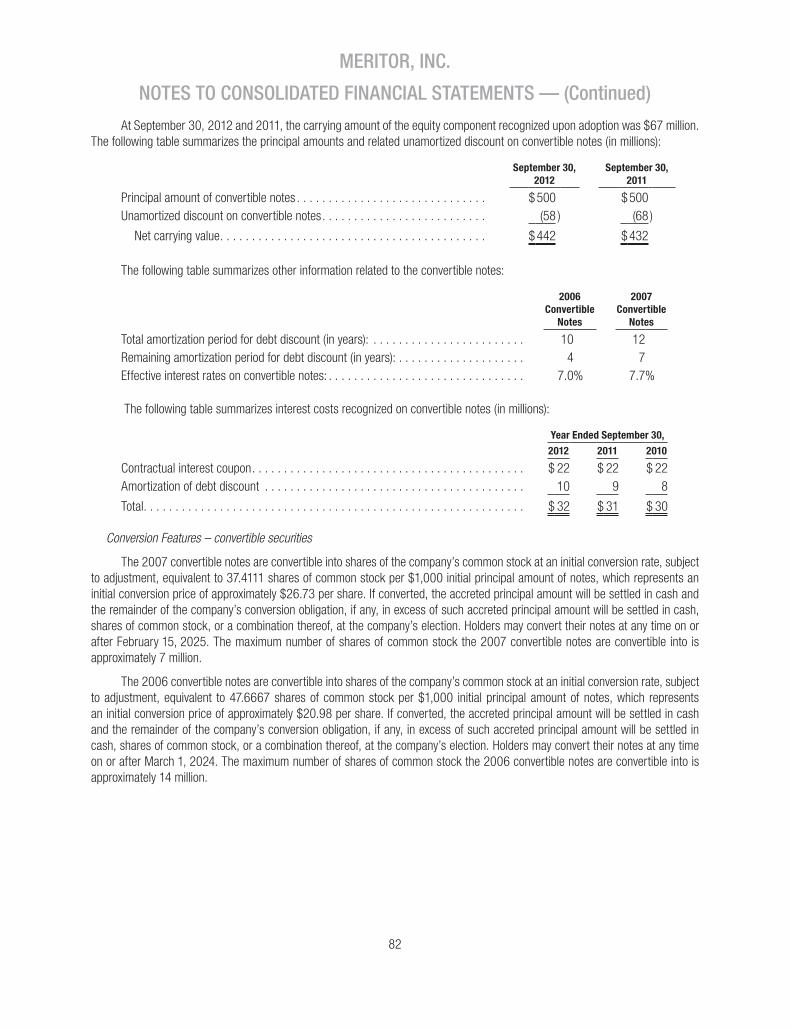
82
MERITOR, INC.
NOTES TO CONSOLIDATED FINANCIAL STATEMENTS — (Continued)
At September 30, 2012 and 2011, the carrying amount of the equity component recognized upon adoption was $67 million. The following table summarizes the principal amounts and related unamortized discount on convertible notes (in millions):
September 30, 2012
September 30, 2011
Principal amount of convertible notes . . . . . . . . . . . . . . . . . . . . . . . . . . . . . . $500 $500Unamortized discount on convertible notes. . . . . . . . . . . . . . . . . . . . . . . . . . (58 ) (68 )
Net carrying value. . . . . . . . . . . . . . . . . . . . . . . . . . . . . . . . . . . . . . . . . . $442 $432
The following table summarizes other information related to the convertible notes:
2006 Convertible
Notes
2007 Convertible
Notes
Total amortization period for debt discount (in years): . . . . . . . . . . . . . . . . . . . . . . . . 10 12Remaining amortization period for debt discount (in years): . . . . . . . . . . . . . . . . . . . . 4 7Effective interest rates on convertible notes: . . . . . . . . . . . . . . . . . . . . . . . . . . . . . . . 7.0% 7.7%
The following table summarizes interest costs recognized on convertible notes (in millions):
Year Ended September 30,
2012 2011 2010
Contractual interest coupon. . . . . . . . . . . . . . . . . . . . . . . . . . . . . . . . . . . . . . . . . . . $ 22 $ 22 $ 22Amortization of debt discount . . . . . . . . . . . . . . . . . . . . . . . . . . . . . . . . . . . . . . . . . 10 9 8
Total. . . . . . . . . . . . . . . . . . . . . . . . . . . . . . . . . . . . . . . . . . . . . . . . . . . . . . . . . . . . $ 32 $ 31 $ 30
Conversion Features – convertible securities
The 2007 convertible notes are convertible into shares of the company’s common stock at an initial conversion rate, subject to adjustment, equivalent to 37.4111 shares of common stock per $1,000 initial principal amount of notes, which represents an initial conversion price of approximately $26.73 per share. If converted, the accreted principal amount will be settled in cash and the remainder of the company’s conversion obligation, if any, in excess of such accreted principal amount will be settled in cash, shares of common stock, or a combination thereof, at the company’s election. Holders may convert their notes at any time on or after February 15, 2025. The maximum number of shares of common stock the 2007 convertible notes are convertible into is approximately 7 million.
The 2006 convertible notes are convertible into shares of the company’s common stock at an initial conversion rate, subject to adjustment, equivalent to 47.6667 shares of common stock per $1,000 initial principal amount of notes, which represents an initial conversion price of approximately $20.98 per share. If converted, the accreted principal amount will be settled in cash and the remainder of the company’s conversion obligation, if any, in excess of such accreted principal amount will be settled in cash, shares of common stock, or a combination thereof, at the company’s election. Holders may convert their notes at any time on or after March 1, 2024. The maximum number of shares of common stock the 2006 convertible notes are convertible into is approximately 14 million.
JOB TITLE Meritor 10-K REVISION 3 SERIAL DATE / TIME Friday, November 30, 2012 JOB NUMBER 243020 TYPE PAGE NO. 82 OPERATOR PM2
<12345678>

83
MERITOR, INC.
NOTES TO CONSOLIDATED FINANCIAL STATEMENTS — (Continued)
Prior to February 15, 2025 (2007 convertible notes) and March 1, 2024 (2006 convertible notes), holders may convert their notes only under the following circumstances:
• during any calendar quarter, if the closing price of the company’s common stock for 20 or more trading days in a period of 30 consecutive trading days ending on the last trading day of the immediately preceding calendar quarter exceeds 120 percent of the applicable conversion price;
• during the five business day period after any five consecutive trading day period in which the average trading price per $1,000 initial principal amount of notes is equal to or less than 97 percent of the average conversion value of the notes during such five consecutive trading day period;
• upon the occurrence of specified corporate transactions; or
• if the notes are called by the company for redemption.
Redemption Features – convertible securities
On or after February 15, 2019, the company may redeem the 2007 convertible notes, in whole or in part, for cash at a redemption price equal to 100 percent of the accreted principal amount plus any accrued and unpaid interest. On each of February 15, 2019 and 2022, or upon certain fundamental changes, holders may require the company to purchase all or a portion of their 2007 convertible notes at a purchase price in cash equal to 100 percent of the accreted principal amount plus any accrued and unpaid interest.
On or after March 1, 2016, the company may redeem the 2006 convertible notes, in whole or in part, for cash at a redemption price equal to 100 percent of the accreted principal amount plus any accrued and unpaid interest. On each of March 1, 2016, 2018, 2020, 2022 and 2024, or upon certain fundamental changes, holders may require the company to purchase all or a portion of their 2006 convertible notes at a purchase price in cash equal to 100 percent of the accreted principal amount plus any accrued and unpaid interest.
The 2007 and 2006 convertible notes are fully and unconditionally guaranteed by certain subsidiaries of the company that currently guarantee the company’s obligations under its senior secured credit facility and other publicly-held notes (see Revolving Credit Facility above).
Capital Leases
On March 20, 2012, the company entered into an arrangement to finance equipment acquisitions for various U.S. locations. Under this arrangement, the company can request financing from GE Capital Commercial, Inc. (GE Capital) for progress payments for equipment under construction, not to exceed $10 million at any point in time. The financing rate is equal to the 30-day LIBOR plus 575 basis points per annum. Under this arrangement, the company can also enter into lease arrangements with GE Capital for completed equipment. The lease term is 60 months and the lease interest rate is equal to the 5-year Swap Rate published by the Federal Reserve Board plus 564 basis points. As of September 30, 2012, the company had $6 million outstanding under these arrangements.
Letter of Credit Facilities
The company entered into a five-year credit agreement dated as of November 18, 2010 with Citicorp USA, Inc., as administrative agent and issuing bank, the other lenders party thereto and the Bank of New York Mellon, as paying agent. Under the terms of this credit agreement, as amended, the company has the right to obtain the issuance, renewal, extension and increase of letters of credit up to an aggregate availability of $30 million. This facility contains covenants and events of default generally similar to those existing in the company’s public debt indentures. At September 30, 2012 and 2011, $30 million of letters of credit were outstanding under this facility. In addition, the company had $18 million and $2 million of letters of credit outstanding through other letters of credit facilities at each of September 30, 2012 and 2011.
JOB TITLE Meritor 10-K REVISION 3 SERIAL DATE / TIME Friday, November 30, 2012 JOB NUMBER 243020 TYPE PAGE NO. 83 OPERATOR PM2
<12345678>

84
MERITOR, INC.
NOTES TO CONSOLIDATED FINANCIAL STATEMENTS — (Continued)
Accounts Receivable Securitization
On June 18, 2012, the company entered into a new $100 million U.S. accounts receivables securitization facility, which expires on June 18, 2015. This program is provided by PNC Bank, National Association (PNC), as Administrator, Market Street Funding, LLC, and the other Purchasers and Purchaser Agents from time to time (participating lenders), which are party to the agreement. Under this program, the company has the ability to sell an undivided percentage ownership interest in substantially all of its trade receivables (excluding the receivables due from AB Volvo and subsidiaries eligible for sale under the U.S. Factoring Facility and certain other receivables) of certain U.S. subsidiaries to ArvinMeritor Receivables Corporation (ARC), a wholly-owned, special purpose subsidiary. ARC funds these purchases with borrowings from participating lenders under a loan agreement. This program also includes a letter of credit facility pursuant to which ARC may request the issuance of letters of credit issued for the company’s U.S. subsidiaries (originators) or their designees, which when issued will constitute a utilization of the facility for the amount of letters of credit issued. Amounts outstanding under this agreement are collateralized by eligible receivables purchased by ARC and are reported as short-term debt in the consolidated balance sheet. At September 30, 2012, no amounts, including letters of credit, were outstanding under this program. This program contains a financial covenant related to the company’s priority-debt-to-EBITDA ratio, which is identical to the corresponding covenant in the company’s revolving credit facility as it exists on the date of the agreement. In addition, this securitization program contains and a cross default to the company’s revolving credit facility. The weighted average interest rate on borrowings under this arrangement was approximately 1.59 percent at September 30, 2012.
At September 30, 2011, the company had a $125 million U.S. accounts receivables financing arrangement which was provided on a committed basis by a syndicate of financial institutions led by Ally Commercial Finance LLC and was due to expire in October 2013. In connection with entering into the new U.S. Securitization Program discussed above, the company terminated this receivables financing arrangement. No amounts were outstanding under this program at September 30, 2011.
Interest Rate Swap Agreements
In August 2012, the company entered into a four-year interest rate swap arrangement that effectively converted the variable interest rate on its term loan expressed as a LIBOR-based rate into a variable interest rate based on U.S. federal funds rate. The notional amount of the arrangement is $50 million, which is approximately 50 percent of the amount outstanding under our term loan. The arrangement does not meet the hedge accounting requirements; therefore, the mark-to-market adjustments related to the fair value of derivative are recorded as interest expense in the consolidated statement of income. Fair value of the derivative related to this arrangement was not significant at September 30, 2012.
In March 2010, the company entered into an interest rate swap agreement that effectively converted $125 million of the company’s 8-1/8 percent notes due 2015 to variable interest rates. The swap was designated as a fair value hedge and the impact of the changes in its fair values was offset by an equal and opposite change in the carrying value of the related notes. Under the terms of the swap agreement, the company received a fixed rate of interest of 8-1/8 percent on notional amounts of $125 million and paid a variable rate based on U.S. dollar six-month LIBOR plus a spread of 4.61 percent. The payments under the swap agreement coincided with the interest payment dates on the hedged debt instrument, and the difference between the amounts paid and received is included in interest expense, net. In July 2010, the company terminated the interest rate swap agreement and received proceeds from the termination of approximately $7 million.
The unamortized fair value adjustment of the notes associated with terminated interest rate swaps was $10 million and $14 million at September 30, 2012 and 2011, respectively. The fair value adjustment of the notes is classified as long-term debt in the consolidated balance sheet and is amortized to earnings as a reduction of interest expense over the remaining term of the debt.
Operating Leases
The company has various operating leasing arrangements. Future minimum lease payments under these operating leases are $17 million in 2013, $14 million in 2014, $13 million in 2015, $12 million in 2016, $12 million in 2017 and $23 million thereafter.
JOB TITLE Meritor 10-K REVISION 3 SERIAL DATE / TIME Friday, November 30, 2012 JOB NUMBER 243020 TYPE PAGE NO. 84 OPERATOR PM2
<12345678>
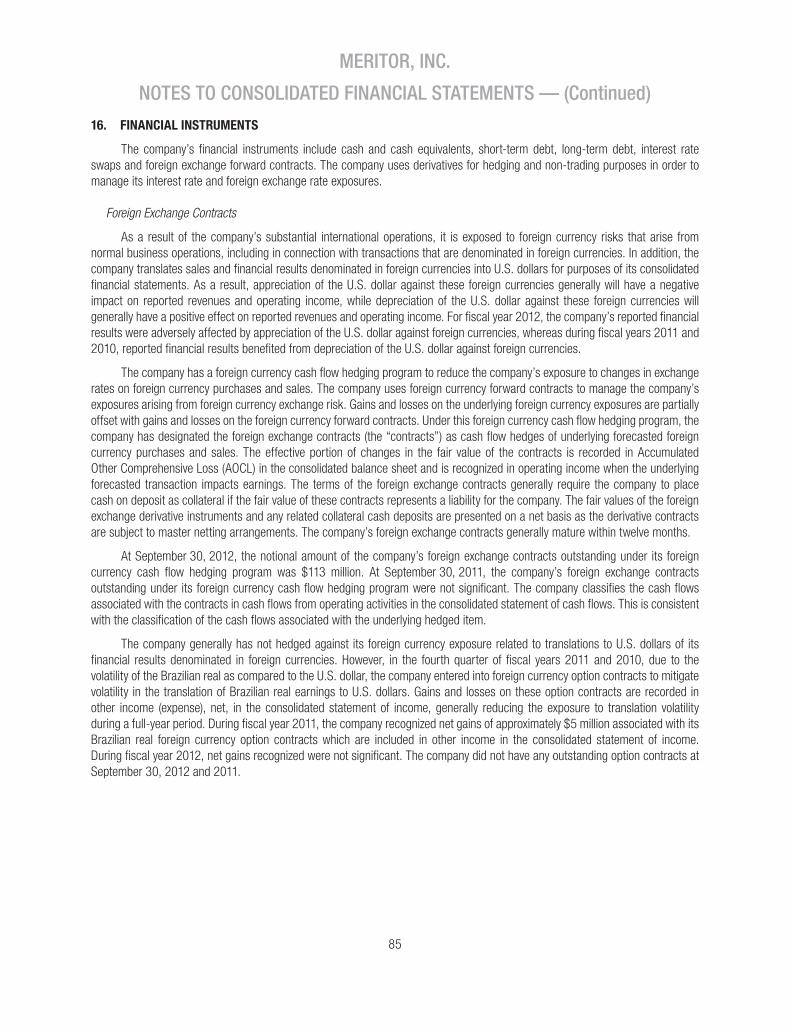
85
MERITOR, INC.
NOTES TO CONSOLIDATED FINANCIAL STATEMENTS — (Continued)
16. FINANCIAL INSTRUMENTS
The company’s financial instruments include cash and cash equivalents, short-term debt, long-term debt, interest rate swaps and foreign exchange forward contracts. The company uses derivatives for hedging and non-trading purposes in order to manage its interest rate and foreign exchange rate exposures.
Foreign Exchange Contracts
As a result of the company’s substantial international operations, it is exposed to foreign currency risks that arise from normal business operations, including in connection with transactions that are denominated in foreign currencies. In addition, the company translates sales and financial results denominated in foreign currencies into U.S. dollars for purposes of its consolidated financial statements. As a result, appreciation of the U.S. dollar against these foreign currencies generally will have a negative impact on reported revenues and operating income, while depreciation of the U.S. dollar against these foreign currencies will generally have a positive effect on reported revenues and operating income. For fiscal year 2012, the company’s reported financial results were adversely affected by appreciation of the U.S. dollar against foreign currencies, whereas during fiscal years 2011 and 2010, reported financial results benefited from depreciation of the U.S. dollar against foreign currencies.
The company has a foreign currency cash flow hedging program to reduce the company’s exposure to changes in exchange rates on foreign currency purchases and sales. The company uses foreign currency forward contracts to manage the company’s exposures arising from foreign currency exchange risk. Gains and losses on the underlying foreign currency exposures are partially offset with gains and losses on the foreign currency forward contracts. Under this foreign currency cash flow hedging program, the company has designated the foreign exchange contracts (the “contracts”) as cash flow hedges of underlying forecasted foreign currency purchases and sales. The effective portion of changes in the fair value of the contracts is recorded in Accumulated Other Comprehensive Loss (AOCL) in the consolidated balance sheet and is recognized in operating income when the underlying forecasted transaction impacts earnings. The terms of the foreign exchange contracts generally require the company to place cash on deposit as collateral if the fair value of these contracts represents a liability for the company. The fair values of the foreign exchange derivative instruments and any related collateral cash deposits are presented on a net basis as the derivative contracts are subject to master netting arrangements. The company’s foreign exchange contracts generally mature within twelve months.
At September 30, 2012, the notional amount of the company’s foreign exchange contracts outstanding under its foreign currency cash flow hedging program was $113 million. At September 30, 2011, the company’s foreign exchange contracts outstanding under its foreign currency cash flow hedging program were not significant. The company classifies the cash flows associated with the contracts in cash flows from operating activities in the consolidated statement of cash flows. This is consistent with the classification of the cash flows associated with the underlying hedged item.
The company generally has not hedged against its foreign currency exposure related to translations to U.S. dollars of its financial results denominated in foreign currencies. However, in the fourth quarter of fiscal years 2011 and 2010, due to the volatility of the Brazilian real as compared to the U.S. dollar, the company entered into foreign currency option contracts to mitigate volatility in the translation of Brazilian real earnings to U.S. dollars. Gains and losses on these option contracts are recorded in other income (expense), net, in the consolidated statement of income, generally reducing the exposure to translation volatility during a full-year period. During fiscal year 2011, the company recognized net gains of approximately $5 million associated with its Brazilian real foreign currency option contracts which are included in other income in the consolidated statement of income. During fiscal year 2012, net gains recognized were not significant. The company did not have any outstanding option contracts at September 30, 2012 and 2011.
JOB TITLE Meritor 10-K REVISION 3 SERIAL DATE / TIME Friday, November 30, 2012 JOB NUMBER 243020 TYPE PAGE NO. 85 OPERATOR PM2
<12345678>

86
MERITOR, INC.
NOTES TO CONSOLIDATED FINANCIAL STATEMENTS — (Continued)
The following table summarizes the impact of the company’s derivatives instruments on comprehensive income for fiscal years ended September 30 (in millions):
Location ofGain (Loss) 2012 2011 2010
Derivatives designated as hedging instruments: Amount of gain recognized in AOCL
(effective portion) . . . . . . . . . . . . . . . . . . . . . . . . . . . . . . . . . . . . . . . . . . AOCL $ 3 $ — $ 3Amount of gain (loss) reclassified from AOCL
into income (effective portion) . . . . . . . . . . . . . . . . . . . . . . . . . . . . . . . . . Cost of Sales 3 (1 ) 1Derivatives not designated as hedging instruments:
Amount of gain (loss) recognized in income . . . . . . . . . . . . . . . . . . . . . . . . . Other Income — 5 (1 )
Fair Value
Fair values of financial instruments are summarized as follows (in millions):
September 30, 2012
September 30, 2011
CarryingValue
FairValue
CarryingValue
FairValue
Cash and cash equivalents . . . . . . . . . . . . . . . . . . . . . . . . . . . . . . $ 257 $ 257 $217 $217Short-term debt . . . . . . . . . . . . . . . . . . . . . . . . . . . . . . . . . . . . . . 18 17 84 83Long-term debt. . . . . . . . . . . . . . . . . . . . . . . . . . . . . . . . . . . . . . . 1,042 1,036 950 844Foreign exchange forward contracts (asset) . . . . . . . . . . . . . . . . . . 3 3 — —Foreign exchange forward contracts (liability) . . . . . . . . . . . . . . . . . 1 1 — —
The current FASB guidance provides a fair value hierarchy that prioritizes the inputs to valuation techniques used to measure fair value. The hierarchy gives the highest priority to unadjusted quoted prices in active markets for identical instruments (Level 1) and the lowest priority to unobservable inputs (Level 3). The three levels of the fair value hierarchy are described below:
• Level 1 inputs use quoted prices in active markets for identical instruments.
• Level 2 inputs use other inputs that are observable, either directly or indirectly. These Level 2 inputs include quoted prices for similar instruments in active markets, and other inputs such as interest rates and yield curves that are observable at commonly quoted intervals.
• Level 3 inputs are unobservable inputs, including inputs that are available in situations where there is little, if any, market activity for the related instrument.
In instances where inputs used to measure fair value fall into different levels in the above fair value hierarchy, fair value measurements in their entirety are categorized based on the lowest level input that is significant to the valuation. The company’s assessment of the significance of particular inputs to these fair value measurements requires judgment and considers factors specific to each asset or liability.
JOB TITLE Meritor 10-K REVISION 3 SERIAL DATE / TIME Friday, November 30, 2012 JOB NUMBER 243020 TYPE PAGE NO. 86 OPERATOR PM2
<12345678>

87
MERITOR, INC.
NOTES TO CONSOLIDATED FINANCIAL STATEMENTS — (Continued)
Fair value of financial instruments by the valuation hierarchy at September 30, 2012 is as follows (in millions):
Level 1 Level 2 Level 3
Short-term debt . . . . . . . . . . . . . . . . . . . . . . . . . . . . . . . . . . . . . . . . . . . . $ — $ — $ 17Long-term debt. . . . . . . . . . . . . . . . . . . . . . . . . . . . . . . . . . . . . . . . . . . . . — 946 90Foreign exchange forward contracts (asset) . . . . . . . . . . . . . . . . . . . . . . . . — 3 —Foreign exchange forward contracts (liability) . . . . . . . . . . . . . . . . . . . . . . . — 1 —
Cash and cash equivalents — All highly liquid investments purchased with an original maturity of three months or less are considered to be cash equivalents. The carrying value approximates fair value because of the short maturity of these instruments. The company did not have any cash equivalents at September 30, 2012 or September 30, 2011.
Short- and Long-term debt — Fair values are based on transaction prices at public exchange for publicly traded debt. For debt instruments that are not publicly traded, fair values are based on interest rates that would be currently available to the company for issuance of similar types of debt instruments with similar terms and remaining maturities.
Foreign exchange forward contracts — The company uses foreign exchange forward purchase and sale contracts with terms of one year or less to hedge its exposure to changes in foreign currency exchange rates. The fair value of foreign exchange forward contracts is based on a model which incorporates observable inputs including quoted spot rates, forward exchange rates and discounted future expected cash flows utilizing market interest rates with similar quality and maturity characteristics.
17. SHAREOWNERS’ EQUITY
Common Stock
The company is authorized to issue 500 million shares of Common Stock, with a par value of $1 per share, and 30 million shares of Preferred Stock, without par value, of which two million shares are designated as Series A Junior Participating Preferred Stock (Junior Preferred Stock). No shares of Junior Preferred Stock have been issued. The company’s Rights Plan, under which Preferred Share Purchase Rights were issued, expired by its terms on July 7, 2010 and the Rights under such Plan expired as well.
In March 2010, the company completed an equity offering of 19,952,500 common shares, par value of $1 per share, at a price of $10.50 per share. The proceeds of the offering of $200 million, net of underwriting discounts and commissions, were primarily used to repay outstanding indebtedness under the revolving credit facility and under the U.S. accounts receivable securitization program. The offering was made pursuant to the a shelf registration statement filed in November 2009, which became effective in December 2009, registering $750 million aggregate debt and/or equity securities that may be offered in one or more series on terms to be determined at the time of sale.
In February 2012, we filed a shelf registration statement with the Securities and Exchange Commission, which was amended in November 2012, registering up to $750 million of debt and/or equity securities that we may offer in one or more series on terms to be determined at the time of sale.
The company has reserved approximately 4.9 million shares of Common Stock in connection with its 2010 Long-Term Incentive Plan, as amended (LTIP) for grants of non-qualified stock options, incentive stock options, stock appreciation rights, restricted stock, performance shares, restricted share units and stock awards to key employees and directors. At September 30, 2012, there were 2.4 million shares available for future grants under these plans.
JOB TITLE Meritor 10-K REVISION 3 SERIAL DATE / TIME Friday, November 30, 2012 JOB NUMBER 243020 TYPE PAGE NO. 87 OPERATOR PM2
<12345678>

88
MERITOR, INC.
NOTES TO CONSOLIDATED FINANCIAL STATEMENTS — (Continued)
Accumulated Other Comprehensive Loss
The components of AOCL as reported in the Consolidated Balance Sheet and Statement of Shareowners’ Equity are as follows (in millions):
September 30
2012 2011 2010
Foreign currency translation . . . . . . . . . . . . . . . . . . . . . . . . . . . . . . . . . . . . $ 93 $ 110 $ 179Employee benefit related adjustments . . . . . . . . . . . . . . . . . . . . . . . . . . . . . (1,010 ) (942 ) (995 )Unrealized gains, net. . . . . . . . . . . . . . . . . . . . . . . . . . . . . . . . . . . . . . . . . . 2 3 4Accumulated Other Comprehensive Loss . . . . . . . . . . . . . . . . . . . . . . . . . . . $ (915 ) $(829 ) $(812 )
18. EQUITY BASED COMPENSATION
Stock Options
Under the company’s incentive plans, stock options are granted at prices equal to the fair value on the date of grant and have a maximum term of 10 years. Stock options vest over a three-year period from the date of grant. No stock options were granted during fiscal years 2012, 2011 and 2010.
The following is a rollforward of stock options for fiscal year 2012 (shares in thousands, exercise price and remaining contractual term represent weighted averages and aggregate intrinsic values in millions):
SharesExercise
Price
RemainingContractualLife (years)
AggregateIntrinsic
Value
Outstanding — beginning of year . . . . . . . . . . . . . . . . . . . 952 $16.71Exercised . . . . . . . . . . . . . . . . . . . . . . . . . . . . . . . . . . . . . — —Cancelled or expired . . . . . . . . . . . . . . . . . . . . . . . . . . . . . (300) 19.95Outstanding — end of year . . . . . . . . . . . . . . . . . . . . . . . . 652 $15.22 3.2 —
Exercisable — end of year . . . . . . . . . . . . . . . . . . . . . . . . 652 $15.22 3.2 —
The following table provides additional information about outstanding stock options at September 30, 2012 (shares in thousands, exercise price represents a weighted average):
Outstanding Exercisable
Shares
RemainingContractualLife (years)
ExercisePrice Shares
ExercisePrice
$12.00 to $15.00 . . . . . . . . . . . . . . . . . . . . . . . . . 300 5.8 $12.78 300 $12.78$15.01 to $17.00 . . . . . . . . . . . . . . . . . . . . . . . . . 113 0.2 15.45 113 15.45$17.01 to $19.00 . . . . . . . . . . . . . . . . . . . . . . . . . 239 1.4 18.18 239 18.18
Total . . . . . . . . . . . . . . . . . . . . . . . . . . . . . . . . 652 652
Compensation expense is recognized for the non-vested portion of previously issued stock options. No compensation expense associated with the expensing of stock options was recognized in fiscal year 2012. Compensation expense associated with the expensing of stock options was not significant in fiscal years 2011 and 2010. Options exercised in fiscal year 2011 were approximately 321,000. No options were exercised in fiscal years 2012 and 2010.
JOB TITLE Meritor 10-K REVISION 3 SERIAL DATE / TIME Friday, November 30, 2012 JOB NUMBER 243020 TYPE PAGE NO. 88 OPERATOR PM2
<12345678>

89
MERITOR, INC.
NOTES TO CONSOLIDATED FINANCIAL STATEMENTS — (Continued)
Restricted Stock and Restricted Units
The company has granted shares of restricted stock and restricted share units to certain employees and non-employee members of the Board of Directors in accordance with the existing plans. The company measures the grant price fair value of these stock based awards at the market price of the company’s common stock as of the date of the grant. Employee awards typically vest at the end of three years and are subject to continued employment by the employee. Compensation cost associated with stock based awards is recognized ratably over the vesting period. Cash dividends on the restricted stock, if any, are reinvested in additional shares of common stock during the vesting period.
In fiscal years 2012, 2011 and 2010, the company granted 1,325,447, 465,488, and 965,480 shares of stock based awards, respectively. The grant date weighted average fair value of these shares was $6.14, $18.89, and $8.57 for shares granted in fiscal years 2012, 2011 and 2010, respectively.
The following is a rollforward of the company’s non-vested restricted shares and share units as of September 30, 2012, and the activity during fiscal year 2012 are summarized as follows (shares in thousands):
Non-vested SharesNumber of
Shares
Weighted- Average
Grant-Date Fair Value
Non-vested - beginning of year . . . . . . . . . . . . . . . . . . . . . . . . . . . . . . . . . . . . . . . . . 458 $8.41Granted . . . . . . . . . . . . . . . . . . . . . . . . . . . . . . . . . . . . . . . . . . . . . . . . . . . . . . . . . . 1,325 6.14Vested . . . . . . . . . . . . . . . . . . . . . . . . . . . . . . . . . . . . . . . . . . . . . . . . . . . . . . . . . . . (1,082) 7.58Forfeited . . . . . . . . . . . . . . . . . . . . . . . . . . . . . . . . . . . . . . . . . . . . . . . . . . . . . . . . . (229) 9.07
Non-vested - end of year. . . . . . . . . . . . . . . . . . . . . . . . . . . . . . . . . . . . . . . . . . . . . . 472 7.27
As of September 30, 2012, there was $3 million of total unrecognized compensation costs related to non-vested equity compensation arrangements. These costs are expected to be recognized over a weighted average period of 1 year. Total compensation expense recognized for restricted stock and restricted share units was $6 million for fiscal year 2012 and $7 million in each of fiscal years 2011 and 2010.
19. RETIREMENT MEDICAL PLANS
The company has retirement medical plans that cover certain of its U.S. and non-U.S. employees, including certain employees of divested businesses, and provide for medical payments to eligible employees and dependents upon retirement. These plans are unfunded.
The company approved amendments to certain retiree medical plans in fiscal years 2002 and 2004. These plan amendments were challenged in three separate class action lawsuits that were filed in the United States District Court for the Eastern District of Michigan (District Court). The lawsuits alleged that the changes breach the terms of various collective bargaining agreements entered into with the United Auto Workers (the UAW lawsuit) at facilities that have either been closed or sold. The complaints also alleged a companion claim under the Employee Retirement Income Security Act of 1974 (ERISA) essentially restating the alleged collective bargaining breach claims and seeking to bring them under ERISA. Plaintiffs sought injunctive relief requiring the company to provide lifetime retiree health care benefits under the applicable collective bargaining agreements.
On December 22, 2005, the District Court issued an order granting a motion by the UAW for a preliminary injunction. The order enjoined the company from implementing the changes to retiree health benefits that had been scheduled to become effective on January 1, 2006, and ordered the company to reinstate and resume paying the full cost of health benefits for the UAW retirees at the levels existing prior to the changes approved in 2002 and 2004. On August 17, 2006, the District Court denied a motion by the company and the other defendants for summary judgment; granted a motion by the UAW for summary judgment; and granted the UAW’s request to make the terms of the preliminary injunction permanent (the injunction). Due to the uncertainty related to the ongoing lawsuits and because the injunction had the impact of at least temporarily changing the benefits provided under
JOB TITLE Meritor 10-K REVISION 3 SERIAL DATE / TIME Friday, November 30, 2012 JOB NUMBER 243020 TYPE PAGE NO. 89 OPERATOR PM2
<12345678>

90
MERITOR, INC.
NOTES TO CONSOLIDATED FINANCIAL STATEMENTS — (Continued)
the existing postretirement medical plans, the company accounted for the injunction as a rescission of the 2002 and 2004 plan amendments that modified UAW retiree healthcare benefits. The company began recording the impact of the injunction in March 2006. In addition, the injunction ordered the defendants to reimburse the plaintiffs for out-of-pocket expenses incurred since the date of the earlier benefit modifications. The company has recorded a $5 million reserve at September 30, 2012 and 2011 as the best estimate of its liability for these retroactive benefits. The company continues to believe it has meritorious defenses to these actions and has appealed the District Court’s order to the U.S. Court of Appeals for the Sixth Circuit. The ultimate outcome of the UAW lawsuit may result in future plan amendments. The impact of any future plan amendments cannot be currently estimated.
The company’s retiree medical obligations were measured as of September 30, 2012 and 2011. The following are the assumptions used in the measurement of the APBO and retiree medical expense:
2012 2011 2010
Discount rate . . . . . . . . . . . . . . . . . . . . . . . . . . . . . . . . . . . . . . . . . . . . . . . . . 3.90% 4.60% 4.60%Health care cost trend rate . . . . . . . . . . . . . . . . . . . . . . . . . . . . . . . . . . . . . . . 7.20% 7.50% 7.75%Ultimate health care trend rate. . . . . . . . . . . . . . . . . . . . . . . . . . . . . . . . . . . . . 5.00% 5.00% 5.00%Year ultimate rate is reached . . . . . . . . . . . . . . . . . . . . . . . . . . . . . . . . . . . . . . 2023 2023 2023
The assumptions noted above are used to calculate the APBO for each fiscal year end and retiree medical expense for the subsequent fiscal year.
The discount rate is used to calculate the present value of the APBO. This rate is determined based on high-quality fixed income investments that match the duration of expected retiree medical benefits. The company has used the corporate AA/Aa bond rate for this assumption. The health care cost trend rate represents the company’s expected annual rates of change in the cost of health care benefits. The company’s projection for fiscal year 2013 is an increase in health care costs of 7.20 percent.
The APBO as of the September 30, 2012 and 2011 measurement dates are summarized as follows (in millions):
2012 2011
Retirees . . . . . . . . . . . . . . . . . . . . . . . . . . . . . . . . . . . . . . . . . . . . . . . . . . . . . . . . . . . . . . . . . $528 $521Employees eligible to retire . . . . . . . . . . . . . . . . . . . . . . . . . . . . . . . . . . . . . . . . . . . . . . . . . . . 10 9Employees not eligible to retire. . . . . . . . . . . . . . . . . . . . . . . . . . . . . . . . . . . . . . . . . . . . . . . . . 16 15
Total . . . . . . . . . . . . . . . . . . . . . . . . . . . . . . . . . . . . . . . . . . . . . . . . . . . . . . . . . . . . . . . . . $554 $545
The following reconciles the change in APBO and the amounts included in the consolidated balance sheet for years ended September 30, 2012 and 2011, respectively (in millions):
2012 2011
APBO — beginning of year . . . . . . . . . . . . . . . . . . . . . . . . . . . . . . . . . . . . . . . . . . . . . . . . . . $545 $589Service cost . . . . . . . . . . . . . . . . . . . . . . . . . . . . . . . . . . . . . . . . . . . . . . . . . . . . . . . . . . . 1 1Interest cost . . . . . . . . . . . . . . . . . . . . . . . . . . . . . . . . . . . . . . . . . . . . . . . . . . . . . . . . . . . 24 26Participant contributions . . . . . . . . . . . . . . . . . . . . . . . . . . . . . . . . . . . . . . . . . . . . . . . . . . 2 3Actuarial loss (gain). . . . . . . . . . . . . . . . . . . . . . . . . . . . . . . . . . . . . . . . . . . . . . . . . . . . . . 21 (32)Foreign currency rate changes. . . . . . . . . . . . . . . . . . . . . . . . . . . . . . . . . . . . . . . . . . . . . . 1 1Benefit payments . . . . . . . . . . . . . . . . . . . . . . . . . . . . . . . . . . . . . . . . . . . . . . . . . . . . . . . (40) (43)
APBO — end of year . . . . . . . . . . . . . . . . . . . . . . . . . . . . . . . . . . . . . . . . . . . . . . . . . . . . . . 554 545Other (1). . . . . . . . . . . . . . . . . . . . . . . . . . . . . . . . . . . . . . . . . . . . . . . . . . . . . . . . . . . . . . . . 5 5
Retiree medical liability . . . . . . . . . . . . . . . . . . . . . . . . . . . . . . . . . . . . . . . . . . . . . . . . . . . . . $559 $550
(1) The company recorded a $5 million reserve for retiree medical liabilities at September 30, 2012 and 2011 as its best estimate for retroactive benefits related to the previously mentioned injunction.
JOB TITLE Meritor 10-K REVISION 3 SERIAL DATE / TIME Friday, November 30, 2012 JOB NUMBER 243020 TYPE PAGE NO. 90 OPERATOR PM2
<12345678>

91
MERITOR, INC.
NOTES TO CONSOLIDATED FINANCIAL STATEMENTS — (Continued)
Actuarial losses relate to changes in the discount rate and earlier than expected retirements due to certain plant closings and restructuring actions. In accordance with FASB ASC Topic 715, “Compensation – Retirement Benefits”, a portion of the actuarial losses is not subject to amortization. The actuarial losses that are subject to amortization are generally amortized over the average expected remaining service life, which is approximately 10 years. Union plan amendments are generally amortized over the contract period, or three years.
The Medicare Prescription Drug Improvement and Modernization Act of 2003 provides for a federal subsidy to sponsors of retiree health care benefit plans that provide a benefit at least actuarially equivalent to the benefit established by the law. The company provides retiree medical benefits under certain plans that exceed the value of the benefits that are provided by the Medicare Part D plan. Therefore, management concluded that these plans are at least actuarially equivalent to the Medicare Part D plan and the company is eligible for the federal subsidy. The impact of the subsidy was a reduction in the fiscal year 2012 and 2011 retiree medical expense of $12 million and $6 million, respectively. In September 2011, in connection with the Health Care and Education Reconciliation Act of 2010, the company converted its current prescription drug program for certain retirees to a group-based company sponsored Medicare Part D program, or Employer Group Waiver Plan (EGWP). Beginning in 2013, the company will use the Part D subsidies delivered through EGWP each year to reduce its net retiree medical costs. As a result of this change in assumption, the company reduced its APBO by approximately $35 million. In September 2012, the company converted certain additional groups of retirees to EGWP, and as a result, reduced its APBO by an additional amount of approximately $25 million. These reductions in APBO will be amortized over an average expected remaining service life of approximately nine years.
The retiree medical liability is included in the consolidated balance sheet as follows (in millions):
September 30,
2012 2011
Current — included in compensation and benefits . . . . . . . . . . . . . . . . . . . $ 40 $ 44Long-term — included in retirement benefits . . . . . . . . . . . . . . . . . . . . . . . 519 506
Retiree medical liability . . . . . . . . . . . . . . . . . . . . . . . . . . . . . . . . . . . . . . . $559 $550
The following table summarizes the amounts included in Accumulated Other Comprehensive Loss net of tax related to retiree medical liabilities as of September 30, 2012 and 2011 and changes recognized in Other Comprehensive Income (Loss) net of tax for the years ended September 30, 2012 and 2011.
Net Actuarial
Loss
Prior Service
Cost (Benefit) Total
Balance at September 30, 2011 . . . . . . . . . . . . . . . . . . . . $203 $(15) $188Net actuarial loss for the year . . . . . . . . . . . . . . . . . . . . 21 — 21Amortization for the year . . . . . . . . . . . . . . . . . . . . . . . . (26) 9 (17)Deferred tax impact . . . . . . . . . . . . . . . . . . . . . . . . . . . $ (1) $ — $ (1)
Balance at September 30, 2012 . . . . . . . . . . . . . . . . . . . . $197 $ (6) $191
Balance at September 30, 2010 . . . . . . . . . . . . . . . . . . . . $250 $(24) $226Net actuarial gain for the year . . . . . . . . . . . . . . . . . . . . (32) — (32)Amortization for the year . . . . . . . . . . . . . . . . . . . . . . . . (29) 9 (20)Deferred tax impact (1) . . . . . . . . . . . . . . . . . . . . . . . . . 14 — 14
Balance at September 30, 2011 . . . . . . . . . . . . . . . . . . . . $203 $(15) $188
(1) Tax expense recorded against the income in other comprehensive loss resulting from the year-end re-measurement of retiree healthcare obligations (see Note 21).
JOB TITLE Meritor 10-K REVISION 3 SERIAL DATE / TIME Friday, November 30, 2012 JOB NUMBER 243020 TYPE PAGE NO. 91 OPERATOR PM2
<12345678>

92
MERITOR, INC.
NOTES TO CONSOLIDATED FINANCIAL STATEMENTS — (Continued)
The net actuarial loss and prior service benefit that is estimated to be amortized from accumulated other comprehensive loss into net periodic retiree medical expense in fiscal year 2013 is $27 million and $8 million, respectively.
The components of retiree medical expense for years ended September 30 are as follows (in millions):
2012 2011 2010
Service cost . . . . . . . . . . . . . . . . . . . . . . . . . . . . . . . . . . . . . . . . $ 1 $ 1 $ 1Interest cost . . . . . . . . . . . . . . . . . . . . . . . . . . . . . . . . . . . . . . . . 24 26 32Amortization of:
Prior service benefit . . . . . . . . . . . . . . . . . . . . . . . . . . . . . . . . (9) (9) (9)Actuarial losses . . . . . . . . . . . . . . . . . . . . . . . . . . . . . . . . . . . 26 29 35
Retiree medical expense . . . . . . . . . . . . . . . . . . . . . . . . . . . . . . . $42 $47 $59
A one-percentage point change in the assumed health care cost trend rate for all years to, and including, the ultimate rate would have the following effects (in millions):
2012 2011
Effect on total service and interest cost 1% Increase . . . . . . . . . . . . . . . . . . . . . . . . . . . . . . . . . . . . . . . . . . . . . $ 3 $ 31% Decrease . . . . . . . . . . . . . . . . . . . . . . . . . . . . . . . . . . . . . . . . . . . . (3) (2)
Effect on APBO 1% Increase . . . . . . . . . . . . . . . . . . . . . . . . . . . . . . . . . . . . . . . . . . . . . 66 651% Decrease . . . . . . . . . . . . . . . . . . . . . . . . . . . . . . . . . . . . . . . . . . . . (59) (53)
The company expects future benefit payments as follows (in millions):
Gross Benefit
Payments
Gross Medicare
Receipts (1)
Fiscal 2013 . . . . . . . . . . . . . . . . . . . . . . . . . . . . . . . . . . . . . . . . $ 46 $ 6Fiscal 2014 . . . . . . . . . . . . . . . . . . . . . . . . . . . . . . . . . . . . . . . . 45 6Fiscal 2015 . . . . . . . . . . . . . . . . . . . . . . . . . . . . . . . . . . . . . . . . 45 6Fiscal 2016 . . . . . . . . . . . . . . . . . . . . . . . . . . . . . . . . . . . . . . . . 45 7Fiscal 2017 . . . . . . . . . . . . . . . . . . . . . . . . . . . . . . . . . . . . . . . . 44 7Fiscal 2018 – 2022 . . . . . . . . . . . . . . . . . . . . . . . . . . . . . . . . . . 214 38
(1) Consists of Medicare Part D - retiree drug subsidy in fiscal year 2012 and through December 31, 2012 and, subsidies and rebates available under EGWP beginning January 1, 2013.
20. RETIREMENT PENSION PLANS
The company sponsors defined benefit pension plans that cover certain of its U.S. and non-U.S. employees. Pension benefits for salaried employees are based on years of credited service and compensation. Pension benefits for hourly employees are based on years of service and specified benefit amounts. The company’s funding policy provides that annual contributions to the pension trusts will be at least equal to the minimum amounts required by ERISA in the U.S. and the actuarial recommendations or statutory requirements in other countries.
JOB TITLE Meritor 10-K REVISION 3 SERIAL DATE / TIME Friday, November 30, 2012 JOB NUMBER 243020 TYPE PAGE NO. 92 OPERATOR PM2
<12345678>
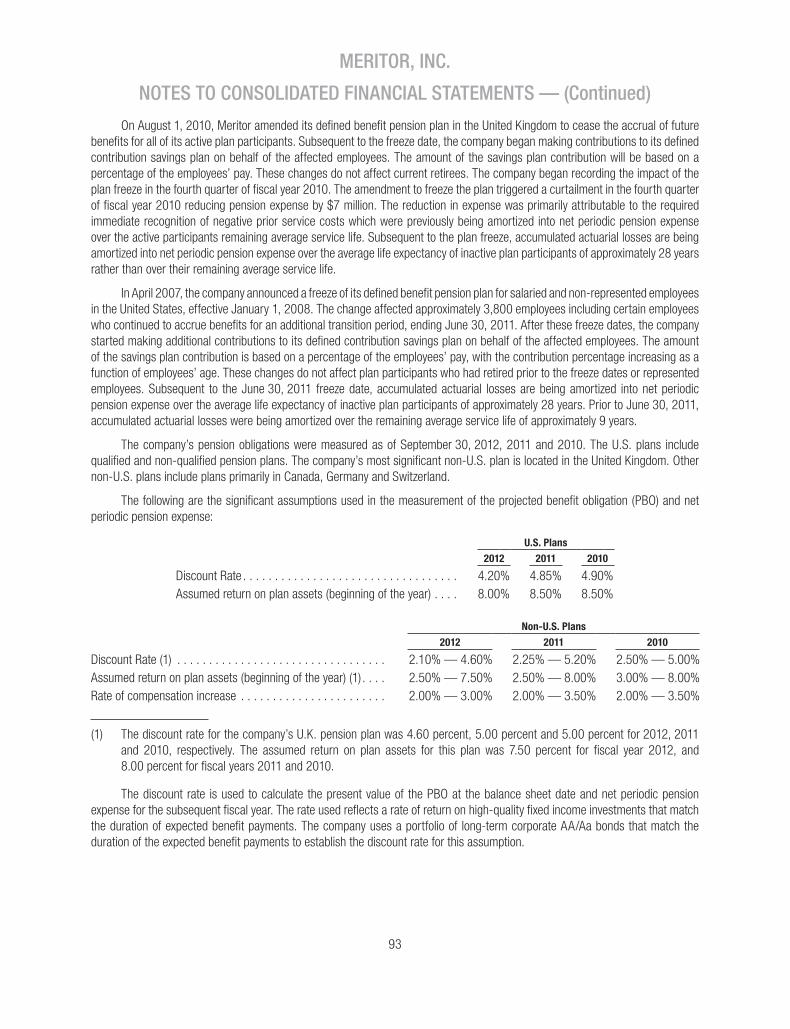
93
MERITOR, INC.
NOTES TO CONSOLIDATED FINANCIAL STATEMENTS — (Continued)
On August 1, 2010, Meritor amended its defined benefit pension plan in the United Kingdom to cease the accrual of future benefits for all of its active plan participants. Subsequent to the freeze date, the company began making contributions to its defined contribution savings plan on behalf of the affected employees. The amount of the savings plan contribution will be based on a percentage of the employees’ pay. These changes do not affect current retirees. The company began recording the impact of the plan freeze in the fourth quarter of fiscal year 2010. The amendment to freeze the plan triggered a curtailment in the fourth quarter of fiscal year 2010 reducing pension expense by $7 million. The reduction in expense was primarily attributable to the required immediate recognition of negative prior service costs which were previously being amortized into net periodic pension expense over the active participants remaining average service life. Subsequent to the plan freeze, accumulated actuarial losses are being amortized into net periodic pension expense over the average life expectancy of inactive plan participants of approximately 28 years rather than over their remaining average service life.
In April 2007, the company announced a freeze of its defined benefit pension plan for salaried and non-represented employees in the United States, effective January 1, 2008. The change affected approximately 3,800 employees including certain employees who continued to accrue benefits for an additional transition period, ending June 30, 2011. After these freeze dates, the company started making additional contributions to its defined contribution savings plan on behalf of the affected employees. The amount of the savings plan contribution is based on a percentage of the employees’ pay, with the contribution percentage increasing as a function of employees’ age. These changes do not affect plan participants who had retired prior to the freeze dates or represented employees. Subsequent to the June 30, 2011 freeze date, accumulated actuarial losses are being amortized into net periodic pension expense over the average life expectancy of inactive plan participants of approximately 28 years. Prior to June 30, 2011, accumulated actuarial losses were being amortized over the remaining average service life of approximately 9 years.
The company’s pension obligations were measured as of September 30, 2012, 2011 and 2010. The U.S. plans include qualified and non-qualified pension plans. The company’s most significant non-U.S. plan is located in the United Kingdom. Other non-U.S. plans include plans primarily in Canada, Germany and Switzerland.
The following are the significant assumptions used in the measurement of the projected benefit obligation (PBO) and net periodic pension expense:
U.S. Plans
2012 2011 2010
Discount Rate . . . . . . . . . . . . . . . . . . . . . . . . . . . . . . . . . . 4.20% 4.85% 4.90%Assumed return on plan assets (beginning of the year) . . . . 8.00% 8.50% 8.50%
Non-U.S. Plans
2012 2011 2010
Discount Rate (1) . . . . . . . . . . . . . . . . . . . . . . . . . . . . . . . . . 2.10% — 4.60% 2.25% — 5.20% 2.50% — 5.00%Assumed return on plan assets (beginning of the year) (1) . . . . 2.50% — 7.50% 2.50% — 8.00% 3.00% — 8.00%Rate of compensation increase . . . . . . . . . . . . . . . . . . . . . . . 2.00% — 3.00% 2.00% — 3.50% 2.00% — 3.50%
(1) The discount rate for the company’s U.K. pension plan was 4.60 percent, 5.00 percent and 5.00 percent for 2012, 2011 and 2010, respectively. The assumed return on plan assets for this plan was 7.50 percent for fiscal year 2012, and 8.00 percent for fiscal years 2011 and 2010.
The discount rate is used to calculate the present value of the PBO at the balance sheet date and net periodic pension expense for the subsequent fiscal year. The rate used reflects a rate of return on high-quality fixed income investments that match the duration of expected benefit payments. The company uses a portfolio of long-term corporate AA/Aa bonds that match the duration of the expected benefit payments to establish the discount rate for this assumption.
JOB TITLE Meritor 10-K REVISION 3 SERIAL DATE / TIME Friday, November 30, 2012 JOB NUMBER 243020 TYPE PAGE NO. 93 OPERATOR PM2
<12345678>

94
MERITOR, INC.
NOTES TO CONSOLIDATED FINANCIAL STATEMENTS — (Continued)
The assumed return on plan assets is used to determine net periodic pension expense. The rate of return assumptions are based on projected long-term market returns for the various asset classes in which the plans are invested, weighted by the target asset allocations. An incremental amount for active plan asset management and diversification, where appropriate, is included in the rate of return assumption. The return assumption is reviewed annually.
The rate of compensation increase represents the long-term assumption for expected increases to salaries for pay-related plans. The accompanying disclosures include pension obligations associated with businesses classified as discontinued operations.
The following table reconciles the change in the PBO, the change in plan assets and amounts included in the consolidated balance sheet for the years ended September 30, 2012 and 2011, respectively (in millions):
2012 2011
U.S. Non- U.S. Total U.S. Non- U.S. Total
PBO — beginning of year . . . . . . . . . . . . . . . . . . . . . . $1,218 $698 $1,916 $1,201 $ 762 $1,963Service cost . . . . . . . . . . . . . . . . . . . . . . . . . . . . 1 1 2 5 2 7Interest cost . . . . . . . . . . . . . . . . . . . . . . . . . . . . 58 33 91 57 36 93Participant contributions . . . . . . . . . . . . . . . . . . . — 1 1 — 1 1Actuarial loss (gain) . . . . . . . . . . . . . . . . . . . . . . 102 32 134 19 (27) (8)Divestitures (1) . . . . . . . . . . . . . . . . . . . . . . . . . . — — — — (38) (38)Benefit payments . . . . . . . . . . . . . . . . . . . . . . . . (67) (33) (100) (64) (36) (100)Foreign currency rate changes . . . . . . . . . . . . . . — 22 22 — (2) (2)
PBO — end of year . . . . . . . . . . . . . . . . . . . . . . . . . . 1,312 754 2,066 1,218 698 1,916Change in plan assets Fair value of assets — beginning of year . . . . . . . . . . . 763 596 1,359 765 589 1,354
Actual return on plan assets . . . . . . . . . . . . . . . . 104 47 151 57 15 72Employer contributions . . . . . . . . . . . . . . . . . . . . 64 38 102 5 30 35Participant contributions . . . . . . . . . . . . . . . . . . . — 1 1 — 1 1Benefit payments . . . . . . . . . . . . . . . . . . . . . . . . (67) (33) (100) (64) (36) (100)Foreign currency rate changes . . . . . . . . . . . . . . — 24 24 — (3) (3)
Fair value of assets — end of year . . . . . . . . . . . . . . . 864 673 1,537 763 596 1,359
Funded status. . . . . . . . . . . . . . . . . . . . . . . . . . . . . . . $ (448) $ (81) $ (529) $ (455) $(102) $ (557)
(1) The decrease in PBO represents the pension liabilities of Body Systems which was assumed by the buyers as part of the sale transaction that closed in fiscal year 2011 (see Note 3).
Amounts included in the consolidated balance sheet at September 30 are comprised of the following (in millions):
2012 2011
U.S. Non-U.S. Total U.S. Non-U.S. Total
Non-current assets . . . . . . . . . . . . . . . . . . . . . . . . . . . . $ — $ 11 $ 11 $ — $ 10 $ 10Current liabilities . . . . . . . . . . . . . . . . . . . . . . . . . . . . . . (5) (3) (8) (5) (3) (8)Retirement benefits-non-current . . . . . . . . . . . . . . . . . . (443) (89) (532) (450) (109) (559)
Net amount recognized . . . . . . . . . . . . . . . . . . . . . . . . . $(448) $(81) $(529) $(455) $(102) $(557)
JOB TITLE Meritor 10-K REVISION 3 SERIAL DATE / TIME Friday, November 30, 2012 JOB NUMBER 243020 TYPE PAGE NO. 94 OPERATOR PM2
<12345678>
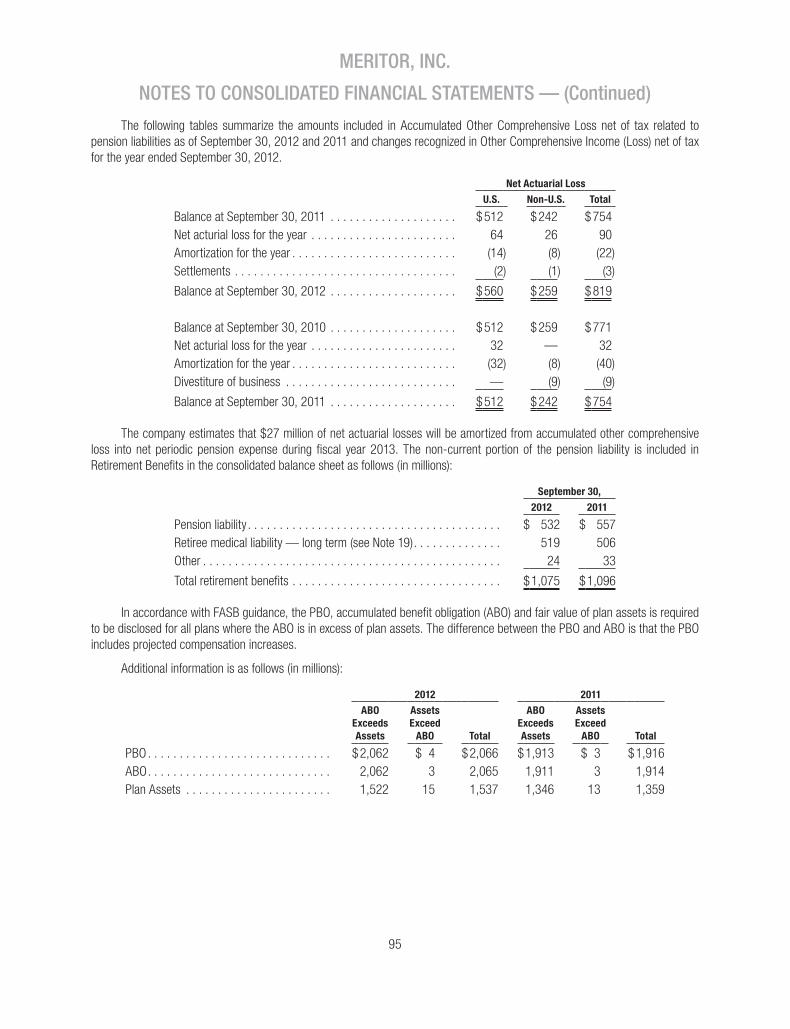
95
MERITOR, INC.
NOTES TO CONSOLIDATED FINANCIAL STATEMENTS — (Continued)
The following tables summarize the amounts included in Accumulated Other Comprehensive Loss net of tax related to pension liabilities as of September 30, 2012 and 2011 and changes recognized in Other Comprehensive Income (Loss) net of tax for the year ended September 30, 2012.
Net Actuarial Loss
U.S. Non-U.S. Total
Balance at September 30, 2011 . . . . . . . . . . . . . . . . . . . . $512 $242 $754Net acturial loss for the year . . . . . . . . . . . . . . . . . . . . . . . 64 26 90Amortization for the year . . . . . . . . . . . . . . . . . . . . . . . . . . (14) (8) (22)Settlements . . . . . . . . . . . . . . . . . . . . . . . . . . . . . . . . . . . (2) (1) (3)
Balance at September 30, 2012 . . . . . . . . . . . . . . . . . . . . $560 $259 $819
Balance at September 30, 2010 . . . . . . . . . . . . . . . . . . . . $512 $259 $771Net acturial loss for the year . . . . . . . . . . . . . . . . . . . . . . . 32 — 32Amortization for the year . . . . . . . . . . . . . . . . . . . . . . . . . . (32) (8) (40)Divestiture of business . . . . . . . . . . . . . . . . . . . . . . . . . . . — (9) (9)
Balance at September 30, 2011 . . . . . . . . . . . . . . . . . . . . $512 $242 $754
The company estimates that $27 million of net actuarial losses will be amortized from accumulated other comprehensive loss into net periodic pension expense during fiscal year 2013. The non-current portion of the pension liability is included in Retirement Benefits in the consolidated balance sheet as follows (in millions):
September 30,
2012 2011
Pension liability . . . . . . . . . . . . . . . . . . . . . . . . . . . . . . . . . . . . . . . . $ 532 $ 557Retiree medical liability — long term (see Note 19). . . . . . . . . . . . . . 519 506Other . . . . . . . . . . . . . . . . . . . . . . . . . . . . . . . . . . . . . . . . . . . . . . . 24 33
Total retirement benefits . . . . . . . . . . . . . . . . . . . . . . . . . . . . . . . . . $1,075 $1,096
In accordance with FASB guidance, the PBO, accumulated benefit obligation (ABO) and fair value of plan assets is required to be disclosed for all plans where the ABO is in excess of plan assets. The difference between the PBO and ABO is that the PBO includes projected compensation increases.
Additional information is as follows (in millions):
2012 2011
ABOExceedsAssets
AssetsExceed
ABO Total
ABOExceedsAssets
AssetsExceed
ABO Total
PBO . . . . . . . . . . . . . . . . . . . . . . . . . . . . . $2,062 $ 4 $2,066 $1,913 $ 3 $1,916ABO. . . . . . . . . . . . . . . . . . . . . . . . . . . . . 2,062 3 2,065 1,911 3 1,914Plan Assets . . . . . . . . . . . . . . . . . . . . . . . 1,522 15 1,537 1,346 13 1,359
JOB TITLE Meritor 10-K REVISION 3 SERIAL DATE / TIME Friday, November 30, 2012 JOB NUMBER 243020 TYPE PAGE NO. 95 OPERATOR PM2
<12345678>

96
MERITOR, INC.
NOTES TO CONSOLIDATED FINANCIAL STATEMENTS — (Continued)
The components of net periodic pension expense are as follows (in millions):
2012 2011 2010
Service cost . . . . . . . . . . . . . . . . . . . . . . . . . . . . . . . . . . . . . . . . . . . . . . . $ 2 $ 7 $ 16Interest cost . . . . . . . . . . . . . . . . . . . . . . . . . . . . . . . . . . . . . . . . . . . . . . . 91 93 95Assumed rate of return on plan assets . . . . . . . . . . . . . . . . . . . . . . . . . . . . (105) (114) (113)Amortization of —
Prior service cost (1) . . . . . . . . . . . . . . . . . . . . . . . . . . . . . . . . . . . . . . . — — (6)Actuarial losses . . . . . . . . . . . . . . . . . . . . . . . . . . . . . . . . . . . . . . . . . . 22 40 37
Settlement charge . . . . . . . . . . . . . . . . . . . . . . . . . . . . . . . . . . . . . . . . . . 1 — —Net periodic pension expense – total company . . . . . . . . . . . . . . . . . . . . . . 11 26 29Less: Net periodic pension expense of discontinued operations . . . . . . . . . . — 2 7
Net periodic pension expense included in continuing operations. . . . . . . . . . $ 11 $ 24 $ 22
(1) The company recorded a reduction in pension expense of $7 million in the fourth quarter of fiscal year 2010 as a result of the pension curtailment triggered by the freeze of its U.K. pension plan. The benefit recorded as part of the curtailment included the recognition of $5 million of negative prior service costs which were being amortized into net periodic pension expense over the active participants remaining average service life.
Disclosures on investment policies and strategies, categories of plan assets, fair value measurements of plan assets, and significant concentrations of risk are included below.
Investment Policy and Strategy
The company’s primary investment objective for its pension plan assets is to generate a total investment return sufficient to meet present and future benefit payments while minimizing the company’s cash contributions over the life of the plans. In order to accomplish this objective, the company maintains target allocations to identify and manage exposures. The target asset allocation ranges for the U.S. plan are 30–50 percent equity investments, 30–50 percent fixed income investments and 10–30 percent alternative investments. Alternative investments include private equities, real estate, hedge funds and partnership interests. The target asset allocation ranges for the non-U.S. plans are 15–40 percent equity investments, 30–60 percent fixed income investments, 0–10 percent real estate and 15–40 percent alternative investments.
Investment strategies and policies for the company’s pension plan assets reflect a balance of risk-reducing and return-seeking considerations. The objective of minimizing the volatility of assets relative to liabilities is addressed primarily through asset diversification. Assets are broadly diversified across several asset classes to achieve risk-adjusted returns that accomplish this objective.
The majority of pension plan assets are externally managed through active managers. Managers are only permitted to invest within established asset classes and follow the strategies for which they have been appointed. The company uses investment guidelines and reviews assets returns and investment decisions made by the managers to ensure that they are in accordance with the company’s strategies.
Concentration of Risk
The company seeks to mitigate risks relative to performance of the plan assets. Assets are invested in various classes with different risk and return characteristics in order to ensure that they are sufficient to pay benefits. The company’s investment strategies incorporate a return-seeking approach through equity and alternative investments, while seeking to minimize the volatility of the plans’ assets relative to its liabilities through investments in fixed income securities. The significant areas of risk related to these strategies include equity, interest rate, and operating risk.
JOB TITLE Meritor 10-K REVISION 3 SERIAL DATE / TIME Friday, November 30, 2012 JOB NUMBER 243020 TYPE PAGE NO. 96 OPERATOR PM2
<12345678>

97
MERITOR, INC.
NOTES TO CONSOLIDATED FINANCIAL STATEMENTS — (Continued)
A portion of plan assets is allocated to equity and alternative investments that are expected, over time, to earn higher returns. Within this return seeking portfolio, asset diversification is utilized to reduce uncompensated risk.
Plan assets are also allocated to fixed income investments which seek to minimize interest rate risk volatility relative to pension liabilities. The fixed income portfolio partially matches the long-dated nature of the pension liabilities reducing interest rate risk. Interest rate decreases generally increase the value of fixed income assets, partially offsetting the related increase in the liabilities, while interest rate increases generally result in a decline in the value of fixed income assets while reducing the present value of the liabilities.
Operating risks consist of the risks of inadequate diversification and weak controls. The company has established policies and procedures in order to mitigate this risk by monitoring investment manager performance, reviewing periodic compliance information, and ensuring that the plans’ managers invest in accordance with the company’s investment strategies.
Fair Value of Investments
The current FASB guidance provides a fair value hierarchy that prioritizes the inputs to valuation techniques used to measure fair value. The hierarchy gives the highest priority to unadjusted quoted prices in active markets for identical assets (Level 1) and the lowest priority to unobservable inputs (Level 3). The three levels of the fair value hierarchy are described below:
• Level 1 inputs use quoted prices in active markets for identical assets that the Plan has the ability to access.
• Level 2 inputs use other inputs that are observable, either directly or indirectly. These Level 2 inputs include quoted prices for similar assets in active markets, and other inputs such as interest rates and yield curves that are observable at commonly quoted intervals.
• Level 3 inputs are unobservable inputs, including inputs that are available in situations where there is little, if any, market activity for the related asset.
In instances where inputs used to measure fair value fall into different levels in the above fair value hierarchy, fair value measurements in their entirety are categorized based on the lowest level input that is significant to the valuation. The company’s assessment of the significance of particular inputs to these fair value measurements requires judgment and considers factors specific to each asset or liability.
Following are descriptions, valuation methodologies and other information related to plan assets.
Cash and cash equivalents: The fair value of cash and cash equivalents is valued at cost.
Equity Securities: The overall equity category includes common and preferred stocks issued by U.S. and international companies as well as equity funds that invest in these instruments. All investments generally allow near-term (within 90 days of the measurement date) liquidity and are held in issues that are actively traded to facilitate transactions at minimum cost. The aggregate equity portfolio is diversified to avoid exposure to any investment strategy, single economic sector, industry group, or individual security.
The fair value of equity securities is determined by either direct or indirect quoted market prices. When the value of assets held in separate accounts is not published, the value is based on the underlying holdings, which are primarily direct quoted market prices on regulated financial exchanges.
Most of the U.S. equity investments allow daily redemptions, with some providing monthly liquidity or requiring a 30-day notice. Emerging and international equity investments allow for quarterly withdrawals.
Fixed Income Securities: The overall fixed income category includes U.S. dollar-denominated and international marketable bonds and convertible debt securities as well as fixed income funds that invest in these instruments. All assets generally allow near-term liquidity and are held in issues which are actively traded to facilitate transactions at minimum cost. The aggregate fixed income portfolio is diversified to avoid exposure to any investment strategy, maturity, issuer or credit quality.
JOB TITLE Meritor 10-K REVISION 3 SERIAL DATE / TIME Friday, November 30, 2012 JOB NUMBER 243020 TYPE PAGE NO. 97 OPERATOR PM2
<12345678>

98
MERITOR, INC.
NOTES TO CONSOLIDATED FINANCIAL STATEMENTS — (Continued)
The fair value of fixed income securities is determined by either direct or indirect quoted market prices. When the value of assets held in separate accounts is not published, the value is based on the underlying holdings, which are primarily direct quoted market prices on regulated financial exchanges.
U.S. fixed income typically offer daily liquidity, with only one Level 3 investment allowing annual redemptions. International and emerging fixed income investment vehicles generally provide daily liquidity.
Commingled Funds: The fair value of commingled funds is accounted for by a custodian. The custodian obtains valuations from underlying managers based on market quotes for the most liquid assets and alternative methods for assets that do not have sufficient trading activity to derive prices. The company and custodian review the methods used by the underlying managers to value the assets.
Real Estate: Real estate provides an indirect investment into a diversified and multi-sector portfolio of property assets. The fair value of real estate investments is valued by the fund managers. The fund managers value the real estate investments via independent third-party appraisals on a periodic basis. Assumptions used to revalue the properties are updated every quarter. For the component of the real estate portfolio under development, the investments are carried at cost, which approximates fair value, until they are completed and valued by a third-party appraiser.
Due to the long-term nature of real estate investments, liquidity is provided on a quarterly to semi-annual basis. These investments were classified accordingly to reflect these restrictions.
Partnerships/Private Equity: This category includes investments in private equity and hedge funds. Such investments may be made directly or through pooled funds, including fund of funds structures. The fair market value of the company’s interest in partnerships and private equity is valued by the fund managers. The valuation is based on the net present value of observable inputs (dividends, cash flows, earnings, etc.) which are discounted by applicable discount rates. The company and custodian review the methods used by the underlying managers to value the assets.
Most of these investments offer quarterly redemption opportunities. Some partnerships and private equity investments, due to the nature of their investment strategy and underlying holdings, offer less frequent liquidity. When available, liquidity events are closely evaluated.
The valuation methods described above may produce a fair value calculation that may not be indicative of net realizable value or reflective of future fair values. Furthermore, while the company believes its valuation methods are appropriate and consistent with other market participants, the use of different methodologies or assumptions to determine the fair value of certain financial instruments could result in a different fair value measurement at the reporting date.
JOB TITLE Meritor 10-K REVISION 3 SERIAL DATE / TIME Friday, November 30, 2012 JOB NUMBER 243020 TYPE PAGE NO. 98 OPERATOR PM2
<12345678>

99
MERITOR, INC.
NOTES TO CONSOLIDATED FINANCIAL STATEMENTS — (Continued)
The fair value of plan assets at September 30, 2012 by asset category is as follows (in millions):
U.S. Plans 2012
Asset Category Level 1 Level 2 Level 3 Total
Equity investments U.S. – Large cap. . . . . . . . . . . . . . . . . . . . . . . . . . . . . . . . . . . . . . . . . . . . . . . . . $121 $ — $ — $121U.S. – Small cap. . . . . . . . . . . . . . . . . . . . . . . . . . . . . . . . . . . . . . . . . . . . . . . . . 27 — — 27Emerging equity . . . . . . . . . . . . . . . . . . . . . . . . . . . . . . . . . . . . . . . . . . . . . . . . . 13 17 — 30Private equity . . . . . . . . . . . . . . . . . . . . . . . . . . . . . . . . . . . . . . . . . . . . . . . . . . . — — 48 48International equity . . . . . . . . . . . . . . . . . . . . . . . . . . . . . . . . . . . . . . . . . . . . . . . 82 5 — 87Partnerships – equity . . . . . . . . . . . . . . . . . . . . . . . . . . . . . . . . . . . . . . . . . . . . . — 35 13 48
Total equity investments . . . . . . . . . . . . . . . . . . . . . . . . . . . . . . . . . . . . . . . . . $243 $ 57 $ 61 $361Fixed income investments U.S. fixed income . . . . . . . . . . . . . . . . . . . . . . . . . . . . . . . . . . . . . . . . . . . . . . . . $ 28 $240 $ — $268Emerging fixed income . . . . . . . . . . . . . . . . . . . . . . . . . . . . . . . . . . . . . . . . . . . . — 18 — 18International fixed income . . . . . . . . . . . . . . . . . . . . . . . . . . . . . . . . . . . . . . . . . . — — 10 10U.S. high yield . . . . . . . . . . . . . . . . . . . . . . . . . . . . . . . . . . . . . . . . . . . . . . . . . . — — 10 10Partnerships fixed income . . . . . . . . . . . . . . . . . . . . . . . . . . . . . . . . . . . . . . . . . . — — 13 13
Total fixed income. . . . . . . . . . . . . . . . . . . . . . . . . . . . . . . . . . . . . . . . . . . . . . $ 28 $258 $ 33 $319Alternatives – Partnerships . . . . . . . . . . . . . . . . . . . . . . . . . . . . . . . . . . . . . . . . . — 95 49 144Cash and cash equivalents . . . . . . . . . . . . . . . . . . . . . . . . . . . . . . . . . . . . . . . . . — 40 — 40Total assets at fair value . . . . . . . . . . . . . . . . . . . . . . . . . . . . . . . . . . . . . . . . . . . $271 $450 $143 $864
Non-U.S. Plans 2012
Asset Category Level 1 Level 2 Level 3 Total
Equity investments International equity . . . . . . . . . . . . . . . . . . . . . . . . . . . . . . . . . . . . . . . . . . . . . . . 84 98 — 182
Total equity investments . . . . . . . . . . . . . . . . . . . . . . . . . . . . . . . . . . . . . . . . . $ 84 $ 98 $ — $182Fixed income investments Government bonds . . . . . . . . . . . . . . . . . . . . . . . . . . . . . . . . . . . . . . . . . . . . . . . $ — $125 $ — $125Corporate bonds . . . . . . . . . . . . . . . . . . . . . . . . . . . . . . . . . . . . . . . . . . . . . . . . . — 142 — 142Other fixed income investments . . . . . . . . . . . . . . . . . . . . . . . . . . . . . . . . . . . . . . — 79 — 79
Total fixed income. . . . . . . . . . . . . . . . . . . . . . . . . . . . . . . . . . . . . . . . . . . . . . $ — $346 $ — $346Real estate . . . . . . . . . . . . . . . . . . . . . . . . . . . . . . . . . . . . . . . . . . . . . . . . . . . . . — — 50 50Commingled funds . . . . . . . . . . . . . . . . . . . . . . . . . . . . . . . . . . . . . . . . . . . . . . . — 8 — 8Alternative investments . . . . . . . . . . . . . . . . . . . . . . . . . . . . . . . . . . . . . . . . . . . . — — 64 64Cash and cash equivalents . . . . . . . . . . . . . . . . . . . . . . . . . . . . . . . . . . . . . . . . . — 23 — 23Total assets at fair value . . . . . . . . . . . . . . . . . . . . . . . . . . . . . . . . . . . . . . . . . . . $ 84 $475 $114 $673
JOB TITLE Meritor 10-K REVISION 3 SERIAL DATE / TIME Friday, November 30, 2012 JOB NUMBER 243020 TYPE PAGE NO. 99 OPERATOR PM2
<12345678>

100
MERITOR, INC.
NOTES TO CONSOLIDATED FINANCIAL STATEMENTS — (Continued)
The fair value of plan assets at September 30, 2011 by asset category is as follows (in millions):
U.S. Plans 2011
Asset Category Level 1 Level 2 Level 3 Total
Equity investments U.S. – Large cap. . . . . . . . . . . . . . . . . . . . . . . . . . . . . . . . . . . . . . . . . . . . . . . $101 $ — $ — $101U.S. – Small cap. . . . . . . . . . . . . . . . . . . . . . . . . . . . . . . . . . . . . . . . . . . . . . . 21 — — 21Emerging equity . . . . . . . . . . . . . . . . . . . . . . . . . . . . . . . . . . . . . . . . . . . . . . . 11 22 — 33Private equity . . . . . . . . . . . . . . . . . . . . . . . . . . . . . . . . . . . . . . . . . . . . . . . . . . — — 40 40International equity . . . . . . . . . . . . . . . . . . . . . . . . . . . . . . . . . . . . . . . . . . . . . 74 4 — 78Partnerships – equity . . . . . . . . . . . . . . . . . . . . . . . . . . . . . . . . . . . . . . . . . . . — 61 — 61
Total equity investments . . . . . . . . . . . . . . . . . . . . . . . . . . . . . . . . . . . . . . . $207 $ 87 $ 40 $334Fixed income investments U.S. fixed income . . . . . . . . . . . . . . . . . . . . . . . . . . . . . . . . . . . . . . . . . . . . . . $243 $ — $ — $243Emerging fixed income . . . . . . . . . . . . . . . . . . . . . . . . . . . . . . . . . . . . . . . . . . — 14 — 14International fixed income . . . . . . . . . . . . . . . . . . . . . . . . . . . . . . . . . . . . . . . . 27 — — 27U.S. high yield . . . . . . . . . . . . . . . . . . . . . . . . . . . . . . . . . . . . . . . . . . . . . . . . — — 10 10Partnerships fixed income . . . . . . . . . . . . . . . . . . . . . . . . . . . . . . . . . . . . . . . . — 5 4 9
Total fixed income. . . . . . . . . . . . . . . . . . . . . . . . . . . . . . . . . . . . . . . . . . . . $270 $ 19 $ 14 $303Alternatives – Partnerships . . . . . . . . . . . . . . . . . . . . . . . . . . . . . . . . . . . . . . . — 75 47 122Cash and cash equivalents . . . . . . . . . . . . . . . . . . . . . . . . . . . . . . . . . . . . . . . — 4 — 4Total assets at fair value . . . . . . . . . . . . . . . . . . . . . . . . . . . . . . . . . . . . . . . . . $477 $185 $101 $763
Non-U.S. Plans 2011
Asset Category Level 1 Level 2 Level 3 Total
Equity investments International equity . . . . . . . . . . . . . . . . . . . . . . . . . . . . . . . . . . . . . . . . . . . . . $ — $164 $ — $164U.S. equity . . . . . . . . . . . . . . . . . . . . . . . . . . . . . . . . . . . . . . . . . . . . . . . . . . . — 1 — 1
Total equity investments . . . . . . . . . . . . . . . . . . . . . . . . . . . . . . . . . . . . . . . $ — $165 $ — $165Fixed income investments Government bonds . . . . . . . . . . . . . . . . . . . . . . . . . . . . . . . . . . . . . . . . . . . . . $ — $127 $ — $127Corporate bonds . . . . . . . . . . . . . . . . . . . . . . . . . . . . . . . . . . . . . . . . . . . . . . . — 120 — 120Other fixed income investments . . . . . . . . . . . . . . . . . . . . . . . . . . . . . . . . . . . . — 67 — 67
Total fixed income. . . . . . . . . . . . . . . . . . . . . . . . . . . . . . . . . . . . . . . . . . . . $ — $314 $ — $314Real estate . . . . . . . . . . . . . . . . . . . . . . . . . . . . . . . . . . . . . . . . . . . . . . . . . . . — — 49 49Commingled funds . . . . . . . . . . . . . . . . . . . . . . . . . . . . . . . . . . . . . . . . . . . . . — 8 — 8Alternative investments . . . . . . . . . . . . . . . . . . . . . . . . . . . . . . . . . . . . . . . . . . — — 55 55Cash and cash equivalents . . . . . . . . . . . . . . . . . . . . . . . . . . . . . . . . . . . . . . . — 5 — 5Total assets at fair value . . . . . . . . . . . . . . . . . . . . . . . . . . . . . . . . . . . . . . . . . $ — $492 $104 $596
JOB TITLE Meritor 10-K REVISION 3 SERIAL DATE / TIME Friday, November 30, 2012 JOB NUMBER 243020 TYPE PAGE NO. 100 OPERATOR PM2
<12345678>

101
MERITOR, INC.
NOTES TO CONSOLIDATED FINANCIAL STATEMENTS — (Continued)
Unfunded Commitment
As of September 30, 2012, the U.S. plan had $20 million of unfunded investment commitments related to plan assets. The majority of this amount is attributed to a new partnership investment that the plan will invest in gradually over the course of several years. Non-U.S. plans currently do not have any unfunded commitments.
The following table summarizes the changes in Level 3 pension plan assets measured at fair value on a recurring basis for the year ended September 30, 2012 (in millions):
U.S. Plans 2012
Fair Value at October 1,
2011
Return on Plan Assets: Attributable to Assets Held at
September 30, 2012 Purchases Settlements
Net Transfers
Into (Out of) Level 3 Other
Fair Value at
September30,
2012
Asset Category Private equity . . . . . . . . . . . . $ 40 $ — $ 9 $ (1) $ — $ — $ 48U.S. high yield . . . . . . . . . . . 10 — — — — — 10International fixed income . . . — — 10 — — — 10Partnerships –
Fixed income . . . . . . . . . . . 4 — 10 (6) — 5 13Equity . . . . . . . . . . . . . . . . — 1 — — — 12 13
Alternatives – Partnerships. . . . . . . . . . . . 47 3 — (2) — 1 49
Total Level 3 fair value. . . . . . . $101 $ 4 $ 29 $ (9) $ — $ 18 $143
Non-U.S. Plans 2012
Fair Value at October 1,
2011
Return on Plan Assets: Attributable to Assets Held at
September 30, 2012 Purchases Settlements
Net Transfers
Into (Out of) Level 3
Fair Value at
September 30,
2012
Asset Category Real estate . . . . . . . . . . . . . . $ 49 $ 1 $ — $ — $ — $ 50Alternative investments . . . . . 55 8 9 (8) — 64Total Level 3 fair value. . . . . . $104 $ 9 $ 9 $ (8) $ — $114
JOB TITLE Meritor 10-K REVISION 3 SERIAL DATE / TIME Friday, November 30, 2012 JOB NUMBER 243020 TYPE PAGE NO. 101 OPERATOR PM2
<12345678>

102
MERITOR, INC.
NOTES TO CONSOLIDATED FINANCIAL STATEMENTS — (Continued)
The following table summarizes the changes in Level 3 pension plan assets measured at fair value on a recurring basis for the year ended September 30, 2011 (in millions):
U.S. Plans 2011
Fair Value at October 1,
2010
Return on Plan Assets: Attributable to Assets Held at
September 30, 2011 Purchases Settlements
Net Transfers
Into (Out of) Level 3 Other
Fair Value at
September 30,
2011
Asset Category Private equity . . . . . . . . . . . . . $32 $ 6 $ 2 $— $ — $— $ 40U.S. high yield . . . . . . . . . . . . — (5) — — — 15 10Partnerships –
fixed income. . . . . . . . . . . . — 1 — (3) — 6 4Alternatives –
Partnerships. . . . . . . . . . . . 9 (4) 10 — — 32 47Total Level 3 fair value. . . . . . . $41 $(2) $ 12 $ (3) $ — $53 $101
Non-U.S. Plans 2011
Fair Value at October 1,
2010
Return on Plan Assets: Attributable to Assets Held at
September 30, 2011 Purchases Settlements
Net Transfers
Into (Out of) Level 3
Fair Value at
September 30,
2011
Asset Category
Real estate . . . . . . . . . . . . . . . . . $ 41 $ 8 $ — $ — $ — $ 49Alternative investments . . . . . . . . 40 — 23 (8) — 55Total Level 3 fair value. . . . . . . . . $ 81 $ 8 $ 23 $ (8) $ — $104
Information about the expected cash flows for the U.S. and non-U.S. pension plans is as follows (in millions):
U.S. Non U.S. Total
Expected employer contributions: Fiscal 2013 . . . . . . . . . . . . . . . . . . . . . . . . . . . . . . . . . . . $ 44 $ 29 $ 73Expected benefit payments: Fiscal 2013 . . . . . . . . . . . . . . . . . . . . . . . . . . . . . . . . . . . 70 32 102Fiscal 2014 . . . . . . . . . . . . . . . . . . . . . . . . . . . . . . . . . . . 70 30 100Fiscal 2015 . . . . . . . . . . . . . . . . . . . . . . . . . . . . . . . . . . . 71 31 102Fiscal 2016 . . . . . . . . . . . . . . . . . . . . . . . . . . . . . . . . . . . 72 32 104Fiscal 2017 . . . . . . . . . . . . . . . . . . . . . . . . . . . . . . . . . . . 73 33 106Fiscal 2018-2022. . . . . . . . . . . . . . . . . . . . . . . . . . . . . . . 383 178 561
The company also sponsors certain defined contribution savings plans for eligible employees. Expense related to these plans, including company matching contributions, was $14 million, $14 million and $10 million for fiscal years 2012, 2011 and 2010, respectively.
JOB TITLE Meritor 10-K REVISION 3 SERIAL DATE / TIME Friday, November 30, 2012 JOB NUMBER 243020 TYPE PAGE NO. 102 OPERATOR PM2
<12345678>

103
MERITOR, INC.
NOTES TO CONSOLIDATED FINANCIAL STATEMENTS — (Continued)
21. INCOME TAXES
The income tax provisions were calculated based upon the following components of income (loss) before income taxes (in millions):
2012 2011 2010
U.S. income (loss) . . . . . . . . . . . . . . . . . . . . . . . . . . . . . . . $ 25 $ (79 ) $ (67)Foreign income. . . . . . . . . . . . . . . . . . . . . . . . . . . . . . . . . 112 238 143
Total . . . . . . . . . . . . . . . . . . . . . . . . . . . . . . . . . . . . . . $137 $159 $ 76
The components of the benefit (provision) for income taxes are summarized as follows (in millions):
2012 2011 2010
Current tax benefit (expense): U.S. . . . . . . . . . . . . . . . . . . . . . . . . . . . . . . . . . . . . . . . $ 4 $ 14 $ 1Foreign . . . . . . . . . . . . . . . . . . . . . . . . . . . . . . . . . . . . (46) (63) (64)State and local . . . . . . . . . . . . . . . . . . . . . . . . . . . . . . . (1) (3) (1)
Total current tax expense . . . . . . . . . . . . . . . . . . . . . . . . . (43) (52) (64)Deferred tax benefit (expense):
U.S. . . . . . . . . . . . . . . . . . . . . . . . . . . . . . . . . . . . . . . . (7) (4) (7)Foreign . . . . . . . . . . . . . . . . . . . . . . . . . . . . . . . . . . . . (5) (21) 22State and local . . . . . . . . . . . . . . . . . . . . . . . . . . . . . . . (1) — 1
Total deferred tax benefit (expense) . . . . . . . . . . . . . . . . . . (13) (25) 16Income tax expense . . . . . . . . . . . . . . . . . . . . . . . . . . . . . $ (56) $ (77) $ (48)
The deferred tax expense or benefit represents tax effects of current year deductions or items of income that will be recognized in future periods for tax purposes. The U.S. current tax benefit in fiscal year 2011 primarily relates to the impact of measurement of the company’s postretirement benefits. The deferred tax expense in fiscal year 2011 primarily relates to recording the expense in certain jurisdictions where net operating losses are being utilized. The deferred tax benefit in fiscal year 2010 primarily represents the tax benefit of a valuation allowance reversal.
JOB TITLE Meritor 10-K REVISION 3 SERIAL DATE / TIME Friday, November 30, 2012 JOB NUMBER 243020 TYPE PAGE NO. 103 OPERATOR PM2
<12345678>

104
MERITOR, INC.
NOTES TO CONSOLIDATED FINANCIAL STATEMENTS — (Continued)
Net current and non-current deferred income tax assets (liabilities) included in the consolidated balance sheet consist of the tax effects of temporary differences related to the following (in millions):
September 30,
2012 2011
Accrued compensation and benefits . . . . . . . . . . . . . . . . . $ 20 $ 26Accrued product warranties. . . . . . . . . . . . . . . . . . . . . . . . 16 17Inventory costs . . . . . . . . . . . . . . . . . . . . . . . . . . . . . . . . . 18 17Receivables . . . . . . . . . . . . . . . . . . . . . . . . . . . . . . . . . . . 13 12Accrued retiree healthcare benefits . . . . . . . . . . . . . . . . . . 221 217Retirement pension plans . . . . . . . . . . . . . . . . . . . . . . . . . 180 180Property . . . . . . . . . . . . . . . . . . . . . . . . . . . . . . . . . . . . . . 7 11Loss and credit carryforwards . . . . . . . . . . . . . . . . . . . . . . 754 839Other . . . . . . . . . . . . . . . . . . . . . . . . . . . . . . . . . . . . . . . . 95 64
Sub-total . . . . . . . . . . . . . . . . . . . . . . . . . . . . . . . . . . . 1,324 1,383Less: Valuation allowances . . . . . . . . . . . . . . . . . . . . . . (1,204) (1,255)
Deferred income taxes - asset . . . . . . . . . . . . . . . . . . . . . . $ 120 $ 128
Taxes on undistributed income. . . . . . . . . . . . . . . . . . . . . . $ (81) $ (81)Intangible assets. . . . . . . . . . . . . . . . . . . . . . . . . . . . . . . . (84) (78)Debt basis difference . . . . . . . . . . . . . . . . . . . . . . . . . . . . (21) (25)
Deferred income taxes - liability. . . . . . . . . . . . . . . . . . . $ (186) $ (184)
Net deferred income tax liabilities . . . . . . . . . . . . . . . . . $ (66) $ (56)
Net current and non-current deferred income tax assets (liabilities) are included in the consolidated balance sheet as follows (in millions):
September 30,
2012 2011
Other current assets (see Note 9) . . . . . . . . . . . . . . . . . . . $ 27 $ 28Other current liabilities . . . . . . . . . . . . . . . . . . . . . . . . . . . (4) (4)
Net current deferred income taxes — asset. . . . . . . . . . 23 24
Other assets (see Note 11) . . . . . . . . . . . . . . . . . . . . . . . . 12 12Other liabilities (see Note 14) . . . . . . . . . . . . . . . . . . . . . . . (101) (92)
Net non-current deferred income taxes — liability . . . . . $ (89) $ (80)
In prior years, the company established valuation allowances against its U.S. net deferred tax assets and the net deferred tax assets of its 100% owned subsidiaries in France, Germany, Italy, Sweden, U.K. and certain other countries. The company evaluates deferred income taxes quarterly to determine if valuation allowances are required. The company is required to assess whether valuation allowances should be established against their deferred tax assets based on the consideration of all available evidence using a “more-likely-than-not” standard. As of September 30, 2012, the company maintains valuation allowances in these jurisdictions.
JOB TITLE Meritor 10-K REVISION 3 SERIAL DATE / TIME Friday, November 30, 2012 JOB NUMBER 243020 TYPE PAGE NO. 104 OPERATOR PM2
<12345678>

105
MERITOR, INC.
NOTES TO CONSOLIDATED FINANCIAL STATEMENTS — (Continued)
The expiration periods for $754 million of deferred tax assets related to net operating losses and tax credit carryforwards are as follows: $26 million between fiscal years 2013 and 2017; $248 million between fiscal years 2018 and 2027; $162 million between fiscal years 2028 and 2032; and $318 million can be carried forward indefinitely. The company has provided valuation allowances on these deferred tax assets of approximately $26 million, $246 million, $160 million and $318 million, respectively. Realization of deferred tax assets representing net operating loss carryforwards for which a valuation allowance has not been provided is dependent on generating sufficient taxable income prior to expiration of the loss carryforwards. Although realization is not assured, management believes it is more likely than not that all of such deferred tax assets will be realized. The amount of the deferred tax assets considered realizable, however, could be reduced in the near term if the company is unable to generate sufficient future taxable income during the carryforward period.
For fiscal years 2012 and 2011, no provision has been made for U.S., state or additional foreign income taxes related to approximately $471 million and $503 million of undistributed earnings of foreign subsidiaries that have been or are intended to be permanently reinvested. Quantification of the deferred tax liability, if any, associated with permanently reinvested earnings is not practicable.
The company’s provision for income taxes was different from the provision for income taxes calculated at the U.S. statutory rate for the reasons set forth below (in millions):
2012 2011 2010
Expense for income taxes at statutory tax rate of 35% . . . . . . . . . . . . . . . . . . . $ (48) $ (56) $(26)State and local income taxes . . . . . . . . . . . . . . . . . . . . . . . . . . . . . . . . . . . . . . (2) (3) 2Foreign income taxed at rates other than 35% . . . . . . . . . . . . . . . . . . . . . . . . . 8 23 9Joint venture equity income. . . . . . . . . . . . . . . . . . . . . . . . . . . . . . . . . . . . . . . 13 22 14Judicial decisions . . . . . . . . . . . . . . . . . . . . . . . . . . . . . . . . . . . . . . . . . . . . . . — — 11Tax benefits allocated to loss from continuing operations. . . . . . . . . . . . . . . . . . — 14 —Refunds of prior year taxes . . . . . . . . . . . . . . . . . . . . . . . . . . . . . . . . . . . . . . . 5 2 2Goodwill . . . . . . . . . . . . . . . . . . . . . . . . . . . . . . . . . . . . . . . . . . . . . . . . . . . . . (6) (6) (6)Medicare Part D subsidy . . . . . . . . . . . . . . . . . . . . . . . . . . . . . . . . . . . . . . . . . 4 2 2U.S. tax impact on distributions from subsidiaries and joint ventures . . . . . . . . . (90) (11) (5)Nondeductible expenses . . . . . . . . . . . . . . . . . . . . . . . . . . . . . . . . . . . . . . . . . (11) (17) (10)Valuation allowances. . . . . . . . . . . . . . . . . . . . . . . . . . . . . . . . . . . . . . . . . . . . 68 (43) (41)Other . . . . . . . . . . . . . . . . . . . . . . . . . . . . . . . . . . . . . . . . . . . . . . . . . . . . . . . 3 (4) —
Income tax expense . . . . . . . . . . . . . . . . . . . . . . . . . . . . . . . . . . . . . . . . . . $ (56) $ (77) $(48)
In fiscal year 2012, the company recorded a non-cash charge of $90 million primarily related to the impact of foreign distributions as a result of legal entity restructuring actions. This charge does not impact income tax expense since it is offset by a corresponding release of U.S. valuation allowance.
Income tax expense (benefit) is allocated between continuing operations, discontinued operations and other comprehensive income (OCI). Such allocation is applied by tax jurisdiction, and in periods in which there is a pre-tax loss from continuing operations and pre-tax income in another category, such as discontinued operations or OCI, income tax expense is first allocated to the other sources of income, with a related benefit recorded in continuing operations. Income tax expense in fiscal year 2011 was favorably impacted by a $14 million tax benefit recorded in continuing operations that was required to offset a tax expense recorded against the income in other comprehensive loss resulting from the year-end re-measurement of our retiree healthcare obligations.
In fiscal year 2010, the company reduced liabilities for uncertain tax positions as a result of certain judicial decisions.
Total amount of gross unrecognized tax benefits the company recorded in accordance with FASB ASC Topic 740 as of September 30, 2012 was $107 million, of which $12 million represents the amount, if recognized, would favorably affect the effective income tax rate in future periods.
JOB TITLE Meritor 10-K REVISION 3 SERIAL DATE / TIME Friday, November 30, 2012 JOB NUMBER 243020 TYPE PAGE NO. 105 OPERATOR PM2
<12345678>

106
MERITOR, INC.
NOTES TO CONSOLIDATED FINANCIAL STATEMENTS — (Continued)
A reconciliation of the total amounts of unrecognized tax benefits at the beginning and end of the period is as follows (in millions):
2012 2011 2010
Balance at beginning of the period . . . . . . . . . . . . . . . . . . . . . . . . . . . . . . . . . . $ 109 $ 111 $ 104Additions to tax positions recorded during the current year . . . . . . . . . . . . . . 11 9 9Additions to tax positions recorded during the prior year . . . . . . . . . . . . . . . . — 13 —Reduction to tax position recorded in prior years. . . . . . . . . . . . . . . . . . . . . . (5) (21) (11)Reductions to tax positions due to lapse of statutory limits . . . . . . . . . . . . . . (8) (2) (1)Translation, other . . . . . . . . . . . . . . . . . . . . . . . . . . . . . . . . . . . . . . . . . . . . — (1) 10
Balance at end of the period . . . . . . . . . . . . . . . . . . . . . . . . . . . . . . . . . . . . . . $ 107 $ 109 $ 111
The company’s continuing practice is to recognize interest and penalties on uncertain tax positions in the provision for income taxes in the consolidated statement of operations. At September 30, 2012 and September 30, 2011 the company recorded $5 million and $6 million, respectively, of interest on uncertain tax positions in the consolidated balance sheet. In addition, penalties of $4 million were recorded at September 30, 2012 and September 30, 2011. The impact on tax expense related to penalties for years ended September 30, 2011 and September 30, 2010 was $2 million and $5 million, respectively. The amount was immaterial for the year ended September 30, 2012. Interest was immaterial for all periods presented.
The company files tax returns in multiple jurisdictions and is subject to examination by taxing authorities throughout the world. The company’s U.S. federal income tax returns for fiscal years 2010 and 2011 are currently under audit. The company’s Canadian federal income tax returns for fiscal years 2007 through 2009 are currently under audit. The company’s Brazil subsidiary is currently under audit for calendar year 2008. The company’s Chinese subsidiary is currently under audit for fiscal year 2010. In addition, the company is under audit in various U.S. state tax jurisdictions for various years. It is reasonably possible that audit settlements, the conclusion of current examinations or the expiration of the statute of limitations in several jurisdictions could significantly change the company’s unrecognized tax benefits during the next twelve months. Due to the expected expiration of the statute of limitations in several jurisdictions, the company estimates that the unrecognized tax benefits could decrease during the next twelve months between $3 million and $6 million.
In addition to the audits listed above, the company has open tax years primarily from 1999-2011 with various significant taxing jurisdictions including the United States, Brazil, Canada, China, France, Mexico and the U. K. These open years contain matters that could be subject to differing interpretations of applicable tax laws and regulations as they relate to the amount, timing or inclusion of revenue and expenses or the sustainability of income tax credits for a given audit cycle. The company has recorded a tax benefit only for those positions that meet the more-likely-than-not standard.
22. CONTINGENCIES
Environmental
Federal, state and local requirements relating to the discharge of substances into the environment, the disposal of hazardous wastes and other activities affecting the environment have, and will continue to have, an impact on the operations of the company. The process of estimating environmental liabilities is complex and dependent upon evolving physical and scientific data at the sites, uncertainties as to remedies and technologies to be used and the outcome of discussions with regulatory agencies. The company records liabilities for environmental issues in the accounting period in which they are considered to be probable and the cost can be reasonably estimated. At environmental sites in which more than one potentially responsible party has been identified, the company records a liability for its allocable share of costs related to its involvement with the site, as well as an allocable share of costs related to insolvent parties or unidentified shares. At environmental sites in which Meritor is the only potentially responsible party, the company records a liability for the total probable and estimable costs of remediation before consideration of recovery from insurers or other third parties.
JOB TITLE Meritor 10-K REVISION 3 SERIAL DATE / TIME Friday, November 30, 2012 JOB NUMBER 243020 TYPE PAGE NO. 106 OPERATOR PM2
<12345678>

107
MERITOR, INC.
NOTES TO CONSOLIDATED FINANCIAL STATEMENTS — (Continued)
The company has been designated as a potentially responsible party at nine Superfund sites, excluding sites as to which the company’s records disclose no involvement or as to which the company’s liability has been finally determined. Management estimates the total reasonably possible costs the company could incur for the remediation of Superfund sites at September 30, 2012 to be approximately $19 million, of which $2 million is recorded as a liability. Included in reasonably possible amounts are estimates for certain remediation actions that may be required if current actions are deemed inadequate by the regulators. Environmental remediation costs recorded with respect to the Superfund sites were $1 million, $2 million, and $1 million in fiscal years 2012, 2011, and 2010, respectively.
In addition to the Superfund sites, various other lawsuits, claims and proceedings have been asserted against the company, alleging violations of federal, state and local environmental protection requirements, or seeking remediation of alleged environmental impairments, principally at previously disposed-of properties. For these matters, management has estimated the total reasonably possible costs the company could incur at September 30, 2012 to be approximately $36 million, of which $15 million is recorded as a liability. During fiscal years 2012, 2011 and 2010, the company recorded environmental remediation costs of $6 million, $4 million and $7 million, respectively, with respect to these matters, resulting from revised estimates to remediate these sites.
Included in the company’s environmental liabilities are costs for on-going operation, maintenance and monitoring at environmental sites in which remediation has been put into place. This liability is discounted using a discount rate of 5 percent and is approximately $9 million at September 30, 2012. The undiscounted estimate of these costs is approximately $11 million.
Following are the components of the Superfund and non-Superfund environmental reserves (in millions):
SuperfundSites
Non-SuperfundSites Total
Balance at September 30, 2011 . . . . . . . . . . . . . . . . . . . . $ 2 $15 $17Payments . . . . . . . . . . . . . . . . . . . . . . . . . . . . . . . . . . . . . (1) (6) (7)Change in cost estimates (1) . . . . . . . . . . . . . . . . . . . . . . . 1 6 7
Balance at September 30, 2012 . . . . . . . . . . . . . . . . . . . . $ 2 $15 $17
(1) There were $4 million, $2 million, and $6 million of environmental remediation costs recognized in other operating expense in the consolidated statement of income in fiscal years 2012, 2011 and 2010, respectively. In addition, $3 million of environmental remediation costs were recorded in loss from discontinued operations in the consolidated statement of income for the fiscal year ended September 30, 2012.
Environmental reserves are included in Other Current Liabilities (see Note 13) and Other Liabilities (see Note 14) in the consolidated balance sheet.
The actual amount of costs or damages for which the company may be held responsible could materially exceed the foregoing estimates because of uncertainties, including the financial condition of other potentially responsible parties, the success of the remediation, discovery of new contamination and other factors that make it difficult to predict actual costs accurately. However, based on management’s assessment, after consulting with outside advisors that specialize in environmental matters, and subject to the difficulties inherent in estimating these future costs, the company believes that its expenditures for environmental capital investment and remediation necessary to comply with present regulations governing environmental protection and other expenditures for the resolution of environmental claims will not have a material adverse effect on the company’s business, financial condition or results of operations. In addition, in future periods, new laws and regulations, changes in remediation plans, advances in technology and additional information about the ultimate clean-up remedies could significantly change the company’s estimates. Management cannot assess the possible effect of compliance with future requirements.
JOB TITLE Meritor 10-K REVISION 3 SERIAL DATE / TIME Friday, November 30, 2012 JOB NUMBER 243020 TYPE PAGE NO. 107 OPERATOR PM2
<12345678>

108
MERITOR, INC.
NOTES TO CONSOLIDATED FINANCIAL STATEMENTS — (Continued)
Asset Retirement Obligations
The company has identified conditional asset retirement obligations for which a reasonable estimate of fair value could not be made because the potential settlement dates cannot be determined at this time. Due to the long term, productive nature of the company’s manufacturing operations, absent plans or expectations of plans to initiate asset retirement activities, the company was not able to reasonably estimate the settlement date for the related obligations. Therefore, the company has not recognized conditional asset retirement obligations for which there are no plans or expectations of plans to retire the asset.
Asbestos
Maremont Corporation (“Maremont”), a subsidiary of Meritor, manufactured friction products containing asbestos from 1953 through 1977, when it sold its friction product business. Arvin Industries, Inc., a predecessor of the company, acquired Maremont in 1986. Maremont and many other companies are defendants in suits brought by individuals claiming personal injuries as a result of exposure to asbestos-containing products. Maremont had approximately 5,000 and 21,000 pending asbestos-related claims at September 30, 2012 and 2011, respectively. The decrease in pending claims is primarily due to reclassification of claims to dismissed but not documented status. Although Maremont has been named in these cases, in the cases where actual injury has been alleged, very few claimants have established that a Maremont product caused their injuries. Plaintiffs’ lawyers often sue dozens or even hundreds of defendants in individual lawsuits on behalf of hundreds or thousands of claimants, seeking damages against all named defendants irrespective of the disease or injury and irrespective of any causal connection with a particular product. For these reasons, Maremont does not consider the number of claims filed or the damages alleged to be a meaningful factor in determining its asbestos-related liability.
Maremont’s asbestos-related reserves and corresponding asbestos-related recoveries are summarized as follows (in millions):
September 30,
2012 2011
Pending and future claims . . . . . . . . . . . . . . . . . . . . . . . . . $ 75 $ 77Asbestos-related insurance recoveries . . . . . . . . . . . . . . . . 67 67
A portion of the asbestos-related recoveries and reserves are included in Other Current Assets and Liabilities (see Notes 9 and 13, with the majority of the amounts recorded in Other Assets and Liabilities (see Notes 11 and 14).
Prior to February 2001, Maremont participated in the Center for Claims Resolution (“CCR”) and shared with other CCR members in the payment of defense and indemnity costs for asbestos-related claims. The CCR handled the resolution and processing of asbestos claims on behalf of its members until February 2001, when it was reorganized and discontinued negotiating shared settlements. Since the CCR was reorganized in 2001, Maremont has handled asbestos-related claims through its own defense counsel and has taken a more aggressive defensive approach that involves examining the merits of each asbestos-related claim. Although the company expects legal defense costs to continue at higher levels than when it participated in the CCR, the company believes its litigation strategy has reduced the average indemnity cost per claim.
Pending and Future Claims: Maremont engages Bates White LLC (Bates White), a consulting firm with extensive experience estimating costs associated with asbestos litigation, to assist with determining the estimated cost of resolving pending and future asbestos-related claims that have been, and could reasonably be expected to be, filed against Maremont. Bates White advised Maremont that it would be possible to determine an estimate of a reasonable forecast of the cost of the probable settlement and defense costs of resolving pending and future asbestos-related claims, based on historical data and certain assumptions with respect to events that may occur in the future.
Bates White provided an estimate of the reasonably possible range of Maremont’s obligation for asbestos personal injury claims over the next ten years of $72 million to $88 million. After consultation with Bates White, Maremont determined that as of September 30, 2012, the most likely and probable liability for pending and future claims over the next ten years is $72 million. The ultimate cost of resolving pending and future claims is estimated based on the history of claims and expenses for plaintiffs represented by law firms in jurisdictions with an established history with Maremont.
JOB TITLE Meritor 10-K REVISION 3 SERIAL DATE / TIME Friday, November 30, 2012 JOB NUMBER 243020 TYPE PAGE NO. 108 OPERATOR PM2
<12345678>

109
MERITOR, INC.
NOTES TO CONSOLIDATED FINANCIAL STATEMENTS — (Continued)
Assumptions: The following assumptions were made by Maremont after consultation with Bates White and are included in their study:
• Pending and future claims were estimated for a ten-year period ending in fiscal year 2022. The ten-year assumption is considered appropriate as Maremont has reached certain longer-term agreements with key plaintiff law firms and filings of mesothelioma claims have been relatively stable over the last few years resulting in an improvement in the reliability of future projections over a longer time period;
• Maremont believes that the litigation environment will change significantly beyond ten years and that the reliability of estimates of future probable expenditures in connection with asbestos-related personal injury claims will decline for each year further in the future. As a result, estimating a probable liability beyond ten years is difficult and uncertain;
• Defense and processing costs for pending and future claims will be at the level consistent with Maremont’s prior experience;
• Potential payments made to claimants from other sources, including other defendants and 524(g) trusts favorably impact Maremont’s estimated liability in the future; and
• The ultimate indemnity cost of resolving nonmalignant claims with plaintiffs’ law firms in jurisdictions without an established history with Maremont cannot be reasonably estimated.
Recoveries: Maremont has insurance that reimburses a substantial portion of the costs incurred defending against asbestos-related claims. The coverage also reimburses Maremont for any indemnity paid on those claims. The coverage is provided by several insurance carriers based on insurance agreements in place. Incorporating historical information with respect to buy-outs and settlements of coverage, the insurance receivable related to asbestos-related liabilities is $67 million as of September 30, 2012. The difference between the estimated liability and insurance receivable is primarily related to proceeds received from settled insurance policies. Certain insurance policies have been settled in cash prior to the ultimate settlement of the related asbestos liabilities. Amounts received from insurance settlements generally reduce recorded insurance receivables. No amounts have been recorded for policies in dispute.
The amounts recorded for the asbestos-related reserves and recoveries from insurance companies are based upon assumptions and estimates derived from currently known facts. All such estimates of liabilities and recoveries for asbestos-related claims are subject to considerable uncertainty because such liabilities and recoveries are influenced by variables that are difficult to predict. The future litigation environment for Maremont could change significantly from its past experience, due, for example, to changes in the mix of claims filed against Maremont in terms of plaintiffs’ law firm, jurisdiction and disease; legislative or regulatory developments; Maremont’s approach to defending claims; or payments to plaintiffs from other defendants. Estimated recoveries are influenced by coverage issues among insurers and the continuing solvency of various insurance companies. If the assumptions with respect to the nature of pending and future claims, the cost to resolve claims and the amount of available insurance prove to be incorrect, the actual amount of liability for Maremont’s asbestos-related claims, and the effect on the company, could differ materially from current estimates and, therefore, could have a material impact on the company’s financial condition and results of operations.
Rockwell International (Rockwell) — ArvinMeritor, Inc. (AM), a subsidiary of Meritor, along with many other companies, has also been named as a defendant in lawsuits alleging personal injury as a result of exposure to asbestos used in certain components of Rockwell products many years ago. Liability for these claims was transferred at the time of the spin-off of the automotive business from Rockwell in 1997. At September 30, 2012 and 2011, there were approximately 2,500 and 4,200 pending active asbestos claims in lawsuits that name AM, together with many other companies, as defendants. A significant portion of the claims do not identify any of Rockwell’s products or specify which of the claimants, if any, were exposed to asbestos attributable to Rockwell’s products, and past experience has shown that the vast majority of the claimants will likely never identify any of Rockwell’s products. Historically, AM has been dismissed from the vast majority of similar claims filed in the past with no payment to claimants. For those claimants who do show that they worked with Rockwell’s products, management nevertheless believes it has meritorious defenses, in substantial part due to the integrity of the products involved and the lack of any impairing
JOB TITLE Meritor 10-K REVISION 3 SERIAL DATE / TIME Friday, November 30, 2012 JOB NUMBER 243020 TYPE PAGE NO. 109 OPERATOR PM2
<12345678>

110
MERITOR, INC.
NOTES TO CONSOLIDATED FINANCIAL STATEMENTS — (Continued)
medical condition on the part of many claimants. For these reasons, the company does not consider the number of claims filed or the damages alleged to be a meaningful factor in determining asbestos-related liabilities. The company defends these cases vigorously.
The company engages Bates White to assist with determining whether it would be possible to estimate the cost of resolving pending and future Rockwell legacy asbestos-related claims that have been, and could reasonably be expected to be, filed against the company. Bates White provided an estimate that consisted of a range of equally likely possibilities of Rockwell’s obligation for asbestos personal injury claims over the next ten years of $37 million to $45 million. The company recognized a liability of $37 million at September 30, 2012 compared to a four-year period forecast of $19 million at September 30, 2011. The company began estimating its Rockwell asbestos obligation utilizing a ten-year forecast period as of September 30, 2012. The company utilized a four-year forecast period through fiscal year 2011 due to significant volatility in defense and processing costs and lack of substantive history related to Rockwell asbestos claims. The ultimate cost of resolving pending and future claims is estimated based on the history of claims and expenses for plaintiffs represented by law firms in jurisdictions with an established history with Rockwell.
The following assumptions were made by the company after consultation with Bates White and are included in their study:
• Pending and future claims were estimated for a ten-year period ending in fiscal year 2022. The forecast period used to estimate a reasonably possible range of claims was increased from four years at September 30, 2011 to ten years at September 30, 2012. Rockwell has reached certain longer-term agreements with key plaintiff law firms that make payments beyond the four-year period more reasonably estimable. In addition, filings of mesothelioma claims have been relatively stable over the last few years resulting in an improvement in the reliability of future projections over a longer time period;
• The company believes that the litigation environment will change significantly beyond ten years, and that the reliability of estimates of future probable expenditures in connection with asbestos-related personal injury claims declines for each year further in the future. As a result, estimating a probable liability beyond ten years is difficult and uncertain;
• Defense and processing costs for pending and future claims will be at the level consistent with the company’s longer-term experience and will not have the significant volatility experienced in the recent years;
• Potential payments made to claimants from other sources, including other defendants and 524(g) trusts favorably impact the company’s estimated liability in the future; and
• The ultimate indemnity cost of resolving nonmalignant claims with plaintiff’s law firms in jurisdictions without an established history with Rockwell cannot be reasonably estimated.
In addition to the probable liability for pending and future claims discussed above, the company also recognized a liability of approximately $7 million in fiscal year 2012 associated with a previously disclosed asbestos-related claim (Gordon Bankhead) which was settled during the fourth quarter of fiscal year 2012. The payment required by the settlement agreement is expected to be made in the first quarter of fiscal year 2013.
Rockwell maintained insurance coverage that management believes covers indemnity and defense costs, over and above self-insurance retentions, for most of these claims. The company has initiated claims against certain of these carriers to enforce the insurance policies, which are currently being disputed. The company expects to recover some portion of defense and indemnity costs it has incurred to date, over and above self-insured retentions, and some portion of the costs for defending asbestos claims going forward. Based on consultation with advisors and underlying analysis performed by management, the company has recorded an insurance receivable related to Rockwell legacy asbestos-related liabilities of $7 million and $9 million at September 30, 2012 and 2011, respectively. If the assumptions with respect to the nature of pending claims, the cost to resolve claims and the amount of available insurance prove to be incorrect, the actual amount of liability for Rockwell asbestos-related claims, and the effect on the company, could differ materially from current estimates and, therefore, could have a material impact on the company’s financial condition and results of operations.
JOB TITLE Meritor 10-K REVISION 3 SERIAL DATE / TIME Friday, November 30, 2012 JOB NUMBER 243020 TYPE PAGE NO. 110 OPERATOR PM2
<12345678>

111
MERITOR, INC.
NOTES TO CONSOLIDATED FINANCIAL STATEMENTS — (Continued)
Indemnifications
In December 2005, the company guaranteed a third party’s obligation to reimburse another party for payment of health and prescription drug benefits to a group of retired employees. The retirees were former employees of a wholly-owned subsidiary of the company prior to it being acquired by the company. The wholly-owned subsidiary, which was part of the company’s light vehicle aftermarket business, was sold by the company in fiscal year 2006. Prior to May 2009, except as set forth hereinafter, the third party met its obligations to reimburse the other party. In May 2009, the third party filed for bankruptcy protection under Chapter 11 of the U.S. Bankruptcy Code requiring the company to recognize its obligations under the guarantee. The company recorded a $28 million liability in fiscal year 2009 for this matter. At September 30, 2012 and September 30, 2011, the remaining estimated liability for this matter was approximately $19 million and $23 million, respectively.
The company has provided indemnifications in conjunction with certain transactions, primarily divestitures. These indemnities address a variety of matters, which may include environmental, tax, asbestos and employment-related matters, and the periods of indemnification vary in duration. The company’s maximum obligations under these indemnifications cannot be reasonably estimated. The company is not aware of any claims or other information that would give rise to material payments under such indemnifications other than those related to the sale of its Body Systems business and its 57 percent interest in MSSC disclosed in Note 3.
Other
On March 31, 2008, S&E Quick Lube, a filter distributor, filed suit in U.S. District Court for the District of Connecticut alleging that several filter manufacturers and their affiliated corporate entities, including a prior subsidiary of the company, engaged in a conspiracy to fix prices, rig bids and allocate U.S. customers for aftermarket automotive filters. This suit was a purported class action on behalf of direct purchasers of filters from the defendants. Several parallel purported class actions, including on behalf of indirect purchasers of filters, were filed by other plaintiffs in a variety of jurisdictions in the United States and Canada. The U.S. cases were consolidated into a multi-district litigation proceeding in Federal court for the Northern District of Illinois. On April 16, 2009, the Attorney General of the State of Florida filed a complaint with the U.S. District Court for the Northern District of Illinois based on these same allegations. In April 2012, the company settled with the U.S. indirect purchasers for $3.1 million resolving their portion of the suit. In August 2012, the company entered into a settlement agreement for the remaining claims with the U.S. direct purchasers for $8.3 million. The liability for the settlement agreement with the U.S. direct purchasers is included in other current liabilities in the consolidated balance sheet. Following this settlement, the only remaining plaintiffs in the litigation are those who filed their actions in Canada.
The company is evaluating certain sale transactions to determine if value added tax was required to be remitted to certain tax jurisdictions for the tax years 2007 through 2012. The company’s estimated reasonably possible exposure for this matter is $6 million to $11 million. The company has recorded $6 million as its estimate of the probable liability at September 30, 2012.
In addition, various lawsuits, claims and proceedings, other than those specifically disclosed in the consolidated financial statements, have been or may be instituted or asserted against the company, relating to the conduct of the company’s business, including those pertaining to product liability, warranty or recall claims, intellectual property, safety and health, contract and employment matters. Although the outcome of other litigation cannot be predicted with certainty, and some lawsuits, claims or proceedings may be disposed of unfavorably to the company, management believes the disposition of matters that are pending will not have a material effect on the company’s business, financial condition, results of operations or cash flows.
JOB TITLE Meritor 10-K REVISION 3 SERIAL DATE / TIME Friday, November 30, 2012 JOB NUMBER 243020 TYPE PAGE NO. 111 OPERATOR PM2
<12345678>

112
MERITOR, INC.
NOTES TO CONSOLIDATED FINANCIAL STATEMENTS — (Continued)
23. BUSINESS SEGMENT INFORMATION
The company defines its operating segments as components of its business where separate financial information is available and is evaluated regularly by the chief operating decision maker in deciding how to allocate resources and in assessing performance. The company’s chief operating decision maker (CODM) is the Chief Executive Officer.
The company has three reportable segments at September 30, 2012, as follows:
• The Commercial Truck segment supplies drivetrain systems and components, including axles, drivelines and braking and suspension systems, primarily for medium- and heavy-duty trucks in North America, South America and Europe;
• The Industrial segment supplies drivetrain systems including axles, brakes, drivelines and suspensions for off-highway, military, construction, bus and coach, fire and emergency and other industrial applications. This segment also includes the company’s OE businesses in Asia Pacific, including all on- and off-highway activities; and
• The Aftermarket & Trailer segment supplies axles, brakes, drivelines, suspension parts and other replacement and remanufactured parts, including transmissions, to commercial vehicle and industrial aftermarket customers. This segment also supplies a wide variety of undercarriage products and systems for trailer applications in North America.
Segment EBITDA is defined as income (loss) from continuing operations before interest expense, income taxes, depreciation and amortization, non-controlling interests in consolidated joint ventures, loss on sale of receivables, restructuring costs and asset impairment charges. The company uses Segment EBITDA as the primary basis for the Chief Operating Decision Maker (CODM) to evaluate the performance of each of its reportable segments.
The accounting policies of the segments are the same as those applied in the Consolidated Financial Statements, except for the use of Segment EBITDA. The company may allocate certain common costs, primarily corporate functions, between the segments differently than the company would for stand alone financial information prepared in accordance with GAAP. These allocated costs include expenses for shared services such as information technology, finance, communications, legal and human resources. The company does not allocate interest expense and certain legacy and other corporate costs not directly associated with the Segments’ EBITDA.
Segment information is summarized as follows (in millions):
CommercialTruck Industrial
Aftermarket & Trailer Elims Total
Fiscal year 2012 Sales: External Sales . . . . . . . . . . . . . . . . . . . . . . . . . . . . . . . . $2,487 $ 936 $ 995 $ — $4,418Intersegment Sales . . . . . . . . . . . . . . . . . . . . . . . . . . . . . 230 65 16 (311) —
Total Sales . . . . . . . . . . . . . . . . . . . . . . . . . . . . . . . . . $2,717 $1,001 $1,011 $(311) $4,418Fiscal year 2011 Sales:
External Sales . . . . . . . . . . . . . . . . . . . . . . . . . . . . . . . . $2,585 $1,031 $1,006 $ — $4,622Intersegment Sales . . . . . . . . . . . . . . . . . . . . . . . . . . . . . 221 82 14 (317) —
Total Sales . . . . . . . . . . . . . . . . . . . . . . . . . . . . . . . . . $2,806 $1,113 $1,020 $(317) $4,622Fiscal year 2010 Sales:
External Sales . . . . . . . . . . . . . . . . . . . . . . . . . . . . . . . . $1,739 $ 890 $ 901 $ — $3,530Intersegment Sales . . . . . . . . . . . . . . . . . . . . . . . . . . . . . 221 61 8 (290) —
Total Sales . . . . . . . . . . . . . . . . . . . . . . . . . . . . . . . . . $1,960 $ 951 $ 909 $(290) $3,530
JOB TITLE Meritor 10-K REVISION 3 SERIAL DATE / TIME Friday, November 30, 2012 JOB NUMBER 243020 TYPE PAGE NO. 112 OPERATOR PM2
<12345678>

113
MERITOR, INC.
NOTES TO CONSOLIDATED FINANCIAL STATEMENTS — (Continued)
Segment EBITDA: 2012 2011 2010
Commercial Truck. . . . . . . . . . . . . . . . . . . . . . . . . . . . . . . . . . . . . . . . . . . . . . . . . . . . . . . . $ 190 $ 171 $ 85Industrial . . . . . . . . . . . . . . . . . . . . . . . . . . . . . . . . . . . . . . . . . . . . . . . . . . . . . . . . . . . . . . 68 74 94Aftermarket & Trailer. . . . . . . . . . . . . . . . . . . . . . . . . . . . . . . . . . . . . . . . . . . . . . . . . . . . . . 93 113 83
Segment EBITDA . . . . . . . . . . . . . . . . . . . . . . . . . . . . . . . . . . . . . . . . . . . . . . . . . . . . . . 351 358 262Unallocated legacy and corporate expense, net (1) . . . . . . . . . . . . . . . . . . . . . . . . . . . . . . . . (24) (11) (2)Interest expense, net. . . . . . . . . . . . . . . . . . . . . . . . . . . . . . . . . . . . . . . . . . . . . . . . . . . . . . (95) (95) (106)Provision for income taxes. . . . . . . . . . . . . . . . . . . . . . . . . . . . . . . . . . . . . . . . . . . . . . . . . . (56) (77) (48)Depreciation and amortization . . . . . . . . . . . . . . . . . . . . . . . . . . . . . . . . . . . . . . . . . . . . . . . (63) (66) (69)Loss on sale of receivables . . . . . . . . . . . . . . . . . . . . . . . . . . . . . . . . . . . . . . . . . . . . . . . . . (9) (10) (3)Restructuring costs. . . . . . . . . . . . . . . . . . . . . . . . . . . . . . . . . . . . . . . . . . . . . . . . . . . . . . . (39) (22) (6)Gain on sale of property . . . . . . . . . . . . . . . . . . . . . . . . . . . . . . . . . . . . . . . . . . . . . . . . . . . 16 — —Other income, net. . . . . . . . . . . . . . . . . . . . . . . . . . . . . . . . . . . . . . . . . . . . . . . . . . . . . . . . — 5 —Noncontrolling interests. . . . . . . . . . . . . . . . . . . . . . . . . . . . . . . . . . . . . . . . . . . . . . . . . . . . (11) (17) (14)
Income from continuing operations attributable to Meritor, Inc. . . . . . . . . . . . . . . . . . . . . . . . $ 70 $ 65 $ 14
(1) Unallocated legacy and corporate expense, net represents items that are not directly related to our business segments primarily include pension and retiree medical costs associated with sold businesses and other legacy costs for environmental and product liability. In fiscal year 2012, the company recognized an $18 million charge associated with the valuation and remeasurement of asbestos-related liabilities (see Note 22). In fiscal year 2010, the company recognized approximately $7 million of income as a result of the pension curtailment triggered by the freeze of the company’s U.K. pension plan, of which $6 million is included in unallocated legacy and corporate expense, net.
Depreciation and Amortization: 2012 2011 2010
Commercial Truck. . . . . . . . . . . . . . . . . . . . . . . . . . . . . . . . . . . . . . . . . . . . . . . . . . . . $ 47 $ 50 $ 54Industrial . . . . . . . . . . . . . . . . . . . . . . . . . . . . . . . . . . . . . . . . . . . . . . . . . . . . . . . . . . 11 10 10Aftermarket & Trailer. . . . . . . . . . . . . . . . . . . . . . . . . . . . . . . . . . . . . . . . . . . . . . . . . . 5 6 5
Total depreciation and amortization . . . . . . . . . . . . . . . . . . . . . . . . . . . . . . . . . . . . . $ 63 $ 66 $ 69
Capital Expenditures: 2012 2011 2010
Commercial Truck. . . . . . . . . . . . . . . . . . . . . . . . . . . . . . . . . . . . . . . . . . . . . . . . . . . . $ 66 $ 72 $ 29Industrial . . . . . . . . . . . . . . . . . . . . . . . . . . . . . . . . . . . . . . . . . . . . . . . . . . . . . . . . . . 14 24 16Aftermarket & Trailer. . . . . . . . . . . . . . . . . . . . . . . . . . . . . . . . . . . . . . . . . . . . . . . . . . 9 9 10
Total capital expenditures . . . . . . . . . . . . . . . . . . . . . . . . . . . . . . . . . . . . . . . . . . . . $ 89 $ 105 $ 55
Segment Assets: 2012 2011 2010
Commercial Truck. . . . . . . . . . . . . . . . . . . . . . . . . . . . . . . . . . . . . . . . . . . . . . . . . . . . $1,341 $1,482 $1,207Industrial . . . . . . . . . . . . . . . . . . . . . . . . . . . . . . . . . . . . . . . . . . . . . . . . . . . . . . . . . . 423 470 397Aftermarket & Trailer. . . . . . . . . . . . . . . . . . . . . . . . . . . . . . . . . . . . . . . . . . . . . . . . . . 505 504 506
Total segment assets . . . . . . . . . . . . . . . . . . . . . . . . . . . . . . . . . . . . . . . . . . . . . . . 2,269 2,456 2,110Corporate (1) . . . . . . . . . . . . . . . . . . . . . . . . . . . . . . . . . . . . . . . . . . . . . . . . . . . . . . . 487 483 Discontinued operations . . . . . . . . . . . . . . . . . . . . . . . . . . . . . . . . . . . . . . . . . . . . . . . — 4 Less: Accounts receivable sold under off-balance sheet factoring programs (2) . . . . . . . (255) (280)
Total assets . . . . . . . . . . . . . . . . . . . . . . . . . . . . . . . . . . . . . . . . . . . . . . . . . . . . . . $2,501 $2,663
JOB TITLE Meritor 10-K REVISION 3 SERIAL DATE / TIME Friday, November 30, 2012 JOB NUMBER 243020 TYPE PAGE NO. 113 OPERATOR PM2
<12345678>

114
MERITOR, INC.
NOTES TO CONSOLIDATED FINANCIAL STATEMENTS — (Continued)
(1) Corporate assets consist primarily of cash, deferred income taxes and prepaid pension costs.
(2) At September 30, 2012 and September 30, 2011, segment assets include $255 million and $280 million, respectively, of accounts receivable sold under off-balance sheet accounts receivable factoring programs (See Note 6). These sold receivables are included in segment assets as the CODM reviews segment assets inclusive of these balances.
Sales by geographic area are based on the location of the selling unit. Information on the company’s geographic areas is summarized as follows (in millions):
Sales by Geographic Area:
2012 2011 2010
U.S. . . . . . . . . . . . . . . . . . . . . . . . . . . . . . . . . . . . . . . . . . . . . . . . . . . . . . . . . $1,698 $1,513 $1,365Canada . . . . . . . . . . . . . . . . . . . . . . . . . . . . . . . . . . . . . . . . . . . . . . . . . . . . . 87 100 87Mexico . . . . . . . . . . . . . . . . . . . . . . . . . . . . . . . . . . . . . . . . . . . . . . . . . . . . . . 726 597 337
Total North America . . . . . . . . . . . . . . . . . . . . . . . . . . . . . . . . . . . . . . . . . . 2,511 2,210 1,789Sweden . . . . . . . . . . . . . . . . . . . . . . . . . . . . . . . . . . . . . . . . . . . . . . . . . . . . . 403 427 253Italy . . . . . . . . . . . . . . . . . . . . . . . . . . . . . . . . . . . . . . . . . . . . . . . . . . . . . . . . 189 116 65France . . . . . . . . . . . . . . . . . . . . . . . . . . . . . . . . . . . . . . . . . . . . . . . . . . . . . . 82 264 193Other Europe . . . . . . . . . . . . . . . . . . . . . . . . . . . . . . . . . . . . . . . . . . . . . . . . . 200 207 184
Total Europe . . . . . . . . . . . . . . . . . . . . . . . . . . . . . . . . . . . . . . . . . . . . . . . . 874 1,014 695China . . . . . . . . . . . . . . . . . . . . . . . . . . . . . . . . . . . . . . . . . . . . . . . . . . . . . . . 255 312 245India. . . . . . . . . . . . . . . . . . . . . . . . . . . . . . . . . . . . . . . . . . . . . . . . . . . . . . . . 194 240 153Other Asia Pacific . . . . . . . . . . . . . . . . . . . . . . . . . . . . . . . . . . . . . . . . . . . . . . 114 100 101South America, primarily Brazil . . . . . . . . . . . . . . . . . . . . . . . . . . . . . . . . . . . . 470 746 547
Total sales . . . . . . . . . . . . . . . . . . . . . . . . . . . . . . . . . . . . . . . . . . . . . . . . . $4,418 $4,622 $3,530
Assets by Geographic Area:
2012 2011
U.S. . . . . . . . . . . . . . . . . . . . . . . . . . . . . . . . . . . . . . . . . . . . . . . . . . . . . . . . . . . . . . . . . $1,089 $1,158Canada . . . . . . . . . . . . . . . . . . . . . . . . . . . . . . . . . . . . . . . . . . . . . . . . . . . . . . . . . . . . . 77 72Mexico . . . . . . . . . . . . . . . . . . . . . . . . . . . . . . . . . . . . . . . . . . . . . . . . . . . . . . . . . . . . . . 172 183
Total North America . . . . . . . . . . . . . . . . . . . . . . . . . . . . . . . . . . . . . . . . . . . . . . . . . . 1,338 1,413Sweden . . . . . . . . . . . . . . . . . . . . . . . . . . . . . . . . . . . . . . . . . . . . . . . . . . . . . . . . . . . . . 118 134Switzerland . . . . . . . . . . . . . . . . . . . . . . . . . . . . . . . . . . . . . . . . . . . . . . . . . . . . . . . . . . 136 137France . . . . . . . . . . . . . . . . . . . . . . . . . . . . . . . . . . . . . . . . . . . . . . . . . . . . . . . . . . . . . . 21 87Other Europe . . . . . . . . . . . . . . . . . . . . . . . . . . . . . . . . . . . . . . . . . . . . . . . . . . . . . . . . . 195 197
Total Europe . . . . . . . . . . . . . . . . . . . . . . . . . . . . . . . . . . . . . . . . . . . . . . . . . . . . . . . . 470 555China . . . . . . . . . . . . . . . . . . . . . . . . . . . . . . . . . . . . . . . . . . . . . . . . . . . . . . . . . . . . . . . 225 207Other Asia Pacific . . . . . . . . . . . . . . . . . . . . . . . . . . . . . . . . . . . . . . . . . . . . . . . . . . . . . . 123 122South America, primarily Brazil . . . . . . . . . . . . . . . . . . . . . . . . . . . . . . . . . . . . . . . . . . . . 345 362
Total (1) . . . . . . . . . . . . . . . . . . . . . . . . . . . . . . . . . . . . . . . . . . . . . . . . . . . . . . . . . . . $2,501 $2,659
(1) Total assets at September 30, 2011 exclude assets of discontinued operations held for sale of $4 million.
JOB TITLE Meritor 10-K REVISION 3 SERIAL DATE / TIME Friday, November 30, 2012 JOB NUMBER 243020 TYPE PAGE NO. 114 OPERATOR PM2
<12345678>

115
MERITOR, INC.
NOTES TO CONSOLIDATED FINANCIAL STATEMENTS — (Continued)
Sales to AB Volvo represented approximately 22 percent, 24 percent and 21 percent of the company’s sales in each of fiscal years 2012, 2011 and 2010, respectively. Sales to Daimler AG represented approximately 15 percent, 11 percent and 9 percent of the company’s sales in fiscal years 2012, 2011 and 2010, respectively. Sales to Navistar International Corporation represented approximately 11 percent of the company’s sales in each of the fiscal years 2012, 2011 and 2010. No other customer comprised 10 percent or more of the company’s sales in any of the three fiscal years ended September 30, 2012.
24. QUARTERLY FINANCIAL INFORMATION (UNAUDITED)
The following is a condensed summary of the company’s unaudited quarterly results of continuing operations for fiscal years 2012 and 2011. Per share amounts are based on the weighted average shares outstanding for that quarter. Earnings per share for the year may not equal the sum of the four fiscal quarters’ earnings per share due to changes in basic and diluted shares outstanding.
2012 Fiscal Quarters (Unaudited)
First Second Third Fourth 2012
(In millions, except share related data)
Sales . . . . . . . . . . . . . . . . . . . . . . . . . . . . . . . . . . . . . . . . . . . . . $ 1,159 $ 1,160 $1,113 $ 986 $ 4,418Cost of sales. . . . . . . . . . . . . . . . . . . . . . . . . . . . . . . . . . . . . . . . (1,053) (1,026) (981) (873) (3,933)Gross margin . . . . . . . . . . . . . . . . . . . . . . . . . . . . . . . . . . . . . . . 106 134 132 113 485Provision for income taxes. . . . . . . . . . . . . . . . . . . . . . . . . . . . . . (20) (17) (12) (7) (56)Net income (loss) . . . . . . . . . . . . . . . . . . . . . . . . . . . . . . . . . . . . (18) 24 51 6 63Net income (loss) from continuing operations attributable to
Meritor, Inc. . . . . . . . . . . . . . . . . . . . . . . . . . . . . . . . . . . . . . (13) 29 50 4 70Net income (loss) attributable to Meritor, Inc. . . . . . . . . . . . . . . . . (22) 20 49 5 52Basic income (loss) per share from continuing operations . . . . . . . $ (0.13) $ 0.30 $ 0.51 $0.04 $ 0.73Diluted income (loss) per share from continuing operations . . . . . . $ (0.13) $ 0.30 $ 0.51 $0.04 $ 0.72
The company recognized restructuring costs in its continuing operations during fiscal year 2012 as follows: $24 million in the first quarter, $3 million in the second quarter, $3 million in the third quarter and $9 million in the fourth quarter (see Note 5). Net income for the first quarter includes a $3 million non-operating gain related to the sale of the company’s remaining ownership interest in Gabriel India, Ltd. Net income in the third quarter included a gain on sale of property of 16 million (see Note 7). During the fourth quarter of fiscal year 2012, the company recognized $18 million charge associated with the valuation and remeasurement of asbestos-related liabilities (see Note 22).
2011 Fiscal Quarters (Unaudited)
First Second Third Fourth 2011
(In millions, except share related data)
Sales . . . . . . . . . . . . . . . . . . . . . . . . . . . . . . . . . . . . . . . . . . . . $ 957 $ 1,176 $ 1,272 $ 1,217 $ 4,622Cost of sales. . . . . . . . . . . . . . . . . . . . . . . . . . . . . . . . . . . . . . . (852) (1,058) (1,137) (1,099) (4,146)Gross margin . . . . . . . . . . . . . . . . . . . . . . . . . . . . . . . . . . . . . . 105 118 135 118 476Provision for income taxes. . . . . . . . . . . . . . . . . . . . . . . . . . . . . (20) (21) (28) (8) (77)Net income. . . . . . . . . . . . . . . . . . . . . . . . . . . . . . . . . . . . . . . . 2 22 22 34 80Net income (loss) from continuing operations attributable to
Meritor, Inc. . . . . . . . . . . . . . . . . . . . . . . . . . . . . . . . . . . . . (6) 6 27 38 65Net income (loss) attributable to Meritor, Inc. . . . . . . . . . . . . . . . (2) 17 17 31 63Basic income (loss) per share from continuing operations . . . . . . $(0.07) $ 0.07 $ 0.29 $ 0.40 $ 0.69Diluted income (loss) per share from continuing operations . . . . . $(0.07) $ 0.06 $ 0.29 $ 0.40 $ 0.67
JOB TITLE Meritor 10-K REVISION 3 SERIAL DATE / TIME Friday, November 30, 2012 JOB NUMBER 243020 TYPE PAGE NO. 115 OPERATOR PM2
<12345678>

116
MERITOR, INC.
NOTES TO CONSOLIDATED FINANCIAL STATEMENTS — (Continued)
The company recognized restructuring costs in its continuing operations during fiscal year 2011 as follows: $3 million in the first quarter, $5 million in the second quarter, $7 million in the third quarter and $7 million in the fourth quarter (see Note 5). Net income in the second quarter included an after-tax gain on sale of businesses of $19 million. In addition, the company recorded restructuring costs associated with its discontinued operations of $6 million and $2 million during the second and fourth quarters, respectively, in connection with the closure of EU Trailer business. During the third quarter, the company recognized a $5 million non-operating gain in continuing operations on the collection of a note receivable related to a previously sold business (see Note 7).
25. OPERATING CASH FLOWS AND OTHER SUPPLEMENTAL FINANCIAL INFORMATION
Year Ended September 30,
2012 2011 2010
OPERATING ACTIVITIES Net income. . . . . . . . . . . . . . . . . . . . . . . . . . . . . . . . . . . . . . . . . . . . . . . . . . . . . . . . . . . . . . $ 63 $ 80 $ 26Less: loss from discontinued operations, net of tax . . . . . . . . . . . . . . . . . . . . . . . . . . . . . . . . . (18) (2) (2)
Income from continuing operations . . . . . . . . . . . . . . . . . . . . . . . . . . . . . . . . . . . . . . . . . . 81 82 28Adjustments to income from continuing operations to arrive at
cash provided by operating activities: Depreciation and amortization . . . . . . . . . . . . . . . . . . . . . . . . . . . . . . . . . . . . . . . . . . . . 63 66 69Deferred income tax expense (benefit) . . . . . . . . . . . . . . . . . . . . . . . . . . . . . . . . . . . . . . 13 25 (16)Restructuring costs. . . . . . . . . . . . . . . . . . . . . . . . . . . . . . . . . . . . . . . . . . . . . . . . . . . . 39 22 6Loss on debt extinguishment, net . . . . . . . . . . . . . . . . . . . . . . . . . . . . . . . . . . . . . . . . . — — 13Equity in earnings of affiliates . . . . . . . . . . . . . . . . . . . . . . . . . . . . . . . . . . . . . . . . . . . . (52) (70) (48)Stock compensation expense . . . . . . . . . . . . . . . . . . . . . . . . . . . . . . . . . . . . . . . . . . . . 6 7 7Provision for doubtful accounts . . . . . . . . . . . . . . . . . . . . . . . . . . . . . . . . . . . . . . . . . . . 2 3 5Pension and retiree medical expense . . . . . . . . . . . . . . . . . . . . . . . . . . . . . . . . . . . . . . . 53 71 81Gain on sale of property . . . . . . . . . . . . . . . . . . . . . . . . . . . . . . . . . . . . . . . . . . . . . . . . (16) — —
Dividends received from equity method investments . . . . . . . . . . . . . . . . . . . . . . . . . . . . . . 47 45 11Pension and retiree medical contributions . . . . . . . . . . . . . . . . . . . . . . . . . . . . . . . . . . . . . (140) (71) (114)Restructuring payments . . . . . . . . . . . . . . . . . . . . . . . . . . . . . . . . . . . . . . . . . . . . . . . . . . (22) (13) (14)Proceeds from terminations of interest rate swaps . . . . . . . . . . . . . . . . . . . . . . . . . . . . . . . — — 7Interest proceeds on note receivable . . . . . . . . . . . . . . . . . . . . . . . . . . . . . . . . . . . . . . . . . — — 12Changes in off-balance sheet receivable securitization and factoring programs . . . . . . . . . . (24) 144 63Changes in assets and liabilities, excluding effects of acquisitions, divestitures,
foreign currency adjustments and discontinued operations: Receivables . . . . . . . . . . . . . . . . . . . . . . . . . . . . . . . . . . . . . . . . . . . . . . . . . . . . . . . . . 150 (259) (174)Inventories . . . . . . . . . . . . . . . . . . . . . . . . . . . . . . . . . . . . . . . . . . . . . . . . . . . . . . . . . . 5 (96) (63)Accounts payable . . . . . . . . . . . . . . . . . . . . . . . . . . . . . . . . . . . . . . . . . . . . . . . . . . . . . (118) 178 180Other current assets and liabilities . . . . . . . . . . . . . . . . . . . . . . . . . . . . . . . . . . . . . . . . . (22) (21) 117Other assets and liabilities. . . . . . . . . . . . . . . . . . . . . . . . . . . . . . . . . . . . . . . . . . . . . . . 24 (15) (23)
Operating cash flows provided by continuing operations . . . . . . . . . . . . . . . . . . . . . . . . . . . 89 98 147Operating cash flows provided by (used for) discontinued operations . . . . . . . . . . . . . . . . . . (12) (57) 64
CASH PROVIDED BY OPERATING ACTIVITIES . . . . . . . . . . . . . . . . . . . . . . . . . . . . . . . . . . . . $ 77 $ 41 $ 211
JOB TITLE Meritor 10-K REVISION 3 SERIAL DATE / TIME Friday, November 30, 2012 JOB NUMBER 243020 TYPE PAGE NO. 116 OPERATOR PM2
<12345678>

117
MERITOR, INC.
NOTES TO CONSOLIDATED FINANCIAL STATEMENTS — (Continued)
September 30,
2012 2011 2010
(In millions)
Balance sheet data: Allowance for doubtful accounts . . . . . . . . . . . . . . . . . . . . . . . . . . . . . . . . . . . . . . . . . . . . . . $ 7 $ 5 $ 6
Statement of operations data: Maintenance and repairs expense . . . . . . . . . . . . . . . . . . . . . . . . . . . . . . . . . . . . . . . . . . . . . 44 51 43Research, development and engineering expense . . . . . . . . . . . . . . . . . . . . . . . . . . . . . . . . . . 73 73 66Depreciation expense . . . . . . . . . . . . . . . . . . . . . . . . . . . . . . . . . . . . . . . . . . . . . . . . . . . . . . 59 61 65Rental expense. . . . . . . . . . . . . . . . . . . . . . . . . . . . . . . . . . . . . . . . . . . . . . . . . . . . . . . . . . . 20 19 15Interest income. . . . . . . . . . . . . . . . . . . . . . . . . . . . . . . . . . . . . . . . . . . . . . . . . . . . . . . . . . . 2 3 7Interest expense . . . . . . . . . . . . . . . . . . . . . . . . . . . . . . . . . . . . . . . . . . . . . . . . . . . . . . . . . . (97) (98) (113)
Statement of cash flows data:Interest payments . . . . . . . . . . . . . . . . . . . . . . . . . . . . . . . . . . . . . . . . . . . . . . . . . . . . . . . . . 83 85 101Income tax payments, net of refunds . . . . . . . . . . . . . . . . . . . . . . . . . . . . . . . . . . . . . . . . . . . 51 45 45Non-cash investing activities - capital asset additions . . . . . . . . . . . . . . . . . . . . . . . . . . . . . . . 19 13 6
26. SUBSEQUENT EVENTS
On November 12, 2012, the company announced a revised management reporting structure resulting in two business segments: Commercial Truck & Industrial; and Aftermarket & Trailer. The company will evaluate the impact of this revised reporting structure on its segment financial reporting in the first quarter of fiscal year 2013.
On November 13, 2012, the company announced a global restructuring plan intended to reduce labor and other costs in response to market conditions. As part of these actions the company expects to eliminate 425 hourly and salaried positions (see Note 5). The company also announced the consolidation of its remanufacturing operations in the Aftermarket & Trailer segment resulting in the closure of one remanufacturing plant in Canada. The company expects to incur approximately $18 million of restructuring costs in relation to these programs.
27. SUPPLEMENTAL GUARANTOR CONDENSED CONSOLIDATING FINANCIAL STATEMENTS
Certain of the company’s wholly-owned subsidiaries, as defined in the credit agreement (the Guarantors) irrevocably and unconditionally guarantee amounts outstanding under the senior secured revolving credit facility. Similar subsidiary guarantees were provided for the benefit of the holders of the publicly-held notes outstanding under the company’s indentures (see Note 15).
In lieu of providing separate audited financial statements for the Guarantors, the company has included the accompanying condensed consolidating financial statements. These condensed consolidating financial statements are presented on the equity method. Under this method, the investments in subsidiaries are recorded at cost and adjusted for the parent’s share of the subsidiary’s cumulative results of operations, capital contributions and distributions and other equity changes. The Guarantor subsidiaries are combined in the condensed consolidating financial statements.
JOB TITLE Meritor 10-K REVISION 3 SERIAL DATE / TIME Friday, November 30, 2012 JOB NUMBER 243020 TYPE PAGE NO. 117 OPERATOR PM2
<12345678>

118
MERITOR, INC.
NOTES TO CONSOLIDATED FINANCIAL STATEMENTS — (Continued)
CONDENSED CONSOLIDATING STATEMENT OF INCOME (In millions)
Fiscal Year Ended September 30, 2012
Parent Guarantors Non-Guarantors Elims Consolidated
SalesExternal . . . . . . . . . . . . . . . . . . . . . . . . . . . . . . . . . . . . . . $ — $ 1,698 $ 2,720 $ — $ 4,418Subsidiaries . . . . . . . . . . . . . . . . . . . . . . . . . . . . . . . . . . . — 148 85 (233) —
Total sales . . . . . . . . . . . . . . . . . . . . . . . . . . . . . . . . . . . . . . — 1,846 2,805 (233) 4,418Cost of sales. . . . . . . . . . . . . . . . . . . . . . . . . . . . . . . . . . . . . (50) (1,596) (2,520) 233 (3,933)GROSS MARGIN. . . . . . . . . . . . . . . . . . . . . . . . . . . . . . . . . . (50) 250 285 — 485
Selling, general and administrative. . . . . . . . . . . . . . . . . . . (75) (101) (109) — (285)Restructuring costs. . . . . . . . . . . . . . . . . . . . . . . . . . . . . . — — (39) — (39)Gain on sale of property . . . . . . . . . . . . . . . . . . . . . . . . . . — — 16 — 16Other operating expense . . . . . . . . . . . . . . . . . . . . . . . . . . (2) — (2) — (4)
OPERATING INCOME (LOSS). . . . . . . . . . . . . . . . . . . . . . . . . (127) 149 151 — 173Other income (expense), net . . . . . . . . . . . . . . . . . . . . . . . 42 27 (62) — 7Equity in earnings of affiliates . . . . . . . . . . . . . . . . . . . . . . — 34 18 — 52Interest income (expense), net . . . . . . . . . . . . . . . . . . . . . . (121) 23 3 — (95)
INCOME (LOSS) BEFORE INCOME TAXES . . . . . . . . . . . . . . . (206) 233 110 — 137Provision for income taxes. . . . . . . . . . . . . . . . . . . . . . . . . — (5) (51) — (56)Equity income from continuing operations of subsidiaries . . . 276 33 — (309) —
INCOME FROM CONTINUING OPERATIONS . . . . . . . . . . . . . . 70 261 59 (309) 81LOSS FROM DISCONTINUED OPERATIONS, net of tax . . . . . . (18) $ (6) $ — $ 6 $ (18)NET INCOME . . . . . . . . . . . . . . . . . . . . . . . . . . . . . . . . . . . . 52 255 59 (303) 63Less: Income attributable to noncontrolling interests . . . . . . . . — — (11) — (11)
NET INCOME ATTRIBUTABLE TO MERITOR, INC.. . . . . . . . . . $ 52 $ 255 $ 48 $(303) $ 52
JOB TITLE Meritor 10-K REVISION 3 SERIAL DATE / TIME Friday, November 30, 2012 JOB NUMBER 243020 TYPE PAGE NO. 118 OPERATOR PM2
<12345678>

119
MERITOR, INC.
NOTES TO CONSOLIDATED FINANCIAL STATEMENTS — (Continued)
CONDENSED CONSOLIDATING STATEMENT OF INCOME (In millions)
Fiscal Year Ended September 30, 2011
Parent Guarantors Non-Guarantors Elims Consolidated
Sales External . . . . . . . . . . . . . . . . . . . . . . . . . . . . . . . . . . . . . . $ — $ 1,513 $ 3,109 $ — $ 4,622Subsidiaries . . . . . . . . . . . . . . . . . . . . . . . . . . . . . . . . . . . — 144 81 (225) —
Total sales . . . . . . . . . . . . . . . . . . . . . . . . . . . . . . . . . . . . . . — 1,657 3,190 (225) 4,622Cost of sales. . . . . . . . . . . . . . . . . . . . . . . . . . . . . . . . . . . . . (58) (1,513) (2,800) 225 (4,146)GROSS MARGIN. . . . . . . . . . . . . . . . . . . . . . . . . . . . . . . . . . (58) 144 390 — 476
Selling, general and administrative. . . . . . . . . . . . . . . . . . . (87) (82) (109) — (278)Restructuring costs. . . . . . . . . . . . . . . . . . . . . . . . . . . . . . (6) — (16) — (22)Other operating expense . . . . . . . . . . . . . . . . . . . . . . . . . . (2) — — — (2)
OPERATING INCOME (LOSS). . . . . . . . . . . . . . . . . . . . . . . . . (153) 62 265 — 174Other income (expense), net . . . . . . . . . . . . . . . . . . . . . . . 37 27 (54) — 10Equity in earnings of affiliates . . . . . . . . . . . . . . . . . . . . . . — 38 32 — 70Interest income (expense), net . . . . . . . . . . . . . . . . . . . . . . (121) 27 (1) — (95)
INCOME (LOSS) BEFORE INCOME TAXES . . . . . . . . . . . . . . . (237) 154 242 — 159Benefit (provision) for income taxes . . . . . . . . . . . . . . . . . . — 9 (86) — (77)Equity income from continuing operations of subsidiaries . . 302 125 — (427) —
INCOME FROM CONTINUING OPERATIONS . . . . . . . . . . . . . . 65 288 156 (427) 82INCOME (LOSS) FROM DISCONTINUED OPERATIONS,
net of tax . . . . . . . . . . . . . . . . . . . . . . . . . . . . . . . . . . . . . (2) $ 24 $ 28 $ (52) $ (2)Net income. . . . . . . . . . . . . . . . . . . . . . . . . . . . . . . . . . . . . . 63 312 184 (479) 80Less: Net income attributable to noncontrolling interests . . . . . — — (17) — (17)
NET INCOME ATTRIBUTABLE TO MERITOR, INC.. . . . . . . . . . $ 63 $ 312 $ 167 $(479) $ 63
JOB TITLE Meritor 10-K REVISION 3 SERIAL DATE / TIME Friday, November 30, 2012 JOB NUMBER 243020 TYPE PAGE NO. 119 OPERATOR PM2
<12345678>

120
MERITOR, INC.
NOTES TO CONSOLIDATED FINANCIAL STATEMENTS — (Continued)
CONDENSED CONSOLIDATING STATEMENT OF INCOME (In millions)
Fiscal Year Ended September 30, 2010
Parent Guarantors Non-Guarantors Elims Consolidated
Sales External . . . . . . . . . . . . . . . . . . . . . . . . . . . . . . . . . . . . . . . $ — $ 1,365 $ 2,165 $ — $ 3,530Subsidiaries . . . . . . . . . . . . . . . . . . . . . . . . . . . . . . . . . . . . — 120 66 (186) —
Total sales . . . . . . . . . . . . . . . . . . . . . . . . . . . . . . . . . . . . . . . — 1,485 2,231 (186) 3,530Cost of sales. . . . . . . . . . . . . . . . . . . . . . . . . . . . . . . . . . . . . . (55) (1,279) (1,957) 186 (3,105)GROSS MARGIN. . . . . . . . . . . . . . . . . . . . . . . . . . . . . . . . . . . (55) 206 274 — 425
Selling, general and administrative. . . . . . . . . . . . . . . . . . . . (110) (76) (95) — (281)Restructuring costs. . . . . . . . . . . . . . . . . . . . . . . . . . . . . . . — — (6) — (6)Other operating expense . . . . . . . . . . . . . . . . . . . . . . . . . . . (3) — (3) — (6)
OPERATING INCOME (LOSS). . . . . . . . . . . . . . . . . . . . . . . . . . (168) 130 170 — 132Other income (expense), net . . . . . . . . . . . . . . . . . . . . . . . . — 18 (16) — 2Equity in earnings of affiliates . . . . . . . . . . . . . . . . . . . . . . . — 22 26 — 48Interest income (expense), net . . . . . . . . . . . . . . . . . . . . . . . (121) 38 (23) — (106)
INCOME (LOSS) BEFORE INCOME TAXES . . . . . . . . . . . . . . . . (289) 208 157 — 76Provision for income taxes. . . . . . . . . . . . . . . . . . . . . . . . . . — (6) (42) — (48)Equity income from continuing operations of subsidiaries . . . 303 93 — (396) —
INCOME FROM CONTINUING OPERATIONS . . . . . . . . . . . . . . . 14 295 115 (396) 28INCOME (LOSS) FROM DISCONTINUED OPERATIONS,
net of tax . . . . . . . . . . . . . . . . . . . . . . . . . . . . . . . . . . . . . . (2) (18) 34 (16) (2)Net income. . . . . . . . . . . . . . . . . . . . . . . . . . . . . . . . . . . . . . . 12 277 149 (412) 26Less: Net income attributable to noncontrolling interests . . . . . . — — (14) — (14)
NET INCOME ATTRIBUTABLE TO MERITOR, INC.. . . . . . . . . . . $ 12 $ 277 $ 135 $(412) $ 12
JOB TITLE Meritor 10-K REVISION 3 SERIAL DATE / TIME Friday, November 30, 2012 JOB NUMBER 243020 TYPE PAGE NO. 120 OPERATOR PM2
<12345678>

121
MERITOR, INC.
NOTES TO CONSOLIDATED FINANCIAL STATEMENTS — (Continued)
CONDENSED CONSOLIDATING BALANCE SHEET (In millions)
September 30, 2012
Parent Guarantors Non-Guarantors Elims Consolidated
CURRENT ASSETSCash and cash equivalents . . . . . . . . . . . . . . . . . $ 91 $ 3 $ 163 $ — $ 257Receivables, trade and other, net. . . . . . . . . . . . . — 35 507 — 542Inventories . . . . . . . . . . . . . . . . . . . . . . . . . . . . . — 183 255 — 438Other current assets . . . . . . . . . . . . . . . . . . . . . . 6 20 35 — 61
TOTAL CURRENT ASSETS . . . . . . . . . . . . . . . 97 241 960 — 1,298NET PROPERTY . . . . . . . . . . . . . . . . . . . . . . . . . . . 12 143 262 — 417GOODWILL. . . . . . . . . . . . . . . . . . . . . . . . . . . . . . . — 275 158 — 433OTHER ASSETS . . . . . . . . . . . . . . . . . . . . . . . . . . . 70 176 107 — 353INVESTMENTS IN SUBSIDIARIES . . . . . . . . . . . . . . 1,468 85 — (1,553) —
TOTAL ASSETS . . . . . . . . . . . . . . . . . . . . . . . $ 1,647 $ 920 $1,487 $ (1,553) $ 2,501
CURRENT LIABILITIESShort-term debt . . . . . . . . . . . . . . . . . . . . . . . . . $ 10 $ 1 $ 7 $ — $ 18Accounts payable . . . . . . . . . . . . . . . . . . . . . . . . 49 195 453 — 697Other current liabilities . . . . . . . . . . . . . . . . . . . . 96 62 155 — 313
TOTAL CURRENT LIABILITIES . . . . . . . . . . . . . 155 258 615 — 1,028LONG-TERM DEBT . . . . . . . . . . . . . . . . . . . . . . . . . 1,039 3 — — 1,042RETIREMENT BENEFITS . . . . . . . . . . . . . . . . . . . . . 950 — 125 — 1,075INTERCOMPANY PAYABLE (RECEIVABLE) . . . . . . . . 445 (1,053) 608 — —OTHER LIABILITIES. . . . . . . . . . . . . . . . . . . . . . . . . 81 185 72 — 338EQUITY (DEFICIT) ATTRIBUTABLE TO
MERITOR, INC.. . . . . . . . . . . . . . . . . . . . . . . . . . (1,023) 1,527 26 (1,553) (1,023)NONCONTROLLING INTERESTS . . . . . . . . . . . . . . . — — 41 — 41
TOTAL LIABILITIES AND EQUITY (DEFICIT) . . . $ 1,647 $ 920 $1,487 $ (1,553) $ 2,501
JOB TITLE Meritor 10-K REVISION 3 SERIAL DATE / TIME Friday, November 30, 2012 JOB NUMBER 243020 TYPE PAGE NO. 121 OPERATOR PM2
<12345678>

122
MERITOR, INC.
NOTES TO CONSOLIDATED FINANCIAL STATEMENTS — (Continued)
CONDENSED CONSOLIDATING BALANCE SHEET (In millions)
September 30, 2011
Parent Guarantors Non-Guarantors Elims Consolidated
CURRENT ASSETS Cash and cash equivalents . . . . . . . . . . . . . . . . $ 92 $ 4 $ 121 $ — $ 217Receivables, trade and other, net. . . . . . . . . . . . 1 24 687 — 712Inventories . . . . . . . . . . . . . . . . . . . . . . . . . . . . — 181 279 — 460Other current assets . . . . . . . . . . . . . . . . . . . . . 6 17 47 — 70
TOTAL CURRENT ASSETS . . . . . . . . . . . . . . 99 226 1,134 — 1,459NET PROPERTY . . . . . . . . . . . . . . . . . . . . . . . . . . 9 138 274 — 421GOODWILL. . . . . . . . . . . . . . . . . . . . . . . . . . . . . . — 275 156 — 431OTHER ASSETS . . . . . . . . . . . . . . . . . . . . . . . . . . 44 179 129 — 352INVESTMENTS IN SUBSIDIARIES . . . . . . . . . . . . . 1,265 154 — (1,419 ) —
TOTAL ASSETS . . . . . . . . . . . . . . . . . . . . . . $ 1,417 $ 972 $1,693 $(1,419 ) $ 2,663
CURRENT LIABILITIES Short-term debt . . . . . . . . . . . . . . . . . . . . . . . . $ 84 $ — $ — $ — $ 84Accounts payable . . . . . . . . . . . . . . . . . . . . . . . 52 225 564 — 841Other current liabilities . . . . . . . . . . . . . . . . . . . 92 67 169 — 328
TOTAL CURRENT LIABILITIES . . . . . . . . . . . . 228 292 733 — 1,253LONG-TERM DEBT . . . . . . . . . . . . . . . . . . . . . . . . 942 — 8 — 950RETIREMENT BENEFITS . . . . . . . . . . . . . . . . . . . . 953 — 143 — 1,096INTERCOMPANY PAYABLE (RECEIVABLE) . . . . . . . 202 (820) 618 — —OTHER LIABILITIES. . . . . . . . . . . . . . . . . . . . . . . . 87 165 73 — 325NONCONTROLLING INTERESTS . . . . . . . . . . . . . . — — 34 — 34EQUITY (DEFICIT) ATTRIBUTABLE TO
MERITOR, INC.. . . . . . . . . . . . . . . . . . . . . . . . . (995) 1,335 84 (1,419) (995)
TOTAL LIABILITIES AND EQUITY (DEFICIT) . . . $ 1,417 $ 972 $1,693 $(1,419 ) $ 2,663
JOB TITLE Meritor 10-K REVISION 3 SERIAL DATE / TIME Friday, November 30, 2012 JOB NUMBER 243020 TYPE PAGE NO. 122 OPERATOR PM2
<12345678>

123
MERITOR, INC.
NOTES TO CONSOLIDATED FINANCIAL STATEMENTS — (Continued)
CONDENSED CONSOLIDATING STATEMENT OF CASH FLOWS (In millions)
Fiscal Year Ended September 30, 2012
Parent Guarantors Non-Guarantors Elims Consolidated
CASH FLOWS PROVIDED BY (USED FOR) OPERATING ACTIVITIES. . . . . . . . . . . . . . . . . . . . . . . . . . . . . . . . . . . . . $ (13) 31 59 $ — $ 77
INVESTING ACTIVITIES Capital expenditures . . . . . . . . . . . . . . . . . . . . . . . . . . . . . . (3) (33) (53) — (89)Proceeds from sale of property . . . . . . . . . . . . . . . . . . . . . . — — 18 — 18Other investing activities . . . . . . . . . . . . . . . . . . . . . . . . . . . — 1 2 — 3
Net cash flows used for discontinued operations. . . . . . . . . . — — 28 — 28
CASH USED FOR INVESTING ACTIVITIES. . . . . . . . . . . . . . . . . (3) (32) (5) — (40)FINANCING ACTIVITIES
Proceeds from debt issuance . . . . . . . . . . . . . . . . . . . . . . . 100 — — — 100Repayment of notes and term loan. . . . . . . . . . . . . . . . . . . . (86) — — — (86)Debt issuance costs . . . . . . . . . . . . . . . . . . . . . . . . . . . . . . (12) — — — (12)Intercompany advances. . . . . . . . . . . . . . . . . . . . . . . . . . . . 13 — (13) — —
CASH PROVIDED BY (USED FOR) FINANCING ACTIVITIES . . . . . 15 — (13) — 2EFFECT OF FOREIGN CURRENCY EXCHANGE
RATES ON CASH AND CASH EQUIVALENTS . . . . . . . . . . . . — — 1 — 1
CHANGE IN CASH AND CASH EQUIVALENTS. . . . . . . . . . . . . . (1) (1) 42 — 40
CASH AND CASH EQUIVALENTS AT BEGINNING OF YEAR . . . . 92 4 121 — 217
CASH AND CASH EQUIVALENTS AT END OF YEAR . . . . . . . . . $ 91 $ 3 $163 $ — $ 257
JOB TITLE Meritor 10-K REVISION 3 SERIAL DATE / TIME Friday, November 30, 2012 JOB NUMBER 243020 TYPE PAGE NO. 123 OPERATOR PM2
<12345678>

124
MERITOR, INC.
NOTES TO CONSOLIDATED FINANCIAL STATEMENTS — (Continued)
CONDENSED CONSOLIDATING STATEMENT OF CASH FLOWS (In millions)
Fiscal Year Ended September 30, 2011
Parent Guarantors Non-Guarantors Elims Consolidated
CASH FLOWS PROVIDED BY (USED FOR) OPERATING ACTIVITIES. . . . . . . . . . . . . . . . . . . . . . . . . . . . . . . . . . . . . $ 211 $ 33 $(203) $ — $ 41
INVESTING ACTIVITIES Capital expenditures . . . . . . . . . . . . . . . . . . . . . . . . . . . . . . (3) (42) (60) — (105)Other investing activities . . . . . . . . . . . . . . . . . . . . . . . . . . . — 2 — — 2Net cash flows provided by (used for)
discontinued operations . . . . . . . . . . . . . . . . . . . . . . . . . (18) 5 (56) — (69)CASH USED FOR INVESTING ACTIVITIES. . . . . . . . . . . . . . . . . (21) (35) (116) — (172)
FINANCING ACTIVITIES Other financing cash flows . . . . . . . . . . . . . . . . . . . . . . . . . 6 — — — 6Intercompany advances. . . . . . . . . . . . . . . . . . . . . . . . . . . . (151) — 151 — —
CASH PROVIDED BY (USED FOR) FINANCING ACTIVITIES . . . . (145) — 151 — 6EFFECT OF FOREIGN CURRENCY EXCHANGE
RATES ON CASH AND CASH EQUIVALENTS . . . . . . . . . . . . — — (1) — (1)
CHANGE IN CASH AND CASH EQUIVALENTS. . . . . . . . . . . . . . 45 (2) (169) — (126)
CASH AND CASH EQUIVALENTS AT BEGINNING OF YEAR . . . . 47 6 290 — 343
CASH AND CASH EQUIVALENTS AT END OF YEAR . . . . . . . . . $ 92 $ 4 $ 121 $— $ 217
JOB TITLE Meritor 10-K REVISION 3 SERIAL DATE / TIME Friday, November 30, 2012 JOB NUMBER 243020 TYPE PAGE NO. 124 OPERATOR PM2
<12345678>

125
MERITOR, INC.
NOTES TO CONSOLIDATED FINANCIAL STATEMENTS — (Continued)
CONDENSED CONSOLIDATING STATEMENT OF CASH FLOWS (In millions)
Fiscal Year Ended September 30, 2010
Parent Guarantors Non-Guarantors Elims Consolidated
CASH FLOWS PROVIDED BY (USED FOR) OPERATING ACTIVITIES. . . . . . . . . . . . . . . . . . . . . . . . . . . . . . . . . . . . . $(176 ) $ 19 $ 368 $ — $ 211
INVESTING ACTIVITIES Capital expenditures . . . . . . . . . . . . . . . . . . . . . . . . . . . . . . (4) (19) (32) — (55)Other investing activities . . . . . . . . . . . . . . . . . . . . . . . . . . . — — 5 — 5Net cash flows provided by discontinued operations . . . . . . . — — (14) — (14)
CASH USED FOR INVESTING ACTIVITIES. . . . . . . . . . . . . . . . . (4 ) (19) (41) — (64)
FINANCING ACTIVITIES Payments on account receivable securitization program . . . . — — (83) — (83)Payments on revolving credit facility, net . . . . . . . . . . . . . . . (28 ) — — — (28)Proceeds from debt and stock issuance . . . . . . . . . . . . . . . . 454 — — — 454Issuance and debt extinguishment costs . . . . . . . . . . . . . . . (45) — — — (45)Repayment of notes . . . . . . . . . . . . . . . . . . . . . . . . . . . . . . (193) — — — (193)Borrowings (payments) on lines of credit and other . . . . . . . . (2) — 7 — 5Intercompany advances. . . . . . . . . . . . . . . . . . . . . . . . . . . . 35 — (35) — —Other financing activities . . . . . . . . . . . . . . . . . . . . . . . . . . . (1) — — — (1)Net financing cash flows used for
discontinued operations . . . . . . . . . . . . . . . . . . . . . . . . . — — (12) — (12)CASH PROVIDED BY (USED FOR) FINANCING ACTIVITIES . . . . 220 — (123) — 97EFFECT OF FOREIGN CURRENCY EXCHANGE
RATES ON CASH AND CASH EQUIVALENTS . . . . . . . . . . . . — — 4 — 4
CHANGE IN CASH AND CASH EQUIVALENTS. . . . . . . . . . . . . . 40 — 208 — 248
CASH AND CASH EQUIVALENTS AT BEGINNING OF YEAR . . . . 7 6 82 — 95
CASH AND CASH EQUIVALENTS AT END OF YEAR . . . . . . . . . $ 47 $ 6 $ 290 $ — $ 343
JOB TITLE Meritor 10-K REVISION 3 SERIAL DATE / TIME Friday, November 30, 2012 JOB NUMBER 243020 TYPE PAGE NO. 125 OPERATOR PM2
<12345678>

126
Item 9. Changes in and Disagreements with Accountants on Accounting and Financial Disclosure.
None.
Item 9A. Controls and Procedures.
Disclosure Controls and Procedures
As required by Rule 13a-15 under the Securities Exchange Act of 1934 (the “Exchange Act”), management, with the participation of the chief executive officer and chief financial officer, evaluated the effectiveness of our disclosure controls and procedures as of September 30, 2012. Based upon that evaluation, the chief executive officer and the chief financial officer have concluded that, as of September 30, 2012, our disclosure controls and procedures were effective to ensure that information required to be disclosed in the reports we file or submit under the Exchange Act is recorded, processed, summarized and reported within the time periods specified in the SEC’s rules and forms and to ensure that information required to be disclosed by us in the reports we file or submit is accumulated and communicated to management, including the Chief Executive Officer and Chief Financial Officer, as appropriate to allow timely decisions regarding required disclosure.
Management Report on Internal Control over Financial Reporting
Meritor’s management is responsible for establishing and maintaining adequate internal control over financial reporting for the company, as defined in Rules 13a-15(f) and 15d-15(f) under the Exchange Act. Meritor’s internal control system is designed to provide reasonable assurance regarding the reliability of financial reporting and the preparation of financial statements for external purposes, in accordance with accounting principles generally accepted in the United States of America.
All internal control systems, no matter how well designed, have inherent limitations and may not prevent or detect misstatements. Also, projections of any evaluation of effectiveness to future periods are subject to the risk that controls may become inadequate because of changes in conditions, or that the degree of compliance with the policies or procedures may deteriorate.
Meritor’s management, with the participation of the chief executive officer and chief financial officer, evaluated the effectiveness of its internal control over financial reporting as of September 30, 2012. This evaluation was based on the criteria set forth in Internal Control – Integrated Framework issued by the Committee of Sponsoring Organizations of the Treadway Commission (“COSO”). Based on management’s evaluation and the criteria set forth by COSO, Meritor’s management concluded that the internal control over financial reporting maintained by the company, as of September 30, 2012, was effective.
Deloitte & Touche LLP, Meritor’s independent registered public accounting firm, has issued an attestation report on Meritor’s internal control over financial reporting, which follows.
JOB TITLE Meritor 10-K REVISION 3 SERIAL DATE / TIME Friday, November 30, 2012 JOB NUMBER 243020 TYPE PAGE NO. 126 OPERATOR PM2
<12345678>

127
REPORT OF INDEPENDENT REGISTERED PUBLIC ACCOUNTING FIRM
To the Board of Directors and Shareowners of Meritor, Inc. Troy, Michigan
We have audited the internal control over financial reporting of Meritor, Inc. and subsidiaries (the “Company”) as of September 30, 2012, based on criteria established in Internal Control — Integrated Framework issued by the Committee of Sponsoring Organizations of the Treadway Commission. The Company’s management is responsible for maintaining effective internal control over financial reporting and for its assessment of the effectiveness of internal control over financial reporting, included in the accompanying Management Report on Internal Control over Financial Reporting. Our responsibility is to express an opinion on the Company’s internal control over financial reporting based on our audit.
We conducted our audit in accordance with the standards of the Public Company Accounting Oversight Board (United States). Those standards require that we plan and perform the audit to obtain reasonable assurance about whether effective internal control over financial reporting was maintained in all material respects. Our audit included obtaining an understanding of internal control over financial reporting, assessing the risk that a material weakness exists, testing and evaluating the design and operating effectiveness of internal control based on the assessed risk, and performing such other procedures as we considered necessary in the circumstances. We believe that our audit provides a reasonable basis for our opinion.
A company’s internal control over financial reporting is a process designed by, or under the supervision of, the company’s principal executive and principal financial officers, or persons performing similar functions, and effected by the company’s board of directors, management, and other personnel to provide reasonable assurance regarding the reliability of financial reporting and the preparation of financial statements for external purposes in accordance with generally accepted accounting principles. A company’s internal control over financial reporting includes those policies and procedures that (1) pertain to the maintenance of records that, in reasonable detail, accurately and fairly reflect the transactions and dispositions of the assets of the company; (2) provide reasonable assurance that transactions are recorded as necessary to permit preparation of financial statements in accordance with generally accepted accounting principles, and that receipts and expenditures of the company are being made only in accordance with authorizations of management and directors of the company; and (3) provide reasonable assurance regarding prevention or timely detection of unauthorized acquisition, use, or disposition of the company’s assets that could have a material effect on the financial statements.
Because of the inherent limitations of internal control over financial reporting, including the possibility of collusion or improper management override of controls, material misstatements due to error or fraud may not be prevented or detected on a timely basis. Also, projections of any evaluation of the effectiveness of the internal control over financial reporting to future periods are subject to the risk that the controls may become inadequate because of changes in conditions, or that the degree of compliance with the policies or procedures may deteriorate.
In our opinion, the Company maintained, in all material respects, effective internal control over financial reporting as of September 30, 2012, based on the criteria established in Internal Control — Integrated Framework issued by the Committee of Sponsoring Organizations of the Treadway Commission.
We have also audited, in accordance with the standards of the Public Company Accounting Oversight Board (United States), the consolidated financial statements and financial statement schedule listed in the Index at Item 15(a)(2) as of and for the year ended September 30, 2012 of the Company and our report dated November 21, 2012 expressed an unqualified opinion on those consolidated financial statements and financial statement schedule.
/s/ DELOITTE & TOUCHE LLP DELOITTE & TOUCHE LLP
Detroit, Michigan November 21, 2012
Changes in Internal Control Over Financial Reporting
Management, with the participation of the chief executive officer and chief financial officer, has evaluated any change in our internal control over financial reporting (as such term is defined in Rules 13a-15(f) and 15d-15(f) under the Exchange Act) during the fiscal quarter ended September 30, 2012, and found no change that has materially affected or is reasonably likely to materially affect our internal control over financial reporting.
Item 9B. Other Information.
None.
JOB TITLE Meritor 10-K REVISION 3 SERIAL DATE / TIME Friday, November 30, 2012 JOB NUMBER 243020 TYPE PAGE NO. 127 OPERATOR PM2
<12345678>

128
PART III
Item 10. Directors, Executive Officers and Corporate Governance.
The information required by Item 10 regarding directors is incorporated by reference from the information under the caption Election of Directors – Information as to Nominees for Director and Continuing Directors in Meritor’s definitive Proxy Statement for its 2013 Annual Meeting (the “2013 Proxy Statement”), which will be filed within 120 days after Meritor’s fiscal year end. The information required by Item 10 regarding executive officers is set forth in Item 4A of Part I of this Form 10-K. The other information required by Item 10, including regarding the audit committee, audit committee financial expert disclosure and our code of ethics, is incorporated by reference from the information under the captions Code of Ethics, Board of Directors and Committees and Director Qualifications and Nominating Procedures in the 2013 Proxy Statement. Disclosure of delinquent Section 16 filers pursuant to Item 405 of Regulation S-K will not be contained in the 2013 Proxy Statement to the best of registrant’s knowledge.
Item 11. Executive Compensation.
See the information under the captions Director Compensation and Executive Compensation in the 2013 Proxy Statement.
Item 12. Security Ownership of Certain Beneficial Owners and Management and Related Stockholder Matters.
Security Ownership of Certain Beneficial Owners and Management
See the information under the captions Voting Securities and Ownership by Management of Equity Securities in the 2013 Proxy Statement.
Securities Authorized for Issuance under Equity Compensation Plans
The number of stock options outstanding under our equity compensation plans, the weighted average exercise price of outstanding options, and the number of securities remaining available for issuance, as of September 30, 2012, were as follows:
Plan Category
(column a) Number of securities
to be issued upon exercise of outstanding options, warrants and
rights (1)
(column b) Weighted average exercise price of
outstanding options, warrants and rights
(column c) Number of securities remaining available for future issuance
under equity compensation plans (excluding securities
reflected in column a)
Equity compensation plans approved by security holders. . . 579,617 $15.17 2,405,058Equity compensation plans not approved by
security holders (2) . . . . . . . . . . . . . . . . . . . . . . . . . . . 72,000 15.61Total. . . . . . . . . . . . . . . . . . . . . . . . . . . . . . . . . . . . . . . . . 651,617 15.22 2,405,058
In addition to stock options, shares of Common Stock, restricted shares of Common Stock, restricted share units and performance shares have been awarded under the Company’s equity compensation plans and were outstanding at September 30, 2012.
All of our equity compensation plans under which grants are outstanding, except the Employee Stock Benefit Plan, were approved by the shareholders of Meritor or by the shareholders of Meritor or Arvin prior to their merger into Meritor. The Employee Stock Benefit Plan was adopted by the Arvin board of directors in 1998 and was terminated in January 2007. It was intended to provide compensation arrangements that would attract, retain and reward key non-officer employees and to provide these employees with a proprietary interest in the company. This Plan provided for the issuance of incentive awards to non-officer employees in the form of stock options, tandem or non-tandem stock appreciation rights, restricted shares of Common Stock, performance shares or performance units. For further information, see the Plan document, which is filed as Exhibit 10-j to this Annual Report on Form 10-K.
JOB TITLE Meritor 10-K REVISION 3 SERIAL DATE / TIME Friday, November 30, 2012 JOB NUMBER 243020 TYPE PAGE NO. 128 OPERATOR PM2
<12345678>

129
The table includes options granted under Arvin’s 1988 Stock Benefit Plan, 1998 Stock Benefit Plan and Employee Stock Benefit Plan, which we assumed in 2000 in connection with the merger of Arvin and Meritor. A total of 3,118,255 options, with a weighted average exercise price of $28.10, were assumed at the time of the merger.
The following number of shares remained available for issuance under our equity compensation plans at September 30, 2012. Grants under these plans may be in the form of any of the listed types of awards.
Plan Number of shares Type of award
2010 Long-Term Incentive Plan* 2,328,342 Stock options, stock appreciation rights, stock awards and other stock-based awards
* The 2010 Long-Term Incentive Plan was approved by the Company’s shareowners on January 28, 2010. At that time, the 2007 Long-Term Incentive Plan and the 2004 Directors Stock Plan were terminated and no further awards will be made under those plans and no stock awards will be made under the Incentive Compensation Plan. On January 20, 2011, the Company’s shareowners approved an amendment to the 2010 Long-Term Incentive Plan to increase the maximum number of shares that may be granted under the plan. The 2007 Long-Term Incentive Plan was approved by the company’s shareowners on January 26, 2007. At that time, the 1997 Long-Term Incentives Plan, 1998 Stock Benefit Plan and Employee Stock Benefit Plan were terminated, and no further awards will be made under these plans.
Item 13. Certain Relationships and Related Transactions, and Director Independence.
See the information under the captions Board of Directors and Committees and Certain Relationships and Related Transactions in the 2013 proxy Statement.
Item 14. Principal Accountant Fees and Services.
INDEPENDENT ACCOUNTANTS’ FEES
During the last two fiscal years, Deloitte & Touche LLP billed Meritor and its subsidiaries the following fees for its services:
Fiscal Year Ending September 30,
2012 2011
Audit fees (a) . . . . . . . . . . . . . . . . . . . . . . . . . . . . . . . . . . $ 4,931,000 $ 5,110,000Audit-related fees (b). . . . . . . . . . . . . . . . . . . . . . . . . . . . . 24,000 70,000Tax fees (c). . . . . . . . . . . . . . . . . . . . . . . . . . . . . . . . . . . . 1,069,000 1,369,000
TOTAL . . . . . . . . . . . . . . . . . . . . . . . . . . . . . . . . . . . . . $ 6,024,000 $ 6,549,000
(a) Includes fees related to compliance with Section 404 of the Sarbanes-Oxley Act of 2002.
(b) Audit related fees are primarily comprised of Exchange Act filings for fiscal years 2012 and 2011.
(c) Includes fees for tax consulting and compliance.
Pursuant to its charter, the Audit Committee is responsible for selection, approving compensation and overseeing the independence, qualifications and performance of the independent accountants. The Audit Committee’s policy is to pre-approve all audit and permissible non-audit services provided by the independent accountants. Pre-approval is generally provided for up to one year, is detailed as to the particular service or category of services and is generally subject to a specific budget. The Audit Committee may also pre-approve particular services on a case-by-case basis. In assessing requests for services by the independent accountants, the Audit Committee considers whether such services are consistent with the auditor’s independence; whether the independent accountants are likely to provide the most effective and efficient service based upon their familiarity with the Company; and whether the service could enhance the Company’s ability to manage or control risk or improve audit quality.
All of the audit-related, tax and other services provided by Deloitte in fiscal years 2011 and 2012 (described in the footnotes to the table above) and related fees were approved in advance by the Audit Committee.
JOB TITLE Meritor 10-K REVISION 3 SERIAL DATE / TIME Friday, November 30, 2012 JOB NUMBER 243020 TYPE PAGE NO. 129 OPERATOR PM2
<12345678>

130
PART IV
Item 15. Exhibits and Financial Statement Schedules.
(a) Financial Statements, Financial Statement Schedules and Exhibits.
(1) Financial Statements (all financial statements listed below are those of the company and its consolidated subsidiaries):
Consolidated Statement of Income, years ended September 30, 2012, 2011 and 2010.
Consolidated Balance Sheet, September 30, 2012 and 2011.
Consolidated Statement of Cash Flows, years ended September 30, 2012, 2011 and 2010.
Consolidated Statement of Shareowners’ Equity (Deficit), years ended September 30, 2012, 2011 and 2010.
Notes to Consolidated Financial Statements.
Report of Independent Registered Public Accounting Firm.
(2) Financial Statement Schedule for the years ended September 30, 2012, 2011 and 2010.
Page
Schedule II - Valuation and Qualifying Accounts . . . . . . . . . . . . . . . . . . . . . . . . S-1
Schedules not filed with this Annual Report on Form 10-K are omitted because of the absence of conditions under which they are required or because the information called for is shown in the financial statements or related notes.
(3) Exhibits
3-a Restated Articles of Incorporation of Meritor, filed as Exhibit 4.01 to Meritor’s Registration Statement on Form S-4, as amended (Registration Statement No. 333-36448) (“Form S-4”), is incorporated by reference.
3-a-1 Articles of Amendment of Restated Articles of Incorporation of the Company filed as Exhibit 3-a-1 to the Company’s Quarterly Report on Form 10-Q for the quarterly period ended April 3, 2011, in incorporated by reference.
3-b By-laws of Meritor, filed as Exhibit 3 to Meritor’s Quarterly Report on Form 10-Q for the quarterly period ended June 29, 2003 (File No. 1-15983), is incorporated by reference.
4-a Indenture, dated as of April 1, 1998, between Meritor and The Bank of New York Mellon Trust Company, N.A. (as successor to BNY Midwest Trust Company as successor to The Chase Manhattan Bank), as trustee, filed as Exhibit 4 to Meritor’s Registration Statement on Form S-3 (Registration No. 333- 49777), is incorporated herein by reference.
4-b First Supplemental Indenture, dated as of July 7, 2000, to the Indenture, dated as of April 1, 1998, between Meritor and The Bank of New York Mellon Trust Company, N.A. (as successor to BNY Midwest Trust Company as successor to The Chase Manhattan Bank), as trustee, filed as Exhibit 4-b-1 to Meritor’s Annual Report on Form 10-K for the fiscal year ended September 30, 2000 (File No. 1-15983) (“2000 Form 10-K”), is incorporated herein by reference.
4-b-1 Third Supplemental Indenture, dated as of June 23, 2006, to the Indenture, dated as of April 1, 1998, between Meritor and The Bank of New York Mellon Trust Company, N.A. (as successor to BNY Midwest Trust Company as successor to The Chase Manhattan Bank), as trustee (including Subsidiary Guaranty dated as of June 23, 2006), filed as Exhibit 4.2 to Meritor’s Current Report on Form 8-K, dated June 23, 2006 and filed on June 27, 2006 (File No. 1-15983) (“June 23, 2006 Form 8-K”), is incorporated herein by reference.
4-b-2 Fourth Supplemental Indenture, dated as of March 3, 2010, to the Indenture, dated as of April 1, 1998, between Meritor and The Bank of New York Mellon Trust Company, N.A. (as successor to BNY Midwest Trust Company as successor to The Chase Manhattan Bank), as trustee (including form of the Company’s 10.625% Notes due 2018 and form of subsidiary guaranty), filed as Exhibit 4 to Meritor’s Form 8-K filed on March 3, 2010 is incorporated herein by reference.
JOB TITLE Meritor 10-K REVISION 3 SERIAL DATE / TIME Friday, November 30, 2012 JOB NUMBER 243020 TYPE PAGE NO. 130 OPERATOR PM2
<12345678>

131
4-c Indenture dated as of July 3, 1990, as supplemented by a First Supplemental Indenture dated as of March 31, 1994, between Meritor and The Bank of New York Mellon Trust Company, N.A. (as successor to BNY Midwest Trust Company as successor to Harris Trust and Savings Bank), as trustee, filed as Exhibit 4-4 to Arvin’s Registration Statement on Form S-3 (Registration No. 33-53087), is incorporated herein by reference.
4-c-1 Second Supplemental Indenture, dated as of July 7, 2000, to the Indenture dated as of July 3, 1990, between Meritor and The Bank of New York Mellon Trust Company, N.A. (as successor to BNY Midwest Trust Company as successor to Harris Trust and Savings Bank), as trustee, filed as Exhibit 4-c-1 to the 2000 Form 10-K, is incorporated herein by reference.
4-c-2 Fourth Supplemental Indenture, dated as of June 23, 2006, to the Indenture, dated as of July 3, 1990, between Meritor and The Bank of New York Mellon Trust Company, N.A. (as successor to BNY Midwest Trust Company as successor to Harris Trust and Savings Bank), as trustee (including Subsidiary Guaranty dated as of June 23, 2006), filed as Exhibit 4.3 to the June 23, 2006 Form 8-K, is incorporated herein by reference.
4-d Indenture, dated as of March 7, 2006, between Meritor and The Bank of New York Mellon Trust Company, N.A. (as successor to BNY Midwest Trust Company), as trustee, filed as Exhibit 4.1 to Meritor’s Current Report on Form 8-K, dated March 7, 2006 and filed on March 9, 2006 (File No. 1-15983), is incorporated herein by reference.
4-d-1 First Supplemental Indenture, dated as of June 23, 2006, to the Indenture, dated as of March 7, 2006, between Meritor and The Bank of New York Mellon Trust Company, N.A. (as successor to BNY Midwest Trust Company), as trustee (including Subsidiary Guaranty dated as of June 23, 2006), filed as Exhibit 4.1 to the June 23, 2006 Form 8-K, is incorporated herein by reference.
4-e Indenture, dated as of February 8, 2007, between Meritor and The Bank of New York Mellon Trust Company, N.A. (as successor to The Bank of New York Trust Company, N.A.), as trustee (including form of Subsidiary Guaranty dated as of February 8, 2007), filed as Exhibit 4-a to Meritor’s Quarterly Report on Form 10-Q for the quarterly period ended April 1, 2007 (File No. 1-15983), is incorporated herein by reference.
10-a Credit Agreement, dated as of June 23, 2006, by and among Meritor, Meritor Finance Ireland, the institutions from time to time parties thereto as lenders, JP Morgan Chase Bank, National Association, as Administrative Agent, Citicorp North America, Inc. and UBS Securities LLC, as Syndication Agents, ABN AMRO Bank N.V., BNP Paribas and Lehman Commercial Paper Inc., as Documentation Agents, and J.P. Morgan Securities Inc. and Citigroup Global Markets, as Joint Lead Arrangers and Joint Book Runners, filed as Exhibit 10.1 to the June 23, 2006 Form 8-K, is incorporated herein by reference.
10-a-1 Amendment and Restatement Agreement relating to Amended and Restated Credit Agreement, dated as of April 23, 2012, among Meritor, AFI, the financial institutions party thereto and JPMorgan Chase Bank, National Association, as Administrative Agent, filed as Exhibit 10a to Meritor’s Report on Form 8-K filed on April 24, 2012, is incorporated herein by reference.
10-a-2 Amended and Restated Subsidiary Guaranty, dated as of April 23, 2012, by and among the subsidiary guarantors and JPMorgan Chase Bank, National Association, as Administrative Agent, filed as Exhibit 10b to Meritor’s Report on Form 8-K filed on April 24, 2012, is incorporated herein by reference.
10-a-3 Amended and Restated Pledge and Security Agreement, dated as of April 23, 2012, by and among Meritor, the subsidiaries named therein and JPMorgan Chase Bank, National Association, as Administrative Agent, filed as Exhibit 10c to Meritor’s Report on Form 8-K filed on April 24, 2012, is incorporated herein by reference
*10-b-1 1997 Long-Term Incentives Plan, as amended and restated, filed as Exhibit 10 to Meritor’s Current Report on Form 8-K dated and filed on April 20, 2005 (File No. 1-15983), is incorporated herein by reference.
*10-b-2 Form of Option Agreement under the 1997 Long-Term Incentives Plan, filed as Exhibit 10(a) to Meritor’s Quarterly Report on Form 10-Q for the quarterly period ended March 31, 1998 (File No. 1-13093), is incorporated herein by reference.
*10-b-3 Description of Performance Goals for fiscal year 2013 Established in connection with Cash Performance Plans under Long Term Incentive Plans.
*10-b-4 Description of Annual Incentive Goals Established for Fiscal year 2013 under the Incentive Compensation Plan.
JOB TITLE Meritor 10-K REVISION 3 SERIAL DATE / TIME Friday, November 30, 2012 JOB NUMBER 243020 TYPE PAGE NO. 131 OPERATOR PM2
<12345678>

132
*10-b-5 Description of Performance Goals established in connection with 2010-2012 Cash Performance Plan, filed as Exhibit 10-b to Current Report on Form 8-K filed on November 12, 2009 is incorporated herein by reference.
*10-c 2007 Long-Term Incentive Plan, as amended, filed as Exhibit 10-a to Meritor’s Quarterly Report on Form 10-Q for the quarterly period ended April 1, 2007 (File No. 1-15983), is incorporated herein by reference.
*10-c-1 Form of Restricted Stock Agreement under the 2007 Long-Term Incentive Plan, filed as Exhibit 10-c-1 to Meritor’s Annual Report on Form 10-K for the fiscal year ended September 30, 2007 is incorporated herein by reference.
*10-d Description of Compensation of Non-Employee Directors.
*10-e 2004 Directors Stock Plan, filed as Exhibit 10-a to Meritor’s Quarterly Report on Form 10-Q for the quarterly period ended March 28, 2004 (File No. 1-15983), is incorporated herein by reference.
*10-e-1 Form of Restricted Share Unit Agreement under the 2004 Directors Stock Plan, filed as Exhibit 10-c-3 to Meritor’s Annual Report on Form 10-K for the fiscal year ended October 3, 2004 (File No. 1-15983), is incorporated herein by reference.
*10-e-2 Form of Restricted Stock Agreement under the 2004 Directors Stock Plan, filed as Exhibit 10-c-4 to Meritor’s Annual Report on Form 10-K for the fiscal year ended October 2, 2005 (Filed No. 1-15983), is incorporated herein by reference.
*10-e-3 Option Agreement under the 2007 Long-Term Incentive Plan between Meritor and Charles G. McClure filed as Exhibit 10-c to Meritor’s Quarterly report on Form 10-Q for the quarterly period ended June 30, 2008 is incorporated herein by reference.
*10-e-4 Restricted Stock Agreement under the 2007 Long-term Incentive Plan between Meritor and Charles G. McClure filed as Exhibit 10-d to Meritor’s Quarterly Report on form 10-Q for the quarterly period ended June 30, 2008 is incorporated herein by reference.
*10-e-5 Letter Agreement, dated July 20, 2011, with former executive officer filed as Exhibit 10 to Meritor’s Report on Form 8-K dated and filed August 5, 2011, is incorporated herein by reference.
*10-e-6 Form of Restricted Stock Unit Agreement for Employees under 2010 Long-Term Incentive Plan filed as Exhibit 10.2 to Meritor’s Report on Form 10-Q for the fiscal quarter ended January 3, 2009 is incorporated herein by reference.
*10-e-7 Form of Restricted Stock Unit Agreement for Directors under 2010 Long-Term Incentive Plan filed as Exhibit 10.3 to Meritor’s Report on Form 10-Q for the fiscal quarter ended January 3, 2009 is incorporated herein by reference.
*10-e-8 Form of Restricted Stock Agreement for Directors under 2010 Long-term Incentive Plan filed as Exhibit 10.4 to Meritor’s Report on Form 10-Q for the fiscal quarter ended January 3, 2009 is incorporated herein by reference.
*10-e-9 2010 Long-Term Incentive Plan, as amended and Restated as of January 20, 2011, filed as Exhibit 10.d to Meritor’s Report on Form 10-Q for the fiscal quarter ended January 2, 2011 is incorporated herein by reference.
*10-f Incentive Compensation Plan, as amended and restated, filed as Exhibit 10.6 to Meritor’s Quarterly Report on Form 10-Q for the fiscal quarter ended December 31, 2010 is incorporated herein by reference.
*10-f-1 Form of Deferred Share Agreement, filed as Exhibit 10-a to Meritor’s Quarterly Report on Form 10-Q for the quarterly period ended January 2, 2005 (File No. 1-15983), is incorporated herein by reference.
*10-g Copy of resolution of the Board of Directors of Meritor, adopted on July 6, 2000, providing for its Deferred Compensation Policy for Non-Employee Directors, filed as Exhibit 10-f to the 2000 Form 10-K, is incorporated herein by reference.
*10-h Deferred Compensation Plan, filed as Exhibit 10-e-1 to Meritor’s Annual Report on Form 10-K for the fiscal year ended September 30, 1998 (File No. 1-13093), is incorporated herein by reference.
*10-i 1998 Stock Benefit Plan, as amended, filed as Exhibit (d)(2) to Meritor’s Schedule TO, Amendment No. 3 (File No. 5-61023), is incorporated herein by reference.
*10-j Employee Stock Benefit Plan, as amended, filed as Exhibit (d)(3) to Meritor’s Schedule TO, Amendment No. 3 (File No. 5-61023), is incorporated herein by reference.
JOB TITLE Meritor 10-K REVISION 3 SERIAL DATE / TIME Friday, November 30, 2012 JOB NUMBER 243020 TYPE PAGE NO. 132 OPERATOR PM2
<12345678>

133
10-k Receivables Purchase Agreement dated as of October 29, 2010, by and among ArvinMeritor Mascot, LLC, Meritor Heavy Vehicle Braking Systems (USA), Inc., Meritor Heavy Vehicle Systems, LLC, Viking Asset Purchaser No 7 IC, an incorporated cell of Viking Global Finance ICC, an incorporated cell company incorporated under the laws of Jersey, as purchaser, and Citicorp Trustee Company Limited, as programme trustee, filed as Exhibit 10-c to Meritor’s Current report on Form 8-K dated October 29, 2010 and filed November 2, 2010, is incorporated herein by reference.
10-l Amendment dated as of June 28, 2011 to Receivables Purchase Agreement dated as of October 29, 2010, by and among Meritor Heavy Vehicle Braking Systems (USA), Inc., Meritor Heavy Vehicle Systems, LLC and Meritor Aftermarket USA, LLC (formerly known as ArvinMeritor Mascot, LLC) as sellers, Viking Asset Purchaser No 7 IC, an incorporated cell of Viking Global Finance ICC, an incorporated cell company incorporated under the laws of Jersey, as purchaser, and Citicorp Trustee Company Limited, as programme trustee filed as exhibit 10-a to Meritor’s Form 10-Q for the quarter ended July 3, 2011 is incorporated herein by reference.
10-m Receivables Purchase Agreement dated as of June 28, 2011, by and among Meritor HVS A.B., as seller, Viking Asset Purchaser No 7 IC, an incorporated cell of Viking Global Finance ICC, an incorporated cell company incorporated under the laws of Jersey, as purchaser, and Citicorp Trustee Company Limited, as programme trustee filed as exhibit 10-b to Meritor’s Form 10-Q for the quarter ended July 3, 2011 is incorporated herein by reference.
10-m-1 Receivable Purchase Agreement dated March 15, 2012 between Meritor Heavy Vehicle Systems Cameri S.P.A. as Seller and Viking Asset Purchaser No. 7IC, an incorporated cell of Viking Global Finance ICC, as Purchaser and Citicorp Trustee Company Limited, as Programme Trustee filed as exhibit 10-a to Meritor’s Quarterly report on Form 10-Q for the period ended April 1, 2012, is incorporated herein by reference.
10-m-2 Receivable Purchase Agreement dated February 2, 2012 between Meritor Heavy Vehicle Braking Systems (UK) Limited as Seller and Viking Asset Purchaser No. 7IC, an incorporated cell of Viking Global Finance ICC, as Purchaser and Citicorp Trustee Company Limited, as Programme Trustee filed as exhibit 10-b to Meritor’s Quarterly report on Form 10-Q for the period ended April 1, 2012, is incorporated herein by reference.
10-m-3 Fourth Amended and Restated Purchase and Sale Agreement dated June 18, 2012 among Meritor Heavy Vehicle Braking Systems (USA), LLC, and Meritor Heavy Vehicle Systems, LLC, as originators, Meritor, Inc., as initial servicer, and ArvinMeritor Receivables Corporation, as Buyer, filed as Exhibit 10-a to the Quarterly Report on Form 10-Q for the period ended July 1, 2012, is incorporated herein by reference.
10-m-4 Receivables Purchase Agreement dated June 18, 2012 among ArvinMeritor Receivables Corporation, as Seller, Meritor, Inc., as initial servicer, the various Conduit Purchasers, Related Committed Purchasers, LC Participants and Purchaser Agents from time to time party thereto, and PNC Bank, National Association, as issuers of Letters of Credit and as Administrator filed as Exhibit 10-b to the Quarterly Report on Form 10-Q for the period ended July 1, 2012, is incorporated herein by reference.
10-m-5 Termination of Receivables Purchase Agreement dated June 18, 2012 between Meritor Heavy Vehicle Systems Cameri S.P.A., as Seller, and Viking Asset Purchaser No. 7IC, an incorporated cell of Viking Global Finance ICC, as Purchaser, and Citicorp Trustee Company Limited, as Programme Trustee filed as Exhibit 10-c to the Quarterly Report on Form 10-Q for the period ended July 1, 2012, is incorporated herein by reference.
10-m-6 Receivables Purchase Agreement dated June 18, 2012 between Meritor Heavy Vehicle Systems Cameri S.P.A., a company incorporated under the laws of Italy (the “Seller”) and Nordea Bank AB (pbl), a company incorporated under the laws of Sweden (the “Purchaser”) filed as Exhibit 10-d to the Quarterly Report on Form 10-Q for the period ended July 1, 2012, is incorporated herein by reference.
10-m-7 First Amendment dated as of December 6, 2010 to Purchase and Sale Agreement dated as of August 3, 2010 among Meritor France (as Seller), Meritor, Inc. (as Seller Guarantor) and 81 Acquisition LLC (as Buyer), filed as Exhibit 10 to Meritor’s Form 8-K dated December 6, 2010 and filed December 8, 2010, is incorporated herein by reference.
10-m-8 Second Amendment dated as of January 3, 2011 to Purchase and Sale Agreement dated as of August 3, 2010 among Meritor France (as Seller), Meritor, Inc. (as Seller Guarantor) and Inteva Products Holding Coöperatieve U.A., as assignee of 81 Acquisition LLC (as Buyer), as amended, filed as Exhibit 10 to Meritor’s Form 8-K dated and filed on January 3, 2011, is incorporated herein by reference.
JOB TITLE Meritor 10-K REVISION 3 SERIAL DATE / TIME Friday, November 30, 2012 JOB NUMBER 243020 TYPE PAGE NO. 133 OPERATOR PM2
<12345678>

134
10-m-9 Amendment No. 3 effective as of September 28, 2012 to the Receivables Purchase Agreement dated as of October 29, 2010, as amended (as so amended, the “Receivables Purchase Agreement), with an affiliate of Nordea Bank AB known as Viking Asset Purchaser No 7 IC, an incorporated cell of Viking Global Finance ICC, an incorporated cell company incorporated under the laws of Jersey, as purchaser (“Viking”), and Citicorp Trustee Company Limited, as programme trustee.
*10-n Employment agreement between the company and Charles G. McClure, Jr., dated as of September 14, 2009 filed as Exhibit 10.n to Meritor’s Form 10-K for the fiscal year ended September 27, 2009 is incorporated herein by reference.
*10-o Letter Agreement dated November 2, 2011 between Meritor, Inc. and Pedro Ferro filed as Exhibit 10-W-5 to Meritor’s Annual Report on Form 10-K for the fiscal year ended September 30,2011 is incorporated herein by reference.
*10-q Employment agreement between Meritor, Inc. and Carsten J. Reinhardt, dated as of September 14, 2009 filed as Exhibit 10-q to Meritor’s Form 10-K for the fiscal year ended September 27, 2009 is incorporated herein by reference.
*10-r Employment agreement, dated as of September 14, 2009, between Meritor, Inc. and Jeffrey A. Craig filed as Exhibit 10-r to Meritor’s Form 10-K for the fiscal year ended September 27, 2009 is incorporated herein by reference.
*10-s Employment agreement, dated as of September 14, 2009, between Meritor, Inc. and Vernon Baker filed as Exhibit 10-s to Meritor’s Form 10-K for the fiscal year ended September 27, 2009 is incorporated herein by reference.
*10-t Employment agreement, dated as of September 14, 2009, between Meritor, Inc. and Mary Lehmann filed as Exhibit 10-tto Meritor’s Form 10-K for the fiscal year ended September 27, 2009 is incorporated herein by reference.
*10-u Employment agreement, dated as of September 14, 2009, between Meritor, Inc. and Barbara Novak filed as Exhibit 10-v to Meritor’s Form 10-K for the fiscal year ended September 27, 2009 is incorporated herein by reference.
*10-w Form of employment letter between Meritor , Inc. and its executives, filed as Exhibit 10-a to Meritor’s Current Report on Form 8-K, dated September 14, 2009 and filed on September 18, 2009 (File No. 1-15983), is incorporated by reference.
*10-w-1 Letter Agreement dated as of July 1, 2010 between Meritor, Inc. and Larry Ott filed as Exhibit 10 to Meritor’s Quarterly Report on Form 10-Q for the fiscal quarter ended July 4, 2010 is incorporated herein by reference.
*10-w-2 Employment Agreement between Meritor, Inc. and Larry Ott dated as of August 3, 2010 filed as Exhibit 10-1 to Meritor’s Quarterly Report on Form 10-Q for the fiscal quarter ended July 4, 2010 is incorporated herein by reference.
*10-w-3 Employment Agreement between Meritor, Inc. and Timothy Bowes dated as of April 28, 2010 filed as Exhibit 10-1 to Meritor’s Quarterly Report on Form 10-Q for the fiscal quarter ended April 4, 2010 is incorporated herein by reference.
*10-w-4 Employment Agreement between Meritor, Inc. and Joseph Mejaly dated as of April 28, 2010 filed as Exhibit 10-2 to Meritor’s Quarterly Report on Form 10-Q for the fiscal quarter ended April 4, 2010 is incorporated herein by reference.
10-x Receivables Purchase Agreement dated November 19, 2007 between Meritor CVS Axles France and Viking Asset Purchaser and CitiCorp Trustee Company Limited, filed as Exhibit 10-t to Meritor’s Report on Form 10-K for the fiscal year ended September 30, 2008 is incorporated herein by reference.
10-y Receivables Purchase Agreement dated March 13, 2006 between Meritor HVS AB and Nordic Finance Limited and CitiCorp Trustee Company Limited filed as Exhibit 10-u to Meritor’s Report on Form 10-K for the fiscal year ended September 30, 2008 is incorporated herein by reference
10-z Amendment, dated July 25, 2007, to Receivables Purchase Agreement dated March 13, 2006 between Meritor HVS AB and Nordic Finance Limited and CitiCorp Trustee Company Limited filed as Exhibit 10-v to Meritor’s Report on Form 10-K for the fiscal year ended September 30, 2008 is incorporated herein by reference.
10-zz Purchase and Sale Agreement dated August 4, 2009 among Meritor, Iochpe-Maxion, S.A. and the other parties listed therein, filed as Exhibit 10 to Meritor’s Report on Form 10-Q for the Quarter ended June 28, 2009 is incorporated by reference.
JOB TITLE Meritor 10-K REVISION 3 SERIAL DATE / TIME Friday, November 30, 2012 JOB NUMBER 243020 TYPE PAGE NO. 134 OPERATOR PM2
<12345678>

135
12 Computation of ratio of earnings to fixed charges
21 List of Subsidiaries of Meritor, Inc.
23-a Consent of Vernon G. Baker, II, Esq., Senior Vice President and General Counsel
23-b Consent of Deloitte & Touche LLP, independent registered public accounting firm
23-c Consent of Bates White LLC
24 Power of Attorney authorizing certain persons to sign this Annual Report on Form 10-K on behalf of certain directors and officers of Meritor.
31-a Certification of the Chief Executive Officer pursuant to Rule 13a-14(a) under the Exchange Act.
31-b Certification of the Chief Financial Officer pursuant to Rule 13a-14(a) under the Exchange Act.
32-a Certification of the Chief Executive Officer pursuant to Rule 13a-14(b) under the Exchange Act and 18 U.S.C. Section 1350.
32-b Certification of the Chief Financial Officer pursuant to Rule 13a-14(b) under the Exchange Act and 18 U.S.C. Section 1350.
99-a Commitment and Acceptance, dated as of March 31, 2011, by and among Meritor, Inc. (formerly known as ArvinMeritor, Inc.), ArvinMeritor Finance Ireland (together with Meritor, Inc. the “Borrowers”), Deutsche Bank AG New York Branch, as Accepting Lender and JPMorgan Chase Bank, National Association, as Administrative Agent relating to that certain Credit Agreement, dated as of June 23, 2006 (as amended by Amendment No.1, Amendment No. 2, Amendment No. 3, Amendment No. 4, and Amendment No. 5 thereto) among the Borrowers, each lender from time to time a party thereto, and JP Morgan Chase Bank, National Association, as administrative agent filed as exhibit 99-a to Meritor’s Form 10-Q for the quarter ended April 3, 2011 is incorporated herein by reference.
99-b Commitment and Acceptance, dated as of April 13, 2011, by and among Meritor, Inc. (formerly known as ArvinMeritor, Inc.), ArvinMeritor Finance Ireland (together with Meritor, Inc. the “Borrowers”), The Huntington National Bank, as Accepting Lender and JPMorgan Chase Bank, National Association, as Administrative Agent relating to that certain Credit Agreement, dated as of June 23, 2006 (as amended by Amendment No.1, Amendment No. 2, Amendment No. 3, Amendment No. 4, Amendment No. 5 thereto and the Commitment and Acceptance dated as of March 31, 2011, relating to Deutsche Bank AG New York Branch becoming a Lender) among the Borrowers, each lender from time to time a party thereto, and JP Morgan Chase Bank, National Association, as administrative agent filed as exhibit 99-b to Meritor’s Form 10-Q for the quarter ended April 3, 2011 is incorporated herein by reference
99-c Third Amendment dated as of May 9, 2011 to Credit Agreement dated as of November 18, 2010 among Meritor, Inc. (formerly named ArvinMeritor, Inc.), Citicorp USA, Inc., as administrative agent and issuing bank, the other lenders party thereto, and the Bank of New York Mellon, as paying agent filed as exhibit 99-a to Meritor’s Form 10-Q for the quarter ended July 3, 2011 is incorporated herein by reference.
101.INS XBRL INSTANCE DOCUMENT
101.SCH XBRL TAXONOMY EXTENSION SCHEMA
101.PRE XBRL TAXONOMY EXTENSION PRESENTATION LINKBASE
101.LAB XBRL TAXONOMY EXTENSION LABEL LINKBASE
101.CAL XBRL TAXONOMY EXTENSION CALCULATION LINKBASE
101.DEF XBRL TAXONOMY EXTENSION DEFINITION LINKBASE
* Management contract or compensatory plan or arrangement.
JOB TITLE Meritor 10-K REVISION 3 SERIAL DATE / TIME Friday, November 30, 2012 JOB NUMBER 243020 TYPE PAGE NO. 135 OPERATOR PM2
<12345678>

136
SIGNATURESPursuant to the requirements of Section 13 or 15(d) of the Securities Exchange Act of 1934, the registrant has duly caused
this report to be signed on its behalf by the undersigned, thereunto duly authorized.
MERITOR, INC.
By: /s/ Vernon G. Baker, IIVernon G. Baker, IISenior Vice President and General Counsel
Date: November 21, 2012
Pursuant to the requirements of the Securities Exchange Act of 1934, this report has been signed below on the 21st day of November, 2012 by the following persons on behalf of the registrant and in the capacities indicated.
Charles G. McClure, Jr. * Chairman of the Board, Chief Executive Officer and President (principal executive officer) and Director
Joseph B. Anderson, Jr., Rhonda L. Brooks, DirectorsDavid W. Devonshire, Ivor J. Evans, Victoria B. Jackson, James E. Marley, William R. Newlin* Jeffrey A. Craig* Senior Vice President and Chief Financial Officer
Kevin Nowlan* Controller (principal accounting officer)
* By: /s/ Barbara NovakBarbara NovakAttorney-in-fact **
** By authority of powers of attorney filed herewith.
JOB TITLE Meritor 10-K REVISION 3 SERIAL DATE / TIME Friday, November 30, 2012 JOB NUMBER 243020 TYPE PAGE NO. 136 OPERATOR PM2
<12345678>
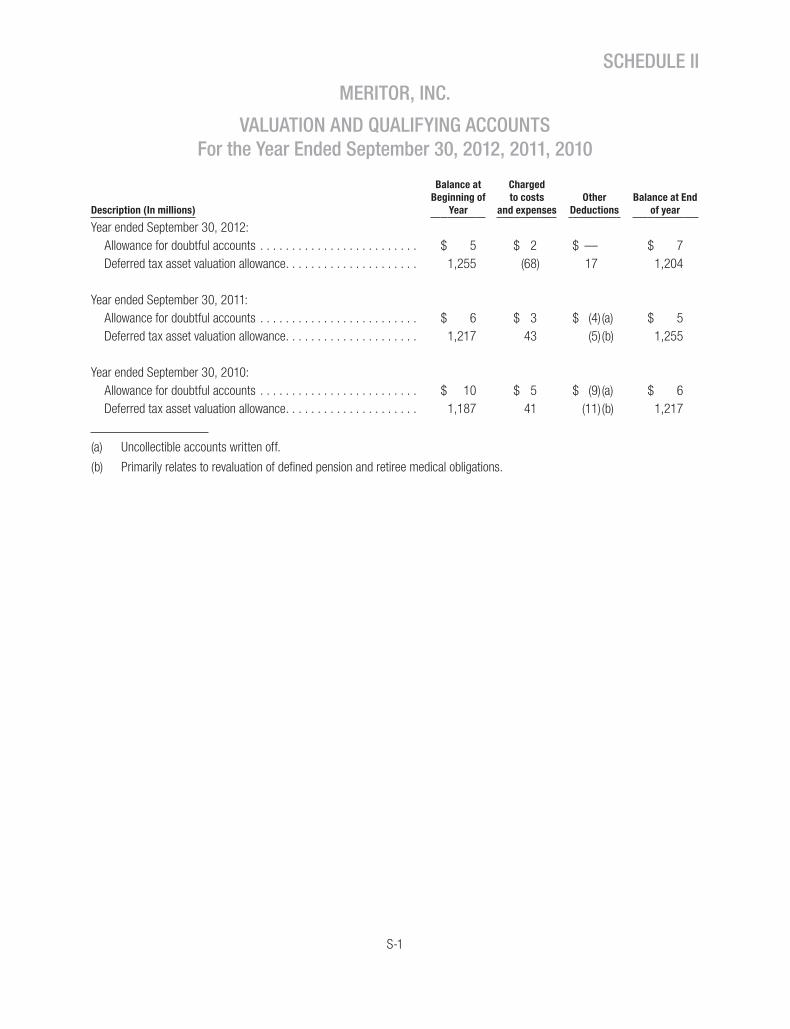
S-1
SCHEDULE II
MERITOR, INC.
VALUATION AND QUALIFYING ACCOUNTS For the Year Ended September 30, 2012, 2011, 2010
Description (In millions)
Balance at Beginning of
Year
Charged to costs
and expensesOther
DeductionsBalance at End
of year
Year ended September 30, 2012: Allowance for doubtful accounts . . . . . . . . . . . . . . . . . . . . . . . . . $ 5 $ 2 $ — $ 7Deferred tax asset valuation allowance. . . . . . . . . . . . . . . . . . . . . 1,255 (68) 17 1,204
Year ended September 30, 2011:Allowance for doubtful accounts . . . . . . . . . . . . . . . . . . . . . . . . . $ 6 $ 3 $ (4)(a) $ 5Deferred tax asset valuation allowance. . . . . . . . . . . . . . . . . . . . . 1,217 43 (5)(b) 1,255
Year ended September 30, 2010:Allowance for doubtful accounts . . . . . . . . . . . . . . . . . . . . . . . . . $ 10 $ 5 $ (9)(a) $ 6Deferred tax asset valuation allowance. . . . . . . . . . . . . . . . . . . . . 1,187 41 (11)(b) 1,217
(a) Uncollectible accounts written off.
(b) Primarily relates to revaluation of defined pension and retiree medical obligations.
JOB TITLE Meritor 10-K REVISION 3 SERIAL DATE / TIME Friday, November 30, 2012 JOB NUMBER 243020 TYPE PAGE NO. S-1 OPERATOR PM2
<12345678>

JOB TITLE Meritor 10-K REVISION 3 SERIAL DATE / TIME Friday, November 30, 2012 JOB NUMBER 243020 TYPE PAGE NO. S-2 OPERATOR PM2
<12345678>

JOB TITLE Meritor 10-K REVISION 3 SERIAL DATE / TIME Friday, November 30, 2012 JOB NUMBER 243020 TYPE PAGE NO. S-3 OPERATOR PM2
<12345678>

JOB TITLE Meritor 10-K REVISION 3 SERIAL DATE / TIME Friday, November 30, 2012 JOB NUMBER 243020 TYPE PAGE NO. S-4 OPERATOR PM2
<12345678>

JOB TITLE Meritor 10-K REVISION 3 SERIAL DATE / TIME Friday, November 30, 2012 JOB NUMBER 243020 TYPE PAGE NO. S-5 OPERATOR PM2
<12345678>

JOB TITLE Meritor 10-K REVISION 3 SERIAL DATE / TIME Friday, November 30, 2012 JOB NUMBER 243020 TYPE PAGE NO. S-6 OPERATOR PM2
<12345678>