job satisfaction and intent to remain in ... satisfaction and intent to remain in teaching of...
TRANSCRIPT

JOB SATISFACTION AND INTENT TO REMAIN IN TEACHING
OF GEORGIA BUSINESS EDUCATION TEACHERS
by
DIANNA DAY JOHNSON
(Under the Direction of Wanda L. Stitt-Gohdes)
ABSTRACT
Business education in Georgia has experienced a shortage of teachers for the past several
years. Some relief was realized due to the decline in the economy; however, a threat exists of
that shortage reemerging as the economy improves. The purpose of this study was to describe the
job satisfaction of business education teachers in Georgia’ s secondary public schools and
determine the relationship between job satisfaction and intent to remain in the profession. The
Minnesota Satisfaction Questionnaire was used to measure job satisfaction levels.
A systematic random sampling method was used to select participants from a list
provided by the State Department of Education of all business education teachers in Georgia.
Survey packets were sent to a sample of 594 secondary business education teachers in Georgia’s
public schools with a 49.3% rate of return (N=293). Dillman’s (2000) tailored design method
was used as a guide for this study.
This sample was predominately female (80%), married (78.6%), received their
certification through a traditional route (73%), held a master’s degree, and were an average age
of 43 years. Georgia’s secondary business education teachers e indicated a high level of general
job satisfaction (78.63). Many (43.3%) indicated they plan to retire as soon as they have taught
for 30 years. Over one-half (51.4%) intend to leave the profession within ten years. A Pearson
correlation matrix indicated that there was a statistically significant relationship between general
job satisfaction and salary. One-way ANOVAs comparing the intent to remain variable with the
individual intrinsic and extrinsic MSQ scales indicated that the groups varied on the abili ty
utili zation, achievement, advancement, and responsibili ty intrinsic scales. Extrinsic scales
indicating a statistically significant effect when compared with the intent to remain variable were
company/school policies and practices and working conditions..
INDEX WORDS: JOB SATISFACTION, TEACHER RETENTION, BUSINESS
EDUCATION TEACHERS, MINNESOTA SATISFACTION QUESTIONNAIRE, INTENT TO REMAIN

JOB SATISFACTION AND INTENT TO REMAIN IN TEACHING
OF GEORGIA BUSINESS EDUCATION TEACHERS
by
DIANNA DAY JOHNSON
B.S., The State University of West Georgia, 1986
M.Ed., The State University of West Georgia, 1998
A Dissertation Submitted to the Graduate Faculty of The University of Georgia in Partial
Fulfillment of the Requirements for the Degree
DOCTOR OF EDUCATION
ATHENS, GEORGIA
2004

© 2004
Dianna Day Johnson
All Rights Reserved

JOB SATISFACTION AND INTENT TO REMAIN IN TEACHING
OF GEORGIA BUSINESS EDUCATION TEACHERS
by
DIANNA DAY JOHNSON
Major Professor: Wanda L. Stitt-Gohdes
Committee: Helen Hall Karen Jones Jay Rojewski Myra Womble
Electronic Version Approved: Maureen Grasso Dean of the Graduate School The University of Georgia August 2004
iv
ACKNOWLEDGEMENTS
Completing this research project has been a group effort involving many people. I wish to
acknowledge and express sincere gratitude to those who were instrumental in the completion of
my research:
God, who lead me to this path and continued to stand by me until completion;
My wonderful husband, Gerald, for his support and encouragement throughout my
graduate study;
My stepson, Aaron, for getting off the Internet when I needed it;
Dr. Wanda Stitt-Gohdes, my Major Professor, for providing the guidance and
encouragement throughout this project;
Dr. Helen Hall, Dr. Karen Jones, Dr. Jay Rojewski, and Dr. Myra Womble, Committee
Members, for their time and support;
My family for their understanding when I was too busy to participate in family functions,
their love, support, and encouragement throughout this process;
My friends, Terry and Nancy Johnson, Scott and Jean Lehmann, and Bill and Denise
Debardelaben, Dr. Janet Teague, and their families, who continually encouraged me and showed
continued interest in this venture as I progressed (especially Nancy Johnson for the many trips to
the library to help carry books). Thanks for all the words of encouragement.

v
TABLE OF CONTENTS
Page
ACKNOWLEDGEMENTS........................................................................................................iv
LIST OF TABLES...................................................................................................................viii
CHAPTER
1 INTRODUCTION.....................................................................................................1
Purpose of the Study..............................................................................................4
Research Questions/Study Design..........................................................................5
Theoretical Framework..........................................................................................6
Significance of the Study.......................................................................................9
2 REVIEW OF LITERATURE AND RELATED RESEARCH..................................11
Job Satisfaction ...................................................................................................11
Maslow’s Hierchy of Needs.................................................................................11
Shaffer’s Job Satisfaction Theory ........................................................................12
Vroom’s Expectancy Theory ...............................................................................13
Theory of Work Adjustment ................................................................................13
Herzberg’ ’s Two-Factor Theory ..........................................................................16
Teacher Job Satisfaction......................................................................................17
Job Satisfaction of Business Educators................................................................19
Teacher Recruitment............................................................................................20
Alternative Certification ......................................................................................22

vi
Teacher Recruitment and Retention.....................................................................27
Feminization of the Career of Teaching ...............................................................34
Teacher Shortage .................................................................................................37
Summary.............................................................................................................40
3 METHODS AND PROCEDURES..........................................................................41
Introduction.........................................................................................................41
Survey Research..................................................................................................41
Population and Sample Selection.........................................................................44
Instrumentation....................................................................................................48
Personal Data Questionnaire................................................................................53
Data Collection Procedures..................................................................................54
Data Analysis Procedures....................................................................................55
4 ANALYSIS OF DATA............................................................................................57
Job Satisfaction ...................................................................................................57
Personal and Professional Variables ....................................................................59
Intent to Remain..................................................................................................60
5 CONCLUSIONS AND RECOMMENDATIONS....................................................66
Conclusions.........................................................................................................68
Discussion...........................................................................................................70
Recommendations...............................................................................................71
REFERENCES.........................................................................................................................75

vii
APPENDICES..........................................................................................................................88
A REQUEST TO USE THE MINNESOTA SATISFACTION QUESTIONNAIRE89
B MSQ NORMATIVE DATA FOR TEACHERS...................................................97
C PERSONAL DATA QUESTIONNAIRE ..........................................................100
D IRB APPROVAL FORM ..................................................................................102
E COVER LETTER..............................................................................................104
F FOLLOW-UP COVER LETTER ......................................................................106
G POSTCARD FOLLOW-UP REMINDER..........................................................108
viii
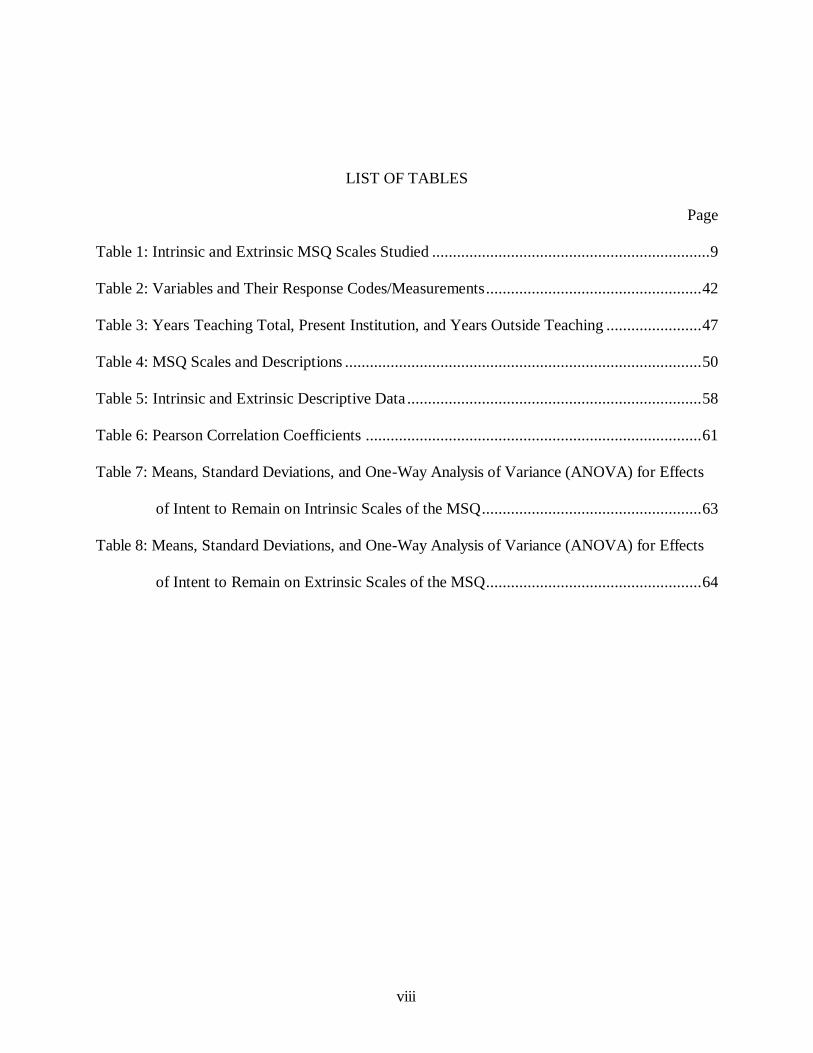
LIST OF TABLES
Page
Table 1: Intrinsic and Extrinsic MSQ Scales Studied ...................................................................9
Table 2: Variables and Their Response Codes/Measurements....................................................42
Table 3: Years Teaching Total, Present Institution, and Years Outside Teaching .......................47
Table 4: MSQ Scales and Descriptions......................................................................................50
Table 5: Intrinsic and Extrinsic Descriptive Data.......................................................................58
Table 6: Pearson Correlation Coeff icients .................................................................................61
Table 7: Means, Standard Deviations, and One-Way Analysis of Variance (ANOVA) for Effects
of Intent to Remain on Intrinsic Scales of the MSQ.....................................................63
Table 8: Means, Standard Deviations, and One-Way Analysis of Variance (ANOVA) for Effects
of Intent to Remain on Extrinsic Scales of the MSQ....................................................64

CHAPTER 1
INTRODUCTION
Job satisfaction has been a topic of interest to business leaders in hopes of improving job
production for decades. Job satisfaction can be defined as the degree to which a person’s work
fulfill s the individual’s needs (Dawis &Lofquist, 1984). The idea is that the more satisfied a
worker is with his or her work, the more focused he or she will be on producing more work and
receiving that feeling of satisfaction. “Each of us strives towards some goals more persistently
than towards others” based on the perceived amount of satisfaction the goal will provide (Beck,
2000, p. 31). Courses of action are chosen based on the potential to provide the greatest value or
the most satisfaction. Teachers choose to stay in the profession or leave it based on an individual
perception of the level of satisfaction continuing to teach will provide compared with other
opportunities. “We look to the future, at the potential outcomes of choosing different possible
courses of action” (Beck, 2000, p. 26).
Our nation is faced with an increasing shortage of teachers. Trapps (2001) expected the
nationwide shortfall to reach 2 milli on teachers by 2011. This shortage results from a
combination of retiring teachers, increasing student enrollment, and switching professions
(Riley, 1999). With this shortage comes the challenge of recruiting quality teachers. In recent
years, the teaching profession has experienced a low retention rate, with new teachers dropping
out of the profession at a rate of 50% by the end of their first five years (Bobek, 2002; Coeyman,
Jonsson, Teicher, & Wiltenburg, 2001; Hope, 1999; National Commission on Teaching and
America’s Future, 2003). “Many schools have not been able to retain the teachers they do hire”

2
(Coeyman et al., 2001, p. 1). Teachers are leaving the classroom to pursue other careers within
three to five years of entering the education field (Darling-Hammond, 2001; Dawson, 2001;
Ingersoll, 2002). This revolving door effect has led to an increased need to not only recruit new
teachers, but to retain those new teachers and veteran teachers as well .
Due to the teacher shortage in Georgia, the Georgia Student Finance Commission
expanded the HOPE Scholarship Program to include the HOPE Teacher Scholarship. The HOPE
Teacher Scholarship is designed to help recruit potential teachers by paying for their education in
return for years of service after degree completion. Despite this effort, shortages persist in many
content areas including business education. The scholarship program is limi ted to fields
identified as critical shortage fields such as science, math, English as a second language (ESOL),
and special education (Georgia Student Finance Commission, 2002). The Georgia HOPE
scholarship program has also implemented a program to pay for graduate work to enable teachers
to seek advanced degrees and to all ow persons interested in teaching to complete teacher
preparation programs and earn professional certification while teaching.
Age, gender, years at present institution, total years teaching, years employed outside
teaching, highest degree held, salary level, marital status, certification route, and school location,
were variables found in the literature review as the demographic variables commonly considered
in studies of job satisfaction in general and job satisfaction of teachers. The literature was
inconsistent in the results indicating which demographic variables had an effect on job
satisfaction. Hadaway (1979), Stitt (1980), and Colli ns (1998) considered similar variables in
their studies of job satisfaction of business educators and agriculture education teachers. Colli ns
included age and years of experience teaching agricultural education in his study of job
satisfaction of agricultural education teachers in Georgia’s secondary public schools and found

3
none of these variables to be significantly correlated with the teacher’s degree of job satisfaction.
Goetze (2000) looked at age, gender, highest education level, years in current position, years
with current employer, years of work- related experience, and years in primary work location in
her study of the impacts of job satisfaction, satisfaction with life, work environment, and selected
demographic variables on the intent of workers in both traditional and non-traditional work
environments to remain with a human relations/payroll organization and found no relationship
between the variables and the level of general job satisfaction. Others (Beck, 2002; Bright, 2002;
Ely, 1993; Haddad, 1989; Haywood, 1980; Stiles, 1993) considered age, education level, gender,
number of years taught, and number of years in present school and found no effect on the level
of job satisfaction. Harris & Associates (1995) considered school location and found suburban
and rural teachers to be more satisfied with their jobs than urban teachers. Adams (1999), Barber
(1980), Birmingham (1984), and Funderburg (1996) found gender to indicate that female
teachers were more satisfied that male teachers. Conversely, Bishop (1996) found males tend to
be more satisfied than females. The variable age was found to be related to job satisfaction by
Funderburg and Barber indicating that older teachers at the secondary level were less satisfied
with their jobs than younger teachers. Wofford (2003) found younger teachers to be more
satisfied than older teachers and that job satisfaction increases linearly with age. Education level
attained by the teacher indicated no relationship with job satisfaction according to Barber,
Givens (1988), and Randall (1987). Years of teaching experience was found to affect the level of
a teacher’s job satisfaction (Barber; Bishop; Givens; Randall; Richardson, 1983). Salary level
was found by Barber, Bishop, Givens, Johnson (1995), and Randall to have an effect on the level
of job satisfaction. The Minnesota Satisfaction Questionnaire (MSQ) normative data groups
included “demographic characteristics of the norm group, including such variables as sex

4
[gender], age, education and tenure information” (Weiss, Dawis, England, & Lofquist, 1967, p.
5).
Purpose of the Study
The shortage of teachers in general and business education teachers in particular is
expected to continue over the next decade (Pascopella, 2001). Georgia’s HOPE Teachers’
Scholarship placed business education on their critical shortage list in spring 1999 and business
education remains on the 2002-2005 list (Georgia Student Finance Commission, 2004). The
purpose of this study was to describe the job satisfaction of business education teachers in
Georgia’s secondary public schools and determine the relationship between job satisfaction and
intent to remain in the profession. Business Education for the purpose of this study is defined as
a secondary level school curriculum or program which offers students the opportunity to explore
and prepare for occupations in the field of business (programs include: accounting, banking and
finance, computer technology, web design, etc).
Much literature exists concerning job satisfaction and teacher job satisfaction. While
there is a growing body of knowledge about job satisfaction of teachers and a limi ted body of
knowledge concerning job satisfaction of business education teachers, there have been few
studies completed concerning the job satisfaction of secondary business education teachers in
Georgia. Since Business Education continues to remain on Georgia’s critical shortage list, it is
important to study the job satisfaction and retention of Business Education Teachers in Georgia.
Ruhland (2001) conducted a nationwide study of attrition and retention factors that influence
newly hired secondary business education teachers. She found teacher retention to be influenced
by five factors: a pleasant working condition, a positive teaching experience, a sense they are
doing a good job, positive interactions with students, and adequate time to complete job

5
responsibili ties. She further found a significant difference in those five factors among those who
did not enter teaching or chose to leave as compared with those who remained in the teaching
profession.
Research Questions/Study Design
In accordance with the purpose of this study, answers to the following questions were
sought:
1. What is the level of satisfaction of business education teachers in Georgia secondary
public schools based on the Minnesota Satisfaction Questionnaire (MSQ)?
2. What is the relationship between job satisfaction of business education teachers in
Georgia secondary public schools and personal and professional variables identified in
the literature that may have an effect on the job satisfaction of teachers? Those variables
include: age, gender, years at present institution, total years teaching, years employed
outside teaching, highest degree attained, and salary level.
3. What is the comparison between the intent to remain in the classroom of Georgia
secondary business education teachers in public schools and select intrinsic and extrinsic
scales of job satisfaction as identified by Herzberg?
The data was collected using a personal data questionnaire and the Minnesota
Satisfaction Questionnaire (MSQ). The MSQ was used to gather job satisfaction data from
Georgia secondary business educators. A personal data questionnaire surveyed attributes
including age, gender, years at present institution, total years teaching, years employed outside
teaching, highest degree attained, salary level, marital status, route to certification (traditional or
alternative), location of school currently teaching in (rural, urban, suburban) and intent to remain
in the profession. Results of this study provide insight into key aspects of job satisfaction of

6
Georgia teachers who choose a career in secondary business education and their intent to remai n
in the field. The instruments were sent to a sample of the business education teachers on a list of
secondary business education teachers provided by the Georgia Department of Education.
Theoretical Framework
The Theory of Work Adjustment developed by Weiss, Dawis, England, and Lofquist
(1967) and the Two-Factor Theory developed by Herzberg, Mausner, and Snyderman (1959)
provided the theoretical framework for this study. The Theory of Work Adjustment was
developed at the University of Minnesota for use in the Work Adjustment Project that started in
1957. The major objectives of this project consisted of the development of diagnostic tools for
assessing the work adjustment (job satisfaction) potential of applicants for vocational
rehabili tation and the evaluation of work adjustment outcomes. These tools included the
Minnesota Importance Questionnaire (MIQ), Minnesota Job Description Questionnaire (MJDQ),
Minnesota Satisfactoriness Scales (MSS), and the Minnesota Satisfaction Questionnaire (MSQ).
The Theory of Work Adjustment addressed a variety of issues related to work adjustment
including vocational choice, personnel selection, work motivation, employee morale, worker
productivity, and job satisfaction (Weiss et al.). Weiss et al. theorized that job satisfaction is
dependent upon how closely a person’s abili ties match the requirements of the job and the degree
to which the person’s needs are met by the reinforcers in the work environment.
The Minnesota Satisfaction Questionnaire (MSQ) was published in 1967 and revised in
1977. It is a well-known, often-used instrument and is well recognized as one of the best
indications of job satisfaction. Normative scores for various occupational groups are included in
the manual for the MSQ. Normative scores for teachers were only used as a part of the analysis
in this study due to the length of time between when the norms were calculated and the date of

7
this study. Scores from each MSQ scale are converted to percentile scores to rate each
individual’s level of satisfaction using the normative charts in the MSQ manual. Percentile
scores of 75 or higher represent a high degree of satisfaction, scores of 26 to 74 represent
average satisfaction, and scores of 25 or less represent low satisfaction (Weiss et al., 1967).
Percentiles were used in this study to determine the point scale for levels of satisfaction using the
raw data.
The MSQ is written on a fifth-grade level, takes an average of 15-20 minutes to
complete, and is self-administering (Weiss et al., 1967). The MSQ long form consists of 100
items that measure 21 scales, the level of general job satisfaction and the levels of satisfaction on
20 scales. Each of the 20 satisfaction scales is measured by 5 items on the MSQ instrument.
Twenty items including one from each of the 20 scales measure the general satisfaction scale.
Responses to each item are on a five-point Likert scale ranging from very dissatisfied (a response
of 1) to very satisfied (a response of 5). The total score for any individual scale may range from 5
to 25, with five indicating very dissatisfied and 25 indicating very satisfied. The 20 individual
scales of the MSQ are abili ty utili zation, achievement, activity, advancement, authority,
company policies and practices, compensation, co-workers, creativity, independence, moral
values, recognition, responsibili ty, security, social services, social status, supervision (human
relations), supervision (technical), variety, and working conditions.
Herzberg, Mausner, & Snyderman (1959) categorized variables affecting a worker’s job
satisfaction into two factors: motivators or intrinsic factors and hygiene or extrinsic factors.
Motivators or intrinsic factors include items such as achievement, recognition, work itself,
responsibili ty, and advancement. These motivators or intrinsic factors produced job satisfaction
for the participants of the motivation to work study conducted by Herzberg (1966). Hygiene or
8
extrinsic factors are the major environmental aspects of work and may lead to job dissatisfaction
(Herzberg). These extrinsic factors include pay, job security, work conditions, supervision, and
interpersonal relations. According to Herzberg, “factors that lead to positive job attitudes do so
because they satisfy the individual’s need for self-actualization in his work” (Herzberg et al., p.
114). Table 1 lists the intrinsic and extrinsic MSQ scales used in this study.
Factor scales of the MSQ that correlate with Herzberg’s motivation or intrinsic factors
include Abili ty Utili zation, Achievement, Advancement, Recognition, and Responsibili ty. MSQ
factor scales that correlate with Herzberg’s maintenance or extrinsic factors include
Company/School Policies and Practices, Compensation, Co-Workers, Supervision-Technical,
Supervision-Human Relations, and Working Conditions. Herzberg theorized that individuals
were motivated more by intrinsic factors than extrinsic factors in their work. The Theory of
Work Adjustment, which the MSQ was originally designed for, includes the idea that individuals
are motivated more by intrinsic factors. Factor analysis of the MSQ for teachers indicated, “the
first factor was ‘ intrinsic satisfaction’” and “accounted for about two-thirds of the common
variance” (Weiss, et al., 1967, p. 23). Emphasis was placed on Herzberg’s Two-Factor Theory
since it focused on job satisfaction where the Theory of Work Adjustment included job
satisfaction only as a part of the whole theory.

9
Table 1
Intrinsic and Extrinsic MSQ Scales Studied
Type Scale Title
Intrinsic Abili ty utili zation Achievement
Advancement
Recognition
Responsibili ty
Extrinsic Company policies and practices
Compensation
Co-workers
Supervision-human relations
Supervision-technical
Working conditions
Note. The general job satisfaction scale was also used in this study.
Significance of the Study
The theoretical significance of this study is its contribution to the understanding of job
satisfaction of Georgia secondary business education teachers. The literature on job satisfaction
and teacher job satisfaction had not focused on the secondary business education teachers and
their satisfaction. By understanding the satisfactions of Georgia secondary business education
teachers, educational leaders can provide more satisfying experiences in the work environment
and help to retain quality teachers in the classroom as required by the No Child Left Behind
education bill (National Commission on Teaching and America’s Future, 2003).

10
This study is of practical significance to teacher educators, school principals, and career
and technology supervisors seeking to recruit and retain dedicated business educators for the
secondary classroom and individuals researching factors determining job satisfaction and their
relationship to the retention of teachers.
Determining job satisfaction for an individual who chose teaching as a career, and more
specifically to teach secondary business education, and remain in the field can provide insight
into how to retain those quality candidates who enter the field. With the passing of the No Child
Left Behind education bill , recruiting teachers who will remain committed to the classroom
beyond only a few years and providing quality preparation programs and early years support is a
challenge that must be addressed.

CHAPTER 2
REVIEW OF LITERATURE AND RELATED RESEARCH
The review of literature relevant to this study drew upon basic job satisfaction theories,
teacher recruitment and teacher retention. Teacher shortage literature was included in this
chapter as well.
Job Satisfaction
The literature on job satisfaction in general and teacher job satisfaction specifically
provided the basis for using Herzberg’s Two-Factor theory to examine the job satisfaction of
business education teachers. Maslow’s hierarchy, Herzberg’s Two-Factor and Vroom’s
Expectancy Theories were the most prominent theories found in the li terature for the study of
teacher job satisfaction. Maslow’s hierarchy outlined the need stages of the individual. Vroom’s
expectancy theory allowed for the idea that the individual will be motivated to complet e a task if
the outcome is both probable and desirable. The outcome satisfies a need of the individual.
Maslow’s Hierarchy of Needs
Job satisfaction can be defined as the degree to which a person’s work fulfill s the
individuals’ needs (Dawis & Lofquist, 1984). “Perhaps the most widely accepted description of
human needs is the hierarchy of needs concept developed by Abraham Maslow” (Certo, 1997, p.
384). Maslow (1970) popularized the theory that motives are ordered from more basic to less
basic needs. These needs are organized into a fairly definite hierarchy based on the principle of
relative prepotency (Maslow 1987). Maslow’s theory implied that gratification is as important a
concept as deprivation in motivation theory. A hierarchy of motives flows from physiological
12
needs such as hunger, to safety needs, belongingness and love needs, esteem needs, and need for
self-actualization (Beck 2000, Certo 1997, Maslow 1987). Maslow stipulated that lower level
needs must be met before upper level needs even come into play in a person’s life and that the
same hierarchy applies to all individuals. “If all these [physiological] needs are unsatisfied, and
the organism is then dominated by the physiological needs, all other needs may become simply
nonexistent or be pushed into the background” (Maslow, 1987, p.16). Once these physiological
needs have been met, other higher needs dominate the organism (Maslow, 1987). “Each of us
strives towards some goals more persistently than towards others” (Beck, p. 31). Beck suggested
that each individual has his or her own hierarchy of motives and that this hierarchy drives the
choices an individual makes. Motivation plays a role in satisfaction in that “our actual on-the-job
experiences influence our motivation and future behavior” (Petri, 1986, p. 350). Motivation is
what gets an individual to exert the energy to accomplish a task; satisfaction is the feeling an
individual experiences after the accomplishment is complete. If an individual approaches a
similar task in the future and recalls the feeling of satisfaction, he or she will be more likely to
perceive the task to be achievable and thus be more motivated to exert the energy to accomplish
the new task. “A positive response to the correct completion of a task would certainly provide
appropriate job satisfaction and serve as a motivator” (Stitt, 1980, p. 15).
Schaffer’s Job Satisfaction Theory
Schaffer (1953) developed a theory of job satisfaction based on psychological needs.
Those needs included recognition, interpersonal relationships, achievement, dominance, social
welfare, self-expression, socio-economic status, moral values, dependence, challenge, economic
security, and independence. The strongest needs were determined to be challenge, achievement,
and social welfare (Schaffer). The theory stated that an individual’s job will meet certain needs

13
for that employee and satisfaction will occur only if the individual employee believes the needs
to be important.
Vroom’s Expectancy Theory
Vroom’s (1964) expectancy theory was based on the idea that an individual will perform
a certain act based on the perception of the outcome to be caused by that act. Vroom defined
expectancy as “a momentary belief concerning the likelihood that a particular act will be
followed by a particular outcome” (p. 17). Expectancy is the perceived probabili ty that a
particular amount of effort will be instrumental in achieving a goal valued by the individual
(Beck, 2000). Robbins (1997) described the theory:
Expectancy theory argues that the strength of a tendency to act in a certain way depends
on the strength of an expectation that the act will be followed by a given outcome and on
the attractiveness of that outcome to the individual. (p. 57)
When choosing between alternatives involving uncertain outcomes, an individual’s behavior is
affected by his or her preferences as well as the degree to which he believes in the probabili ty of
these outcomes (Vroom).
Theory of Work Adjustment
Another theory of job satisfaction is the theory of work adjustment (Dawis & Lofquist,
1984). The theory of work adjustment developed out of the research of the Work Adjustment
Project at the University of Minnesota. The major objectives of this project consisted of the
development of diagnostic tools for assessing the work adjustment potential of applicants for
vocational rehabili tation and the evaluation of work adjustment outcomes. These tools included
the Minnesota Importance Questionnaire (MIQ), Minnesota Job Description Questionnaire
(MJDQ), Minnesota Satisfactoriness Scales (MSS), and the Minnesota Satisfaction

14
Questionnaire (MSQ). The theory of work adjustment is a broad theoretical formulation which
addresses problems related to work adjustment including vocational choice, personnel selection,
work motivation, employee morale, and worker productivity (Dawis & Lofquist, 1984). The
theory was based on the concept of “correspondence between individual and environment”
(p.54). Lofquist and Dawis (1991) defined correspondence as a “harmonious relationship
between the individual and the environment” (p. 22). The individual brings with him or her
certain skill s and in return receives certain rewards from the work environment. These rewards
include wages, prestige, and personal relationships (Dawis & Lofquist). The theory states that
job satisfaction is dependent upon how closely a person’s abili ties match the requirements of the
job and how well the person’s needs are met by the reinforcers in the work environment
(Stewart, 1984).
The MSQ was developed at the University of Minnesota for use in the Work Adjustment
Project that started in 1957. Weiss et al. theorized that job satisfaction is dependent upon how
closely a person’s abili ties match the requirements of the job and the degree to which the
person’s needs are met by the reinforcers in the work environment. According to Herzberg,
“factors that lead to positive job attitudes do so because they satisfy the individual’s need for
self-actualization in his work” (Herzberg et al., 1959, p. 114).
The MSQ was published in 1967 and revised in 1977. Normative scores for various
occupational groups are included in the MSQ manual. Scores from each MSQ scale are
converted to percentile scores to indicate each individual’s level of satisfaction using the
normative charts in the MSQ manual. Percentile scores of 75 or higher represent a high degree of
satisfaction, scores of 26 to 74 represent average satisfaction, and scores of 25 or less represent
low satisfaction (Weiss et al., 1967).
15
The MSQ is written on a fifth-grade level, takes an average of 15-20 minutes to
complete, and is self-administering (Weiss et al., 1967). The MSQ long form consists of 100
items that measure 21 scales, the level of general job satisfaction and the levels of satisfaction on
20 scales. Each of the 20 satisfaction scales is measured by 5 items on the MSQ instrument.
Twenty items including one from each of the 20 scales measure the general satisfaction scale.
Responses to each item are on a five-point Likert scale ranging from very dissatisfied (a response
of 1) to very satisfied (a response of 5). The total score for any individual scale may range from 5
to 25, with five indicating very dissatisfied and 25 indicating very satisfied. The 20 individual
scales of the MSQ are abili ty utili zation, achievement, activity, advancement, authority,
company policies and practices, compensation, co-workers, creativity, independence, moral
values, recognition, responsibili ty, security, social services, social status, supervision (human
relations), supervision (technical), variety, and working conditions. The scales used for this study
were abili ty utili zation, achievement, advancement, company/school policies and practices,
compensation, co-workers, recognition, responsibili ty, supervision (human relations),
supervision (technical), and working conditions. These scales were used because of their
correlation with the intrinsic and extrinsic factors identified by Herzberg’s (1966) Two-Factor
theory.
The MSQ has continued to be used through the years as a valid and reliable measure of
job satisfaction. Studies of job satisfaction of which used the MSQ include Weiss, Dawis,
England and Lofquist (1967), the study for which the MSQ was developed; Hadaway (1978),
Stitt (1980), Colli ns (1998), Goetze (2000), Alexeeff (2001), and Hancer (2001). Hadaway
(1978), Stitt (1980), and Colli ns (1998) used the MSQ to measure the job satisfaction of teacher
educators or career and technical teachers.
16
Herzberg’s Two-Factor Theory
Herzberg, Mausner, and Snyderman (1959) categorized variables affecting a worker’s job
satisfaction into two factors: motivators or intrinsic factors and hygiene or extrinsic factors.
Motivators or intrinsic factors included such items as achievement, recognition, work itself,
responsibili ty, and advancement. These motivators or intrinsic factors produced job satisfaction
in the participants of the motivation to work study conducted by Herzberg (1966). Herzberg et al.
(1959) conducted open-ended interviews with 203 accountants and engineers in the Pittsburgh
area. The interviewers asked the accountants and engineers to discuss specific occasions where
they felt particularly good or bad about their jobs. Analysis of the incidents revealed that intrinsic
aspects of the job were related to the positive or good feelings about the job. Hygiene or extrinsic
factors are the major environmental aspects of work and lead to job dissatisfaction (Herzberg).
These extrinsic factors include pay, job security, work conditions, supervision, and interpersonal
relations. The hygiene aspects of the job are related to the incidents of negative or bad feelings
about the job reported in the interviews (Herzberg et al., 1959). Man’s need for self -actualization
or growth depends on achievement in tasks that have meaning to the individual. “The motivators
are task factors and thus are necessary for growth; they provide the psychological stimulation by
which the individual can be activated toward his self -realization needs” (Herzberg, p. 78). The
attitudes of the participants in Herzberg’s study toward the job exerted an extremely important
influence on the way in which the job was done. Performance improved when job attitudes
improved. It is primarily the motivators that serve to bring about the kind of job satisfaction and
improvement in performance industry seeks (Herzberg et al.). Herzberg et al. noted “the
profoundest motivation to work comes from the recognition of individual achievement and from
the sense of personal growth in responsibili ty” (p. 125). Neither individual achievement nor a

17
sense of personal growth in responsibili ty is likely to flourish too well in a bureaucratic situation
(Herzberg et al.). Implications of the study show an emphasis on the positive rather than a
negative approach to the individual’s morale. Since it is the motivat ors that produce job
satisfaction, “our emphasis should be on the strengthening of motivators” (Herzberg et al., p.
132).
Herzberg’s study of the motivation to work focused on the attitudes that participants held
toward their jobs. Although attitudes are not the sole predictors of behavior, they can predict
behavior rather well i f they are measured properly (Beck, 2000). Beck li sts the following factors
that determine the extent to which attitudes predict behavior: the attitude measure is specific to
an object or issue, the attitude measure is reliable (using standard measures of reliabili ty such as
evidence from previous research), non-attitudinal considerations do not override accurate attitude
statements, survey sampling is appropriate, and the attitude does not change between the time the
measure is collected and the predicted behavior is to occur.
Teacher Job Satisfaction
Strong motivation is “an essential ingredient in the formula for good teaching and
depends fundamentally on the strength and quali ty of the satisfactions that can be derived from
the enterprise itself” (Bess, 1977, p. 245). Due to the intrinsic nature of the work itself and the
sense of accomplishment derived from it, the profession of education can provide much
satisfaction to those employed in it (Medved, 1982). Studies of teacher job satisfaction focus on
many differing aspects. Some look for levels of job satisfaction at a given point in time. Others
seek to compare teacher job satisfaction in different geographical areas, rural or urban school
settings, men and women, or teacher job satisfaction combined with other factors (Colli ns,
1998). Stiles (1993) studied the relationship between organizational climate and teacher job

18
satisfaction in the Gwinnett County public schools while Colli ns focused on describing the job
satisfaction of agricultural education teachers in Georgia and to identify factors that might have
influence on the possibili ty of them leaving the profession. Stiles found that there was a
significant relationship between organizational climate and teacher job satisfaction. Colli ns
found that approximately half (50.9%) of agricultural education teachers in Georgia’s public
secondary schools had a low degree of general job satisfaction. According to Podsen (2002),
“teachers measure their job satisfaction by such factors as participating in decision making, using
their skill s in ways that are valued, having freedom and independence, being challenged,
expressing their creativity and having opportunities to learn” (p. 10).
Lortie (1975) completed a sociological study of teachers in Dade County, Florida, that
dealt with varying organizational issues of teaching work and teacher sentiments toward daily
tasks. He posited that although teachers are not unique in all aspects, teachers share a “special
combination of orientations and sentiments” which are derived from occupational structure and
“the meanings teachers attach to their work” (Lortie, p. viii ). Results of Lortie’s study indicated
that teachers consider psychic or intrinsic rewards as their major source of job satisfaction. The
factor indicated as providing the most reward to teachers is “to feel that they have ‘ reached’ their
students” (Lortie, p. 106). According to Thompson (1979), “the answer to teacher motivation lies
in intrinsic motivation. And intrinsic motivation belongs to self-determining teachers. It does not
come from money” (p.43). Maslow (1970) stated that higher, self-actualization needs only come
into play after lower level needs are met. Salary levels and extrinsic rewards must be adequate to
satisfy hygene needs (Frase, 1989). Sulli van (2001) indicated that:
In order to maximize teacher motivation, conditions should be created that lead the
teacher to perceive that he/she is competent of achieving the goal(s), is autonomous in
19
directing his/her energies, and that he/she feels emotional/socially/professionally
connected to the individuals related to the accomplishment of the goal(s). (p. 11)
Warr (1991) used a combination of the Job Descriptive Index (JDI) and the Brayfield and
Roth Index (BRI) to assess job satisfaction of secondary teachers in vocational/technical
education in the United States. The Job Descriptive Index asks respondents to respond to
questions concerning the feelings and perceptions the respondent has about the school in which
he or she teaches. There are sections related to teaching, pay, supervisor, promotion, and
coworkers. The Brayfield and Roth Index uses question about jobs. Warr found that satisfaction
with pay, supervision, age, and teaching were indicators of job satisfaction of
vocational/technical teachers. Overall job satisfaction and satisfaction with co-workers were
found to be prediction factors for intent to leave the profession.
Job Satisfaction of Business Educators
Little research that focused on business education teachers who remain in the classroom
or their job satisfaction was found. Teacher job satisfaction has been shown to be a predictor of
teacher retention (Shann, 1998) and a determinant of teacher commitment (Shann; Shin & Reyes,
1995). In a nationwide study of attrition and retention factors that influence newly hired
secondary business education teachers, Ruland (2001) found secondary business education
teachers to be influenced by five factors: a plesant working condition, a positive teaching
experience, a sense they are doing a good job, positive interactions with students, and adequate
time to complete the job responsibili ties. She further found a significant difference in those five
factors among those who did not enter teaching or chose to leave as compared to those who
remained in the teaching profession. With the current teacher shortages, especially in the area of
business education, it is important to determine what satisfies the needs of business education

20
teachers and motivates an individual to remain in the classroom. Georgia’s shortage has
experienced some relief due to the decline in the economy (Blair, 2003; Sausner, 2003; Stripling,
2003). The shortage is likely to return when the economy begins to recover.
Teacher Recruitment With the teacher shortage comes the challenge of recruiting quali ty teachers. “From New
York City to Los Angeles, the world of urban teacher recruitment is getting more cutthroat while
the country braces to attain more than two milli on teachers in the next 10 years” (Pascopella,
2001, p. 38). The problem is not that qualif ied teachers are so hard to find, but that there are
better options than working in school systems that ignore individuals’ professional needs such as
mentor support, on-the-job training, and professional development (Hinds, 2002). Many states
and school districts are employing innovative and aggressive recruitment strategies, including
signing bonuses, subscriptions to professional magazines, subsidized mortgages, job-sharing
arrangements, laptop computers, and health club memberships (Peske, Liu, Johnson, Kauffman,
& Kardos, 2001; Shure, 2001). Cities like New York and Atlanta are looking to the business
world to fill teaching vacancies (Pascopella). The National Association of State Boards of
Education (2002) found that 19 states and the District of Columbia offer incentives for recruiting
teachers. Georgia has three incentive programs: a loan forgiveness program for teacher education
students of programs in subject areas identified by the state as having a critical shortage of
teachers, a signing bonus for teacher recruits willi ng to teach in high priority school, and
incentive pay for National Board for Professional Teaching Standards Certif ication.
California, Chicago, New York and North Carolina are looking abroad for teachers to fill
teaching positions (Pascopella; Coeyman et al.). The Department of Labor and the Immigration
and Naturalization Services (INS) opened the door for foreign recruitment in 1999 when the

21
federal government agreed to grant H1-B visas for foreign nationals to teach in American public
schools (McCoubrey, 2001). As part of Chicago’s Global Educator Outreach Initiative, 44
international teacher candidates from 22 different countries were sponsored for the INS H1-B
visas in 2000; and the initiative received 4,000 applications from over 90 different countries in
2001 (McCoubrey). Candidates were required to pass a written and oral English exam and be
interviewed by the Chicago Public School system before they were hired.
In Georgia, international teachers are used in several metro Atlanta school systems
including the City of Atlanta and Clayton, DeKalb, Douglas, Fayette, Fulton and Gwinnett
counties (Burch, 2003). The Cobb County School Board recently voted to work with recruitment
agencies that recruit internationally (MaryKay Fermanich, personal communication, March 28,
2003). The Cobb County plan would bring about 20 teachers from foreign countries to teach in
local classrooms and live in the local communities for a period of three years (Burch).
Recruiting from abroad allows schools in the United States to draw from a pool where
there is a surplus of teaching professionals, especially in the math, science, and technology areas
(McCoubrey, 2001). One drawback to hiring foreign teachers is similar to those expressed for
some other alternative certification programs: not enough preparation before the teacher is put in
the classroom. According to McCoubrey, “Teaching is a demanding job, and many recruits have
difficulty adjusting to American students and teaching styles” (p. 34). Another problem seems to
be retention of these recruits due to homesickness and diff icult adjustments. Seven of the 44
recruits in Chicago’s initial program returned to their home countries (McCoubrey). Some
concerns expressed by members of the Cobb County (Georgia) Board of Education included
language barriers due to thick accents and cultural differences that might cause foreign teachers
to overreact to minor student behavior problems (Burch, 2003).

22
Alternative Certification
Most traditional teacher preparation programs require a four-year degree program that
culminate with a student teaching experience. These programs are not providing enough
candidates to fill classrooms throughout the United States and are causing many states and
districts to look to alternative avenues for certification (Pascopella, 2001). Alternative teacher
certification programs “rose out of a need for not only more, but also better, teachers”
(Feistritzer, 1999, p. 2). About 10% of public school teachers hired during the past decade were
initially hired without a license, and many more were hired on substandard certificates (Darling-
Hammond, 2001). Alternative teacher certification began as a somewhat controversial concept.
When the National Center for Education Information (NCEI) (2003) began surveying states
concerning alternative routes for licensing teachers in 1983, only eight states reported having any
way for individuals to become certified to teach other than the traditional college teacher
education programs, compared with 46 states and the District of Columbia which now have
alternative routes for teacher certification. Governors, state commissioners of education, deans of
education and other political and educational leaders are in favor of some form of alternative
certification (Feistritzer). Some states generate a large percentage of their new teachers from
alternative route programs (Berry, 2001). People from various educational backgrounds and
walks of life have the opportunity to become teachers through alternative teacher certification
routes (Feistritzer).
In order to speed the process of getting teachers into the classroom, alternatives to the
traditional certification and licensure are being used widely. Alternative certif ication programs
are designed to meet the educational needs of working professionals and expedite the licensing
process for individuals interested in teaching who already have a bachelor’s degree and expertise

23
in a particular subject matter (Glenn, 2003). Feistritzer (1999), president of NCEI, testified
before the House Committee on Education and the Workforce, “Alternative routes for preparing
and licensing teachers are attracting large numbers of highly qualified, talented and enthusiastic
individuals to the teaching profession” (p. 4). The individuals attracted by alternative
certification routes are highly educated, life-experienced adults who want to teach and are
interested in improving America’s educational system.
Alternative programs vary according to content, duration, rigor, and support. Many
programs offer teacher candidates a short training course in classroom management,
development of lesson plans and instruction, and an introduction to education, followed by
education courses taken at night or on weekends during their first two years of teaching.
According to Berry (2001), there is a need for more alternative routes to teacher
preparation and licensure in order to attract mid-career recruits into teaching, “but they must be
good programs” (p. 33). Effective alternative preparation and licensure programs should last
from 9 to 15 months and set the stage for novice educators to enter the teaching profession.
These programs should include the foll owing characteristics:
Strong academic and pedagogical coursework that provides teachers with the subject
matter and teaching knowledge needed to help students reach the state’s curriculum
teaching standards;
Intensive field experience in the form of an internship or student teaching under the direct
daily supervision of an expert teacher;
A requirement that candidates meet all of the state’s standards for subject matter and
teaching knowledge for a standard certificate before becoming a teacher of record; and,

24
A guarantee that new teachers meet all of the state’s teacher quality standards, including
passing the same assessments given their traditionally prepared counterparts. (Berry, p.
35)
Alternative certification programs in most states have entrance requirements that are at or
above the requirements for those who received training through traditional preparation programs.
Similar characteristics are emerging in all alternative routes that are being developed: hold at
least a bachelor’s degree; pass a screening process which includes passing tests, interviews, and
demonstration of mastery of the content to be taught; begin teaching early, usually full time, to
be engaged in on-the-job training; complete professional education coursework or experiences
while teaching; work with mentor teachers; and meet high performance standards (NCEI).
One national alternative route to teaching is Teach for America. The Teach for America
program, created in 1990, recruits, trains, and places recent college graduates in low-income
schools throughout the United States (Tell , 2001). The program requires the participants commit
to remain in their school placement for at least two years. Teach for America is not without
criticism. Tell described two counts of criticism that have been directed at the program: a lack of
adequate training for such demanding conditions and that two years is not long enough to make
substantial changes in schools that are already in a vulnerable situation. “Almost all of them [the
teachers] have chosen to continue working far beyond their two years of service to expand
opportunities for children in low-income communities,” is the response to the time period
criticism from founder of Teach for America, Wendy Kopp (2000, p. 48). Sixty percent of the
Fall 1999 Teach for America alumni group were still working full time in education, 37 percent
are still teaching in 2000 (Kopp). Massachusetts has a similar training program called the
Massachusetts Institute for New Teachers that is modeled after the Teach for America program.

25
This program, where one fifth of the new recruits leave teaching after the first year, has not
enjoyed the same success keeping their recruits in the classroom as Teach for America (Tell ).
Another program that follows the Teach for America model, Troops to Teachers, places
military veterans in the classroom (Finn & Madigan, 2001). The Troops to Teachers program
was launched in 1994 by the Department of Defense. Georgia is one of several states that have
hired veterans for their classrooms utili zing this program. Offices for the Troops to Teachers
program are housed in the Departments of Education in 20 states, those states with the most
military bases. The Troops to Teachers program offices assist military veterans to “navigate the
complexities of becoming licensed to teach and find a job where they want to live” (Bradley,
1998, p. 2). Troops to Teachers provides financial assistance for eligible individuals interested in
moving from the military to a second career in teaching in the form of a stipend to help pay for
teacher certification costs or a bonus to teach in a high-needs school (Georgia Troops-to-
Teachers, 2003). Eighty percent of the participants hired between 1994 and 1997 were still
teaching as of 1998 (Bradley, 1998).
In response to the shortage in Georgia caused by the “many teacher retirements planned
and Georgia’s colleges producing significantly fewer educators than needed,” Georgia state
officials designed an alternative route to certification to attract candidates with subject
knowledge, but in need of teaching skill s (Blair, 2001, p. 24). The Teach for Georgia program,
now called Teacher Alternative Preparation Program (TAPP), seeks to train people from other
professions for four weeks and then place them in the classroom while they work toward a
master’s degree in education (Pascopella, 2001). Some schools participating in the TAPP
program include Albany State University, Georgia State University, Georgia Southern
University, Kennesaw State University, and North Georgia College and State University

26
(Georgia Professional Standards Commission, 2002). TAPP participants can earn a master’s
degree from these institutions during their first few years teaching. Participation in the TAPP
programs requires a bachelor’s degree in an appropriate field, undergraduate grade point average
(GPA) of 2.5, a passing score on the PRAXIS I or exemption scores, a criminal background
check, and an offer of full-time employment in a teaching position from a participating school
system to be considered eligible for the program (Georgia Professional Standards Commission).
The TAPP program requirements span over two years and include attendance in a minimum
number of seminars during each year, content course work if needed, passing the program-area
PRAXIS II , an achievement portfolio, and assessment from a teacher-candidate support team.
The program initially attracted such a large response to the e-mail address set up for non-teachers
interested in the program that the e-mail server shut down (Coeyman, Jonsson, Teicher, &
Wiltenburg, 2001). After an extensive literature search, no data were found that reported the
success rate of this program.
A Guide to Alternative Certification: Beginning a Career in Teaching for Mid-career
Professionals (2003) listed three other programs recognized by the state of Georgia: the
Business-to-Teaching program at the University of Georgia, Atlanta P.L.U.S. through Atlanta
Public Schools, and Georgia Responds at the Georgia College and State University. These
programs provided a more flexible manner for career changers to gain the required course work
in order to become certified teachers in Georgia. These programs all owed an individual to obtain
a provisional certificate so that the individual can begin teaching while finishing required
coursework for full certification. A provisional certificate was a conditional certificate that
indicates that the individual had completed subject content requirements, but needs to satisfy the

27
teacher education requirements to receive professional certification (A Guide to Alternative
Certification, 2003).
Teacher Recruitment and Retention
Recruiting new teachers only partially addresses the teacher shortage issue. With the
rising attrition and teacher shortages, “the general public should be gravely concerned about the
retention and nurturing of high quality teachers” (Bobek, 2002, p. 202). Teacher retention is as
important as teacher recruitment. Ingersoll (2002) compared the recruitment and retention issue
to trying to fill a bucket with holes in the bottom. Since many new recruits leave the profession
within five years, the shortage will continue to grow because the bucket never gets full.
Retention of teachers is essential to meeting the long-term needs of our schools. “Retention,
rather than recruitment, may lie at the heart of the teacher-quality issue” (Olson, 2000, p. 16).
New teachers improve dramatically during their first few years of teaching; and therefore,
retaining teachers long enough for them to reach their full potential is critical (Olson). One-third
to one-half of all new teachers leave the profession within the first five years (Hope; National
Commission on Teaching and America’s Future, 2003), thus retention of newly recruited
teachers and veteran teachers becomes an issue that must be addressed. The National
Commission on Teaching and America’s Future (NCTAF) confirmed this in a recently released
report titled No Dream Denied: A Pledge to America’s Children. According to NCTAF, “the real
school staffing problem is teacher retention. Our inabili ty to support high quali ty teaching in
many of our schools is driven not by too few teachers entering, but by too many leaving” (p. 8).
Increasing student enrollments, smaller classes, and retirements were often given as reasons for
teacher shortages and that the supply of new teachers is not sufficient to keep up with the
demand. NCTAF reported that the supply of teachers dramatically increased during the late
28
1990s and that “the problem is that we are losing teachers faster than we can replace them” (p.
22).
Chapman (1984) developed a model that suggested that teacher retention is a function of
a teacher’s personal characteristics, educational preparation, initial commitment to teaching,
quality of their first teaching experience, professional and social integration into teaching, and
external factors . Together these six factors “ influence career satisfaction, which in turn, relates
to teachers’ decisions to remain in or leave teaching” (Chapman & Green, 1986, p. 273).
Chapman (1984) reported that individuals who had taught continuously reported a higher initial
commitment to teaching, were more likely to have obtained additional education, and more often
believed their educational experiences were well utili zed in their employment than those who left
teaching within five years or never taught. Chapman and Green surveyed 1,043 graduates of the
University of Michigan who had received a teaching certificate at the time of their graduation.
Survey respondents were classified into four groups: those who had taught continuously since
graduation, those who started teaching after graduation but had taught intermittently, those who
started teaching but then left the profession, and those who never taught. The results of the study
supported Chapman’s model of retention, initial career commitment and early work experiences
contribute to teacher retention. Chapman and Green (1986) also reported: “ the results suggest
that the attention administrators give to assuring the quality of professional life that new teachers
experience can have long-term impacts on the career development of those teachers” (p. 277).
There are many reasons teachers leave the classroom. New teachers give these reasons
for leaving: student discipline problems, lack of recognition and support, and low pay (Glenn,
1999; Olson, 2000). Ingersoll (2002) stated:

29
The data suggests that improvements in the conditions of the teaching job, such as
increased support for teachers, increased teacher salaries, reduction of student
misbehavior and enhanced faculty input into school decision making, would all
contribute to lower rates of turnover. (p. 43)
Teacher support is a critical issue. Forty states addressed this issue by requiring or
encouraging districts to create induction or mentoring programs for new teachers (Glenn, 1999;
Olson, 2000). Induction programs are planned staff development for new teachers and teachers
new to a school or district. Clement (2000) described induction as “an umbrella covering three
areas—orientation before the school year begins, support seminars for the new teachers that are
held throughout the first (and possibly second) year, and the mentoring of new teachers by
trained veteran teachers” (p. 76). Orientation meetings provide the newly hired teacher with
information about the district and school policies and procedures needed to do their job. Clement
suggested providing a notebook with all the orientation handouts so new teachers can refer back
to them as needed, but warns against making it an encyclopedia. The reference “should be user
friendly” (p. 86). Continued support for new teachers is provided through seminars scheduled
throughout the school year. Support seminars provide “ongoing training in teaching skill s,
further orientation to the school district and the teaching profession, and emotional support to the
teacher” (Clement, p. 90). According to Clement, seminar topics might include organization and
communication skill s, stress management, classroom management strategies, teaching strategies,
and dealing with students’ social and emotional problems. The Georgia Systematic Teacher
Education Program (GSTEP) is a federally funded program that provides integrated, coherent
teacher education experiences that begin when the student enters college and continue through
their second year of teaching. GSTEP is a collaborative effort between Colleges of Arts and

30
Sciences and Education and practitioners to increase their involvement in the preparation of
teachers. Curriculum, induction, early community experiences, and program evaluation are the
four focus areas of GSTEP (Georgia Systematic Teacher Education Program, 2003). University,
P-12, and agency partners in GSTEP include Albany State University, University of Georgia,
Valdosta State University, Barrow County Schools, Clarke County Schools, Cook County
Schools, Dougherty County Schools, Jackson County Schools, Madison County Schools,
Professional Standards Commission, Board of Regents, Coastal Plains RESA, Northeast Georgia
RESA, Southwest Georgia RESA, Oconee County Schools, Oglethorpe County Schools, and
Valdosta City Schools.
The concept of mentoring is popular in many areas of business. Celebrities and
politicians proclaim the advantages of mentoring, and young executive seek mentors as a means
to climb the corporate ladder (Clement, 2000). Mentoring is a program where veteran teachers
provide new teachers with structured support during their first few years of teaching. “Mentoring
is a hot topic because of the potential for growth when a beginner is paired with a veteran who
can serve as a guide, role model, friend, confidante, and even teacher to the novice” (Clement, p.
115). Its origin goes back to Greek mythology when Mentor, half-god and half-man, taught
Odysseus’ son while Odysseus was away during the Trojan War (Olson, 2000). Mentors today,
as Mentor in the days of Greek mythology, are to be a source of wisdom, right action, and
support. The effective alternative certif ication routes discussed earlier include a mentoring
aspect. In an interview for the Los Angeles Times, Segun Eubanks with the National Education
Association explained,
A mentor is not somebody you have a cup of coffee with every other week to talk about
your problems. A mentor is someone who is going to help you on a regular basis to
31
improve your skill s and give you some feedback and help you with your craft in the
classroom. (Trapps, A.22)
A mentor is like a coach; he or she encourages while giving advice for improving the skill s
teachers need to reach their full potential. Georgia’s Teacher Alternative Preparation Program
includes a three-person support team as part of the induction plan with one member of this team
being a school-based mentor (Georgia Professional Standards Commission, 2000). The new
teacher candidate is required to meet with and be assessed by this support team periodically
during the two-year induction program. New teachers are nearly twice as likely to leave teaching
after their first three years if they have not participated in some type of mentoring program
(Olson, 2000).
Low pay is another issue in teacher retention. Olson (2000) and Wilson (2000) reported
the gap between the average annual salary of a young teacher and a non -teacher, both with only a
bachelor’s degree, was $8,192 in 1998. “Overall, teachers salaries are about 20 percent below the
salaries of other professionals with comparable education and training” (Darling-Hammond,
2003, p. 9). Although the salary gap between the teaching profession and other occupations is
often significant, especially in rural and urban school, it is not new (Wilson, 2000). What is new
are the options available to college graduates, especially women. Graduates are “choosing to
enter high-tech jobs, instead” and “bypassing educational opportunities and moving into careers
that promise them stronger salaries and more opportunities to travel” (Reising & Denlinger,
2002, p. 116). The gap between the average salary of a teacher and a non-teacher with the same
level of education grows even larger as the two individuals age and acqui re higher levels of
education (Wilson). According to Wilson, “graduate studies yield only half the payoff for
teachers as for individuals in other occupations” (p. 36). Reising and Denlinger argued that

32
higher salaries for teachers across America and a competitive job market will cause the teacher
shortage to disappear and the quality of education to improve. Traditional motivational theories
do not support this argument. Public Agenda (2000) addressed the issue of low salaries keeping
people away. Although teachers do believe they are underpaid, raising teacher salaries by itself
will not drastically change who enters the field of teaching. Olson stated, “Higher salaries might
broaden the pool of potential teachers. But pay alone won’t keep them in the classroom” (2000,
p. 10). Salaries become less of an issue the longer a person is in the teaching profession.
There is a large body of literature concerned with retaining new teachers; less attention
has been given to retaining veteran teachers. Reductions in turnover would allow for relief from
staffing issues as well as improve school performance due to teachers remaining in the classroom
for longer periods of time. A task force established by the Professional Association of Georgia
Educators (PAGE) Foundation issued suggestions for “keeping our best teachers” (Christmas,
2001, p. 17). The task force suggested limiting assignments to their area of concentration;
developing smaller classes; providing a two-year induction program for beginning teachers;
providing adequate resources including planning time, technology access, and support of local
school administration, district staff, and the community; providing professional development that
is focused on the teacher needs in order to improve student achievement; and providing
opportunities for advancement without leaving the classroom (Christmas). Noble (2001)
implored: “give us the tools and resources we need to get the job done for our children” (p. 5).
Among those items listed by Noble are phones in the classr oom, updated technology, more
money budgeted for training, clerical help, a clean, safe environment to work in, and improved
discipline both on the school grounds and on the buses. According to Public Agenda’s report, A
Sense of Calli ng: Who Teaches and Why (2000), “What teachers most want is what they believe

33
will make them more effective in their work: smaller classes and much stronger support from
administrators and parents” (p. 3).
Teachers who have left the profession expressed a lack of participation in the decision-
making process for school environment as a reason they left. Ingersoll (2002) included enhanced
faculty input into school decision making as a factor that would contribute to lower rates of
turnover. “Working conditions, including influence over professional decisions, play an
important role in determining who stays in teaching” (Darling-Hammond, 1997, p. 21). Creating
a culture of learning and involving teachers in strategic decision making is crucial to increasing
teacher job satisfaction (Martin & Kragler, 1999). Woods and Weasmer (2002) stated, “Teachers
who claim a voice in moving toward organizational goals, increase their commitment to the
district and enhance their job satisfaction” (p. 187).
Quality staff development is also an issue in retaining veteran teachers. Staff
development needs to be an ongoing collaborative effort between teachers, administrators, and
colleges of education (Clement, 2000). Workshops and in-service programs must be of value to
the teacher. The district needs to look at the whole teacher and tail or learning opportunities to
teachers’ needs at the various stages of their career. Clement suggested that veteran teachers
need to be asked “how can the administration and board help you succeed at your job” and “what
can we [administration and board] do to keep you working at our schools with our students” (p.
137). Asking these questions also allows the teacher to feel a part of the decision making process
and contributes to improved working conditions.
Ruhland (2001) studied the factors influencing the retention of secondary business
education teachers on the national level. The study identifies five factors important to retention
of business education teachers: a pleasant working condition, a positive teaching experience, a

34
sense they are doing a good job, a positive interaction with students, and adequate time to
complete job responsibili ties. These five factors were significantly different for those who did
not enter or chose to leave and those who remained in the teaching profession. Chapman’s
retention model was supported by the results of the study conducted by Ruhland. Business
education teachers who remained in teaching confirmed “teacher retention is a function of the
first year teaching experience and professional and social integration into teaching” (Ruhland,
p.11).
Feminization of the Career of Teaching
The feminization of teaching dates back to the development of the common school during
revolutionary times. Sugg (1978) stated:
The changing estimate of human nature and its rights and capacities, the
ambivalence toward authority whether institutional or intellectual, the emphasis
on moral rather than intellectual training as the primary function of education, and
the tendency to limit public education to the elementary level were all factors
which incidentally predisposed Americans to accept the idea of woman as teacher.
(p. 16)
The elementary school that was supported by both the elite in society and the common
workingman was viewed as “an extension of the home rather than the first precinct of civil li fe”
(p. 18). Thus it was appropriate for women to teach since this fit with the traditionally defined
female role. Clifford (1991) described teaching as “ 'within woman’s sphere' –an extension of the
maternal role as a child’s first and most important educator” (p. 117). The mother was seen as
the primary instructor in the home because she spent so much time with the child during the

35
early years of development. The idea that elementary education was to focus on moral education
instead of intellectual education paved the way for Americans to see women as teachers.
Society viewed teaching as an appropriate occupation for a young woman to occupy her
time until she married and began a family (Clifford, 1991). This coming and going of young
women caused a high turnover rate that normally would be seen as a negative in the world of
work, but was seen as a positive where women and careers were concerned. When a woman
married and vacated a teaching position, an opportunity opened for another young woman.
Powerful ideologies tying together women with marriage and children while a man’s role was
seen as the breadwinner helped this discriminatory system to continue (Acker, 1989). All levels
of society began to allow their daughters to be trained as teachers. This provided the more eli te
of society’s young ladies with an income should the young lady not marry or become widowed.
A high turnover rate for male teachers was an unfortunate, but acceptable, fact of li fe. In the late
1800s a young man might teach as an interim position between occupations or while he searched
or prepared for his true occupation or in the event that he was unable to farm due to a handicap
(Hoffman, 1981). The widespread acceptance of the high turnover rate of both male and female
teachers was representative of the lack of commitment and importance nineteenth century society
placed on education.
The first attempts at creating a state-supported system of common schools and a
redefinition of the mission of schooling dates back to the mid 1800s (Hoffman, 1981). Hoffman
credited three intertwined social changes for giving woman her new profession and education
new respect: industrialization, immigration, and urbanization. The feminization of teaching can
be explained somewhat by the theory of supply and demand. At a time when industrialization
provided new opportunities for the sons of farmers, teachers were needed in newly developed
36
schools and school systems. “Educators seized the moment—mid-nineteenth century—to declare
that women, the ‘natural’ teachers, should staff the graded schools” (Hoffman, p. 10). The
growth in the numbers of immigrants coming to the United States made for increased population
and increased demand for more teachers. The combination of industrialization and immigration
increased urbanization as new immigrants and the sons of farmers moved closer to the cities to
find better work in industry. Concern existed for the moral development of the immigrant child
and the new industrialist child. Early school administrators decided that the untrained, temporary
male teacher was unable to help develop student character. The new teachers would be “young
women who loved books, were self-sacrificing, had an instinct for mothering, and sought
dignified work” (p. 12). The first normal school or teacher’s college, Lexington Academy,
opened in 1839 in Massachusetts. The normal school is where teaching as a profession for
women was born (Hoffman).
Teaching became a career that required special training. Before the establishment of the
normal schools, teaching only required that the teacher, male or female, have completed
education only slightly beyond the level being taught. It was 1907 before the first state, Indiana,
required that teachers be high-school graduates (Clifford, 1991). As the educational requirements
leading toward teaching grew, the opportunity costs for men became more than they were willi ng
to expend.
The mass entry of women into the profession in the middle nineteenth century caused
teaching to be labeled “women’s work” and, thus, a second-rate profession (Hoffman, 1981).
Carr-Saunders and Wilson (1933) developed a category called semi-professions that consisted of
all the major women’s professions including teaching. Simpson and Simpson (1969) also
identified teaching as a semi-profession.
37
Over the span of 100 years, 1870 to 1970, teaching remained in the top five on the list of
the ten leading occupations of all women in the labor force (Clifford, 1991; Chavetz, 1997). “In
the United States, 50% of all employed women are concentrated in four relatively poorly paid
female occupations: registered nurse, clerk, retail -sales worker, and teacher” (Bookman, 2000, p.
93). Addressing the reasons for an early desire to become a teacher, Chavetz suggested a variety
of sources having influenced a woman’s career choice. Television shows, books, and staffing
patterns in schools all seemed to send the message: “teaching is for women” (p. 15). The woman
teacher was one of the few models of the working woman with whom school girls had direct,
prolonged experience (Clifford).
Clifford (1991) noted three demographic profiles of the American population in the
nineteenth century that affected women’s educational and employment histories: the falli ng birth
rate in the United States, the rising age of first marriage, and the growing population of
permanently single American women. With the decline in the birth rate, women lived longer,
healthier lives, and their daughters spent less time as mother’s helper and therefore had more
time for education. As young women chose to postpone or avoid marriage, those equipped to
teach could be self-supporting and decently occupied. “Teaching, with its missionary ideology
and its image as an extension of mothering, could be accepted as a chosen alternative to marriage
for a woman of the educated classes” (Hoffman, p. 11).
Teacher Shortage
There is an increasing teacher shortage in our nation. “By 2011, the shortfall nationwide
is expected to reach 2 milli on teachers” (Trapps, 2001, p. A.22). This situation resulted from a
combination of retiring teachers, increasing student enrollment, and switching professions
(Riley, 1999). This shortage has been in the making for a long time and is only worsened by

38
legislation, although much needed, to reduce class size (Shure, 2001). Societal views of teaching,
opportunities outside of teaching, and changing opportunities for women are also reasons for
teacher shortages (Billi ngsley, 1993). According to Ingersoll (2002), “Problems of teacher
quality and quantity are, indeed, among the most important issues in schools, but they are among
the least understood” (p. 42).
Approximately 26% of secondary teachers are expected to retire in the next 12 to 15
years (Bandeira de Mello & Broughman, 1996). In recent years the teaching profession has
experienced a low retention rate.). One-third to one-half of all new teachers leave the profession
within the first five years (Darling-Hammond, 2001; Dawson, 2001; Hope, 1999; Ingersoll,
2002; National Commission on Teaching and America’s Future, 2003). In its report, No Dream
Denied, a Pledge to America’s Children, the National Commission on Teaching and America’s
Future (NCTFA) reported that staffing shortages are most common in inner cities and in rapidl y
growing areas of the country such as the South and West.
Since new teachers improve dramatically during their first few years on the job, “ it is
critical to retain teachers for at least five or six years so that they can reach their full potential”
(Olson, 2000, p. 10). If new teachers are leaving the profession before reaching their potential,
students continue to experience less than the best quality educational practices. High attrition
rates among career and technology teachers results in negative impacts on programs. Those
impacts include programs that may be inconsistent, students who are less than prepared to
compete in a global marketplace, and teachers who are less than qualified (Self, 2001). “The
most serious consequence of high teacher turnover is that it erodes teaching quali ty and student
achievement” (NCTAF, p. 33).

39
Shure (2001) stated, “ this teacher shortage knows no boundaries as it is affecting public
and private schools, urban and rural schools alike, specifically in areas of special education,
mathematics, science, foreign language study, bili ngual education and, even career and technical
education” (p. 19). U. S. teacher education institutions graduated approximately 2,800 licensed
technology teachers between 1995 and 1998 (Ritz, 1999). Weston (1997) found that the
technology education profession would need an estimated 13,000 technology education teachers
by 2001. This leaves a shortage of over 10,000 technology teachers. Supply and demand is a
critical issue in career and technical education. The current slump in the economy seems to be
easing the teacher shortage (Blair, 2003; Sausner, 2003; Stripling, 2003). Sausner, as well as
Blair, stated that the demand had decreased due to budget issues. Stripling pointed out, “ the soft
economy means more people are willi ng to work for teacher’s pay” (p. 20). As the economy
improves, the risk of the return of teacher shortages increases.
Until recently, Georgia was also experiencing a shortage of teachers. While metro Atlanta
counties are experiencing an ease in the number of teacher vacancies, “vacancies persist
elsewhere in Georgia” (Blair, 2003, p. 10). A shortage of teachers is a threat not only due to large
percentages of teachers becoming eligible for retirement, “but also from private industry that is
heavily recruiting teachers with expertise in science, math, and other technical fields”
(Badertscher, 2001). Due to the teacher shortage, the Georgia Student Finance Commission
(2000) expanded the HOPE Scholarship Program to include the HOPE Teacher Scholarship. The
HOPE Teacher Scholarship allows teachers to participate in a loan forgiveness program based on
critical shortage need areas. The loan is repaid by a year of service for every $2,500 of funds
received from the program toward an advanced degree in a critical shortage area (Georgia
Student Finance Commission, 2000). Georgia’s business education teacher shortage prompted

40
the Georgia Student Finance Commission (2000, 2002) to add business education to their critical
shortage list in 1996, and business education remained on the list for the 2002/2003 school year.
The national teacher shortage extends to business education. The fact that as many as
50% of business education teachers are close to retirement and the drop in the number of
graduates from business teacher preparation programs over the past 10 years are two reasons for
this shortage of business teachers (Okula, 1999). The demand for secondary business education
teachers exceeded the supply by 64% in 1997-1998, up from 8% in 1991-1992 (LaBonty, 1999).
Many young graduates are choosing to enter the business world where they can obtain a higher -
paying job instead of choosing to teach. Graduates have more options now than 20 or 30 years
ago, “becoming an engineer or computer business person is more lucrative than teaching about
it” (Pascopella, 2001, p. 38). Older, mid-life individuals who are interested in a career change are
faced with difficult, time-consuming, and costly certification requirements imposed by many
states.
Summary
Hopefully, by studying the job satisfaction of secondary business education teachers and
their intent to remain in the classroom, administrators and business teacher educators can provide
those satisfying experiences for more secondary business education teachers and help keep them
committed to remain in the classroom. When individuals become motivated, they exert energy
toward a goal and enjoy satisfaction once the goal is attained and the anticipated reward is
received. As stated before, individuals tend to approach activities they feel will be beneficial to
them. “Teachers who are satisfied with their careers tend to remain in the profession longer”
(Ruhland, p. 215).

CHAPTER 3
METHODS AND PROCEDURES
Introduction
The purpose of this study was to describe the job satisfaction of business education
teachers in Georgia’s secondary public schools and determine the relationship between job
satisfaction and intent to remain in the profession. The Minnesota Satisfaction Questionnaire
(MSQ) developed by Weiss, Dawis, England, and Lofquist (1967) was used to measure job
satisfaction levels. A personal data questionnaire surveyed attributes including gender, age, years
employed at present school, total years teaching, highest degree attained, salary level, route to
certification (traditional college teacher preparatory program or an alternate route), location of
school currently teaching in (rural, urban, suburban), and level of intent to remain in the
classroom. Huberty and Petoskey (1999) stated, “Such information, as much as is obtainable,
should be reported in any survey study” (p. 16). Table 2 lists each variable and the corresponding
measurement.
This chapter addresses the research methods that were used to conduct this study.
Population and sample, instrumentation, data collection, and analysis of the data are also
addressed.
Survey Research
Survey research is a method of using questionnaires or conducting interviews to collect
data from participants in a sample about their characteristics, experiences, and op inions. The
purpose of survey research is to use data collected by questionnaire or interview to generalize the

42
Table 2
Variables and Their Response Codes/Measurements
Variable* Response Codes/Measurement
Job satisfaction (DV) General satisfaction raw scores from the MSQ
Age (IV) Actual number of participant’s age at last birthday
Gender (IV) 0=Male; 1=Female
Years @ present institution (IV) Actual number of years
Total years teaching (IV) Actual number of years
Years employed outside teaching (IV) Actual number of years
Highest degree held (IV) 1=Bachelor’s; 2=Master’s; 3=Specialist; 4=Doctor’s Salary level (IV) 1=25,000-29,999; 2=30,000-34,999; 3=35,000-39,999;
4=40,000-44,999; 5=45,000-49,999; 6=50,000-54,999; 7=55,000-59,999; 8=over 60,000
Marital status (IV) 0=Single; 1=Married
Certification route (IV) 0=Traditional; 1=Alternative
School Location (IV) 1=Rural; 2=Urban; 3=Suburban
Intent to remain (IV) 1=Leave at end of current school year; 2=Teach for several years before leaving teaching; 3=Retire as soon as I have 30 years in; 4=Teach as long as I can beyond 30 years
*Dependent Variable = DV; Independent Variable = IV
findings to a population represented by the sample group of participants (Gall, Borg, & Gall,
1996). Due to the cost involved in conducting interviews and the nature of this research study,
questionnaires were used to collect data from the participants. Questionnaires are used to collect
descriptive data or data that reveals a participant’s opinions, values, attitudes, and intentions, or
43
both descriptive and attitudinal data (True, 1989). The questionnaires used for this study
collected both descriptive data and attitudinal data.
An advantage of survey research is that it allows the researcher to collect a large amount
of information from a large group of people at a relatively inexpensive cost (Salant & Dillman,
1994). Other advantages include the fact that all the participants are asked the same questions,
large geographical areas can be covered easily, participants can fill out at their convenience, and
“private” information that is usually diff icult to collect can be reported. One disadvantage of the
research method is limited questionnaire length (Salant & Dillman). Dillman (2000) suggested
questionnaires be made to appear short and easy. Including a statement in the cover letter that
indicates, “responding should only take a few minutes” (Dillman, p. 18) can enhance the
appearance of ease of completion. Another disadvantage is that the researcher cannot control
participation and therefore runs the risk of possible low response rates.
Dillman (1978) developed the Total Design Method (TDM) for mail and telephone
surveys in 1978. The TDM for mail surveys looked at each aspect of the survey process and the
organization of the survey efforts in order to attempt to maximize the response rate obtained.
Since 1978, Dillman (2000) updated his methods, reevaluating each aspect of the TDM and
developing the Tailored Design Method. Dillman (2000) describes the Tailored Design as
follows:
the development of survey procedures that create respondent trust and perceptions of
increased rewards and reduced costs for being a respondent, which take into account
features of the survey situation and have as their goal the overall reduction of survey
error. (p. 27)

44
The TDM used one basic method for all survey situations. Dillman’s Tailored Design allows the
researcher to account for survey sponsorship, population, and content.
In the description of the Tailored Design, Dillman stated survey procedures should have
reduction of survey error as a goal. There are five types of errors that a researcher using survey
methods must attempt to control in planning the research project: sampling error, selection error,
frame error, non-response error, and measurement errors (Salant & Dillman, 1994). Rojewski
(2001) suggested use of an up-to-date list as a control for frame errors. Using a random sampling
method can control sampling error, or the chance of having a sample that is not representative of
the population. Purging the list of duplicates controls the chance of some sampling units having a
greater chance of being selected for participation than others, or selection error. Comparing early
responders to late responders can control non-response error. Using suitable, reliable, and valid
instruments controls measurement errors. Dillman’s (2000) Tailored Design was used as a guide
for this study.
Population and Sample Selection
Participants in this study consisted of secondary business education teachers in the state
of Georgia. A list of business educators and their addresses was obtained from the Georgia State
Department of Education in January 2004. Rojewski (2001) suggested use of an up-to-date list as
a control for frame errors, thus the li st was obtained at the latest possible date in order to have to
most up-to-date information. This list contained 1,601 names and addresses. The names of those
identified as teaching in elementary schools (n=6), middle school (n=283), post-secondary
(n=25), state level FBLA coordinator (n=1), and dupli cated names (n=2) were removed from the
list before the sampling process began. Duplicate names were removed to control selection error.

45
The remaining 1,284 names and addresses constituted the population from which the sample was
drawn.
Using a random sampling method can control sampling error, or the chance of having a
sample that is not representative of the population (Rojewski, 2001). A systematic random
sample was used to determine the sample for this study. The researcher using a systematic
sample goes through an ordered list of members of the population and selects every nth person
on the list where the number of entries on the list skipped is determined by the combination of
the size of the desired sample and the actual population size (Gall et al., 1996; Huck, 2000;
Moore, 2000). A table of random digits was used to select the first participant (3) and every
fourth (1284/297) person on the list was selected to receive the survey packet. According to
Huck (2000), “so long as the starting position on the list is determined randomly, each entry on
the full li st has an equal chance of ending up in the sample” (p.120).
It was estimated that 297 participants were needed to be able to generali ze to the
population of Georgia secondary business education teachers (Krejcie & Morgan, 1970).
Although Dillman (2000) suggested rates of return in the 70-77 % range, a more conservative
estimated rate of return of 50 % was used for this research. Using an anticipated rate of return of
50 %, 594 surveys were sent to the sample population. A total of 293 surveys were returned
completed for a response rate of 49.33%.
This sample of Georgia’s secondary business education teachers was predominately
female (80%). Participants ranged in age from 23 to 67 with an average age of 43 years and a
standard deviation of 10.43. Almost one third (32%) of the sample was over 50 years of age. Age
distributions for the sample included 35 (13%) in the 20-29 age bracket, 62 (23%) in the 30-39

46
age bracket, 89 (32%) in the 40-49 age bracket, 75 (27%) in the 50-59 age bracket, and 13 (5%)
in the over 60 age bracket.
The majority of teachers were married (78.6%). Most of the teachers received their
certification via the traditional route (73%) of certification, upon completion of a bachelor’s
degree, as opposed to receiving their certification through an alternate route (27%), post-bachelor
master’s degree. Of the 283 participants who indicated their level of education 27.9% (n = 79)
held at least a bachelor’s degree, 46% (n = 132) held a master’s degree, 22.5% (n = 66) held a
specialist degree, and 2.1% (n = 6) held a doctorate degree.
School location as identified by the participant was 42.8% rural, 14.5% urban, and 42.8%
suburban. The salary levels were evenly distributed among the ranges with the exception of the
lowest salary level, which had the least participant responses. Point seven percent (n=2) of the
participants indicated making in the $25,000-29,000 range, 9.3% (n=26) indicated making in the
$30,000-34,999 range, 15.7% (n=44) indicated making in the $35,000-39,999 range, 15.3%
(n=43) indicated making in the $40,000-44,999 range, 15.3% (n=43) indicated making in the
$45,000-49,000 range, 18.5% (n=52) indicated making in the $50,000-54,999 range, 7.8%
(n=22) indicated making in the $55,000-59,999 range, and 17.4% (n=49) indicated making in the
over $60,000 range.
Participants had an average of 14.53 total years teaching with as few as 1 year or as many
as 49 years reported. The average for years at the present i nstitution was 8.65 years with the
minimum number reported as .5 and the maximum number reported as 32 years. Years employed
outside teaching ranged from 0 years to 40 years with an average of 6.57 years. Table 3 shows
the minimum, maximum, mean, and standard deviation for these variables.
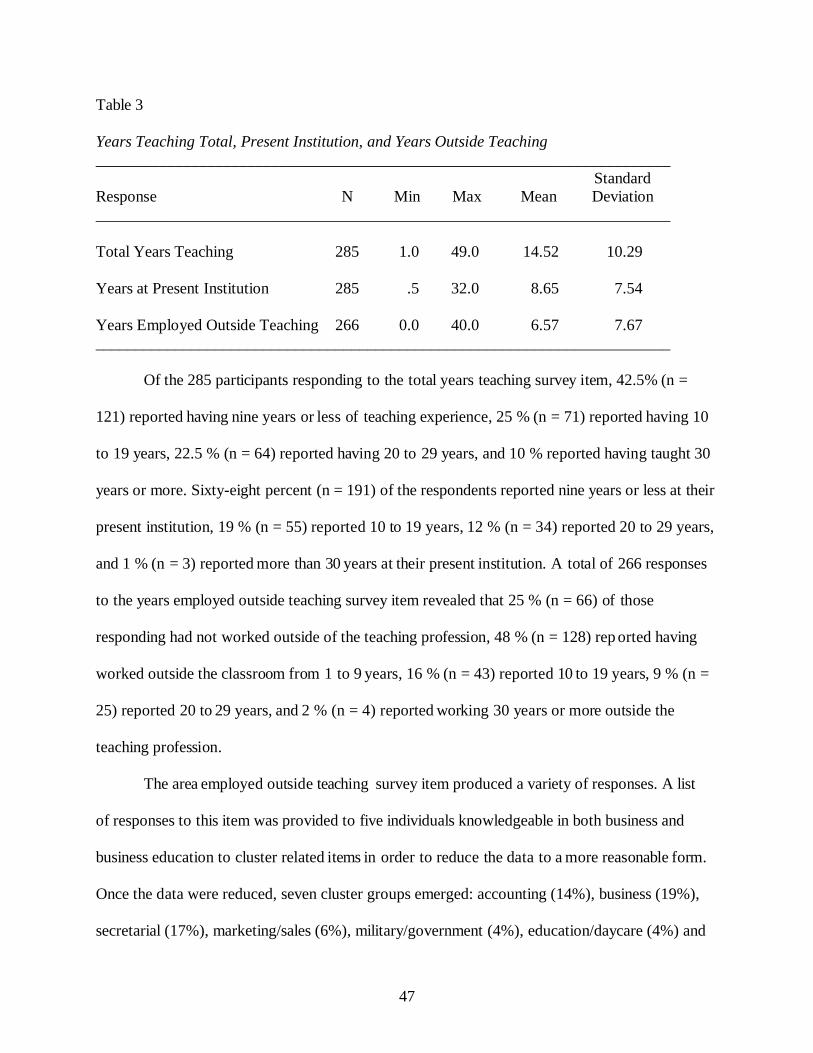
47
Table 3
Years Teaching Total, Present Institution, and Years Outside Teaching ________________________________________________________________________ Standard Response N Min Max Mean Deviation ________________________________________________________________________
Total Years Teaching 285 1.0 49.0 14.52 10.29
Years at Present Institution 285 .5 32.0 8.65 7.54
Years Employed Outside Teaching 266 0.0 40.0 6.57 7.67 ________________________________________________________________________
Of the 285 participants responding to the total years teaching survey item, 42.5% (n =
121) reported having nine years or less of teaching experience, 25 % (n = 71) reported having 10
to 19 years, 22.5 % (n = 64) reported having 20 to 29 years, and 10 % reported having taught 30
years or more. Sixty-eight percent (n = 191) of the respondents reported nine years or less at their
present institution, 19 % (n = 55) reported 10 to 19 years, 12 % (n = 34) reported 20 to 29 years,
and 1 % (n = 3) reported more than 30 years at their present institution. A total of 266 responses
to the years employed outside teaching survey item revealed that 25 % (n = 66) of those
responding had not worked outside of the teaching profession, 48 % (n = 128) reported having
worked outside the classroom from 1 to 9 years, 16 % (n = 43) reported 10 to 19 years, 9 % (n =
25) reported 20 to 29 years, and 2 % (n = 4) reported working 30 years or more outside the
teaching profession.
The area employed outside teaching survey item produced a variety of responses. A list
of responses to this item was provided to five individuals knowledgeable in both business and
business education to cluster related items in order to reduce the data to a more reasonable form.
Once the data were reduced, seven cluster groups emerged: accounting (14%), business (19%),
secretarial (17%), marketing/sales (6%), military/government (4%), education/daycare (4%) and

48
other (36%). It should be noted that some gave multiple responses to this item a nd are included
in more than one of the cluster groups. The other cluster included a wide variety among
responses such areas as construction, legal, real estate, insurance, consulting, restaurants,
librarian, service, landscaping, publishing, ministry, airlines, technology, and factories.
Instrumentation
The instruments used in this study were the Minnesota Satisfaction Questionnaire (MSQ)
(Weiss et al., 1967) and a researcher-developed personal data questionnaire. The MSQ was used
to measure job satisfaction of the participants. The personal data questionnaire was used to
gather descriptive data on the participants and for use in conjunction with the second and third
research questions.
Selection of the MSQ as the instrument to measure job satisfaction was based primarily
on two factors: it was designed to measure job satisfaction and it has been used previously to
measure job satisfaction of teachers. It is a well -known, often-used instrument and is recognized
as one of the best indicators of job satisfaction. Studies of job satisfaction of which used the
MSQ include Weiss, Dawis, England and Lofquist (1967), the study for which the MSQ was
developed; Hadaway (1978), Stitt (1980), Colli ns (1998), Goetze (2000), Alexeeff (2001), and
Hancer (2001). Hadaway (1978), Stitt (1980), and Colli ns (1998) used the MSQ to measure the
job satisfaction of teacher educators or career and technical education teachers. The MSQ was
developed at the University of Minnesota for use in the Work Adjustment Project that started in
1957. The major objectives of this project included the development of diagnostic tools for
assessing the work adjustment (job satisfaction) potential of applicants for vocational
rehabili tation and the evaluation of work adjustment outcomes. Weiss et al. theorized that job
satisfaction is dependent upon how closely a person’s abili ties match the requirements of the job

49
and the degree to which the person’s needs are met by the reinforcers in the work environment.
According to Herzberg, “factors that lead to positive job attitudes do so because they satisfy the
individual’s need for self-actualization in his work” (Herzberg et al., 1959, p. 114).
The MSQ was published in 1967 and revised in 1977. Normative scores for various
occupational groups are included in the manual for the MSQ. Scores from each MSQ scale are
converted to percentile scores to rate each individual’s level of satisfaction using the normative
charts in the MSQ manual. Percentile scores of 75 or higher represent a high degree of
satisfaction, scores of 26 to 74 represent average satisfaction, and scores of 25 or less represent
low satisfaction (Weiss et al., 1967). Percentile conversions were be used for comparison to the
normative data in the MSQ manual for teachers as a part of the analysis for research question one
which describes the job satisfaction of the sample and to establish which raw scores indicate
high, average, and low levels of satisfaction.
The MSQ is written on a fifth-grade level, takes an average of 15-20 minutes to
complete, and is self-administering (Weiss et al., 1967). The MSQ long form was used for this
study. Weiss et al. strongly recommended that the long form be used unless the researcher finds
that “the 15-20 minutes required by the long form to be absolutely impractical” (p. vii). The long
form consists of 100 items that measure 21 scales, the level of general job satisfaction and the
levels of satisfaction on 20 scales. Each scale of the 20 satisfaction scales is measured by 5 items
on the MSQ instrument. Huberty and Petoskey (1999) suggested the use of composite groups of
items to measure a single item stating that the, “use of a single item measure may be
questionable in terms of validity and reliabili ty” (p. 17). Twenty items including one from each
of the 20 scales measure the general satisfaction scale. Responses to each item are on a five-point
Likert scale ranging from very dissatisfied (a response of 1) to very satisfied (a response of 5).

50
The total score for any individual scale may range from 5 to 25, with five indicating very
dissatisfied and 25 indicating very satisfied. The 20 individual scales of the MSQ are abili ty
utili zation, achievement, activity, advancement, authority, company policies and practices,
compensation, co-workers, creativity, independence, moral values, recognition, responsibili ty,
security, social services, social status, supervision (human relations), supervision (technical),
variety, and working conditions. Table 4 describes each intrinsic and extrinsic scale using the
satisfaction item that correlated highest with scale score for a group of 1,793 employed
individuals (Weiss et al., 1967). The general satisfaction scale is comprised of one item from
each of the 20 scales of the MSQ.
Table 4
MSQ Scales and Descriptions
Scale Title Satisfaction Item
Intrinsic scales Abili ty utili zation The chance to do something that makes use of my abilit ies. Achievement The feeling of accomplishment I get form the job.
Advancement The chances for advancement on this job.
Recognition The praise I get for doing a good job.
Responsibili ty The freedom to use my own judgment.
Extrinsic scales
Company policies and practices The way company policies are put into practice.
Compensation My pay and the amount of work I do.
Co-workers The way my co-workers get along with each other.

51
Scale Title Satisfaction Item
Supervision-human relations The way my boss handles his men.
Supervision-technical The competence of my supervisor in making decisions
Working conditions The working conditions.
General Job satisfaction Comprised of 1 item from each of the 20 scales.
(Weiss et al., 1967, p. 1-2)
The MSQ scales that correlated with those intrinsic and extrinsic factors identified by Herzberg
were used in this study. Those intrinsic factors included Abili ty Utili zation, Achievement,
Advancement, Recognition, and Responsibili ty. Those extrinsic factors included
Company/School Policies and Practices, Compensation, Co-Workers, Supervision-Technical,
Supervision-Human Relations, and Working Conditions.
Permission was requested to use the MSQ for this study and to modify certain individual
MSQ items to be more appropriate for this population (see Appendix A). The wording was
changed on 18 of the 100 MSQ items. Two examples of these changes follow:
Question 10: Change from “The way my supervisor and I understand each other.” To
read “The way my department chairperson and I understand each other.”
Question 29: Change from “Company policies and the way in which they are
administered.” To read “School policies and the way they are administered.”
Hadaway (1978), Stitt (1980), and Colli ns (1998) made similar changes when they used the
MSQ.

52
Research of various occupational groups including teachers was used to determine the
content validity of the MSQ. According to Weiss et al. (1967), factor analysis results:
indicated that about half of the common MSQ scale score variance can be represented by
an extrinsic satisfaction factor, defined by the two supervision scales, company policies
and practices, working conditions, advancement, compensation and security. The
remaining scales define one or more intrinsic satisfaction factors, accounting for the other
half of the common variance. (p. 23)
Norms for teachers as an occupational group have been established and this served as evidence
of reliabili ty of the MSQ and its appropriateness as the instrument used in this study. Factor
analysis for teachers indicated, “the first factor was intrinsic satisfaction” and “accounted for
about two-thirds of the common variance” (Weiss et al., 1967, p.23). The two Supervision scales
and Co-workers and Recognition, giving the appearance of being related to people as a source of
satisfaction, defined the second factor for teachers.
Internal consistency of the MSQ was established using Hoyt’s analysis of variance
method for 27 occupational groups (Weiss et al., 1967). Hoyt reliabili ty coefficients for teachers
ranged from the high 70’s to the low 90’s for the 20 scales and the standard error of
measurement was less than 2 points on each of the 20 scales. Appendix B presents the normative
data and summary statistics for teachers. A test-retest correlation of the scores on the 20 MSQ
scales, excluding the general satisfaction scale, range from .66 to .91 for the one-week interval
and .35 to .71 for the one-year interval. The test-retest correlation for general satisfaction scale
scores resulted in a .89 coefficient for the one-week interval and a .70 coefficient for the one-
year interval. These high reliabili ty indexes indicated minimal error variance. The MSQ has
shown a reasonable level of reliabili ty over time and was thus considered a reliable instrument

53
for use in this study. Reliabili ty for this study was determined using Cronbach’s Alpha.
Reliabili ty for the 20 scales and the general satisfaction scale was .941. Reliabili ty for the five
intrinsic scales, six extrinsic scales, and the general job satisfaction scale analyzed in this study
was .898.
Personal Data Questionnaire
The researcher-designed personal data questionnaire (see Appendix C) was used to
collect basic demographic data on the sample of Georgia secondary business education teachers:
data on specific variables identified in the literature as having an effect on job satisfaction and
data on the individuals’ intent to remain in the teaching profession. Colli ns (1998), Stitt (1980),
and Hadaway (1978) collected similar demographic data. The personal data questionnaire
included the following items: gender, age, highest degree attained, route taken to certification,
total years teaching, years at present institution, location of school where currently teaching,
years employed outside teaching, area of that employment, marital status, salary range, and
intent to remain in the teaching profession.
Intent to remain in teaching was measured by a choice of four responses: leave at the end
of the current school year, teach several years before leaving teaching; retire as soon as I have 30
years in; or teach as long as I can beyond 30 years. These stems were adapted from the Nationa l
Center for Education Statistics (NCES) Schools and Staffing Survey (Bobbitt, Leich, Whitener,
& Lynch, 1994). The NCES Schools and Staffing Survey asked the question, “How long do you
plan to remain in this job” (p. 82), with the response choices as: As long as I am able; Until I am
eligible for retirement; Will probably continue unless something better comes along; Definitely
plan to leave as soon as I can; Undecided at this time. The state of Georgia all ows teachers to
retire after completion of 30 years of service. In order to distinguish between those whose intent
54
to remain only until they are eligible for retirement and those who intend to teach as long as
possible, the response stems were adjusted to reflect the 30 year marker. By including this
benchmark in the stem, it allowed years remaining to be calculated for each participant in those
response categories by subtracting the total number of years teaching from 30 years for those
indicating that they plan to leave teaching as soon as they have 30 y ears in and are eligible for
retirement. By doing this calculation, an indication of how many of the respondents would be
leaving within several years as a result of retirement was provided. The number of years
remaining for those who indicated that they plan to teach as long as possible beyond the 30 years
was calculated by subtracting the total number of years teaching from 50, the maximum number
of total years teaching reported plus one.
Data Collection Procedures
Before data collection began, permission was sought from the University of Georgia
Institutional Review Board (IRB) for Research Involving Human Subjects. The application was
submitted on December 20, 2003. The IRB approved all aspects of the research process that
involved human subjects. The approval form can be found in Appendix D.
Each participant was sent a packet that includes a cover letter (see Appendix E), the
Personal Data Questionnaire (see Appendix C), and the MSQ. Instructions for completing the
instruments were contained both in the cover letter and on the individual questionnaires. A well -
constructed, easy-to-complete questionnaire is only part of the plan and is not the main
determinant of response to mail surveys. Implementation procedures that influence response
rates include: “multiple contacts, the contents of letters, appearance of envelopes, incentives,
personalization, and sponsorship and how it is explained” (Dillman, 2000, p. 149). Participants
were contacted three times over the course of this research study. The cover letters were
55
personalized, stressed the importance of each participant’s response, and explained that the
research was being conducted through the University of Georgia.
The questionnaires were sent via the U.S. postal service on February 5, 2004, and
included a stamped, pre-addressed return envelope. A deadline of February 26, 2004, was
included in the cover letter in an effort to increase the speed of questionnaire return (Whipple &
Muffo, 1982). A follow-up maili ng was sent on February 26, 2004, to any participant who had
not responded. Successive follow-up reminders have been shown to increase response rates
(Dillman, 2000; Whipple & Muffo). A follow-up cover letter (see Appendix F) requested that
participants return the survey packet by March 18, 2004. A postcard follow-up (see Appendix G)
was mailed on March 18, 2004, to any participant who had still not responded. Two weeks from
the date of the postcard follow-up maili ng, March 30, 2004, were all owed for any responses to
be returned. In order to account for non-responders, all responses received from the initial
maili ng were considered early responders and any responses received after the February 26
follow-up maili ng were coded as late responders. Intrinsic and extrinsic job satisfaction scales as
identified by Herzberg for early and late responders were analyzed to determine if there was a
difference in their responses that might affect research outcomes. The results indicated that there
was no statistically significant difference at the .05 level in early and late responders on any of
the eleven tests conducted.
Data Analysis Procedures
Several methods of statistical analysis were utili zed in this study. The analysis of data
began with descriptive statistics. These statistics created a description of business education
teachers currently teaching in Georgia’s secondary public schools, their levels of satisfaction,

56
and their intent to remain in the teaching profession. The statistical procedures calculated for
each variable were means, standard deviations, and frequencies.
A Pearson correlation matrix was created to determine the strength of the relationships
between the individual MSQ scales that correlate with Herzberg’s intrinsic and extrinsic factors
and general job satisfaction. Those factors included intrinsic factors of abili ty utili zation,
achievement, advancement, recognition, and responsibili ty and extrinsic factors of
company/school policies and practices, compensation, co-workers, supervision-human relations,
supervision-technical, and working conditions. Pearson correlation coefficients were also
calculated for specific variables identified in the literature (age, gender, years at present
institution, total years teaching, years employed outside teaching, highest degree attained, salary
level) that may affect job satisfaction to determine the strength of their relationship to the overall
satisfaction of the participants.
Individual ANOVA’s were calculated for each of the intrinsic and extrinsic scale scores
and the intent to remain in the classroom. A familywise analysis was calculated for the intrinsic
and extrinsic scales identified by Herzberg for comparison with the intent to remain in the
classroom of Georgia secondary business education teachers in public schools. A Bonferoni
adjustment (Huck, 2000) was calculated in order to hold the overall alpha for the familywise
comparison to .05.
CHAPTER 4
ANALYSIS OF DATA
The purpose of this study was to describe the job satisfaction of business education
teachers in Georgia’s secondary public schools and determine the relationship between job
satisfaction and intent to remain in the profession. This chapter will address the data analysis
performed for each of the three research questions.
Job Satisfaction
Research Question one asked, “What is the level of satisfaction of business education
teachers in Georgia secondary public schools based on the Minnesota Satisfaction Questionnaire
(MSQ)?” Job satisfaction was measured using the Minnesota Satisfaction Questionnaire (MSQ).
Georgia secondary business education teachers are generally satisfied with their job. The general
satisfaction scale of the MSQ indicated an average score of 78.63 for this sample population.
Norms for teachers provided in the Manual for the Minnesota Satisfaction Questionnai re
indicated an average satisfaction score of 82.14 (Weiss et al., 1967). According to the manual a
score of “75 or higher is ordinarily taken to represent a high degree of satisfaction” (Weiss et al.,
p. 5). General satisfaction scale scores ranged from 20 to 100 with a standard deviation of 10.81.
Each MSQ scale was comprised of five items on the instrument. Scale scores on the MSQ ranged
from 5 to 25 with responses to each item ranging from a 1 for very dissatisfied to a 5 for very
satisfied. The responses were totaled for each item to get the composite raw scores (Weiss et al.,
1967; Huberty & Petoskey, 1999). Scale scores for this study included those scales identified by
Herzberg as intrinsic or extrinsic. Table 5 presents the descriptive statistics for those intrinsic and

58
extrinsic scales. Scales with the highest mean score included abili ty utili zation (21.26),
achievement (21.00), and responsibili ty (20.50), all identified by Herzberg as intrinsic in nature.
Table 5
Intrinsic and Extrinsic Descriptive Data
_____________________________________________________________________________
Std. Scale N Mean Deviation Intrinsic Scales
Abil ity Utilization (au) 292 21.26 3.42
Achievement (ach) 293 21.00 3.16
Advancement (adv) 291 17.23 4.50
Recognition (rec) 291 17.31 4.73
Responsibil ity (res) 293 20.50 3.08
Extrinsic Scales
Company (school) Policies And Practices (cpp) 293 16.62 4.79
Compensation (com) 293 16.43 4.49
Co-workers (cw) 293 19.86 4.20
Supervision-Human Resources (shr) 285* 19.50 4.62
Supervision-Technical (st) 285* 19.42 4.54
Working Conditions (wc) 292 19.26 4.58 (Min and Max for all scales were 5 and 25.) *Six MSQ instruments returned indicated that they were the department head or marked these items with n/a.
59
Scales with the lowest mean score included company (school) policies and practices (16.62) and
compensation (16.43), both identified by Herzberg as extrinsic in nature.
Authors of the MSQ instrument suggested that scales with scores over 75% (18.75
points) represent a high degree of satisfaction, while scores below 25% (6.25 points) represent a
low level of job satisfaction (Weiss et al., 1967). None of the scales considered in this study
indicated a low level of job satisfaction. All of the scale scores fell within the average (6.26-
18.74 points) satisfaction range or the high (18.75-25 points) satisfaction range indicating that
overall Georgia’s secondary business education teachers are experiencing a high degree of job
satisfaction. Intrinsic scales that fell into the high degree of satisfaction range included abili ty
utili zation, achievement, and responsibili ty. Extrinsic scales that fell into the high degree of
satisfaction range included co-workers, supervision-human relations, supervision-technical, and
working conditions. Intrinsic scales that fell into the average satisfaction range included
advancement and recognition. Extrinsic scales that fell into the average satisfaction range
included company (school) policies and practices and compensation scales.
Personal and Professional Variables
Research question two asked, “What is the relationship between general job satisfaction
of business education teachers in Georgia secondary public schools and personal and
professional variables identified in the literature that may have an effect on the job satisfaction of
teachers? ” Those variables include: age, gender, years in present institution (yearspi), total
years teaching (yearstch), years employed outside teaching (outyrs), highest degree attained
(hdgr), and salary level (salary).
A Pearson correlation matrix was constructed to determine the strength of relationship
between each of these variables and job satisfaction using the general satisfaction scale score
60
from the MSQ as the measure for job satisfaction. The correlation coefficient of determination
for the relationship between general job satisfaction and salary was statistically significant (r2=
.02) at the .05 level. None of the other variables showed a statistically significant relationship
with general job satisfaction.
Since salary showed a statistically significant relationship with general job satisfaction, it
is worth noting the other variables that indicated a statistically significant relationship with salary
even though they did not indicate a statistically significant relationship with general job
satisfaction. The variable salary showed statistically significant positive relationships at the .01
level with age (r2= .20), years at present institution (r2= .19), total years teaching (r2= .45), and
highest degree attained (r2= .44). This was expected since Georgia’s pay scale is based on years
of experience and level of degree held. Years of teaching (r2= .47), years at present institution
(r2= .19), and highest degree obtained (r2= .03) also had a statistically significant positive
correlation with age at the .01 level. Years employed outside teaching (r 2= -.27) indicated a
statistically significant negative relationship at the .01 level with age. Table 6 presents the
Pearson correlation coefficients (r), the adjusted Pearson correlation coefficients (r2),
significance levels, and the number of respondents (N) to each of the variables identified in the
literature.
Intent to Remain
Research question three asked, “What is the comparison between the intent to remain in
the classroom of Georgia secondary business education teachers in public schools and the
selected intrinsic and extrinsic scales of job satisfaction as identified by Herzberg ?” The variable
intent to remain indicated that the highest percentages of participants (43.3%, n=123) intend to
retire with 30 years. Six point seven percent (n=19) indicated intent to leave at the end of the

61
Table 6
Pearson Correlation Coefficients Gen Gender Age Yearsspi Yearstch Outyrs Hdgr
Gender r .05 r2 .00 Sig. .40 N 294 Age r .06 .16(** ) r2 .00 .03 Sig. .35 .01 N 276 276 Yearspi r .08 .25(** ) .44(** ) r2 .01 .07 .19 Sig. .18 .00 .00 N 285 284 276 Yearstch r .08 .24(** ) .68(** ) .65(** ) r2 .01 .06 .47 .43 Sig. .19 .00 .00 .00 N 285 284 276 285 Outyrs r -.05 -.14(*) -.27(**) -.27(**) -.40(** ) r2 .00 .02 .07 .07 .16 Sig. .38 .02 .00 .00 .00 N 266 266 259 266 266 Hdgr r .07 -.00 .17(** ) .23(** ) .30(** ) -.10 r2 .00 .00 .030 .05 .09 .01 Sig. .27 .97 .00 .00 .00 .09 N 283 282 274 283 283 264 Salary r .13(* ) .07 .45(** ) .43(** ) .67(** ) -.27(**) .66(** ) r2 (.02) (.01) (.20) (.19) (.45) (.07) (.44) Sig. .04 .22 .00 .00 .00 .00 .00 N 281 281 274 281 281 264 279 Note. General job satisfaction is represented by the variable “Gen.” * Correlation is significant at the 0.05 level (2-tailed). ** Correlation is significant at the 0.01 level (2-tailed).

62
current year, 32.7% (n=93) indicated intent to teach for several more years before leaving
teaching, and 17.3% (n=49) indicated intent to teach as long as they can beyond 30 years. Using
these responses, a new variable, ESTLONG, was created to better express the intent in a
numerical figure. This variable converted the responses to the intent to remain variable for those
who responded either “retire as soon as I have 30 years in” or “teach as long as I can beyond 30
years” into an estimated number of years left to teach. The response “ retire as soon as I have 30
years in” was converted by subtracting the item response for the total years of teaching from 30.
The “teach as long as I can beyond 30 years” was converted by subtracting the response for the
total years teaching from 50. Fifty years was used based on the longest response (49) to the
number of years teaching item. Frequencies were then run for the ESTLONG variable. Over half
(51.4%) of the participants intend to teach less than 10 more years. Less than 10% of the
participants intend on teaching beyond 30 years from now.
A series of one-way ANOVA’s were run pairing each intrinsic and extrinsic scale score
to the intent to remain variable with an alpha of .05. The results of the one-way ANOVAs
comparing each intrinsic variable to the intent to remain variable indicated a significant effect for
abili ty utili zation, achievement, advancement, and responsibili ty. The recognition variable was
not found to have a statistically significant effect on the intent to remain variable. The results of
the one-way ANOVAs comparing each extrinsic variable to the intent to remain variable indicted
a statistically significant effect for only two of the six variables: company/school policies and
practices and working conditions. No statistically significant effect was indicated for
compensation, supervision-human resources, supervision-technical, or co-workers. Table 7 and
Table 8 show the means, standard deviations and analysis of variance for intent to remain in
teaching and those intrinsic and extrinsic variables.

63
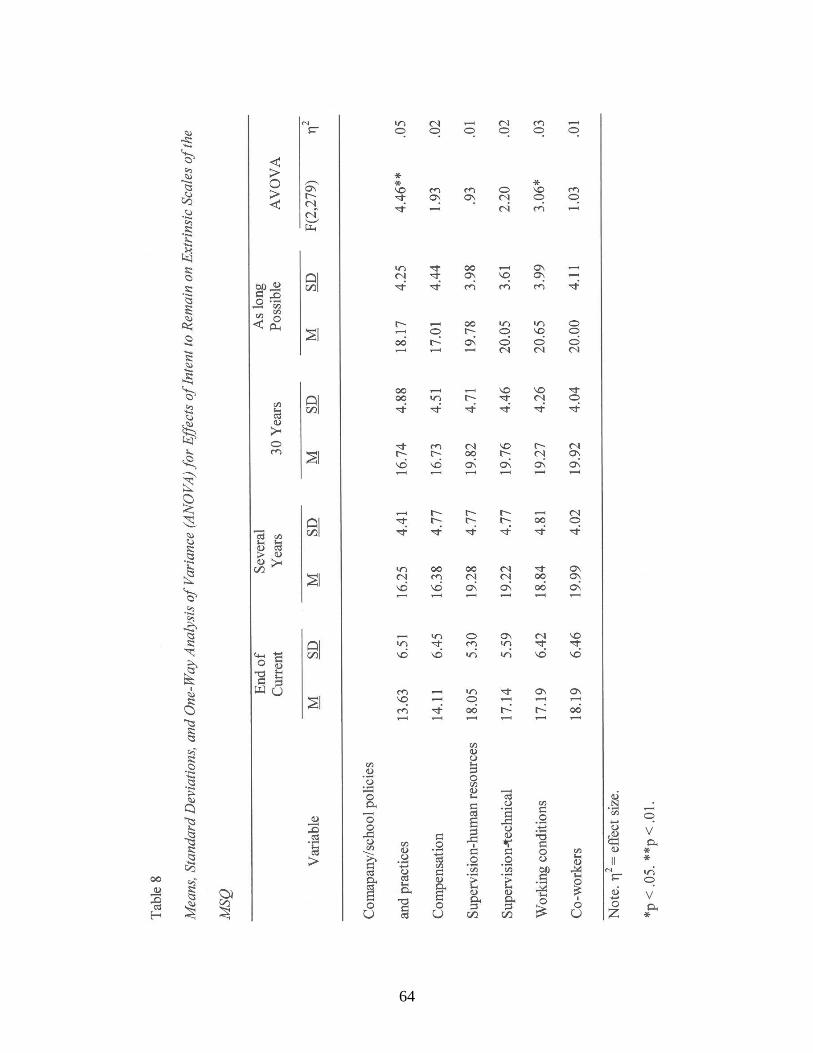
64

65
A familywise analysis of the group of intrinsic scales and the group of extrinsic scales was
performed. A Bonferoni adjustment was made to the alpha level in order to keep the familywise
alpha at .05. The Bonferoni adjustment procedure (Huck, 2000) divides the alpha by the number
of variables in the family or group so that the total of all the alpha’s does not exceed the .05
level. The Bonferoni correction for the intrinsic family of variables was .01 (.05/5). The
familywise analysis of the intrinsic variables indicated the intrinsic variable abili ty utilization
showed a statistically significant difference at the .01 level for each of the four groups with every
other group, those intending to leave at the end of this year (p=.000), teach for several more
years (p=.000), with 30 years (p=.000), and teach as long as possible (p=.000). Those intending
to leave teaching at the end of this year showed a statistically significant difference at the .01
level with those who intended to retire as soon as the have 30 years (p=.008) and those intending
to remain in teaching as long as possible (p=.001) on the achievement variable. The variable
advancement indicated a statistically significant difference at the .01 level between those
intending to leave teaching at the end of this year and those intending to teach as long as possible
(p=.001).. The Bonferoni correction for the extrinsic family of variables was .0083 (.05/6). The
familywise analysis of the extrinsic variables indicated a statistically significant difference at the
.0083 level in those who expressed their intent to remain as leaving at the end of this year and
those who plan to teach as long as possible on the variable company/school policies and
procedures (p=.003). None of the other extrinsic variables indicted a statistically significant
difference among any of the intent groups.

CHAPTER 5
CONCLUSIONS AND RECOMMENDATIONS
This chapter presents a discussion of the conclusions drawn from the data and
recommendations for further research or program development.
A shortage of teachers has existed over the past several years both nationally and in the
state of Georgia. Trapps (2001) indicated “By 2011, the shortfall nationwide is expected to reach
2 milli on teachers” (p. A.22). Blair (2003) indicated that vacancies persist in Georgia. Secondary
business education has not been exempt from this shortage. Business education has experienced
a reprieve in the teacher shortage due to the declining economy which has created a situation
where people formerly employed in the business sector are now earning teaching certification.
The shortage, however, may reemerge as the economy picks back up. Business education
continues to remain on the 2004-2005 critical shortage list for the Georgia HOPE teacher
scholarship program. While it may appear fewer individuals are choosing teaching as a career, it
is also worth noting that approximately 50% of new teachers are leaving the profession within
their first three to five years to pursue other careers (Darling-Hammond, 2001; Dawson, 2001;
Ingersol, 2002). Ruhland (2001) stated, “Teachers who are satisfied with their careers tend to
remain in the profession longer” (p. 215). Olson (2000) indicated that new teachers improve
dramatically during their first few years of teaching; and therefore, it is critical to retain those
teachers long enough for them to reach their full potential. Determining what factors satisfy
secondary business education teachers in Georgia’s public schools may help retain teachers in

67
the profession longer and help alleviate the current shortage situation. As a business education
department chairperson charged with hiring and retaining quali ty business education teachers,
determining what influences a teacher’s intent to remain in the classroom was the major impetus
behind this study.
Demographic variables found in the literature as commonly considered in studies of job
satisfaction in general and job satisfaction of teachers included age, gender, years at present
institution, total years teaching, years employed outside teaching, highest degree held, salary
level, marital status, certification route, and school location.Variables that were considered in
this research included age, gender, years at present institution, total years teaching, years
employed outside teaching, highest degree held, salary level, marital status, certification route,
and school location. Pearson correlations were calculated to determine the relationship of the
variables to general job satisfaction. The intent to remain variable was compared with those
intrinsic and extrinsic scale factors to determine which affected the level of intent to remain. The
scales used for this study were abili ty utilization, achievement, advancement, company/school
policies and practices, compensation, co-workers, recognition, responsibili ty, supervision
(human relations), supervision (technical), and working conditions. These scales were used
because of their correlation with the intrinsic and extrinsic factors identified by Herzberg’s
(1966) Two-Factor theory.
The purpose of this study was to describe the level of job satisfaction of business
education teachers in Georgia’s secondary public schools and determine the relationship between
job satisfaction and intent to remain in the profession. The specific research questions that were
addressed were:

68
1. What is the level of job satisfaction of business education teachers in Georgia secondary
public schools?
2. What is the relationship between job satisfaction of business education teachers in
Georgia secondary public schools and personal and professional variables identified in
the literature that may have an affect on the job satisfaction of teachers? Those variables
include: age, gender, years at present institution, total years teaching, years employed
outside teaching, highest degree attained, and salary level.
3. What is the comparison between the intent to remain in the classroom of Georgia
secondary business education teachers in public schools and select intrinsic and extrinsic
scales of job satisfaction as identified by Herzberg?
Conclusions
The following conclusions are based on the data presented in Chapter I V:
1. Georgia’s secondary business education teachers are generally satisfied with their job.
The general satisfaction scale score of the MSQ indicated an average score of 78.63,
which represents a high degree of satisfaction according to the Manual for the M innesota
Satisfaction Questionnaire (Weiss et al., 1967). This is also in alignment with the norms
for teachers provided by the Manual for the Minnesota Satisfaction Questionnaire, which
indicated an average scale score on the general satisfaction scale of 82.14. Those job
satisfaction scales identified by Herzberg as intrinsic in nature satisfy Georgia’s
secondary business education teachers more than those scales identified by Herzberg as
extrinsic in nature. Scales with the highest mean scores were abili ty utili zation
(m=21.26), achievement (m=21.00), and responsibili ty (m=20.50). Scales with the lowest
mean scores were company (school) policies and practices (m=16.62) and compensation
69
(m=16.43). None of the individual scale scores fell into the low level of job satisfaction.
All of the intrinsic and extrinsic scales indicated either average or high levels of job
satisfaction in those areas.
2. The personal and professional variables identified in the li terature as having an effect on
the general job satisfaction of teachers did not indicate a significant effect for this sample.
Secondary business education teachers in Georgia are predominately female (80%),
married (78.6%), and received their certification through the traditional route (73%).
Pearson correlations indicated a statistically significant relationship between the general
job satisfaction scale and salary (r2=.02). However, this only explains 2% of the variance
in the level of general job satisfaction and therefore is not very practically significant.
Gender, total years teaching, years at present institution, years outside teaching and
highest degree obtained indicated no significant effect on the general job satisfaction of
Georgia’s secondary business education teachers. Colli ns (1998) also found that age and
years of experience were not significantly correlated to the teacher’s degree of general
job satisfaction.
3. Over half of the secondary business education teachers in Georgia intend to leave the
profession within the next 10 years. Thirty-three percent intend to teach for a few more
years before leaving teaching, and 43% intend to retire as soon as they have 30 years in.
With the decline in the economy, the shortage of teachers experienced in recent years is
experiencing a reprieve (Blair, 2003; Sausner, 2003; Stripling, 2003). When the “retire as
soon as I have 30 years in” response was converted into an estimated years to remain in
teaching, a total of 51.4% intended to teach less than 10 more years. Couple this with the

70
fact that up to 50% of new teachers leave the profession within their first three years and
a shortage could very easily reemerge.
Discussion
The results of this study are likely to reflect the population of Georgia secondary business
education teachers; however, it is not clear whether they would reflect beyond that group to
Georgia teachers or teachers in general. The reason for this caution is that for a population size of
1294, Krejcie and Morgan (1970) indicated an estimated sample size of 297 was needed to
generalize to the population the sample represents. Responses to the various items/scales in this
study ranged from n=266 to n=293, just short of the recommendation of Krejcie and Morgan. An
estimated 50% rate of return was used and the actual rate of return was 49.33%.
Business education teachers in Georgia’s public schools are generally satisfied with their
job. The higher scale scores were those associated with factors identified as intrinsic in nature.
Secondary business education teachers in Georgia’s public schools are most satisfied by the
opportunity to utili ze their abili ties and a sense of achievement and responsibili ty. The lower
scale scores were those associated with factors identified as extrinsic in nature. They are least
satisfied with company/school policies and procedures and their working conditions. None of the
scale scores indicated a low level of satisfaction. It appears that their level of satisfaction is not
affected by their age, gender, education level, or number of years spent in or out of the
classroom. The personal and professional variables indicated some statistical significance in the
relationship between general job satisfaction and salary level. It is not practical to think that an
adjustment in the salary of secondary business education teachers in Georgia’s public schools
would greatly increase their job satisfaction since this only accounted for 2% of the variance in
the job satisfaction variable. It still holds true that teacher satisfaction “does not come from

71
money” (Thompson, 1979, p. 43). The fact that the salary variable indicated a statistically
significant result does, however, support the idea that salary levels must be adequate to satisfy
hygiene needs (Frase, 1989; Maslow, 1970). Other factors interacted with each other as expected
based on the structure of Georgia’s salary schedule. Since the salary scale in Georgia is based on
level of education and years of teaching experience, it was no surprise that salary was highly
correlated with those two variables and the age variable. With salary accounting for only 2% of
the variance in the job satisfaction variable, it leaves the question of what accounts for the other
98%.
Although secondary business education teachers in Georgia’s public schools indicated
that they are experiencing a high level of overall job satisfaction, many are still l eaving the
profession. Over half of the secondary business education teachers participating in this study
indicated they plan to leave teaching within the next 10 years. With the exception of the
recognition variable, all of the intrinsic variables indicated a significant effect on the teachers’
intent to remain in the classroom. The only extrinsic variables indicated as having an effect on
the intent to remain variable were the company /school policies and procedures variable and the
working conditions variable. The intrinsic and extrinsic variables indicating an effect on the
intent to remain variable accounted for 34% of the variance in the teacher’s intent to remain in
the classroom.
Recommendations
These recommendations for research and practice were based on the finding and
conclusions of this study.
1. Since there appears to be a possibili ty of the shortage of secondary business education
teachers in Georgia returning, it is recommended that further study be conducted to

72
determine those areas of satisfaction for secondary business education teachers in
Georgia. By nature, the design of this study all owed for the collection of much
information about this sample. It allowed for breadth rather than depth of information.
The design of such further study should be one of a qualitative nature in order to get more
in-depth information regarding those factors influencing both teacher job satisfaction and
intent to remaining the profession .
2. It is also recommended that the personal and professional variables analyzed in this study
be included in future studies more for descriptive purposes than for any effect they may
or may not have on job satisfaction. Age, marital status, certification route, highest
degree, salary range, years at present institution, and years outside teaching provide
demographic information on the sample. The variable years teaching also provided
demographic information about the sample. The variable years teaching also provided a
basis for quantifying the intent to remain variable allowing for the conversion into a
numerical value.
3. Further investigation should be conducted on the variable abili ty utilization. The four
groups of intent responses varied significantly on this variable. A qualitative study should
be conducted to further investigate and elaborate on those differences. This study should
include the achievement, advancement, and company (school) policies and procedures
variables since they also indicated differences among the levels of intent to remain.
4. Company/school policies and practices indicated a statistically significant relationship
with the intent to remain variable. School principals and career and technical education
administrators and supervisors should attempt to determine the company/school policies
and procedures that concern secondary business education teachers in Georgia’s public

73
schools in order to evaluate those practices and procedures and determine if there is a
better way of handling them.
5. Working conditions indicated a statistically significant relationship with the intent to
remain variable. School principals and career and technical education administrators and
supervisors should attempt to determine the working conditions that concern secondary
business education teachers in Georgia’s public schools in order to determine if
improvements on those conditions could be made.
Attracting and retaining highly qualified teachers in the business education classroom is
becoming more urgent due to the shortage and the No Child Left Behind education legislation
promise that every child will have a highly qualif ied teacher in the classroom. (National
Commission on Teaching and America’s Future, 2003). It is important for school principals and
career and technical education administrators and supervisors to acknowledge the connection
between job satisfaction and intent to remain in teaching and aggressively seek opportunities to
support that connection. Since the company/school policies and practices and working con ditions
factor scales varied for those who indicated intent to remain until the end of the current school
year and those who indicated intent to teach as long as possible, school principals and career and
technical supervisors should include as part of their induction programs an overview of the
company/school policies and a discussion of the general working conditions that the new teacher
will face. This overview/discussion should allow for ample question and answer time to allow
the new teacher to have any questions clarified. This process should be repeated periodically
over the life of the induction program since the new teacher may not know what questions to ask
at the beginning of his/her career. Hopefully, by helping new teachers have a better

74
understanding of the working environment, they will be more inclined to remain in the
classroom.
Business education teachers in Georgia’s secondary public schools are generally satisfied
with their jobs. School principals and career and technical supervisors should continue to provide
those opportunities for abili ty utili zation, achievement, advancement, and responsibili ty since
these are the intrinsic factors that indicated having an effect on teacher’s intent to remain in the
classroom. These are all factors of job satisfaction and as Ruhland (2001) indicated, “Teachers
who are satisfied with their careers tend to remain in the profession longer” (p. 215). The goal is
to retain quality teachers in the business education classroom, and thus job satisfaction should be
an area of interest to all those charged with hiring and retaining teachers.

References
A Guide to Alternative Certification: Beginning a career in teaching for mid-career professionals
(2003). Retrieved April 7, 2003, from http://www.businesstoteaching.org/docs/
guide_AltCert.pdf
Acker, S. (1989). Rethinking teachers’ careers. In S. Acker (Ed.), Teachers, gender, and careers
(pp. 7-20). New York: The Falmer Press.
Adams, L. W. (1999). Job satisfaction and work behavior in a university department.
Dissertation Abstracts International, 60 (6). (UMI No. AAT9934196).
Alexeeff, V. V. (2001). Monitoring public employee response to change: Use of organizational
commitment and job satisfaction measures. Dissertation Abstracts International , 63 (09).
(UMI No. AAT3065756).
Badertscher, N. (2001, August). Teacher shortage on horizon in Georgia. Knight Ridder/Tribune
Business News. Retrieved March 24, 2003, from http://web5.infotrac-college.com/
wadsworth/session/845/823/3343…/3!xrn_2_0_CJ6444627
Bandeira de Mello, V., & Broughman, S. R. (1996). 1993-94 schools and staffing survey:
Selected results (NCES 96-312). Washington, DC: National Center for Education
Statistics.
Barber, P.A. (1980). Job satisfaction of elementary and secondary teachers. Dissertation
Abstracts International, 41 (04). (UMI No. AAT8023580).
Beck, R. C. (2000). Motivation: Theories and principles. Upper Saddle River, NJ: Prentice-Hall.

76
Beck, S. E. (2002). Civil service engineers after the Cold War: An examination of job
satisfaction. Dissertation Abstracts International, 63 (04). (UMI No. AAT3049884).
Berry, B. (2001). No shortcuts to preparing good teachers. Educational Leadership, 58(8), 32-5.
Bess, J. L. (1977) The motivation to teach. Journal of Higher Education, 48, p. 243-258.
Billi ngsley, B. S. (1993). Teacher retention and attrition in special and general education: A
critical review of the literature. Journal of Special Education, 27(2), 137-75.
Birmingham, J. A. (1984). Job satisfaction and burnout among Minnesota teachers (stress,
morale). Dissertation Abstracts International, 45 (8). (UMI No. AAT8418447).
Bishop, F. G. (1996). A study of job satisfaction among community college student personnel
professionals. Dissertation Abstracts International, 57 (12). (UMI No. AAT9717696).
Blair, J. (2001). Alterative teacher program trains hundreds in Ga. Education Week, 21(1), 24,32.
Blair, J. (2003). Budget troubles lesson demand for teachers [Electronic version]. Education
Week, 23(1), 10.
Bobbitt, S. A., Leich, M. C., Whitener, S. D., & Lynch, H. R. (1994). Characteristics of stayers,
movers, and leavers: Results from the Teacher Follow-up Survey: 1991-92. Washington,
DC: National Center for Educational Statistics.
Bobek, B. L. (2002). Teacher resili ency: A key to career longevity. Clearing House, 75(4), 202-
205.
Bookman, M. Z. (2000). The third career: Revisiting the home vs. work choice in middle age.
Westport, Conn.: Praeger.
Bradley, A. (1998). Expiring ‘Troops to Teachers’ project outfits classrooms with professional in
demand. Education Week, 10/14/1998. Retrieved March 28, 2003, from http://www.
ncei.com/EdWeek101498.htm
77
Bright, M. L. (2002). Job satisfaction as an indicator for retention of new community college
instructional faculty. Dissertation Abstracts International, 63 (05). (UMI No.
AAT3053030).
Burch, D. (2003, March 24). Board may hire foreign educators. Marietta Daily Journal, pp. B1,
B4.
Carr-Saunders, A. M., & Wilson, P.A. (1933). The professions. Oxford: Oxford University Press.
Certo, S. C. (1997). Modern management (7th ed.). Upper Saddle River, NJ: Prentice-Hall.
Chapman, D. W., & Green, M. S. (1986). Teacher retention: A further examination. Journal of
Educational Research, 79(4), 273-279.
Chapman, D. W. (1984). Teacher retention: The test of a model. American Educational research
Journal, 21(3), 645-658.
Chavetz , J. S. (1997). I need a (traditional) wife!’ : Employment-Family conflicts. In D. Dunn
(Ed.), Workplace/woman’s place: An anthology (pp.116-124). Los Angeles: Roxbury
Publishing Company.
Christmas, B. (2001). Foundation task force recommends ways to recruit and retain good
teachers. PAGE ONE Magazine, 23(2), 16-17.
Clement, M. C. (2000). Building the best faculty: Strategies for hiring and supporting new
teachers. Lanham, MD: Scarecrow.
Clifford, G. J. (1991). ‘Daughters into teachers’ : Educational and Demographic Influences on the
transformation of teaching into ‘women’s work’ in America. In A. Prentice & M. R.
Theobald (Eds.) Women who taught: Perspectives on the history of women and teaching
(pp. 115-135). Toronto, Canada: University of Toronto Press.

78
Coeyman, M., Jonsson, P., Teicher, S. A., & Wiltenburg, M. (2001). America’s widening teacher
gap [electronic library]. The Christian Science Monitor , 7/17/2001, 1. Retrieved March
15, 2003, from http://web14.epnet.com/delivery.asp?tb=1&_ug=dbs+0+fic+48+1n+en-
us+sid+74D62926
Colli ns, G. M. (1998). The job satisfactions of agricultural education teachers in Georgia’s
public secondary schools. Unpublished doctoral dissertation. University of Georgia,
Athens, GA.
Darling-Hammond, L. (1997). Doing what matters most: Investing in quality teaching. New
York: National Commission on Teaching and America’s Future.
Darling-Hammond, L. (2001). The challenge of staffing our schools. Educational Leadership,
58(8), 12-17.
Darling-Hammond, L. (2003). Keeping good teachers: why it matters. Educational Leadership,
59(5), 6-13.
Dawis, R. V. & Lofquist, L. H. (1984). A pshcyological theory of work adjustment: An
individual-differences model and its applications. Minneapolis, MN: University of
Minnesota Press.
Dawson, T. A. (Ed.). (2001, June). Filli ng the gap: Can better recruitment, orientation, and
benefits programs help beat the teacher shortage? Teachers Insurance and Annuity
Association — College Retirement Equities Fund (TIAA-CREF), New York.
Dillman, D. A. (1978). Mail and telephone surveys: The total design method. New York: Wiley.
Dillman, D. A. ( 2000). Mail and internet surveys: The tailored design method. New York:
Wiley.

79
Ely, T. C. (1993). Job satisfaction of public school teachers in Ohio: A comparison of the
similarities and differences between male and female teachers. Dissertation Abstracts
International, 55 (01). (UMI No. AAT9416169).
Feistritzer, C. E. (1999). Teacher Quality and Alternative Certification Programs. Testimony
before the House Committee on Education and the Workforce Subcommittee on
Postsecondary Education, Training and Life-Long Learning. Retrieved March 28, 2003,
from http://www.ncei.com/Testimony051399.htm
Finn, C. E. & Madigan, K. (2001). Removing the barriers for teacher candidates. Educational
Leadership, 58(8), 29-31, 36.
Frase, L. E. (1989). Effects of teacher rewards on recognition and job enrichment. Journal of
Educational Research, 83(1), 25.
Funderburg, D. L. (1996). The work values and job satisfaction of business educators in
secondary school systems and community-technical colleges in Arkansas. Dissertation
Abstracts International, 57 (08). (UMI No. AAT9701626).
Gall, M. D., Borg, W. R., & Gall, J. P. (1996). Educational research: An introduction (6th ed.).
White Plains, NY: Longman.
Georgia Professional Standards Commission (2002). Georgia TAPP: Program framework and
requirements. Retrieved July 29, 2002, from http://www.gapsc.com/GaTapp/description/
description_home.asp
Georgia Student Finance Commission (2000). Georgia’s HOPE scholarship program: HOPE
teacher scholarships for graduate study in critical shortage fields. Tucker: April 2000.
Georgia Student Finance Commission (2002). HOPE teacher scholarship. Retrieved July 29,
2002, from http://www.gsfc.org/GSFC/SCL/dsp_teacher_scholarship.cfm

80
Georgia Student Finance Commission (2004). Hope teacher scholarship. Retrieved July 2, 2004,
from http://www.gsfc.org/gsfa/SCL/dsp_teacher_scholarship.cfm
Georgia Systematic Teacher Education Program (2003). Retrieved September 21, 2003, from
http://www.coe.uga.edu/gstep/
Georgia Troops-to-Teachers (2003). Retrieved April 7, 2003, from http://www.tttga.net
Givins, R. Y. (1988). Job satisfaction of vocational office education teachers in Tennessee as
determined by selected demographic factors. Dissertation Abstracts International, 50
(02). (UMI No. AAT8904056).
Glenn, J. M. (1999). Mentors in business education: Linking the past and the future. Business
Education Forum, 54(1), 6-11.
Glenn, J. M. (2003) Spotlight on teacher certification. Business Education Forum, 57(3), 14-15.
Goetze, S. L. (2000). Intent to remain in an organization: The relationship between job
satisfaction, satisfaction with li fe, work environment, and selected demographic variables
for workers in traditional and non-traditional work environments within an HR/payroll
company. Dissertation Abstracts International , 61 (11). (UMI No. AAT9994508).
Hadaway, F. J. (1978). Selected personal characteristics related to job satisfaction of public high
school teachers. Doctoral dissertation, University of Georgia. (University Microfilms No.
79-01, 640).
Haddad, N. A. (1989). Why nurses stay: The relationship of personali ty to job and career
satisfaction (job satisfaction). Dissertation Abstracts International, 51 (02). (UMI No.
AAT9017040).

81
Hancer, M. (2001). An analysis of psychological empowerment and job satisfaction for
restaurant employees. Dissertation Abstracts International , 62 (04). (UMI No.
AAT3011067).
Harris, L., & Associates, Inc. (1995). The American teacher 1984-1995: Metropolitan Life
Survey, old problems, new challenges. New York, NY: Metlife. (ERIC Document
Reproduction Service No. ED 392783).
Haywood, G. D. (1980). The relationship of job satisfaction, job satisfactoriness and personal
characteristics of secondary school teachers in Georgia. Dissertation Abstracts
International, 41 (04). (UMI No. AAT823145).
Herzberg, F. (1966). Work and the nature of man. Cleveland: World Publishing.
Herzberg, F., Mausner, B., & Snyderman, B. B. (1959). The motivation to work. New York: John
Wiley & Sons.
Hinds, M. D. (2002). Teaching as a clinical profession: A new challenge for education. Carnegie
Challenge 2002. New York: Carnegie Corporation.
Hoffman, N. (1981). Woman’s “ true” profession: Voices from the history of teaching. New
York: Feminist Press and McGraw-Hill .
Hope, W. C. (1999). Principals’ orientation and induction activities as factors in teacher
retention. Clearing House, 73(1), 54-56.
Huberty, C.J. & Petoskey, M.D. (1999). Use of multiple correlation analysis and multiple
regression analysis. Journal of Vocational Education Research, 24, 15-43.
Huck, S. W. (2000). Reading statistics and research (3rd ed.). New York: Longman.
Ingersoll, R. M. (2002) Holes in the teacher supply bucket. The School Administrator, 59(3),
43-3.

82
Johnson, D. A. B. (1995). University of Georgia home economics education graduates an
assessment of the influences on their career outcomes. Dissertation Abstracts
International, 56 (08). (UMI No. AAT9540499).
Kopp, W. (2000). Ten years of Teach for America [Electronic version]. Education Week, 19(41),
48, 52-53. Retrieved July 29, 2002, from http://www.edweek.org/ew/
ewstory.cfm?slug=41kopp.h19
Krejcie, R. V. & Morgan, D. W. (1970). Detemining sample size for research activities.
Eductional and Psychological Measurement, 30, 607-610.
LaBonty, D. J. (1999). Business education in the United States: 1997-1998 NABTE survey
results. NABTE Review, 26, 9-17.
Lofquist, L. H. & Dawis, R. V. (1991). Essentials of person-environment-correspondence
counseling. Minneapolis, MN: University of Minnesota Press.
Lortie, D. C. (1975). Schoolteacher: A sociological study. IL: University of Chicago Press.
Martin, L. & Kragler, S. (1999). Creating a culture for teachers’ professional growth. Journal of
School Leadership, 9(4), 311-20.
Maslow, A. H. (1970). Motivation and personality (2nd ed.). New York: Harper & Row.
Maslow, A. H. (1987). Motivation and personality (3rd ed.). New York: Harper & Row.
McCoubrey, M. (2001) Recruiting teachers from abroad. Techniques, 76(5), 33-34.
Medved, J. A. (1982). The applicabili ty of Herzberg’s motivation-hygiene theory. Educational
Leadership, 39, 555.
Moore, D. S. (2000). The basic practice of statistics (2nd edition). New York: W. H. Freeman &
Company.

83
National Association of State Boards of Education (2002). State teacher incentives poorly
targeted, study says. Education USA, 44(23), 3.
National Center for Education Information (NCEI) (2003). Alternative teacher certification: A
state-by-state analysis 2003. Retrieved March 23, 2003, from:
http://www.ncei.com/2003/executive_summary.htm
National Commission on Teaching and America’s Future (NCTAF) (2003). No dream denied, A
pledge to America’s children. Retrieved July 19, 2003, from: http://www.nctaf.org
Noble, R. (2001). Who will teach our children. Educator: 2001 Legislative Agenda. Georgia
Association of Educators.
Okula, S. (1999). The coming crisis: A shortage of business educators. Business Education
Forum, 53(4), 6-12.
Olson, L. (2000). Finding and keeping competent teachers. Education Week, 19(18), 12-18.
Pascopella, A. (2001). Help wanted, will train: it’s a national crisis: teacher shortages.
Administrators in urban districts, where the shortages are most severe, share alternative
recruitment approaches that work. District Administration, 37(11), 38-41.
Peske, H. G., Liu, E., Johnson, S. M., Kauffman, D., & Kardos, S. M. (2001). The next
generation of teachers: Changing conceptions of a career in teaching. Phi Delta Kappan,
83(4), 304-11.
Petri, H. L. (1986). Motivation: Theory and research. Belmont, CA: Wadsworth Publishing.
Podsen, I. J. (2002). Teacher retention: What is your weakest link? Larchmont, NY: Eye On
Education.
Public Agenda (2000). A sense of calli ng: Who teaches and why. Retrieved December 1, 2001,
from http://www.publicagenda.org/specials/teachers/teachers.htm

84
Randall, J. R. (1987). Job elements and demographic factors related to job satisfaction as
perceived by secondary school counselors. Dissertation Abstracts International, 48 (11).
(UMI No. AAT9729576).
Reising, B. & Denlinger, S. L. (2002). Teaching as a profession: A look at the problem of
teacher deficits. The Clearing House, 75(3), 116.
Richardson, H. W. (1983). The relationship of the participation of secondary school department
heads in decision making to their job satisfaction (release time, supplemental pay).
Dissertation Abstracts International, 44 (08). (UMI No. AAT8326427).
Riley, R. W. (1999, February). New challenges, a new resolve: Moving American education into
the 21st Century. The sixth annual State Of American Education Speech, Long Beach,
CA. (ERIC Document Reproduction Service No. ED428 052).
Ritz, J. M. (1999, September). Addressing the shortage of technology teaching professionals. The
Technology Teacher, 8-12.
Robbins, S. P. (1997). Essentials of organizational behavior (5th ed.). Upper Saddle River, NJ:
Prentice-Hall.
Rojewski, J. (2001). 9100 EOCS, Rojewski. Athens, GA: Bel Jean.
Ruhland, S. K. (2001). Factors influencing the retention of secondary business teachers. The
Delta Pi Epsilon Journal, 43(4), 215-228.
Salant, P., & Dillman, D. A. (1994). How to conduct your own survey. NewYork: John Wiley &
Sons, Inc.
Sausner, R. (March 2003). Short on teachers or not? Retrieved April 26, 2004, from
http://www.DistrictAdministration.com

85
Schaffer, F. H. (1953). Job satisfaction as related to need satisfaction in work. Psychology
Monographs, 67(14).
Self, M. C. (2001). On retention of secondary trade and industrial education teachers: Voices
from the field. The annual conference of the association of career and technical
education, New Orleans, LA. (ERIC Document Reproduction Service No. ED464213).
Shann, M. H. (1998). Professional commitment and satisfaction among teachers in urban middle
schools. Journal of Educational Research, 92(2), 67-73.
Shin, H. S., & Reyes, P. (1995). Teacher commitment and job satisfaction: A causal analysis.
Journal of School Leadership, 5(1), 22-39.
Shure, J. L. (2001). Reading, writing, and … recruiting? Techniques, 76(5), 18-21.
Simpson, R. L., & Simpson, I. H. (1969). Women and bureaucracy in the semi-professions. In A.
Etzioni (Ed.), The semi-professions and their organization: Teachers, nurses, social
workers (pp. 196-265). New York: Free Press.
Stewart, J. J. (1984). A study of the relationship among job satisfactoriness, occupational
competency, job satisfaction, and demographic characteristics for beginning
trade/industrial and technical education teachers in Georgia. Unpublished doctoral
dissertation, The University of Georgia, Athens, GA.
Stiles, D. C. (1993). The relationship between organizational climate and teacher job
satisfaction in Gwinnett County public schools. Unpublished doctoral dissertation.
University of Georgia, Athens, GA.
Stitt, W. L. (1980). Relationship of selected personal attributes of business teacher educators to
job satisfaction. Unpublished doctoral dissertation. University of Georgia, Athens, GA.
86
Stripling, K. (October 2003). So many teachers, so few spots. Retrieved April 26, 2004, from
http://www.DistrictAdministration.com
Sugg, R. S. Jr. (1978). MOTHERTEACHER: The Feminization of American Education.
Charlottesvill e, VA: University Press of Virginia.
Sulli van, G. (2001). A study of teacher motivation as it relates to age, experience, tenure, level
taught, and gender in the elementary, middle, and high school levels. Unpublished
dissertation: The University of Rochester, Rochester, NY.
Tell, C. (2001). Making room for alterative routes. Educational Leadership, 58(8), 38-41.
Thompson, S. (1979). Motivating of teachers. ACSD School Management Digest Series, 18. CA:
Association of California School Administrators.
Trapps, T. E. (2001, August 15). The nation; teacher shortage expected to worsen, especially in
california. The Los Angeles Times, pp. A.22.
True, J. A. (1989). Finding out: Conducting and evaluating social research (2nd ed.). Belmont,
CA: Wadsworth Publishing.
Vroom, V. H. (1964). Work and Motivation. New York: Wiley.
Warr, C. N. (1991). Job satisfaction and intent to leave present employment among secondary
teachers in vocational/technical education in the United States. Unpublished dissertation:
The University of Georgia, Athens, GA.
Weiss, D. J., Dawis, R. V., England, G. W., and Lofquist, L. H. (1967). Manual for the
Minnesota Satisfaction Questionnaire. Minnesota: Minnesota Studies in Vocational
Rehabili tation XXII .
Weston, S. (1997). Teacher shortage—supply and demand. The Technology Teacher, 57(1), 6-9.
87
Whipple, T.W. & Muffo, J. A. (1982). Adjusting for nonresponse bias: The case of an alumni
survey. Paper presented for Institutional Research Annual Forum, Denver, Colorodo,
May 19, 1982. (ERIC Document Reproduction Service No. ED220040).
Wilson, C. L. (2000). The salary gap. Education Week, 19(18), 36-7.
Wofford, T. D. (2003). A study of worker demographics and workplace job satisfaction for
employees in a global engineering and construction organization. Dissertation Abstracts
International, 64 (03). (UMI No. AAT3083929).
Woods, A. M. & Weasmer, J. (2002). Maintaining job satisfaction: Engaging professionals as
participants. The Clearing House, 75(4), 186-9.

APPENDICIES

APPENDIX A
REQUEST TO USE THE MINNESOTA SATISFACTION QUESTIONNAIRE

90

91
December 9, 2003 Dr. D. J. Weiss Vocational Psychology Research N620 Elli ot Hall University of Minnesota Minneapolis, MN 55455-0344 Dear Dr. Weiss: Please let this letter serve as my request to use the Minnesota Satisfaction Questionnaire in my doctoral research. My dissertation title is “Job Satisfaction and Teacher Retention of Business Education Teachers in Georgia”. This is also a request to use the MSQ as amended for teacher survey use by Wanda L. Stitt, Ed.D., University of Georgia, 1980. My doctoral work is directed by Dr. Wanda Stitt-Gohdes, Occupational Studies, and a committee comprised of four other faculty members from within our department. This committee has met and agreed that I should use the MSQ with the following minor changes in the original questions:
a. Question 10: Change from “The way my supervisor and I understand each other.” to read “The way my department chairperson and I understand each other.”
b. Question 15: Change from “The technical ‘know-how’ of my supervisor.” to read “The educational knowledge of my department chairperson.”
c. Question 26: Change from “The chance to tell other workers how to do things.” to read “The chance to tell other teachers how to do things.”
d. Question 29: Change from “Company policies and the way in which they are administered.” to read “School policies and the way they are administered.”
e. Question 30: Change from “The way my boss handles his men.” to read “The way my department chairperson handles faculty members.”
f. Question 35: Change from “The competence of my supervisor in making decisions.” to read “The competence of my department chairperson in making decisions.”
g. Question 49: Change from “The way employees are informed about company policies.” to read “The way teachers are informed about school policies.”
h. Question 50: Change from “The way my boss backs his men up (with top management).” to read “The way my department chairperson backs the faculty (with the administration).”

92
i. Question 52: Change from “How my pay compares with that for similar jobs in other companies.” to read “How my pay compares with that for similar jobs in other schools.”
j. Question 54: Change from “The way promotions are given out on this job.” to read “The availabili ty of promotions.”
k. Question 55: Change from “The way my boss delegates work to others.” to read “The way my department chairperson delegates work to others.”
l. Question 69: Change from “The way my company policies are put into practice.” to read “The way school policies are put into practice.”
m. Question 70: Change from “The way my boss takes care of complaints brought to him by his men.” to read “The way my department chairperson handles complaints brought by the faculty.”
n. Question 75: Change from “The way my boss provides help on hard problems.” to read “the way my department chairperson provides help on hard problems.”
o. Question 89: Change from “The way the company treats its employees.” to read “The way the school treats its faculty.”
p. Question 90: Change from “The personal relationship between my boss and his men.” to read “The personal relationship between my department chairperson and the faculty.”
q. Question 91: Change from “The way layoffs and transfers are avoided in my job.” to read “The way transfers are handled in my job.”
r. Question 95: Change from “The way my boss trains his men.” to read “The way my department chairperson helps faculty members.”
Your response to this request may be mailed to me at the following address: 1287
Everwood Drive S.W., Marietta, Georgia 30008. I have determined that approximately 600 surveys will be used. I plan to collect data during January and February 2004. I am enclosing the Qualifications and Registration Form and a copy of the Research Approval Application submitted to the University of Georgia. Your help and cooperation with this matter is greatly appreciated.
Sincerely, Dianna Day Johnson

93
To establi sh a new account, please complete this form.
QUALIFICATIONS and REGISTRATION FORM (Not Necessary for Sample Set)
Please type or print
1. QUALIFICATIONS
The instruments distributed by Vocational Psychology Research are available only to persons quali fied by training and experience to use these instruments in accordance with the American Psychological Association's ethical standards for test use and interpretation.
The MJDQ, MSQ, and MSS may be used only by persons who have, as a minimum, satisfactoril y completed a course in the interpretation of psychological tests and measurement at an accredited college or university, or the equivalent quali fications.
Use of the MIQ is restricted to persons who have both (1) an advanced degree in an appropriate profession, or membership in an appropriate professional association, or state li censure, or national or state certification; and (2) satisfactoril y completed a course in the interpretation of psychological tests and measurement at an accredited college or university, or the equivalent quali fications.
Graduate students must include a description of their proposed research with this registration form.
2. INSTRUCTIONS
If you are a graduate or undergraduate student, or do not meet the above qualif ications: ·
• Complete Section 3, and • Have your adviser or supervisor complete Sections 4, 5, and 6.
If you are a quali fied professional:
• Complete Sections 4, 5, and 6.
Return this form with your initial order.
3. STUDENTS AND OTHERS WITHOUT PROPER QUALIFICATIONS
Name______Dianna Day Johnson____________________________________________ Department/Institution__Occupational Studies/University of Georgia__________ Phone Number 770-437-0000
Your level of training: _X_Bachelor's Degree: Field Business Ed. Institution State Univ. of W. Georgia Year 1986 _X___Master's Degree: Field Business Ed. Institution State Univ. of W. Georgia Year 1998 ____Doctorate: Field____________ Institution _____________ Year____
Additional experience: ____In-service training ____Continuing education ____Supervised experience ____Reading test manuals

94
4. PROFESSIONAL QUALIFICATIONS
Your level of training: ____Bachelor's Degree: Field_____________ Institution _____________ Year__________ ____Master's Degree: Field_____________ Institution _____________ Year__________ ____Doctorate: Field _____________ Institution _____________ Year__________
Additional experience: ____In-service training ____Supervised experience ____Continuing education ____Reading test manuals
Your professional credentials:
____Licensure: Area________________________ State______ License Number___________ ____Professional organization memberships________________________________________ ____Formally recognized professional competence: ____Fellow ____Diplomate ____Other_____ Organization_____________________________________________________
Your educational background: (mark all applicable levels of training) Undergraduate Graduate Other Training Psychometrics and Measurement Theory Psychological Test Interpretation Descriptive Statistics Objective Personalit y Testing Career Interest Testing Personalit y
____Practicum in test administration and interpretation ____Internship: type_______________________________________________________ ____Other_______________________________________________________________
5. PURPOSE FOR USING THESE INSTRUMENTS
__X__Research: all information specif ic to the individual will be kept confidential; information will be used only as a group aggregate. Please attach a description of your intended study.
____Assessment of the examinee: to obtain and use information specific to the individual for: (check all that apply)____Counseli ng____Selection____Placement____Other:_____________
6. CERTIFICATION
I certify that I have personal knowledge of the relevant professional testing standards (such as the APA-AERA-NCME Standards for Educational and Psychological Tests, 1985), that I and/or other persons who may use the instruments being ordered by me possess the appropriate training and competencies to use the materials being ordered, and that my/our use of such materials will adhere to applicable State and Federal laws and regulations, and the ethical principles of my profession.
__X__I agree to supervise the individual indicated in Section 3 in the use of items ordered. Name__Dr. Wanda Stitt-Gohdes___________________________________________ Department/Institution__Occupational Studies/The University of Gerogia_________

95
Phone Number 706-542-4078 Signature________________________________________________Date______________
Adapted by special permission of the Publisher, Consulting Psychologists Press, Inc., Palo Alto CA 94306, from The CPP Instrument Purchaser Qualification Form. Further reproduction is prohibited without the Publi sher's consent.
Home Page
Description of intended study: Our nation is faced with an increasing shortage of teachers. In recent years the teaching profession has experienced a low retention rate, with new teachers dropping out of the profession at a rate of 50% by the end of their first five years. Teachers are leaving the classroom to pursue other careers within three to five years of entering the education field. This revolving door eff ect has led to an increased need to not only recruit new teachers, but retain those new teachers and veteran teachers as well. The shortage of teachers in general and business education teachers in particular is expected to continue over the next decade. Georgia’s HOPE Teachers’ Scholarship placed business education on their critical shortage list in spring 1999 and business education remains on the 2003 list. The purpose of this study will be to describe the job satisfaction of business education teachers in Georgia’s secondary public schools and determine the relationship between job satisfaction and intent to remain in the profession. In accordance with the purpose of this study, answers to the following questions are sought:
1. What satisfies business education teachers in Georgia secondary public schools? 2. What is the relationship between job satisfaction of business education teachers in
Georgia secondary public and personal and professional variables identified in the literature that may have an affect on the job satisfaction of teachers? Those variables include: age, gender, years at present institution, total years teaching, years employed outside teaching, highest degree attained, salary level, marital status, route to certification (traditional or alternative), and location of school currently teaching in (rural, urban, suburban).
3. What is the relationship between the level of job satisfaction and intent to remain in the classroom of Georgia secondary business education teachers in public schools?
A survey method of research will be used. The Minnesota Satisfaction Questionnaire (MSQ) will be used to measure job satisfaction levels. A personal data questionnaire will survey attributes including gender, age, years employed at present school, total years teaching, highest degree attained, salary level, route to certification (traditional college teacher preparatory program or an alternate route), location of school currently teaching in (rural, urban, suburban), and level of intent to remain in the classroom. Several methods of statistical analysis will be used during this study. The analysis of data will begin with descriptive statistics. These statistics will be used to create a description of business education teachers currently teaching in Georgia’s secondary public schools, their levels of satisfaction, and their intent to remain in the teaching profession. The statistical procedures calculated for each variable will be means, standard deviations, and frequencies. Multiple

96
correlation analysis will be used to analyze the data on the relationship between demographic variables and job satisfaction levels and on the relationship between job satisfaction and the intent to remain in the profession.
Participants in this study will consist of secondary business education teachers currently teaching in public schools in the state of Georgia. A list of secondary business educators and their addresses will be obtained from the Georgia State Department of Education. A systematic random sampling method will be used to select participants from the list. Each participant will be sent a packet that includes a cover letter, the Personal Data Questionnaire, and the MSQ. Instructions for completing the instruments will be contained both in the cover letter and on the individual questionnaires. The questionnaires will be distributed to the participants the third week in January 2004. The questionnaire will be sent via the U.S. postal service on January 20th, 2004, and will i nclude a stamped, pre-addressed return envelope. A deadline of February 10, 2004 will be included in the cover letter in an effort to increase the speed of questionnaire return. A second follow-up maili ng will be mailed on February 10, 2004, to any participant who has not responded. A postcard follow-up maili ng will be on March 2nd, 2004 to any participant who has still not responded. Ten days from the date of the postcard follow-up maili ng, March 12, 2004, will be all owed for any responses to be returned.

APPENDIX B
MSQ NORMATIVE DATA FOR TEACHERS

98
Normative Data for Teachers (N=191)
Sample Characteristics
N Percent
Age
20-29 113 59 30-39 31 16 40-49 14 7 50-59 19 10 60 and over 9 5
Education Less than bachelors degree 14 7 bachelors degree 164 86 masters degree 10 5
Grade Kindergarten through 3 118 62 4 through 6 68 36
Tenure in present occupation 0 to 9 years 138 72 10 to 19 years 24 13 20 to 29 years 16 8 30 years and over 10 5 MSQ Manual, 1967, p. 58
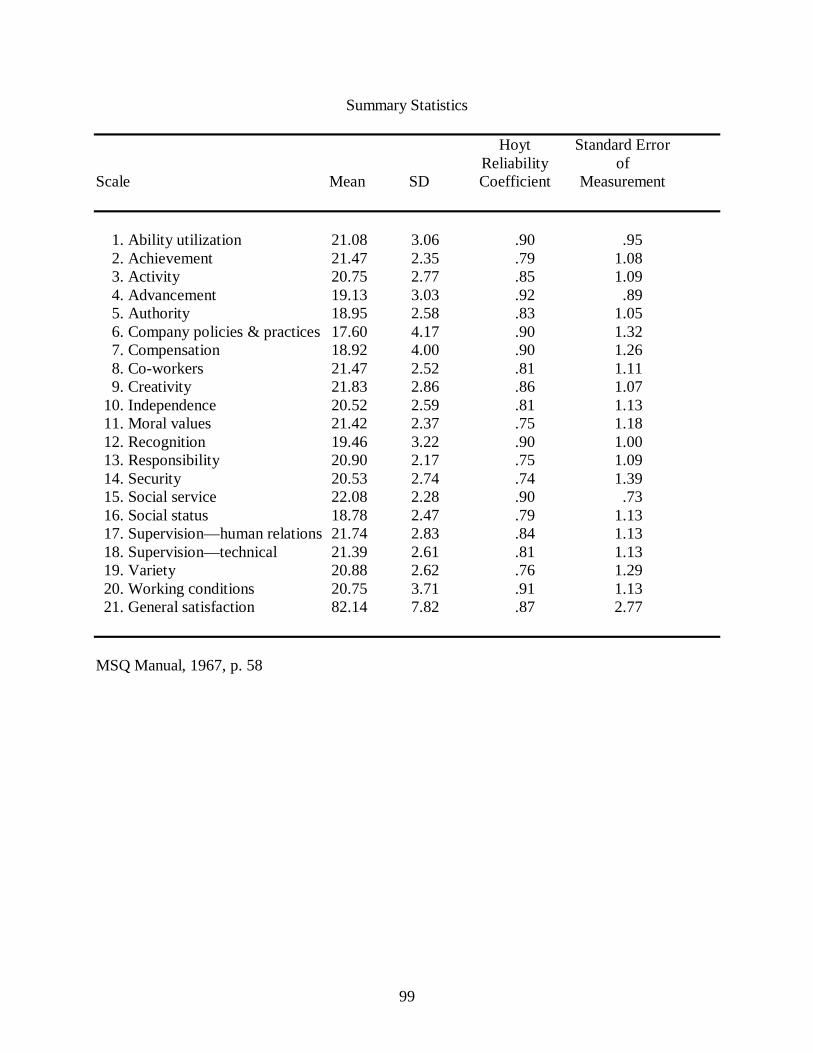
99
Summary Statistics
Hoyt Standard Error Reliabil ity of Scale Mean SD Coefficient Measurement 1. Abil ity utilization 21.08 3.06 .90 .95 2. Achievement 21.47 2.35 .79 1.08 3. Activity 20.75 2.77 .85 1.09 4. Advancement 19.13 3.03 .92 .89 5. Authority 18.95 2.58 .83 1.05 6. Company policies & practices 17.60 4.17 .90 1.32 7. Compensation 18.92 4.00 .90 1.26 8. Co-workers 21.47 2.52 .81 1.11 9. Creativity 21.83 2.86 .86 1.07 10. Independence 20.52 2.59 .81 1.13 11. Moral values 21.42 2.37 .75 1.18 12. Recognition 19.46 3.22 .90 1.00 13. Responsibil ity 20.90 2.17 .75 1.09 14. Security 20.53 2.74 .74 1.39 15. Social service 22.08 2.28 .90 .73 16. Social status 18.78 2.47 .79 1.13 17. Supervision—human relations 21.74 2.83 .84 1.13 18. Supervision—technical 21.39 2.61 .81 1.13 19. Variety 20.88 2.62 .76 1.29 20. Working conditions 20.75 3.71 .91 1.13 21. General satisfaction 82.14 7.82 .87 2.77 MSQ Manual, 1967, p. 58

APPENDIX C
PERSONAL DATA QUESTIONNAIRE

101
Personal Data Questionnaire
Instructions: Please supply the information requested. This information will be used for statistical purposes only in analyzing the data collected. Do not write your name on this information sheet.
1. Gender _____ Female _____ Male
2. Age _____(as of last birthday) 3. Highest Degree attained
____ Bachelor’s _____ Specialist
____ Master’s _____ Doctorate
4. Route taken to obtain certification:
____ Traditional (Certification at the Baccalaureate level)
____ Alternative (Post Baccalaureate Masters)
5. Years teaching at present institution ____
6. Location of school currently teaching at:
____ Rural ____ Suburban ____ Urban
7. Total years teaching ____
8. Years employed outside teaching ____; area of employment _________________
9. Are you married? ____ Yes ____ No
10. Present Salary Range
____ 25,000 – 29,999 ____ 40,000 – 44,999 ____ 55,000 – 59,999
____ 30,000 – 34,999 ____ 45,000 – 49,999 ____ Over 60,000
____ 35,000 – 39,999 ____ 50,000 – 54,999
11. How long do you plan to remain in the teaching profession?
____ Leave teaching at the end of the current school year
____ Teach for several years before leaving teaching
____ Retire as soon as I have 30 years in
____ Teach as long as I can beyond 30 years

APPENDIX D
IRB APPROVAL FORM

103

APPENDIX E
COVER LETTER

105

APPENDIX F
FOLLOW-UP COVER LETTER

107

APPENDIX G
POSTCARD FOLLOW-UP

109
Address of Postcard Dianna Day Johnson Graduate Student-UGA 1287 Everwood Drive Marietta, Georgia 30008 FirstName LastName SchoolName Address City, State Zip (label will be used for addressee)
Message of Postcard Dear Colleague: Recently you were sent a letter requesting participation in a research study of Job Satisfaction and Intent to Remain in Teaching of Georgia Secondary Business Education Teachers. Your name was drawn randomly for a li st of all secondary business education teachers in Georgia. If you have returned the questionnaire, thank you for your participation. If you have not returned the questionnaire, please take a few moments to complete it. If you did not receive a questionnaire, or if it was misplaced, contact me at 770-437-0000 or [email protected] and I will get another one in the mail to you today. Dianna Day Johnson Graduate Student, Occupational Studies University of Georgia