job satisfaction and management
TRANSCRIPT

Job satisfaction and qualitymanagement: an empirical
analysisLilian M. de Menezes
Faculty of Management, Cass Business School,City University London, London, UK
Abstract
Purpose – Quality management requires increasing employee involvement that could empoweremployees, leading to employee and customer satisfaction. Although the literature describes a picture ofincreasing job demands and work intensification, the evidence of an association between employee jobsatisfaction and quality management remains mixed and narrow. The purpose of this paper is to investigatethis link in the wider economy, and address the roles of human resource management practices that targetdirect employee participation (job enrichment and high involvement management) in this relationship.
Design/methodology/approach – The Workplace Employment Relations Survey of 2004(WERS2004) provides information on British workplaces including the use of specific quality andhuman resource management practices, employees’ job satisfaction and other outcomes. Latent variableanalysis identifies employers’ approaches to quality management, job enrichment and high involvementmanagement. Workplace-level regression analyses illustrate the link between job satisfaction andvarious desired organizational outcomes. Hierarchical two-level regression models are used to assess thelink between quality management at workplaces and employee job satisfaction.
Findings – Although job satisfaction is positively associated with desired workplace outcomes(organizational commitment, productivity and quality), no significant link between quality managementand employee job satisfaction is found. By contrast, a positive association between job enrichment andjob satisfaction is confirmed, which may be weakened in the presence of quality management.
Practical implications – Given the potential impact of job satisfaction on organizational outcomes,job enrichment features should not be neglected when designing jobs so that an effective qualitymanagement strategy can be in place. Some weak positive association between high involvement andquality managements with perceived job demands is also observed, and this should be furtherinvestigated in more detailed studies of employee well-being.
Originality/value – This is a large empirical study on an economy-wide sample of workplaces andtheir employees.
Keywords United Kingdom, Job satisfaction, Quality management, High involvement management,Job enrichment, Employee attitudes
Paper type Research paper
The current issue and full text archive of this journal is available at
www.emeraldinsight.com/0144-3577.htm
The study is based on data from the 2004 Workplace Employment Relations Survey (WERS2004),a survey that is jointly sponsored by the UK’s Department of Trade and Industry, the Advisory,Conciliation and Arbitration Service, the Economic and Social Research Council, and the PolicyStudies Institute. The National Centre for Social Research was commissioned to conduct the surveyfieldwork on behalf of the sponsors. WERS2004 is deposited at the Data Archive at the University ofEssex, UK. The author is grateful to the UK’s Economic and Social Research Council for sponsoringthe empirical investigation under Grant RES-000-23-1482, to Melina Dritsaki, Ellen Farleigh andStephen Wood for their assistance with data preparation, and to Garry Gelade for his help withrunning part of the analysis. Neither the sponsors nor the Data Archive have any responsibility forthe analysis or interpretation of the material contained in this paper.
IJOPM32,3
308
Received 11 January 2010Revised 20 September 2010,4 January 2011Accepted 11 January 2011
International Journal of Operations& Production ManagementVol. 32 No. 3, 2012pp. 308-328q Emerald Group Publishing Limited0144-3577DOI 10.1108/01443571211212592

1. IntroductionQuality management is a philosophy aimed at achieving or exceeding customerexpectations through an emphasis on employee involvement and continuousimprovements in quality (Deming, 2000; Juran, 1993; Kaynak, 2003;Martinez-Lorente et al., 1998; Molina-Azorin et al., 2009). In practice, qualitymanagement has been implemented in various ways, ranging from the adoption ofspecific quality management practices that may vary according to the productionsystem (White and Prybutok, 2001) to integrated management systems that emphasizeoverall organization competitiveness and sustainability and go beyond product quality(e.g. the European Foundation for Quality Management Excellence Model; the criteria ofthe Baldrige National Quality Program). The association between quality managementand organizational performance has been subject of many studies (Bou and Beltran,2005; Challis et al., 2002; Cua et al., 2001; Flynn et al., 1995; Molina-Azorin et al., 2009;Narasimhan et al., 2004; Powell, 1995; Samson and Terziovski, 1999; Shah and Ward,2003). In spite of the diversity in implementations and measures that were considered, asillustrated by a recent review of this literature (Molina-Azorin et al., 2009, pp. 204-8,Table III), most of the empirical evidence supports some positive association. The overallexpectation is that quality management reduces cost, achieves customer satisfaction,generates increased revenues and leads to market advantage (Anderson et al., 1995;Kaynak, 2003; Merino-Diaz De Cerio, 2003; Piercy and Rich, 2009; Schroeder et al., 2005).Yet some authors have argued that performance gains may be achieved at the expense ofemployee well-being (Green, 2006; Landsbergis et al., 1999; Parker, 2003).
The literature portrays an ongoing debate on the potential employee outcomes ofquality management. Some scholars argue that quality management is a source ofmore challenging work and as such is an opportunity to be smarter and have morecontrol over one’s own work (Womack et al., 1990), thus leading to a “highly motivatingwork environment” (Adler and Cole, 1993, p. 86). Others associate quality managementwith high-pressure working environments (Garrahan and Stewart, 1992; Green, 2006).Hence, the impact of quality management on well-being and, more specifically, whetherit is associated with employee job satisfaction remains a research question.
Job satisfaction is an important dimension of employee well-being in its own right butis also a desired indicator of organizational success (Culbertson, 2009; Korunka et al.,2003). In fact, independently of the measures that were used and the specific practicesimplemented, several studies of quality management in services found strong positiveassociations between customer satisfaction and employee job satisfaction (Akdere, 2009;Brown and Lam, 2008; Hallowell et al., 1996; Zeithaml et al., 1996). Consequently,customer satisfaction, a goal of quality management, may be achieved via employee jobsatisfaction, and as Schroeder et al. (2005) argued in their review of the evolution ofquality, the human issues involved in quality management are of increasing interest toacademics and practitioners in operations management.
In this context, the study aims to investigate the association between qualitymanagement and job satisfaction using secondary data from a large economy-widesample of workplaces and their employees, the UK Workplace Employment RelationsSurvey of 2004 (WERS2004). It assumes that the uses of management practices areindicators of managerial approaches at the workplace and develops measures of suchapproaches. The specific quality management practices in the data are: training inquality, training in problem solving, self-inspection of quality, the keeping of records
Job satisfactionand quality
management
309

of faults or complaints, the keeping of records on quality, customer surveying, qualitytargets, customer service targets, team briefings that involve quality, and just-in-time( JIT) procedures. In addition, a range of human resource management (HRM) practicesthat target direct employee participation and have been linked to the human aspects ofquality management (Akdere, 2009; Appelbaum et al., 2000) are included. These are: taskvariety, method control, timing control teamwork, functional flexibility, quality circles,suggestion schemes, team briefing, induction, training in human relations skills,information disclosure, and appraisal.
The next section briefly reviews the related literatures on the potential effects of jobsatisfaction and the hypotheses that follow. Given job satisfaction’s scope for having animpact, previous research on the link between quality management and job satisfaction isalso considered so that competing views and the potential role of HRM are inferred, thusleading to further hypotheses. Subsequently, the empirical part of the study is described:the data, the derived measures and analyses are summarized and the results reported.Finally, conclusions, limitations and further implications of the study are drawn.
2. Background, hypotheses and research questions2.1 The potential impact of job satisfactionSuccess in motivating and retaining human capital has been often associated withhigh-performance organizations (Capelli, 2000; Huselid, 1995). Favourable employeeoutcomes are also assumed to enhance management’s legitimacy (Boxall and Purcell,2003). In this context, job satisfaction is seen as a potential route to high performance(Becker and Huselid, 1998; Boxall and Purcell, 2003; Pfeffer, 1994; Wright et al., 2003) anda potential mediator in a hypothetical chain from management practices to performance(Michie and West, 2004; Purcell and Kinnie, 2007). Implicit in these expectations is thebasic idea that employees who are satisfied with their jobs are likely to be more committedto the organization and more productive (Hsu and Wang, 2008, Figure 1). It is thereforeanticipated that organizations where the workforce is more satisfied will show higherlevels of organizational commitment, less absenteeism and have a more productiveworkforce. These expectations can also be expressed at the workplace level, i.e.:
H1. There is a positive association between the level of job satisfaction in aworkplace and the level of employee commitment in a workplace.
H2. The association between the level of job satisfaction in a workplace andabsenteeism is negative.
H3. There is a positive association between the level of job satisfaction in aworkplace and its productivity.
Furthermore, an employee’s job satisfaction can determine the failure or success ofcustomer experiences (Hsu and Wang, 2008), has often been directly linked to customersatisfaction (Akdere, 2009), and a commitment to continuous improvement as well asquality (Matzler et al., 2004). A critical factor for customer satisfaction is quality, thus:
H4. There is a positive association between the level of job satisfaction in aworkplace and the quality of its product.
By contrast, the link between quality management and job satisfaction remains subjectto debate and the empirical evidence is mixed, as discussed below.
IJOPM32,3
310

2.2 Quality management and job satisfactionBesides addressing alternative ways that job satisfaction can affect employeebehaviour, most of the employee satisfaction literature reports on how it is influencedby personal characteristics (Clark, 1997; Peccei and Lee, 2005), job level (Robie et al.,1998), occupation (Rose, 2007), and education and wage levels (Clark and Oswald,1996). Nonetheless, given that quality management initiatives in organizations changethe nature of work, they may affect job satisfaction and different dimensions of qualitymanagement may differ in impact.
2.2.1 Dimensions of quality management and their impact on job satisfaction. The“most commonly cited dimensions of quality management in the literature” (Holzer et al.,2009, pp. 410-11; Molina-Azorin et al., 2009, p. 201) are: leadership, which is associatedwith top-level management’s commitment to continuous improvements; planning orstrategic management that is concerned with setting objectives and action plans forachieving set goals; process management and improvement, thus ensuring continuousefforts to design the effective flow of work systems that helps eliminate inefficiencies;people management that emphasises the development of the workforce’s capacity andaligns work with the objective of high quality; supplier management and collaboration;information management and analysis in order to monitor unexpected fluctuations andachieve consistent high quality through standardized evaluation processes; customerand market focus aimed at implementing the required standards.
This study is based on a national survey of British workplaces, which covers whetheror not practices that are associated with most of these dimensions are implemented in theworkplaces. The exceptions are leadership and supplier management collaboration.The survey is richer on HRM practices and thus also provides the opportunity toinvestigate those that are directed at employee participation and are widely advocatedas influential in both organizational performance and employee well-being(Humphrey et al., 2007; Parker et al., 2001; Womack et al., 1990).
Direct employee participation is key to HRM (Guest, 1987) and common to theories thatdescribe how HRM influences organizational performance (e.g. the mutual gainsenterprise – Kochan and Osterman, 1994; high-involvement management – Lawler, 1986;and high-performance work organizations – Appelbaum et al., 2000; Capelli and Neumark,2001; Huselid, 1995). Two types of direct participation are generally emphasized:
(1) Job enrichment, which is achieved by giving employees discretion, task varietyand high levels of responsibility in their job.
(2) High-involvement management, which leads to the implementation ofmanagement practices that allow for organizational involvement beyond thejob specification (e.g. teamwork, quality circles).
According to these theories, both forms of employee participation enhance the qualityof working life and thus would be positively associated with employee job satisfaction.
The common thesis underlying such expectations, based on which one might link jobsatisfaction to quality management, is that greater opportunities for problem solvingand taking responsibility over one’s work increase the intrinsic rewards of work. Thisthesis stems from the job redesign movement of the 1960s, which positively associatedjob autonomy with job satisfaction and worker well-being. It is expressed in the jobcharacteristics model of Hackman and Oldham (1976), which was one of the firstattempts to relate the design of work to job satisfaction. There is indeed some empirical
Job satisfactionand quality
management
311

support for a positive association between employee participation in qualitymanagement and employee job satisfaction (Korunka et al., 2003; Mullarkey et al.,1995). In addition, from a practical perspective, it is reasonable to expect that methods toreduce waste and increase efficiency also mean that work processes are better organizedand consequently less stressful. Hence there is also suggestion that employees can besatisfied with very routine manufacturing jobs (Vidal, 2007) that do not require muchinvolvement. Indeed this suggestion is consistent with Conti et al.’s (2006) largeempirical investigation of the link between lean production, an integrated system thatencompassed the most cited dimensions of quality management through a range ofpractices previously defined by Fullerton et al. (2003, p. 389), and job stress. Theyconcluded that “reduced lean control can provide workers with high-utility benefits, andaccompanying lower stress” (Conti et al., 2006, p. 1032). Consequently, higher levels ofwell-being and a “highly motivating work environment” (Adler and Cole, 1993, p. 86)have been linked to quality management for different reasons, and positive employeeoutcomes have also been confirmed (Adler and Cole, 1993; Jackson and Mullarkey, 2000;Mullarkey et al., 1995; Piercy and Rich, 2009).
By contrast, some authors argue that quality management, and more specifically anemphasis on process management, may result in job dissatisfaction. It has beensuggested that the kind of teams associated with lean production systems may add toemployees’ job pressures since the strong supervision and evaluation systems mayincrease competition between workers (Wood, 1999). In this context, quality managementinitiatives have been criticized for not offering a supportive environment that might offsetthe effects of the drive for continuous improvement (Parker, 2003). An alternativenegative view is that the multi-skilling advocated by quality management experts, whichmay lead to creative approaches, can actually result in variations of similar simple jobswith short training (Delbridge et al., 1992; Parker, 2003) and low-job satisfaction (Vidal,2007). Moreover, the increase in job demands from quality management that wereobserved in an early review of the evidence by Landsbergis et al. (1999) seems to besupported by more recent analyses, which concluded that total quality management(TQM) and JIT procedures operate by “stepping up work intensity” to improveorganizational efficiency (Green, 2006, p. 48).
Nonetheless, there are also arguments for an intermediate or neutral position, such asthe “context-dependent approach” (Edwards et al., 1998) or the acknowledgement of theheterogeneous impact of individual preferences for work arrangements (Vidal, 2007).From this intermediate point of view, neither generally positive (e.g. increase in jobcontrol and satisfaction) nor negative (e.g. increase in work effort, higher demands)employee effects should be expected. In fact, Korunka et al.’s (2003) study of theimplementation of quality management in an organization, where outcomes weremeasured before the change and at different times during following the introduction,concluded that employee outcomes were context dependent. Still, they also identified jobcontrol, role clarity and information as key factors for job satisfaction.
All in all, we have no clear support for an association between quality managementand job satisfaction and there are indications that any link may be affected by employeeparticipation mechanisms. Given the scope and information on management practicesthat is offered by WERS2004, this study attempts to empirically investigate thefollowing:
IJOPM32,3
312

H5. There is association between quality management and job satisfaction.
H6. The association between quality management and job satisfaction isinfluenced by job enrichment and high-involvement management.
3. Research design3.1 DataWERS2004 is the fifth in a series of surveys involving representative samples ofworkplaces across the British economy. Two of its instruments are used in this study.The first is a survey of workplace practices based on a face-to-face interview with asingle respondent from within management, who was a senior manager at the workplacewith day-to-day responsibility for industrial relations, employee relations or personnelmatters. Interviews were conducted in 2,295 workplaces from an in-scope sample of3,587 addresses, representing a response rate of 64 percent. The sample covers theprivate and public sector and all industries, with the establishments engaged in primaryindustries and private households with domestic staff (7 percent of all workplaces).Workplaces with fewer than five employees (60 percent of all workplaces) are excluded.The sample was taken from the Inter Departmental Business Register, maintained bythe Office of National Statistics.
An eight-page, self-completion questionnaire is the survey’s second instrument that isused. It was distributed within workplaces where WERS surveyors had conducted themanagement interview and led to a sample of 22,451 employees, equivalent to a responserate of 61 percent. The aim was to achieve a maximum of 25 employee respondents in eachworkplace. Employee questionnaires were distributed in 86 percent of the workplaceswhere the WERS surveyors had conducted the management interview. A further12 percent of workplaces did not return any questionnaires, and in those workplaces withten or more employees these were treated (for purposes of the calculating the 61 percentresponse rate) as the same as those who had initially declined to distribute questionnaires.The median number of employees per workplace that completed the questionnaire was13, and the most frequent (in 100 workplaces) was 16 employees.
The WERS2004 sample design involves many significant departures from the simplerandom sampling that underpins most standard statistical procedures (e.g. correlationand regression analysis). As a result, one must account for the sample design byapplying weights to the data, if one wishes to obtain unbiased population estimates.Standard weights are included in the two datasets and are used in the analyses thatfollow.
3.2 Measures3.2.1 Job enrichment, high-involvement management and quality management. Table Idescribes the management practices, whose measures are binary variables that areequal to one if a practice is used in the workplace and zero otherwise. The three jobenrichment practices have been considered in previous studies of work enrichment(Parker and Wall, 1998) and cover the three dimensions of job autonomy described byParker (2003). The definitions of quality and high-involvement management practicesare consistent with analyses of the WERS series (Wood and Bryson, 2009), althoughthese excluded JIT procedures. Similar quality management practices have beenconsidered in the literature (Kaynak, 2003; Douglas and Judge, 2001), though theirmeasurements vary between studies.
Job satisfactionand quality
management
313

Instead of creating an additive scale that counts the number of practices used, as forexample in the study of White and Prybutok (2001), it is assumed that the correlation inpractice uses stems from managerial approaches. Hence, by estimating the commonfactors in the practice data, these approaches can be measured. If a one-factor modelwould fit the correlation of all variables, there would be evidence of an integrated qualitymanagement that encompassed HRM, TQM, and JIT. However, x2-tests showed that
Job enrichmentMethod control Equal to 1 if employees in the largest occupational group have a lot of
discretion over how they do their workTiming control Equal to 1 if employees in the largest occupational group have a lot of control
over the pace at which they carry out their workTask variety Equal to 1 if employees in the largest occupational group have a lot of variety
in their workHigh-involvement management
Appraisal Equal to 1 if non-managers in the workplace have their performance formallyappraised
Functional flexibility Equal to 1 if a larger than the average proportion of the core occupationalgroup is formally trained to be able to do jobs other than their own
Induction Equal to 1 if there is a standard induction programme to new employeeswithin the largest occupational group
Informationdisclosure
Equal to 1 if regular information is provided on one or more of the following:the financial position of the establishment, internal investment plans, staffingplans
Quality circles Equal to 1 if groups of employees solve specific problems or discuss aspects ofperformance or quality, which are sometimes known as quality circles, orproblem-solving or continuous improvement groups
Suggestion schemes Equal to 1 if management uses suggestion schemes to consult with employeesTeamwork Equal to 1 if more than the average proportion of the core occupational group
work in formally designated teamsTeam briefing Equal to 1 if team briefing for all the workers in a section is availableTraining for humanrelations skills
Equal to 1 if employees in the largest occupational group received off-the-jobtraining on improving communication and/or teamwork in the past yearQuality management
Just-in-time (JIT) Equal to 1 if a system to minimize inventories, supplies or work-in-progress isin place
Customer servicetargets
Equal to 1 if targets for customer service are set
Customer surveys Equal to 1 if quality is monitored via customer surveysQuality records Equal to 1 if quality records are keptQuality targets Equal to 1 if targets for quality of product or service are setRecords on faults andcomplaints
Equal to 1 if quality is monitored by keeping records on levels of faults andcomplaints
Self-inspection Equal to 1 if individual employees monitor qualityTeam briefingsinvolve quality
Equal to 1 if there is a system of briefing for any section or sections of theworkforce that discusses quality of products/services (production issues)
Training in quality Equal to 1 if employees in the largest occupational group received off-the-jobtraining on quality procedures in the past year
Training in problemsolving
Equal to 1 if employees in the largest occupational group received off-the-jobtraining on problem solving in the past year
Note: All are equal to zero otherwise
Table I.Definition of theindicators of the use ofmanagement practices inthe workplaces in thestudy
IJOPM32,3
314

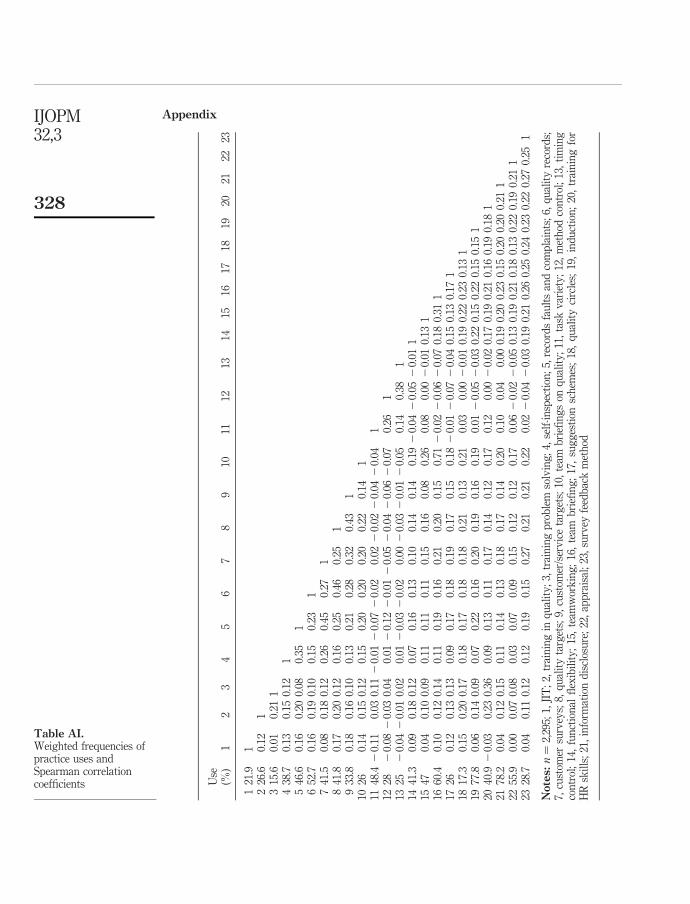
some practices were used independently of others, and the Spearman correlationcoefficients (Appendix) illustrate that the association is weak or negligible between thethree subsets. Hence, the three subsets of practices are considered separately.
In order to develop the measurement constructs, methods specifically designed forbinary data were required. The normit-probit latent trait model is used (Bartholomewand Knott, 1999, p. 79; Bartholomew et al., 2008, pp. 213-6) to estimate latent variables(factors), which by construction are continuous and distributed as a standard normal.Yet there are no strong theoretical reasons to assume that a continuous factor underlieseach subset of data. If a factor model does not fit the data, latent class models (Vermuntand Magidson, 2005, pp. 21-2) are then estimated. Such models are traditionally used insocial sciences to identify clusters with the same measure of a categorical latentconstruct (McCutcheon, 1987) and have recently been applied in operationsmanagement (de Menezes et al., 2010). As in cluster analysis, groups can beidentified, but these follow from a statistical model and thus the quality of fit can bejudged by standard statistical tests.
Job enrichment and high-involvement management were found to be separate factors.Both latent trait models fitted the data and explained over 60 percent of the log-likelihoodratio statistic. In the model of job enrichment, the standardized coefficients that are akin tofactor loadings in traditional factor analysis are: 0.99 (method control), 0.62 (task variety),0.80 (timing control). The estimated probability that method control is used in theworkplace with the mean level of job enrichment is equal to 0.001, and the most likelypractice to be used in such a workplace is task variety (probability ¼ 0.5). Theseestimated probabilities indicate that a job enrichment approach is not common in Britishworkplaces, which is not surprising given the relatively low uses of the three practices(second column, rows 11-13 in the Appendix). With regards to the model of highinvolvement, the standardized factor loadings are: 0.71 (appraisal), 0.70 (functionalflexibility), 0.84 (induction, information disclosure), 0.79 (quality circles), 0.65 (suggestionschemes), 0.87 (team briefing), 0.76 (teamwork), 0.73 (training HR skills). The lowestestimated probability that the average workplace, with respect to this measure, uses ahigh-involvement practice is 0.30 (quality circles), and for three practices this probabilityis 0.90 or greater (induction, information disclosure and team briefing). Hencehigh-involvement management is more widespread in British workplaces, which is alsoconsistent with the higher observed frequencies of use of this type of practice (Appendix:second column, rows 14-23). In WERS2004, managers had also been asked to what extentindividuals in the workplace were involved in decisions over how their work is organized,with responses on a four-point scale (“a little”–“a lot”). Both job enrichment (r ¼ 0.45)and high-involvement management (r ¼ 0.16) were positively correlated with responsesto this question, thus confirming that they measure employee participation but alsosuggesting different degrees and potentially different impacts.
In contrast to the two types of HRM practices, when the correlation structure of thequality management practices was examined, the association was generally weak(rows 1-10 – Appendix) and did not reflect continuous factors. Via latent class analysis,four different emphases in quality management were identified. The final model(Vermunt and Magidson, 2005, pp. 21-2), whose estimated parameters are shown inTable II, also implies some linear association between specific practices. The overall fit isgood: the log-likelihood ratio statistic (L2 ¼ 1,032; df ¼ 976) has a p-value of 0.1.According to the estimated likelihood of a practice being used in each class, the four
Job satisfactionand quality
management
315

categories of workplaces were named: no quality management, some targets, some TQMand some TQM þ JIT. The second row in Table II shows the distribution of workplacesin the sample according to these categories. The corresponding population (weighted)distribution is 0.35 (no quality management), 0.18 (some targets), 0.23 (some TQM) and0.24 (some TQM þ JIT), thus showing that 35 percent of British workplaces are unlikelyto have quality management. Three binary measures (dummy variables) are then usedto indicate if a workplace belongs to each of the last three categories; the first category(no quality management) will be the reference or baseline in the investigation that isreported in the next sections.
Another question in the management survey asked: “To what extent would you saythat the demand for your (main) product or service depends upon you offering betterquality than your competitors?”, with responses given in a five-point scale (“does notdepend at all” – “depends heavily”). Cross-tabulations and x2-tests showed thatbelonging to the last two categories of workplaces (some TQM: p-value ¼ 0.007; someTQM þ JIT: p-value ¼ 0.00) is associated with a perceived demand for better quality.
3.2.2 Job satisfaction and other outcomes. Job satisfaction is concerned with theextent of pleasure a person gains from their job and thus measures the degree ofaffective attachment to the job. In the employee survey, job satisfaction was queriedwith respect to eight items on a five-point scale: the amount of influence the person hasover their job, the amount of pay they received, the sense of achievement they get fromtheir work, the scope for using initiative, the training the person received, their jobsecurity, involvement in decision making, and the work itself. Principle componentanalysis of these items indicated a single dimension, with the model explaining50 percent of the variance. The factor loadings ranged from 0.82 to 0.51 and the threeextrinsic items – satisfaction with training (0.63), pay (0.51) and security (0.56) – hadlower loadings than the intrinsic ones. Job satisfaction is measured by the mean scoreson all eight items, but when five or more of these items were missing, the measureis coded as missing. The scale has a reliability statistic, as measured by Cronbach’salpha, of 0.85, which is consistent with measures from 29 studies of job satisfaction
Probability of using a practice if in the classClassa 1 2 3 4
JIT 0.09 0.16 0.17 0.59Training in quality 0.07 0.15 0.21 0.57Training in problem solving 0.10 0.15 0.21 0.53Self-inspection 0.08 0.07 0.27 0.58Records on faults and complaints 0.04 0.07 0.30 0.59Quality records 0.08 0.21 0.16 0.55Customer surveys 0.04 0.08 0.28 0.60Quality targets 0.01 0.28 0.07 0.63Customer service targets 0.03 0.24 0.11 0.62Team briefing involves quality 0.10 0.15 0.21 0.53
Notes: a1, no quality management; 2, some targets; 3, some TQM; 4, some TQM-JIT; estimated directeffects and p-values in brackets: customer surveys and JIT: 20.46 (0.003); customer surveys andquality targets: 1.07 (0.00); training in problem solving and training in quality: 0.81 (0.00); qualitytargets and JIT: 0.35 (0.00); estimates are based on WERS2004 workplace sample, cases with missingvalues are excluded from the analysis: n ¼ 2,219
Table II.The latent class model ofquality managementpractices – estimatedparameters
IJOPM32,3
316

overviewed by Mullarkey et al. (1999, p. 63) – Cronbach’s alpha varied from 0.85 to 0.93with a mean of 0.88, although individual items vary between studies. When the level ofjob satisfaction in a workplace is considered in the analysis that follows, it is estimatedby the weighted average of the responses of employees in each workplace.
Organizational commitment is measured by a scale computed as the averageresponse to three items (Cronbach’s alpha ¼ 0.85) that are coded on a five-point scale inthe employee survey: “I share many values of my organisation”, “I feel loyal to myorganisation”, “I am proud to tell people who I work for”. The level of commitment in aworkplace is therefore measured by the weighted average of this scale in each workplace.
Labour productivity and quality are performance measures that rely on subjectiveassessments of the managerial respondent in each workplace. They are ordinalvariables measured as five-point scales that range from “a lot below average” to “a lotbetter than average for industry”.
Absenteeism in WERS2004 is measured by the percentage of work days lostthrough employee sickness or absence, and is available for every workplace. However,the distribution of this measure is highly skewed and thus its logarithm was computed,and also adjusted in the case of the few workplaces that had zero percentage so thattheir information would not be lost by re-scaling the data.
3.2.3 Controls. Control variables are constructed from both surveys. These areindependent variables that were found to be associated with either the use ofmanagement practices or job satisfaction. At the workplace level they are: union density,size of establishment (logarithm of the total number of employees), industry group(11 dummy variables; manufacturing is the reference group), public workplace, yearsoperating at present address, proportion of females, proportion of operational androutine workers, proportion of young workers (employees aged 21 or below), proportionof part-time workers and proportion of new recruits (workers that commenced work inthe past 12 months). Individual characteristics that have been found to be associatedwith job satisfaction are added when employee satisfaction is the dependent variable.These are: being a manager, age (measured as a categorical variable, since non-linearrelationships with measures of well-being were argued in the literature: Blanchflowerand Oswald, 2008), being educated up to a graduate level, gender, tenure and lowearnings (wage).
3.3 Statistical analysisIn order to test forH1-H4, weighted regression models on workplace data are estimated.These are ordered-logit regression models where the dependent variable is an ordinalperformance outcome; otherwise, weighted least squares are used. The establishmentweight that is provided in WERS2004 is the weighting variable and the models areestimated using Stata (svyologit, svyregress). A few workplaces had less than threeemployee respondents and were identified as outliers, so they are excluded from theanalysis.
Weighted hierarchical two-level regression models are used to investigate the H5and H6. Employee satisfaction is the dependent variable, which is measured at theindividual level. The independent variables are the quality management categories,job enrichment and high-involvement management, which are measured atthe workplace level. The controls are measured at both levels as previouslydescribed. Both employee and establishment weights are used.
Job satisfactionand quality
management
317

4. ResultsTable III summarizes the in-sample bivariate association between quality management,job enrichment, high-involvement management, employee and workplace performanceoutcomes at the workplace level. It clearly suggests a strong positive association betweenthe levels of job satisfaction and organizational commitment (r ¼ 0.74) in the workplacesand significant associations between job satisfaction and other desired outcomes. Thelast two rows refer to employees’ perceptions also available in the dataset, which enableus to gain more insights and will be discussed in the next section. It is noticeable that jobsatisfaction is positively associated with the employee’s perceptions of job control(r ¼ 0.44), although they are only weakly associated with job enrichment (r ¼ 0.16) andnegatively associated with having an approach that integrates some TQM and JITprocedures (TQM þ JIT: r ¼ 20.11). Not surprisingly, there is negative correlationbetween having no quality management and having some integration of TQM and JITprocedures (r ¼ 20.41). Yet, there is also negative correlation between having someintegration of TQM and JIT and just having some TQM (r ¼ 20.45) which might reflectthe lower use of JIT. Overall correlations are not strong (absolute values , 0.2).
Table IV summarizes the potential impact of the level of job satisfaction in theworkplace on the level of organizational commitment, absenteeism, productivity andquality. A positive association with organizational commitment, productivity andquality, plus a negative association with absenteeism, are highlighted. These resultssupport H1-H4, thus confirming that job satisfaction is not only important in its ownright, but may also influence the links between quality management strategies andperformance or other desired employee outcomes.
When hierarchical two-level models are estimated, the first model to consider is what isknown as the null model. It essentially estimates the mean job satisfaction in the population(employees in British workplaces) and the residual variances, based on which the intra-classcorrelation is calculated and can be interpreted as the proportion of the total residualvariance that is due to differences between workplaces. The estimated mean is equal to3.48 with a standard error of 0.008 and is significantly greater than 3, thus indicating thatthe average employee in British workplaces is satisfied with their job. The intra-classcorrelation is equal to 15.55 percent, which is not negligible and shows thatbetween-workplace variation should be considered as well as individual (employee)variability when attempting to predict employee job satisfaction in this data. In other words,two-level models are appropriate for investigating H5 and H6, and thus were estimated.
Table V shows the estimated coefficients and their respective standard errors.Significant coefficients are highlighted in italic. According to the second column, jobsatisfaction is positively associated with being a manager, being over 60, and theproportion of part-time workers. By contrast, it is negatively associated with beinguniversity-educated, male, job tenure, low earnings, the size of the workplace and itsamount of unionization. Employees in public workplaces are less satisfied with theirjobs than those in private and public-private partnerships. In relation to working inmanufacturing, those working in financial services are less satisfied with their jobs,while those working in the construction industry, public administration, education,health and other community services are more satisfied with their jobs. Finally, qualitymanagement is not associated with employee job satisfaction.
Adding high-involvement management and job enrichment to the model, as shownin columns four and five, does not change the significance of the observed predictors.
IJOPM32,3
318

12
34
56
78
910
1112
1.N
oq
ual
ity
man
agem
ent
1.00
2.S
ome
targ
ets
20.
221.
003.
Som
eT
QM
20.
282
0.24
1.00
4.S
ome
TQ
Mþ
JIT
20.
412
0.36
20.
451.
005.
Job
enri
chm
ent
0.08
20.
012
0.02
20.
041.
006.
Hig
h-i
nv
olv
emen
tm
anag
emen
t2
0.37
20.
022
0.04
0.35
0.00
1.00
7.Jo
bsa
tisf
acti
on0.
150.
000.
002
0.12
0.17
20.
151.
008.
Org
aniz
atio
nal
com
mit
men
t0.
090.
012
0.02
20.
060.
172
0.05
0.74
1.00
9.A
bse
nte
eism
20.
170.
022
0.02
0.14
20.
130.
162
0.22
20.
171.
0010
.P
rod
uct
ivit
y2
0.01
0.07
20.
050.
000.
130.
050.
150.
142
0.11
1.00
11.
Qu
alit
y2
0.01
20.
012
0.04
0.04
0.12
0.02
0.15
0.17
20.
070.
361.
0012
.P
erce
ived
job
dem
and
a2
0.10
0.03
0.01
0.06
0.13
0.18
20.
040.
100.
052
0.02
20.
031.
0013
.P
erce
ived
Job
con
trol
b0.
110.
000.
022
0.11
0.16
20.
050.
440.
342
0.18
0.09
0.06
0.09
Notes:
aM
ean
per
wor
kp
lace
ofem
plo
yee
s’re
spon
ses
totw
oq
ues
tion
s(fi
ve-
poi
nt
scal
efr
omst
ron
gly
agre
eto
stro
ng
lyd
isag
ree)
wit
hth
est
atem
ents
:“m
yjo
bre
qu
ires
that
Iw
ork
ver
yh
ard
”,“I
nev
erse
emto
hav
een
oug
hti
me
tog
etm
yw
ork
don
e”;b
mea
np
erw
ork
pla
ceof
anem
plo
yee
-lev
elfi
ve-
item
mea
sure
(Cro
nb
ach
’sal
ph
a¼
0.81
)bas
edon
thei
rre
spon
ses
(“A
lot”
,“S
ome”
,“A
litt
le”,
“Non
e”)o
fh
owm
uch
infl
uen
ceth
eyh
ave
over
fiv
ear
eas
ofw
ork
:“t
he
task
sth
eyd
oin
thei
rjo
b”,
“th
ep
ace
atw
hic
hth
eyw
ork
”,“h
owth
eyd
oth
eir
wor
k”,
“th
eor
der
inw
hic
hth
eyca
rry
out
thei
rta
sks”
,“th
eti
me
they
star
tor
fin
ish
thei
rw
ork
”
Table III.Workplace-level
Spearman correlations
Job satisfactionand quality
management
319

High-involvement management is not associated with job satisfaction, but jobenrichment is positively associated with it. Interactions of the quality managementcategories with both job enrichment and high-involvement management were added tothis model, but those with high-involvement management were not significant andthus were deleted. Results are shown in column six: while job enrichment is positivelyassociated with job satisfaction, the combination of TQM and job enrichment isnegatively associated with job satisfaction and may dilute the positive effect of jobenrichment. In conclusion, H5 and H6 were rejected and there is evidence that TQMmay influence the link between job enrichment and employee job satisfaction.
5. Discussion and further analysisThat job satisfaction is positively linked to desired employee and organizationaloutcomes is confirmed by the results of this study. As for quality management, most
Commitmenta Absenteeisma Productivityb Qualityb
Level of job satisfaction 0.90 (0.000) 20.35 (0.013) 0.93 (0.008) 0.98 (0.001)Size of establishment 20.02 (0.483) 0.27 (0.003) 20.42 (0.838) 0.20 (0.232)Manufacturing(reference category)Electricity, gas and water 20.09 (0.225) 20.27 (0.051) 20.11 (0.862) 20.42 (0.660)Construction 0.15 (0.091) 0.06 (0.843) 20.36 (0.433) 20.41 (0.463)Wholesale and retail 0.09 (0.146) 0.29 (0.093) 20.10 (0.816) 20.40 (0.299)Hotels and restaurants 0.21 (0.025) 0.33 (0.238) 0.86 (0.159) 0.04 (0.941)Transport andcommunication 0.15 (0.081) 0.34 (0.111) 0.56 (0.237) 20.45 (0.313)Financial services 0.13 (0.273) 0.21 (0.384) 0.42 (0.478) 20.09 (0.888)Other business services 0.10 (0.137) 0.10 (0.501) 0.50 (0.249) 0.27 (0.469)Public administration 20.16 (0.085) 20.17 (0.638) 0.37 (0.686) 21.23 (0.032)Education 0.35 (0.000) 0.32 (0.099) 0.20 (0.973) 20.025 (0.961)Health 0.10 (0.185) 0.49 (0.008) 0.43 (0.335) 0.22 (0.655)Other communityservices 0.15 (0.065) 0.13 (0.599) 0.99 (0.052) 20.15 (0.745)Public workplace 20.02 (0.771) 0.02 (0.882) 0.26 (0.489) 20.59 (0.080)Age of workplace 20.002 (0.85) 20.03 (0.201) 0.23 (0.689) 20.06 (0.240)Proportion females 0.06 (0.456) 0.14 (0.536) 20.56 (0.197) 20.08 (0.849)Proportion routineworkers 20.06 (0.388) 0.14 (0.497) 20.27 (0.599) 0.11 (0.761)Proportion youngworkers 20.19 (0.033) 0.27 (0.289) 20.36 (0.739) 0.91 (0.242)Proportion part-timeworkers 20.10 (0.168) 20.46 (0.032) 20.51 (0.317) 20.76 (0.110)Proportion new recruits 20.04 (0.534) 0.25 (0.083) 0.38 (0.390) 0.18 (0.702)Union density 0.02 (0.810) 0.43 (0.002) 20.43 (0.008) 0.28 (0.422)R 2 0.58 0.15F F(211,292) ¼ 35.6 F(211,089) ¼ 3.05 F(211,128) ¼ 1.72 F(211,212) ¼ 2.39Prob . F 0.00 0.00 0.02 0.00n 1,313 1,110 1,149 1,233
Notes: aEstimates based on weighted least squares; bestimates based on weighted ordered-logitmodels
Table IV.Potential impact of jobsatisfaction – regressioncoefficients and p-values
IJOPM32,3
320

Coefficient SE Coefficient SE Coefficient SE
Constant 3.68 0.08 3.64 0.08 3.63 0.08Potential predictorsSome TQM þ JIT 20.03 0.02 20.02 0.03 20.01 0.03Some targets 20.01 0.03 0.00 0.03 0.01 0.03Some TQM 20.04 0.03 20.03 0.03 20.03 0.03Manager 0.30 0.02 0.30 0.02 0.30 0.02University educated 20.06 0.02 20.06 0.02 20.06 0.02Male 20.08 0.02 20.08 0.02 20.08 0.02Aged 18-19 0.04 0.07 0.05 0.07 0.05 0.07Aged 20-21 20.03 0.06 20.03 0.06 20.03 0.06Aged 22-29 20.03 0.06 20.03 0.06 20.03 0.06Aged 30-39 0.02 0.06 0.03 0.06 0.03 0.06Aged 40-49 0.00 0.06 0.00 0.06 0.00 0.06Aged 50-59 0.05 0.06 0.05 0.06 0.05 0.06Aged 60-64 0.22 0.06 0.22 0.06 0.22 0.06Aged 65 þ 0.38 0.08 0.38 0.08 0.38 0.08Tenure 1-2 years 20.07 0.02 20.07 0.02 20.07 0.02Tenure 2-5 years 20.09 0.02 20.09 0.02 20.09 0.02Tenure 5-10 years 20.09 0.02 20.09 0.02 20.09 0.02Tenure 10 þ years 20.09 0.02 20.09 0.02 20.09 0.02Low earnings (#4.5£/h) 20.06 0.02 20.06 0.02 20.06 0.02Size – log (total of employees) 20.06 0.01 20.06 0.01 20.06 0.01Electricity, gas and water 0.06 0.07 0.08 0.07 0.07 0.07Construction 0.16 0.04 0.16 0.04 0.16 0.04Wholesale and retail 0.06 0.03 0.06 0.03 0.07 0.03Hotels and restaurants 0.11 0.07 0.11 0.07 0.11 0.07Transport and communication 20.02 0.04 20.02 0.04 20.02 0.04Financial services 20.08 0.04 20.07 0.04 20.07 0.04Other business services 0.04 0.04 0.04 0.04 0.05 0.04Public administration 0.12 0.05 0.13 0.05 0.13 0.05Education 0.30 0.04 0.29 0.04 0.29 0.04Health 0.26 0.04 0.25 0.04 0.26 0.04Other community services 0.15 0.04 0.15 0.04 0.15 0.04Public workplace 20.07 0.03 20.07 0.03 20.06 0.03Age of workplace 0.00 0.01 0.00 0.01 0.00 0.01Proportion females 20.07 0.05 20.06 0.05 20.06 0.05Proportion routine workers 20.02 0.04 20.02 0.04 20.02 0.04Proportion young workers 20.10 0.08 20.09 0.08 20.08 0.08Proportion part-time workers 0.18 0.05 0.18 0.05 0.17 0.05Proportion new recruits 20.03 0.05 20.02 0.05 20.03 0.05Union density 20.18 0.03 20.17 0.03 20.18 0.03High-involvement management 20.01 0.01 20.01 0.01Job enrichment 0.03 0.01 0.07 0.02Some TQM þ JIT £ jobenrichment 20.05 0.03Some target £ job enrichment 20.05 0.04Some TQM £ job enrichment 20.08 0.03Fit summaryWorkplace residual variance 0.05 0.00 0.05 0.003 0.05 0.003Employee residual variance 0.39 0.01 0.38 0.006 0.38 0.00622 log-likelihood 36,923 36,914 36,908Number of cases 16,778 16,778 16,778
Table V.Two-level models of job
satisfaction
Job satisfactionand quality
management
321

workplaces in Britain in 2004 were unlikely to adopt some basic operational features ofquality management, so only a few could benefit from its potential gains. No link withjob satisfaction was found. Yet a weak negative association between a workplace havingsome integration of TQM and JIT procedures and the perception of job control can beobserved, and there is little evidence of an association between quality management andwork intensification (Table III). Further analysis, via a regression model where theperceived job demand in the workplace was the dependent variable, the qualitymanagement dummy variables were the independent variable and the same controls asin Table IV were kept, showed a positive association between having some integration ofTQM and JIT ( p-value ¼ 0.004) and perceived job demands. Overall, however, there isno evidence that this resulted in job dissatisfaction or that the monitoring aspects ofTQM were associated with higher perception of job demands ( p-value ¼ 0.415).
The link between job enrichment and job satisfaction was confirmed. It is worthnoticing that Table III also shows a weak association between management’s approachtowards job enrichment, which is the subject of this investigation, with the averageemployee’s perception of job control (r ¼ 0.16). This may indicate that informalempowerment mechanisms were present in the workplaces or that a significant role inenriching jobs might be played by direct supervisors. In order to obtain some sensitivityof the results, an alternative model to that described in column three of Table V, wherejob enrichment was replaced by the employees’ perception of job control, was thenestimated. As one might have expected, the association with job satisfaction is stronger( p-value ¼ 0.00), thus suggesting that the perception of job control may be what reallymatters for an employee’s job satisfaction. It is likely that job satisfaction will mediatethe link between job enrichment or job control and desired organizational outcomes andthese relationships should be investigated in future studies on the potential effects ofdirect employee participation.
Similar to quality management, no association between high-involvementmanagement and job satisfaction was found. The former is moderately associatedwith some integration of TQM and JIT (Table III, column four: r ¼ 0.35), and is alsoweakly associated with higher perceived job demands (Table III, column six: r ¼ 0.18).Nonetheless, as reported in the previous section, the combination of high-involvementmanagement and some quality management does not appear to result in jobdissatisfaction as forecast by studies that associate work intensification with these formsof managements, either alone or as components of a high-performance work system.
That some emphasis on TQM combined with job enrichment may be linked to jobdissatisfaction, while there is no similar link when TQM is coupled with JIT procedures,is an issue for further investigation. It could be due to having the monitoring aspectscoupled with extra responsibilities for quality management but lacking tools foreffective process management. However, the lack of detail in the current dataset does notpermit further analysis.
It may be that employees’ preferences are significant in any potential link betweenquality management approaches and employee job satisfaction, as observed incase studies (Vidal, 2007). Yet preferences are very heterogeneous and thus their effectsare likely to dilute in large samples of employees. It is therefore plausible that thenegative employee reactions to quality management observed in case-studies are lesslikely to be observed in a wider context, thus favouring the intermediate view of noassociation. Large sample longitudinal studies of organizations and their employees
IJOPM32,3
322

with more detailed measures on implementation are therefore needed in order to furtherclarify the ongoing debate on the human issues in quality management.
6. ConclusionThis study uses a large economy-wide sample and is distinctive for its use of matchedworkplace and employee data. It confirms the importance of job satisfaction for bothemployee and organizational outcomes, since positive links with organizationalcommitment, productivity and quality were observed thus confirming H1-H4. Yet itdoes not support expectations that quality and high-involvement managements maylead to higher organizational performance but decrease employee job satisfaction. Onaverage, employees in British workplaces in 2004 were satisfied with their jobs, but therewas no association between quality management and job satisfaction. Consequently, thefindings of this study reject H5 and H6 and support an intermediate view that, broadly,there is no link between quality management and job satisfaction.
A limitation of this study is the restricted coverage of quality management practices,most noticeably the absences of measures of a learning culture, leadership commitmentto quality, and supply chain partnership. The data also rely on a single manager’sassessments of the performance of the workplace which, as shown by Mezias andStarbuck (2003), may be inaccurate and require special attention. The consistency of thesubjective performance measures in WERS2004 was investigated by Forth and McNabb(2008) on subsets of the sample, for which objective measures were available (n # 506out of N ¼ 2,295). They found overlaps in the distributions of the four objectivemeasures of productivity within each category of the subjective rating, which is a reasonfor caution. Yet they also found evidence of congruence and qualified support for thehypothesis that both types of productivity measures produce similar results (identicalsigned associations) when used in structural models of workplace performance (on thesame data). Their overall conclusion echoes previous findings that managers’ ratings ofperformance in the UK were consistent with audited accounting data (Wall et al., 2004),thus giving us some confidence in using the subjective assessments. Moreover, thisstudy was unable to assess the extent of implementation of practices that might have ledto further discrimination of workplaces with regards to their managerial approaches.Finally, this is a cross-sectional study and thus neither causality nor long-term effectsare assessed.
All in all, the current study adds economy-wide evidence to an ongoing debate on thepotential employee and organizational outcomes of quality management approaches,and supports the thesis that job enrichment features are important for an effectivequality management.
References
Adler, P.S. and Cole, R.E. (1993), “Designed for learning: a tale of two auto plants”, SloanManagement Review, Vol. 34 No. 3, pp. 85-94.
Akdere, M. (2009), “A multi-level examination of quality-focused human resource practices andfirm performance: evidence from the US healthcare industry”, International Journal ofHuman Resource Management, Vol. 20 No. 9, pp. 1945-64.
Anderson, J.C., Rungtusanatham, M., Schroeder, R. and Devaraj, S. (1995), “A path analyticmodel of a theory of quality management underlying the Deming management method:preliminary empirical findings”, Decision Sciences, Vol. 26 No. 5, pp. 637-58.
Job satisfactionand quality
management
323

Appelbaum, E., Bailey, T., Berg, P. and Kalleberg, A.L. (2000), Manufacturing Advantage:Why High Performance Work Systems Pay Off, Cornell University Press, Ithaca, NY.
Bartholomew, D.J. and Knott, M.K. (1999), Latent Variable Models and Factor Analysis, 2nd ed.,Arnold, London.
Bartholomew, D.J., Steele, F., Moustaki, I. and Galbraith, J.I. (2008), Analysis of Multivariate SocialScience Data, 2nd ed., Chapman & Hall, Boca Raton, FL.
Becker, B.E. and Huselid, M.A. (1998), “High performance work systems and firm performance:a synthesis of research and managerial implications”, in Ferris, G.R. (Ed.), Research inPersonnel and Human Resources, Vol. 16, JAI Press, Stamford, CT, pp. 53-101.
Blanchflower, D.G. and Oswald, A.J. (2008), “Is well-being U-shaped over the life cycle?”, SocialScience & Medicine, Vol. 66 No. 8, pp. 1733-49.
Bou, J.C. and Beltran, I. (2005), “Total quality management, high-commitment human resourcestrategy and firm performance: an empirical study”, Total Quality Management, Vol. 16No. 1, pp. 71-86.
Boxall, P. and Purcell, J. (2003), Strategy and Human ResourceManagement, Palgrave Macmillan,Basingstoke.
Brown, S. and Lam, S. (2008), “A meta-analysis of relationships linking employee satisfaction tocustomer responses”, Journal of Retailing, Vol. 84 No. 3, pp. 243-55.
Capelli, P. (2000), “A market driven approach to retaining talent”, Harvard Business Review,Vol. 78, January-February, pp. 103-11.
Capelli, P. and Neumark, D. (2001), “Do ‘high-performance’ work practices improveestablishment-level outcomes?”, Industrial Labor Relations Review, Vol. 54 No. 4,pp. 737-75.
Challis, D., Samson, D. and Lawson, B. (2002), “Integrated manufacturing, employee andbusiness performance: Australian and New Zealand evidence”, International Journal ofProduction Research, Vol. 40 No. 8, pp. 1941-64.
Clark, A.E. (1997), “Job satisfaction and gender: why are women so happy at work?”, LabourEconomics, Vol. 61, pp. 341-72.
Clark, A.E. and Oswald, A. (1996), “Satisfaction and comparison income”, Journal of PublicEconomics, Vol. 61, pp. 359-81.
Conti, R., Angelis, J., Cooper, C., Faragher, B. and Gill, C. (2006), “The effects of lean productionon worker job stress”, International Journal of Operations and Production Management,Vol. 26 No. 9, pp. 1013-38.
Cua, K.O., McKone, K.E. and Schroeder, R.G. (2001), “Relationships between implementation ofTQM, JIT, and TPM and manufacturing performance”, Journal of OperationsManagement, Vol. 19 No. 2, pp. 675-94.
Culbertson, S. (2009), “Do satisfied employees mean satisfied customers?”, Academy ofManagement Perspectives, Vol. 23 No. 1, pp. 76-7.
Delbridge, R., Turnbull, P. and Wilkinson, B. (1992), “Pushing back the frontiers: managementcontrol and work intensification under JIT/TQM regimes”, New Technology, Work andEmployment, Vol. 7 No. 2, pp. 97-105.
de Menezes, L.M., Wood, S. and Gelade, G. (2010), “The integrated use of modern managementpractices and performance: a longitudinal latent class study”, Journal of OperationsManagement, Vol. 28 No. 6, pp. 455-71.
Deming, W. (2000), Out of the Crisis: Quality, Productivity and Competitive Position, The MITPress, Cambridge, MA.
IJOPM32,3
324

Douglas, T.J. and Judge, W.Q. (2001), “Total quality management implementation andcompetitive advantage: the role of structural control and exploration”, Academy ofManagement Journal, Vol. 44 No. 1, pp. 158-69.
Edwards, P., Collinson, M. and Rees, C. (1998), “The determinants of employee responses to totalquality management: six case studies”, Organizational Studies, Vol. 19 No. 3, pp. 449-75.
Flynn, B., Sakakibara, S. and Schroeder, R. (1995), “Relationship between JIT and TQM: practicesand performances”, Academy of Management Journal, Vol. 38 No. 5, pp. 1325-60.
Forth, J. and McNabb, R. (2008), “Workplace performance: a comparison of subjective andobjective measures in the 2004 Workplace Employment Relations Survey”, IndustrialRelations Journal, Vol. 39 No. 2, pp. 104-23.
Fullerton, R.R., McWatters, C.S. and Fawson, C. (2003), “An examination of the relationshipbetween JIT and financial performance”, Journal of Operations Management, Vol. 21 No. 4,pp. 383-404.
Garrahan, P. and Stewart, P. (1992), Nissan Enigma: Flexibility at Work in a Local Economy,Mansell, London.
Green, F. (2006), Demanding Work: The Paradox of Job Quality in the Affluent Economy,Princeton University Press, Princeton, NJ.
Guest, D. (1987), “Human resource management and industrial relations”, Journal ofManagement Studies, Vol. 24 No. 5, pp. 503-21.
Hackman, J.R. and Oldham, G. (1976), “Motivation through the design of work: test of a theory”,Organizational Behavior and Human Performance, Vol. 16 No. 2, pp. 250-79.
Hallowell, R., Schlesinger, L. and Zornitsky, J. (1996), “Internal service quality, customer and jobsatisfaction: linkages and implications for management”, Human Resource Planning,Vol. 19 No. 2, pp. 20-31.
Holzer, M., Charbonneau, E. and Kim, Y. (2009), “Mapping the terrain of public service qualityimprovement: twenty-five years of trends and practices in the United States”, InternationalReview of Administrative Sciences, Vol. 75 No. 3, pp. 403-18.
Hsu, S. and Wang, Y. (2008), “The development and empirical validation of the EmployeeSatisfaction Index model”, Total Quality Management, Vol. 19 No. 4, pp. 353-66.
Humphrey, S.E., Nahrgang, J.D. and Morgeson, F.P. (2007), “Integrating motivational, social, andcontextual work design features: a meta-analytic summary and theoretical extension of thework design literature”, Journal of Applied Psychology, Vol. 92 No. 5, pp. 1332-56.
Huselid, M.A. (1995), “The impact of human resource management practices on turnover,productivity, and corporate financial performance”, Academy of Management Journal,Vol. 38 No. 3, pp. 635-72.
Jackson, P.R. and Mullarkey, S. (2000), “Lean production teams and health in garmentmanufacture”, Journal of Occupational Health Psychology, Vol. 5 No. 2, pp. 231-45.
Juran, J. (1993), “Made in USA: a renaissance in quality”, Harvard Business Review, Vol. 71,pp. 42-50.
Kaynak, H. (2003), “The relationship between total quality management practices and their effecton firm performance”, Journal of Operations Management, Vol. 21 No. 4, pp. 405-35.
Kochan, T.A. and Osterman, P. (1994), The Mutual Gains Enterprise, Harvard Business SchoolPress, Cambridge, MA.
Korunka, C., Scharitzer, D., Carayon, P. and Sainfort, F. (2003), “Employee strain and jobsatisfaction related to an implementation of quality in a public service organization:a longitudinal study”, Work & Stress, Vol. 17 No. 1, pp. 52-72.
Job satisfactionand quality
management
325

Landsbergis, P.A., Cahill, J. and Schnall, P. (1999), “The impact of lean production and relatednew systems of work organization on worker health”, Journal of Occupational HealthPsychology, Vol. 4 No. 2, pp. 108-30.
Lawler, E.E. (1986), High Involvement Management; Participative Strategies for ImprovingOrganizational Performance, Jossey-Bass, San Francisco, CA.
McCutcheon, A.C. (1987), Latent Class Analysis, Sage, Beverly Hills, CA.
Martinez-Lorente, A., Dewhurst, F. and Dale, B. (1998), “Total quality management: origins andevolution of the term”, The TQM Magazine, Vol. 10 No. 6, pp. 378-86.
Matzler, K., Fuchs, M. and Schubert, A.K. (2004), “Employee satisfaction: does Kanos’ modelapply?”, TQM & Business Excellence, Vol. 15 Nos 9/10, pp. 1179-98.
Merino-Diaz De Cerio, J. (2003), “Quality management practices and operational performance:empirical evidence for the Spanish industry”, International Journal of Production Research,Vol. 41 No. 12, pp. 2763-86.
Mezias, J. and Starbuck, H. (2003), “Studying the accuracy of manager’s perceptions: a researchodyssey”, British Journal of Management, Vol. 14 No. 1, pp. 3-17.
Michie, S. and West, M. (2004), “Managing people and performance: an evidence basedframework applied to health service organizations”, International Journal of ManagementReviews, Vol. 5, pp. 91-111.
Molina-Azorin, J.F., Tari, J.J., Claver-Cortes, E. and Lopez-Gamero, M.D. (2009), “Qualitymanagement, environmental management and firm performance: a review of empiricalstudies and issues of integration”, International Journal of Management Reviews, Vol. 11No. 2, pp. 197-222.
Mullarkey, S., Jackson, P.R. and Parker, S.K. (1995), “Employee reactions to JIT manufacturingpractices: a two-phase investigation”, International Journal of Operations & ProductionManagement, Vol. 15 No. 11, pp. 62-79.
Mullarkey, S., Wall, T.D., Warr, P.B., Clegg, C.W. and Stride, C.B. (1999), Measures of JobSatisfaction, Mental Health and Job-related Well-being, Institute of Work Psychology,University of Sheffield, Sheffield.
Narasimhan, R., Swink, M. and Kim, S.W. (2004), “Disentangling leanness and agility:an empirical investigation”, Journal of Operations Management, Vol. 24 No. 5, pp. 421-39.
Parker, S.K. (2003), “Longitudinal effects of lean production on employee outcomes and themediating role of work characteristics”, Journal of Applied Psychology, Vol. 88 No. 4,pp. 620-34.
Parker, S.K. and Wall, T.D. (1998), Job and Work Design: Organizing Work to Promote Well-beingand Effectiveness, Sage, Thousand Oaks, CA.
Parker, S.K., Wall, T.D. and Cordery, J.L. (2001), “Future work design research and practice:towards an elaborated model of work design”, Journal of Occupational & OrganizationalPsychology, Vol. 74 No. 4, pp. 413-28.
Peccei, R. and Lee, H. (2005), “The impact of gender similarity on employee satisfaction at work:a review and re-evaluation”, Journal of Management Studies, Vol. 42 No. 8, pp. 1571-92.
Pfeffer, J. (1994), Competitive Advantage Through People: Unleashing the Power of the Workforce,Harvard Business School Press, Boston, MA.
Piercy, N. and Rich, N. (2009), “Lean transformation in the pure service environment: the case ofthe call service centre”, International Journal of Operations & Production Management,Vol. 29 No. 1, pp. 54-76.
Powell, T.C. (1995), “Total quality management as competitive advantage: a review andempirical study”, Strategic Management Journal, Vol. 16 No. 1, pp. 15-37.
IJOPM32,3
326

Purcell, J. and Kinnie, N. (2007), “HRM and business performance”, in Boxall, P., Purcell, J. andWright, R. (Eds), Oxford Handbook of Human Resource Management, Oxford UniversityPress, Oxford, pp. 533-52.
Robie, C., Ryan, A., Schmieder, R., Parra, L. and Smith, P. (1998), “The relation between job leveland job satisfaction”, Group and Organizational Management, Vol. 23 No. 4, pp. 470-95.
Rose, M. (2007), “Why so fed up and footloose in IT? Spelling out the association betweenoccupation and overall job satisfaction shown by WERS 2004”, Industrial RelationsJournal, Vol. 38 No. 4, pp. 356-84.
Samson, D. and Terziovski, M. (1999), “The relationship between total quality managementpractices and operational performance”, Journal of Operations Management, Vol. 17 No. 5,pp. 393-409.
Schroeder, R.G., Linderman, K. and Zhang, D. (2005), “Evolution of quality: first fifty issues ofproduction and operations management”, Production and OperationsManagement, Vol. 14No. 4, pp. 468-81.
Shah, R. and Ward, P.T. (2003), “Lean manufacturing: context, practice bundles, andperformance”, Journal of Operations Management, Vol. 21 No. 2, pp. 129-50.
Vermunt, J.K. and Magidson, J. (2005), Technical Guide for Latent Gold 4.0: Basic and Advanced,Statistical Innovations Inc, Belmont, MA.
Vidal, M. (2007), “Lean production, worker employment, and job satisfaction: a qualitativeanalysis and critique”, Critical Sociology, Vol. 33 Nos 1-2, pp. 247-78.
Wall, T., Michie, J., Patterson, M., Sheehan, M., Wood, S., Clegg, C. and West, M. (2004), “On thevalidity of reported company financial performance”, Personnel Psychology, Vol. 57 No. 1,pp. 95-118.
White, R.E. and Prybutok, V. (2001), “The relationship between JIT practices and type ofproduction system”, Omega, Vol. 29, pp. 113-24.
Womack, J., Jones, D. and Roos, D. (1990), The Machine that Changed the World, Rawson,New York, NY.
Wood, S. (1999), “Human resource management and performance”, International Journal ofManagement Reviews, Vol. 1 No. 4, pp. 367-414.
Wood, S. and Bryson, A. (2009), “High involvement management”, in Brown, W., Bryson, A.,Forth, J. and Whitfield, K. (Eds), The Evolution of the Modern Workplace, CambridgeUniversity Press, Cambridge, pp. 151-75.
Wright, P.M., Gardner, T.M. and Moynihan, L.M. (2003), “The impact of HR practices on theperformance of business units”, Human Resource Management Journal, Vol. 13, pp. 21-36.
Zeithaml, V.A., Berry, L.L. and Parasuraman, A. (1996), “The behavioral consequences of servicequality”, Journal of Marketing, Vol. 60 No. 2, pp. 31-46.
(The Appendix follows overleaf.)
About the authorLilian M. de Menezes is Professor of Decision Sciences at Cass Business School, City UniversityLondon. Her publications include articles in European Journal of Operational Research, HumanRelations, Industrial Relations, International Journal of Human Resource Management, Journalof Operations Management and Journal of the Royal Statistical Society. Lilian M. de Menezes canbe contacted at: [email protected]
To purchase reprints of this article please e-mail: [email protected] visit our web site for further details: www.emeraldinsight.com/reprints
Job satisfactionand quality
management
327
Appendix
Use
(%)
12
34
56
78
910
1112
1314
1516
1718
1920
2122
23
121
.91
226
.60.
121
315
.60.
010.
211
438
.70.
130.
150.
121
546
.60.
160.
200.
080.
351
652
.70.
160.
190.
100.
150.
231
741
.50.
080.
180.
120.
260.
450.
271
841
.80.
170.
200.
120.
160.
250.
460.
251
933
.80.
180.
160.
100.
130.
210.
280.
320.
431
1026
0.14
0.15
0.12
0.15
0.20
0.20
0.20
0.22
0.14
111
48.4
20.
110.
030.
112
0.01
20.
072
0.02
0.02
20.
022
0.04
20.
041
1228
20.
082
0.03
0.04
0.01
20.
122
0.01
20.
052
0.04
20.
062
0.07
0.26
113
252
0.04
20.
010.
020.
012
0.03
20.
020.
002
0.03
20.
012
0.05
0.14
0.38
114
41.3
0.09
0.18
0.12
0.07
0.16
0.13
0.10
0.14
0.14
0.19
20.
042
0.05
20.
011
1547
0.04
0.10
0.09
0.11
0.11
0.11
0.15
0.16
0.08
0.26
0.08
0.00
20.
010.
131
1660
.40.
100.
120.
140.
110.
190.
160.
210.
200.
150.
712
0.02
20.
062
0.07
0.18
0.31
117
260.
120.
130.
130.
090.
170.
180.
190.
170.
150.
182
0.01
20.
072
0.04
0.15
0.13
0.17
118
17.3
0.15
0.20
0.17
0.18
0.17
0.18
0.18
0.21
0.13
0.21
0.03
0.00
20.
010.
190.
220.
230.
131
1977
.80.
060.
140.
090.
070.
220.
160.
200.
190.
160.
190.
012
0.05
20.
030.
220.
150.
220.
150.
151
2040
.92
0.03
0.23
0.36
0.09
0.13
0.11
0.17
0.14
0.12
0.17
0.12
0.00
20.
020.
170.
190.
210.
160.
190.
181
2178
.20.
040.
120.
150.
110.
140.
130.
180.
170.
140.
200.
100.
040.
000.
190.
200.
230.
150.
200.
200.
211
2255
.90.
000.
070.
080.
030.
070.
090.
150.
120.
120.
170.
062
0.02
20.
050.
130.
190.
210.
180.
130.
220.
190.
211
2328
.70.
040.
110.
120.
120.
190.
150.
270.
210.
210.
220.
022
0.04
20.
030.
190.
210.
260.
250.
240.
230.
220.
270.
251
Notes:n¼
2,29
5;1,
JIT
;2,
trai
nin
gin
qu
alit
y;
3,tr
ain
ing
pro
ble
mso
lvin
g;
4,se
lf-i
nsp
ecti
on;
5,re
cord
sfa
ult
san
dco
mp
lain
ts;
6,q
ual
ity
reco
rds;
7,cu
stom
ersu
rvey
s;8,
qu
alit
yta
rget
s;9,
cust
omer
/ser
vic
eta
rget
s;10
,te
amb
riefi
ng
son
qu
alit
y;
11,
task
var
iety
;12
,m
eth
odco
ntr
ol;
13,
tim
ing
con
trol
;14
,fu
nct
ion
alfl
exib
ilit
y;
15,
team
wor
kin
g;
16,
team
bri
efin
g;
17,
sug
ges
tion
sch
emes
;18
,q
ual
ity
circ
les;
19,
ind
uct
ion
;20
,tr
ain
ing
for
HR
skil
ls;
21,
info
rmat
ion
dis
clos
ure
;22
,ap
pra
isal
;23
,su
rvey
feed
bac
km
eth
od
Table AI.Weighted frequencies ofpractice uses andSpearman correlationcoefficients
IJOPM32,3
328