jobs in canada
DESCRIPTION
reTRANSCRIPT

JOBS IN CANADA Where, What and For Whom?
October 22, 2013
TD EconomicsDerek BurletonVice President and Deputy Chief Economist
Sonya GulatiSenior Economist
Connor McDonaldEconomist
Sonny ScarfoneResearch Associate
TD Economics | www.td.com/economics
TABLE OF CONTENTS
EXECUTIVE SUMMARY . . . . . . . . . . . . . . . . . . . . . . . . . . . . . . . . . . . . . . . . . . . . . . . . . . . . . . . . . . . . . . . . . . . . . . . . . .1INTRODUCTION . . . . . . . . . . . . . . . . . . . . . . . . . . . . . . . . . . . . . . . . . . . . . . . . . . . . . . . . . . . . . . . . . . . . . . . . . . . . . . . .6A 10-YEAR RETROSPECTIVE OF JOBS . . . . . . . . . . . . . . . . . . . . . . . . . . . . . . . . . . . . . . . . . . . . . . . . . . . . . . . . . . . . .7
Canadian employers have been fairly busy . . . . . . . . . . . . . . . . . . . . . . . . . . . . . . . . . . . . . . . . . . . . . . . . . . . . . . . . .7Factory job cuts but strength mostly everywhere else . . . . . . . . . . . . . . . . . . . . . . . . . . . . . . . . . . . . . . . . . . . . . . . . .7Construction and professional services the biggest lifters . . . . . . . . . . . . . . . . . . . . . . . . . . . . . . . . . . . . . . . . . . . . . .8The tilt of job creation westward . . . . . . . . . . . . . . . . . . . . . . . . . . . . . . . . . . . . . . . . . . . . . . . . . . . . . . . . . . . . . . . . . .9Urbanization continues apace . . . . . . . . . . . . . . . . . . . . . . . . . . . . . . . . . . . . . . . . . . . . . . . . . . . . . . . . . . . . . . . . . . .10Textbox 1: Distinguishing jobs of different skill types . . . . . . . . . . . . . . . . . . . . . . . . . . . . . . . . . . . . . . . . . . . . . . . . . .10Education requirements for jobs continue to rise . . . . . . . . . . . . . . . . . . . . . . . . . . . . . . . . . . . . . . . . . . . . . . . . . . . .11Seniors leaving a bigger mark . . . . . . . . . . . . . . . . . . . . . . . . . . . . . . . . . . . . . . . . . . . . . . . . . . . . . . . . . . . . . . . . . . .12Temporary jobs increasingly common . . . . . . . . . . . . . . . . . . . . . . . . . . . . . . . . . . . . . . . . . . . . . . . . . . . . . . . . . . . . .14Textbox 2: A Primer on the Different Types of Unemployment . . . . . . . . . . . . . . . . . . . . . . . . . . . . . . . . . . . . . . . . . .15
THE PERCEPTION OF LABOUR SHORTAGES AND SKILLS MISMATCH . . . . . . . . . . . . . . . . . . . . . . . . . . . . . . . . . .16Textbox 3: Shortages and Mismatch: Definitions and Types . . . . . . . . . . . . . . . . . . . . . . . . . . . . . . . . . . . . . . . . . . . .17Labour supply growing at a good clip . . . . . . . . . . . . . . . . . . . . . . . . . . . . . . . . . . . . . . . . . . . . . . . . . . . . . . . . . . . . .17Why all the concern about a lack of skills? . . . . . . . . . . . . . . . . . . . . . . . . . . . . . . . . . . . . . . . . . . . . . . . . . . . . . . . . .18The story behind recent PSE graduates . . . . . . . . . . . . . . . . . . . . . . . . . . . . . . . . . . . . . . . . . . . . . . . . . . . . . . . . . . .19Textbox 4: How Have Traditionally Under-represented Demographic Groups Fared? . . . . . . . . . . . . . . . . . . . . . . . .20Textbox 5: Are Liberal Arts Degrees a Useful Endeavour? . . . . . . . . . . . . . . . . . . . . . . . . . . . . . . . . . . . . . . . . . . . . .23Gaps in foundation and soft skills also a challenge . . . . . . . . . . . . . . . . . . . . . . . . . . . . . . . . . . . . . . . . . . . . . . . . . . .24
TESTING THE THEORY OF SKILLS MISMATCH . . . . . . . . . . . . . . . . . . . . . . . . . . . . . . . . . . . . . . . . . . . . . . . . . . . . . .25No aggregate shortage . . . . . . . . . . . . . . . . . . . . . . . . . . . . . . . . . . . . . . . . . . . . . . . . . . . . . . . . . . . . . . . . . . . . . . . .26Enough workers but not in the right places or job types? . . . . . . . . . . . . . . . . . . . . . . . . . . . . . . . . . . . . . . . . . . . . . .26Textbox 6: Measuring Employment Vacancies in the Canadian Economy . . . . . . . . . . . . . . . . . . . . . . . . . . . . . . . . .27Evidence of regional and occupational mismatch . . . . . . . . . . . . . . . . . . . . . . . . . . . . . . . . . . . . . . . . . . . . . . . . . . . .29
ARE WE AT THE TIP OF THE ICEBERG? . . . . . . . . . . . . . . . . . . . . . . . . . . . . . . . . . . . . . . . . . . . . . . . . . . . . . . . . . . .33REFORM TODAY REDUCES THE RISK OF A FULL-BLOWN CRISIS IN THE FUTURE . . . . . . . . . . . . . . . . . . . . . . .33
Textbox 7: The Long-term Forecasts of Persistent Labour Shortages: Caveat Emptor . . . . . . . . . . . . . . . . . . . . . . .34STRATEGIES TO MITIGATE SKILLS MISMATCH & LABOUR SHORTAGES . . . . . . . . . . . . . . . . . . . . . . . . . . . . . . . .35
Employers . . . . . . . . . . . . . . . . . . . . . . . . . . . . . . . . . . . . . . . . . . . . . . . . . . . . . . . . . . . . . . . . . . . . . . . . . . . . . . . . . .36Textbox 8: Bridging the Generational Divide in the Workplace . . . . . . . . . . . . . . . . . . . . . . . . . . . . . . . . . . . . . . . . . .37Federal and provincial governments . . . . . . . . . . . . . . . . . . . . . . . . . . . . . . . . . . . . . . . . . . . . . . . . . . . . . . . . . . . . . .39Workers . . . . . . . . . . . . . . . . . . . . . . . . . . . . . . . . . . . . . . . . . . . . . . . . . . . . . . . . . . . . . . . . . . . . . . . . . . . . . . . . . . . .41Education and training providers . . . . . . . . . . . . . . . . . . . . . . . . . . . . . . . . . . . . . . . . . . . . . . . . . . . . . . . . . . . . . . . . .41A strategy that would have everybody’s buy-in . . . . . . . . . . . . . . . . . . . . . . . . . . . . . . . . . . . . . . . . . . . . . . . . . . . . . .42
PARTING THOUGHTS . . . . . . . . . . . . . . . . . . . . . . . . . . . . . . . . . . . . . . . . . . . . . . . . . . . . . . . . . . . . . . . . . . . . . . . . . . .43APPENDIX 1 – OCCUPATIONS IN PERCEIVED SHORTAGE & SURPLUS – CANADA . . . . . . . . . . . . . . . . . . . . . . . .44APPENDIX 2 – OCCUPATIONS IN PERCEIVED SHORTAGE & SURPLUS – PROVINCIAL . . . . . . . . . . . . . . . . . . . .45APPENDIX 3 – LABOUR DEMAND: SURPLUSES & DEFICITS, NOW AND IN THE FUTURE . . . . . . . . . . . . . . . . . . .47REFERENCES AND END NOTES . . . . . . . . . . . . . . . . . . . . . . . . . . . . . . . . . . . . . . . . . . . . . . . . . . . . . . . . . . . . . . . . . .51

SPECIAL REPORTTD Economics
Canada’s job record over the past decade has been robust, especially relative to other G-7 coun-tries. This performance is even more noteworthy when underlying trends are reviewed: there has been a monumental shift towards employment in non-manufacturing sectors and greater prevalence of work in non-standard job structures. While Canada’s overall job creation tally is medal worthy, there have been growing concerns about a mismatch between the types of skills demanded by employers and those possessed by job seekers. Some forecasters have made worrisome predictions of large and persistent labour shortages well into the future. There are also widespread views that the Canadian job market is becoming increasingly polarized and that today’s youth will be a “lost generation”.
The findings in this report pour some cold water on these perceptions – there is some evidence of tightness across certain occupations and regions, but the analysis failed to provide a real smoking gun. While we find no evidence of an imminent crisis, Canada can do much better to improve the efficiency of its labour market. Greater labour market information and other targeted strategies and policies would help in this regard. Furthermore, a more skilled workforce and efficient labour market is a vital component to achieving and sustaining improved productivity and economic growth over the long haul.
October 22, 2013
Derek Burleton, VP & Deputy Chief Economist, 416-982-2514Sonya Gulati, Senior Economist, 416-982-8063
Executive Summary
JOBS IN CANADA Where, What and For Whom?
Connor McDonald, Economist, 416-944-5729Sonny Scarfone, Research Associate, 416-944-5069
Highlights • Canada’s job record over the past decade has been robust, especially relative to other G-7 countries.
Under the surface, monumental longer-term shifts continue to take place, including greater labour force participation of older workers and a gravitation towards more non-standard job structures .
• The notion of a severe labour market skills mismatch has topped the headlines. With data in hand, we debunk the notion that Canada is facing an imminent skills crisis . At the same time, there is some evidence of mismatch across certain occupations and provinces, but the sparse, non-time series data prevent us from saying whether the situation today is worse than in years past .
• Despite the absence of a so-called “burning platform”, bold movement is warranted to maintain Canada’s standard of living today and into the future . An efficient labour market is a critical element towards achieving this end goal .
• In light of the importance of skills, governments across the country are formalizing their training and jobs strategies . However, governments cannot act alone . Employers, educators and employees need to join the fray . We review several strategies which have already been implemented, but note that many are experiencing varying degrees of success .
TD Economics | www.td.com/economics
2October 22, 2013
An eventful past decade
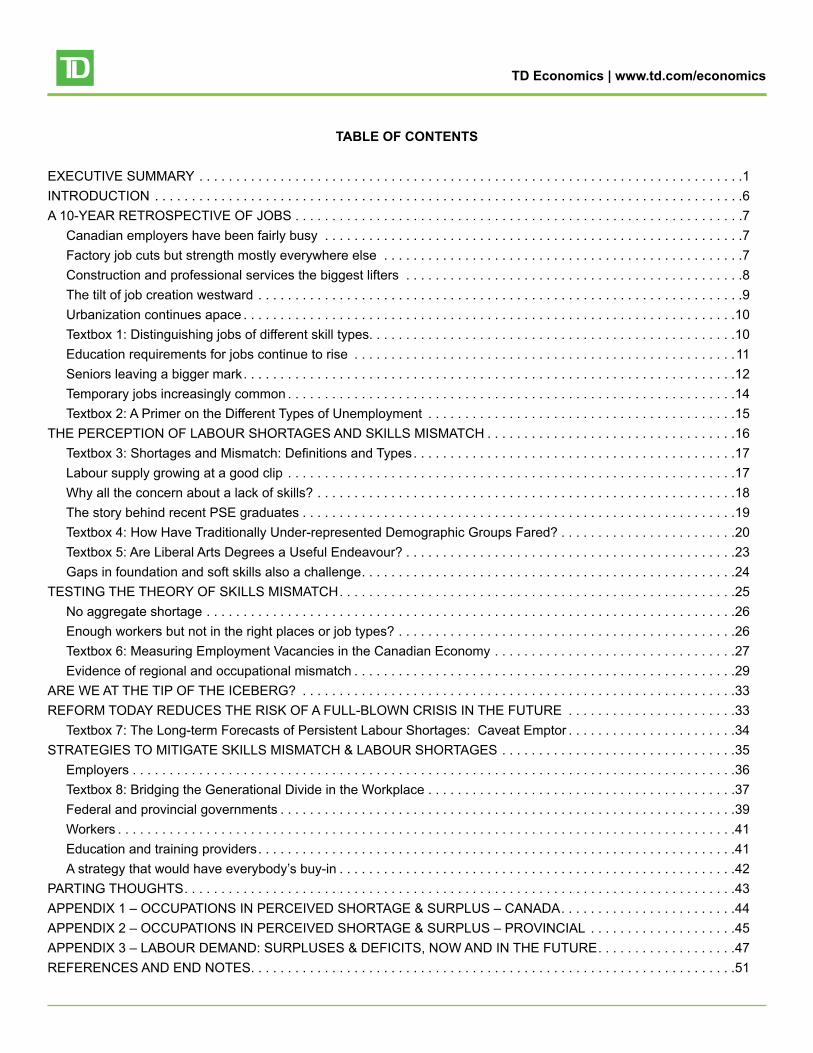
Labour markets are subject to continual change, and this past decade has provided a further case in point. Outstrip-ping their G-7 counterparts by a wide margin, Canadian employers have added to payrolls at a strong rate since the early 2000s. This confidence has been underpinned by a number of factors, including a longer-term upward shift in commodity prices and an extended real estate boom. Other influences include sound macroeconomic, financial and regulatory policies which helped the country weather the economic downturn of 2008-09.
Some relevant trends over the past decade are summa-rized and explored in more detail in the report:
• Employment gains were not equally shared across sectors and regions. Consistent with shifts in migration flows, job growth has gravitated towards the resource-based west and away from manufacturing-based central Canada and the Atlantic. That said, all provinces except New Brunswick have registered moderate-to-brisk job creation over the past 10 years.
• The balance of the national job gains continued to swing towards large urban centres. With young and highly-skilled workers increasingly desiring the amenities of downtown life, the pronounced suburbanization trend seen in the 1990s has cooled in recent years.
• A degree of polarization (i.e. rapidly-growing demand for high- and low-skilled employment at the expense of medium-skilled jobs) has taken place in Canada, but not nearly to the same extent as that observed in the U.S. This outcome is due in part to the resource and construction booms which have provided support to a number of middle-skilled jobs in this country.
• Older workers are punching well beyond their weight in terms of their contribution to net new employment. At the other end of the age spectrum, the challenges of youth in the job market have intensified since the onset of the recession. The still-elevated youth unemployment rate partly reflects the fact that younger workers tend to be the last to get re-hired during an economic recovery.
• Temporary jobs – especially contract positions – have been on a gradual rise and now make up one-in-seven positions. This upward trend has fuelled concerns surrounding the quality of jobs being created. At the same time, temporary jobs can be appealing, especially
for older workers who are transitioning into full retirement or those workers with young children looking for flexibility.
Are skills gaps a growing constraint on hiring?
Although Canada has enjoyed a respectable job record over the past decade, there has been growing speculation that employer hiring has been held back by a lack of avail-able workers and/or inadequate skills. Prior to the 2008-09 recession, there was much ink spilt about the challenge of economy-wide skills shortages. Since unemployment increased during the downturn, however, the attention has been more directed at job market imbalances specific to certain occupations and regions.
Perceptions can take on a life of their own without hard underlying facts supporting them. There are six key longer-term developments in Canada’s job market where the notion of skills mismatch could have been borne. Some of these myths can be easily debunked, whereas others deserve further investigation.
Perception #1: Canada’s change in industrial mix is leaving workers out of sync with current demands.
Over the past decade, certain sectors have experienced rapid growth (i.e., resources and health care) while oth-ers have been in structural decline (i.e., manufacturing). However, it is unclear to what extent these changes have contributed to mismatch and/or worsened since the 1990s, which was another decade of rapid industrial change. The job market ultimately adjusts, but changes can take time.
EMPLOYMENT LEVELS ACROSS THE G7
80
85
90
95
100
105
110
2000 2002 2004 2006 2008 2010 2012
Canada G7 U .S .
Employment level, indexed to 2007 Q4 = 100
Source: Haver Analytics .

TD Economics | www.td.com/economics
3October 22, 2013
Perception #2: Regional growth differences and mobility challenges are constraining labour mobility.
The rapid economic growth in the Prairies has resulted in shortages of many occupations, while other regions are home to surpluses. The number of workers willing to relocate within provinces or live in one jurisdiction and commute to another has increased over the past decade. Yet, the population share of Canadians that have actually moved across provincial boundaries has been stagnant, due in part to challenges related to credential recognition within regulated fields.
Perception #3: Barriers prevent certain Canadians from fully participating in the labour force.
Structural impediments to workforce involvement are holding back the labour force participation of Aboriginal peoples, those with disabilities and, to a lesser extent, women. While progress has been made in recent years, the gaps in labour force outcomes relative to the Canadian average are often stark.
Perception #4: Workers are having a hard time keeping up with the rapid advancements in technology.
Of the six perceptions, this one has the least merit. While it is true that technology has taken off particularly over the last decade, it is debatable whether the impacts on labour supply from technological advances are any more significant than in prior decades.
Perception #5: Potential employees are “book smart”, not “job smart.”
The discussion of skills shortages has moved away from formal education to a broader definition that includes the foundation skills of literacy, math and problem solving in technologically-rich environments and “soft skills”, which include communication and leadership skills. Surveys show that employers are complaining in larger numbers that candidates lack these types of skills which are imperative to success on the job. Yet, according to the OECD, Canada fares reasonably well in terms of the fit of foundational skills of employees with the needs of the job.
Perception #6: Canada’s post-secondary education system is pumping out the wrong graduates.
Some believe that the post-secondary system is graduat-ing too many Canadians in areas which are not in demand, thus leaving a large pool of underemployed people. OECD over-qualification and under-qualification rates for Canada relative to other countries provide some supporting evi-dence. Still, the job market outcomes of recent graduates, including those with liberal arts degrees, are likely better than many Canadians perceive.
Testing for labour shortages and mismatch
In order to see how well perception lines up with real-ity, we carry out a test of the extent of labour shortages and skills mismatch more directly with the relatively limited available data. Several methodological approaches were used, as it is particularly difficult to measure the extent of skills mismatch, if any, given that it is hard to measure skills
LABOUR FORCE PARTICIPATION RATE OF UNDERREPRESENTED GROUPS
59 .0
59 .5
60 .0
60 .5
61 .0
61 .5
62 .0
62 .5
63 .0
63 .5
2001 2006 2011
Women Aboriginals*
Immigrants
Source: Statistics Canada, 2011 National Household Survey, 2001 & 2006 Census .
Participation Rate, %
WHAT ARE THE GREATEST CHALLENGES FACINGCANADIAN BUSINESSES?
32
30
8
8
6
5
4
4
4
9
0 5 10 15 20 25 30 35
Shortage of skilled workers
General state of the economy
Staffing challenges (general)
Retaining current staff
Foreign competition
Operating costs
High Canadian dollar
Regulation / red tape
Shortage of experiencedmanagement
Other
Note: Respondents could select 2+ answers; % do not sum to 100 .Source: Workopolis, Mind the Gap .
% of respondents
TD Economics | www.td.com/economics
4October 22, 2013
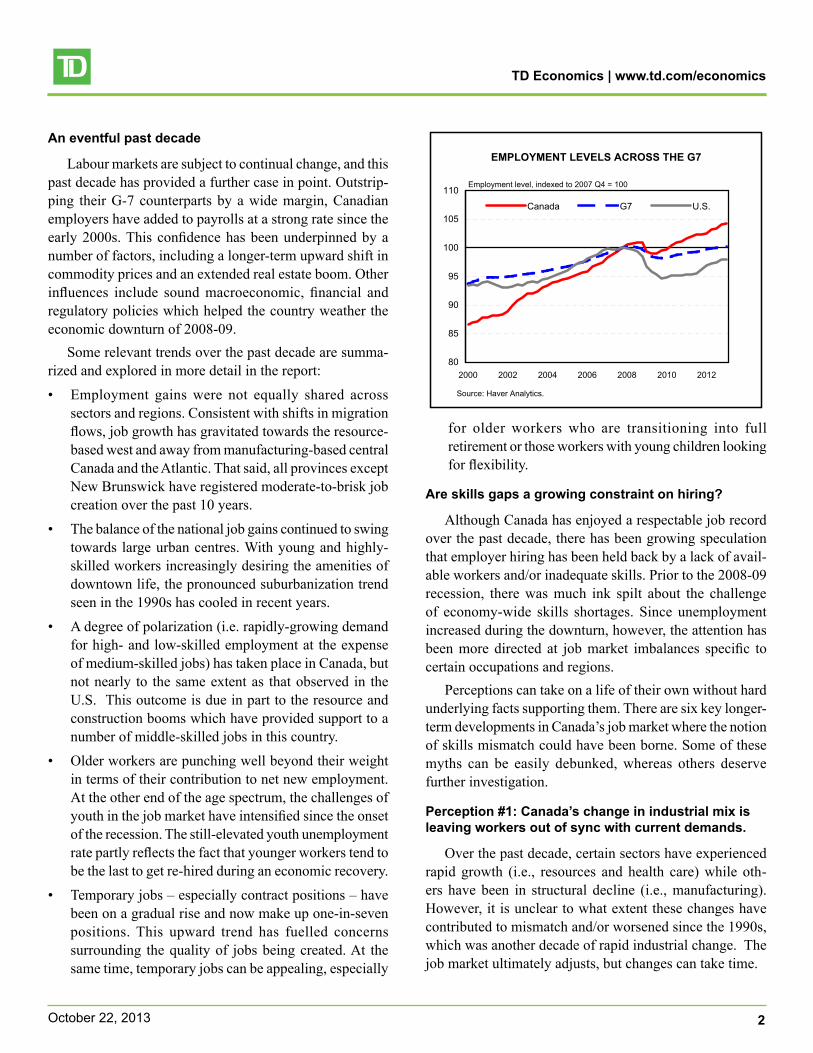
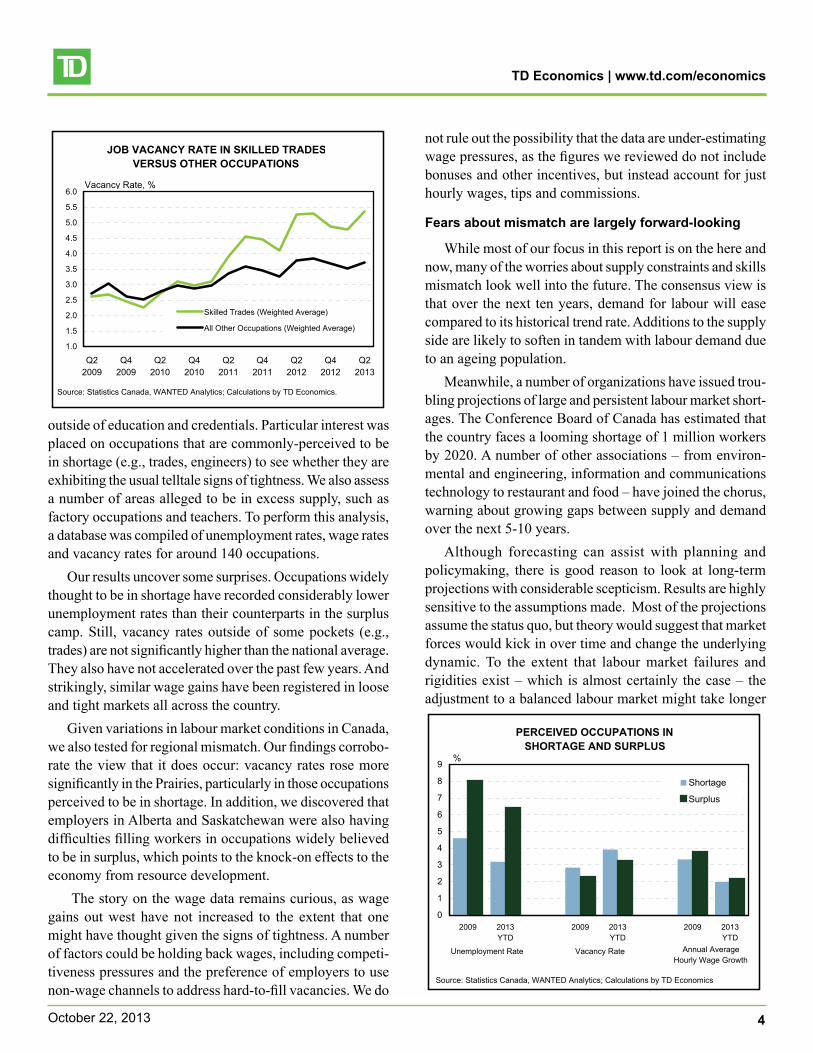
outside of education and credentials. Particular interest was placed on occupations that are commonly-perceived to be in shortage (e.g., trades, engineers) to see whether they are exhibiting the usual telltale signs of tightness. We also assess a number of areas alleged to be in excess supply, such as factory occupations and teachers. To perform this analysis, a database was compiled of unemployment rates, wage rates and vacancy rates for around 140 occupations.
Our results uncover some surprises. Occupations widely thought to be in shortage have recorded considerably lower unemployment rates than their counterparts in the surplus camp. Still, vacancy rates outside of some pockets (e.g., trades) are not significantly higher than the national average. They also have not accelerated over the past few years. And strikingly, similar wage gains have been registered in loose and tight markets all across the country.
Given variations in labour market conditions in Canada, we also tested for regional mismatch. Our findings corrobo-rate the view that it does occur: vacancy rates rose more significantly in the Prairies, particularly in those occupations perceived to be in shortage. In addition, we discovered that employers in Alberta and Saskatchewan were also having difficulties filling workers in occupations widely believed to be in surplus, which points to the knock-on effects to the economy from resource development.
The story on the wage data remains curious, as wage gains out west have not increased to the extent that one might have thought given the signs of tightness. A number of factors could be holding back wages, including competi-tiveness pressures and the preference of employers to use non-wage channels to address hard-to-fill vacancies. We do
not rule out the possibility that the data are under-estimating wage pressures, as the figures we reviewed do not include bonuses and other incentives, but instead account for just hourly wages, tips and commissions.
Fears about mismatch are largely forward-looking
While most of our focus in this report is on the here and now, many of the worries about supply constraints and skills mismatch look well into the future. The consensus view is that over the next ten years, demand for labour will ease compared to its historical trend rate. Additions to the supply side are likely to soften in tandem with labour demand due to an ageing population.
Meanwhile, a number of organizations have issued trou-bling projections of large and persistent labour market short-ages. The Conference Board of Canada has estimated that the country faces a looming shortage of 1 million workers by 2020. A number of other associations – from environ-mental and engineering, information and communications technology to restaurant and food – have joined the chorus, warning about growing gaps between supply and demand over the next 5-10 years.
Although forecasting can assist with planning and policymaking, there is good reason to look at long-term projections with considerable scepticism. Results are highly sensitive to the assumptions made. Most of the projections assume the status quo, but theory would suggest that market forces would kick in over time and change the underlying dynamic. To the extent that labour market failures and rigidities exist – which is almost certainly the case – the adjustment to a balanced labour market might take longer
JOB VACANCY RATE IN SKILLED TRADESVERSUS OTHER OCCUPATIONS
1 .0
1 .5
2 .0
2 .5
3 .0
3 .5
4 .0
4 .5
5 .0
5 .5
6 .0
Q22009
Q42009
Q22010
Q42010
Q22011
Q42011
Q22012
Q42012
Q22013
Skilled Trades (Weighted Average)
All Other Occupations (Weighted Average)
Source: Statistics Canada, WANTED Analytics; Calculations by TD Economics .
Vacancy Rate, %
PERCEIVED OCCUPATIONS IN SHORTAGE AND SURPLUS
0
1
2
3
4
5
6
7
8
9
2009 2013YTD
2009 2013YTD
2009 2013YTD
Shortage
Surplus
Unemployment Rate Vacancy Rate Annual Average Hourly Wage Growth
%
Source: Statistics Canada, WANTED Analytics; Calculations by TD Economics
TD Economics | www.td.com/economics
5October 22, 2013
than it previously did. Many of these projections also use growth account-
ing that is on shaky ground. They start with the notion of some pre-determined growth rate that the economy “should achieve”, deduct trend labour force gains and productivity, and work out a gap in the labour pool that grows over time. However, the economy’s capacity to grow is determined by the labour supply, rather than the opposite.
A clarion call for action
A number of inherent weaknesses are likely to limit the labour market’s ability to adjust to structural changes and hold back the economy’s potential to create jobs over the long run. Delaying appropriate actions to maximize labour market efficiency until a “burning platform” emerges is ill-advised and imprudent. There is too much at stake for all Canadians to adopt a wait-and-see approach. In this regard, we were pleased to see the focus on skills and train-ing development in the 2013 government budget season. However, a more concerted effort across not only the federal and provincial governments but employers, employees and educators will be needed to provide Canada with a world-leading workforce for the 21st century.
Examples of strategies which could improve the perfor-mance of the labour market, now and into the future, include:
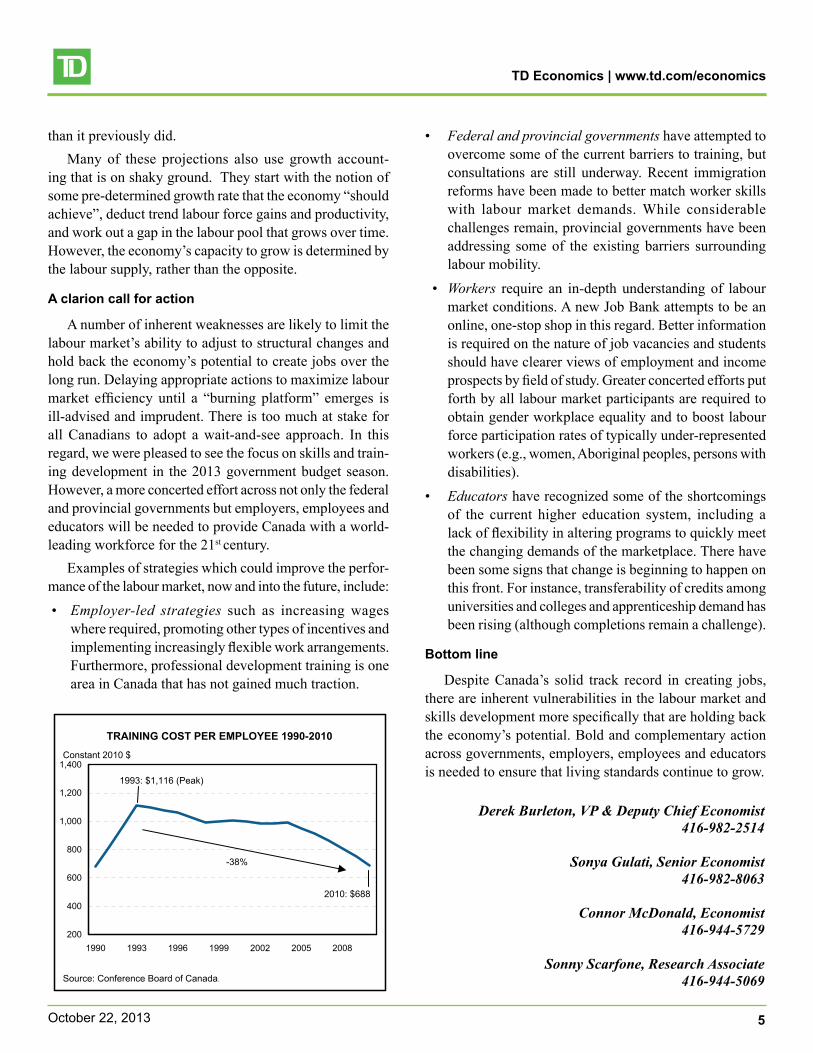
• Employer-led strategies such as increasing wages where required, promoting other types of incentives and implementing increasingly flexible work arrangements. Furthermore, professional development training is one area in Canada that has not gained much traction.
• Federal and provincial governments have attempted to overcome some of the current barriers to training, but consultations are still underway. Recent immigration reforms have been made to better match worker skills with labour market demands. While considerable challenges remain, provincial governments have been addressing some of the existing barriers surrounding labour mobility.
• Workers require an in-depth understanding of labour market conditions. A new Job Bank attempts to be an online, one-stop shop in this regard. Better information is required on the nature of job vacancies and students should have clearer views of employment and income prospects by field of study. Greater concerted efforts put forth by all labour market participants are required to obtain gender workplace equality and to boost labour force participation rates of typically under-represented workers (e.g., women, Aboriginal peoples, persons with disabilities).
• Educators have recognized some of the shortcomings of the current higher education system, including a lack of flexibility in altering programs to quickly meet the changing demands of the marketplace. There have been some signs that change is beginning to happen on this front. For instance, transferability of credits among universities and colleges and apprenticeship demand has been rising (although completions remain a challenge).
Bottom line
Despite Canada’s solid track record in creating jobs, there are inherent vulnerabilities in the labour market and skills development more specifically that are holding back the economy’s potential. Bold and complementary action across governments, employers, employees and educators is needed to ensure that living standards continue to grow.
Derek Burleton, VP & Deputy Chief Economist 416-982-2514
Sonya Gulati, Senior Economist 416-982-8063
Connor McDonald, Economist 416-944-5729
Sonny Scarfone, Research Associate 416-944-5069
TRAINING COST PER EMPLOYEE 1990-2010
200
400
600
800
1,000
1,200
1,400
1990 1993 1996 1999 2002 2005 2008
1993: $1,116 (Peak)
Constant 2010 $
2010: $688
-38%
Source: Conference Board of Canada .

SPECIAL REPORTTD Economics
On the surface, Canada’s job record over the past decade has been robust, especially relative to other G-7 countries. Under the surface, monumental longer-term shifts have been underway in the nature of employment in this country – from the shift away from traditional manufacturing towards other sectors, to the growing importance of big cities as job generators. The transition in the job pool towards higher skilled workers, older workers, and more non-standard job structures is leaving an indelible mark. In this special report, we examine the key hiring trends that have been sweeping the nation.
We also put to the test some commonly-held perceptions surrounding jobs and skills more generally. There are few subjects that garner the same degree of attention as jobs, given their critical importance to an economy and households’ standard of living. At the same time, however, few areas tend to be such fertile ground for widespread perceptions to form, some of which are based on anecdote rather than hard data. In recent years, the notion of a severe and growing mismatch between the types of skills demanded by employers and those possessed by job seekers has topped the headlines. There are also widespread views that the Canadian job market has become increasingly polarized and that today’s youth will be a “lost generation.”
Our analysis of the available data reveals that while some of these perceptions are exaggerated, others appear to be closer to the mark. We debunk the notion that Canada is facing an imminent skills crisis or that the job market is headed for persistent economy-wide labour shortages over the long haul, as some have led us to believe. Canada’s labour market has demonstrated elements of “polarization” across skill and wage levels, but not to the same extent as in the United States. Meanwhile, our data test uncovers evidence of skills mismatch across certain occupations and provinces. Unfortunately, information gaps don’t allow us to ascertain to what extent, or if, the situation has worsened over the past decade.
Despite the absence of a so-called “burning platform”, we were pleased to see governments put skills development and addressing talent gaps squarely on their radar screen in this year’s budget season. First, a number of inherent weaknesses in the system unnecessarily hold back the economy’s potential to create jobs and limit competitiveness. Some of these notable impediments relate to labour mobility, under-representation of Aboriginal peoples and other groups, and inadequate job training. In other words, Canada could still do much better. Second, these weaknesses have been limiting – and will continue to limit – the job market’s potential to adjust to an ageing population and other large structural shifts. Accordingly, bold movement on these issues is warranted.
However, governments cannot act alone. Employers, educators and employees need to join the fray. In the final section, we discuss several key strategies to address skills deficiencies – many of which are already being implemented, but are experiencing varying degrees of success.
October 22, 2013
JOBS IN CANADAWhere, What and For Whom?
Derek Burleton, VP & Deputy Chief Economist, 416-982-2514Sonya Gulati, Senior Economist, 416-982-8063
Connor McDonald, Economist, 416-944-5729Sonny Scarfone, Research Associate, 416-944-5069

TD Economics | www.td.com/economics
7October 22, 2013
A 10-YEAR RETROSPECTIVE OF JOBS
Canadian employers have been fairly busy
Our point of departure is Canada’s job showing from the 35,000 foot high level. The focus is cast on the past ten years of developments, a period sufficient to provide a good snapshot of longer-term trends. And, rather conveniently, the period’s starting and end points – 2003 and 2013, re-spectively – are at similar points along the economic cycle.
Put simply, Canadian employers have been busier than their G-7 counterparts in expanding payrolls in the past decade. Net new jobs in Canada have grown on an annual average basis of 1.3% per year, more than a full percentage point stronger than the 0.3% average annual rate recorded within the G-7 over the same period. As Chart 1 shows, this outperformance was posted in the years leading up to the 2008-09 recession, during the downturn and each of the years of the subsequent recovery.
Gains in Canadian employment have managed to outpace labour force increases by a small margin on a trend basis. As a result, Canada’s unemployment rate (7.2%) stands slightly lower than the 7.5% level posted a decade ago. Over the period, the rate has oscillated between a low of 6% in 2007 and a high of 8.3% in 2009. Within the G-7, only Germany has managed to post a larger decrease in its unemployment rate – and a more significant increase in its employment-to-population ratio – than Canada since the early 2000s.
Canada’s relative success on the hiring front can be chalked up to a number of factors. Prior to the recession in 2008-09, a mix of declining interest rates, booming global growth and rising commodity prices fuelled output, profits
and demand for labour across most pockets of the economy. The recession represented a setback, but one largely concen-trated in the export-oriented goods sector. In contrast, with Canada home to a sound financial system, a relatively robust government fiscal position and a strong overall macroeco-nomic environment, most domestic-oriented industries took only a temporary breather. And, in some areas – notably the public sector – hiring didn’t miss a beat in the recession and its immediate aftermath, as governments primed the stimulus spending pump. Since 2010, employment conditions on the export side of the economy have improved in tandem with global economic conditions, helping Canada to recoup the 432,000 net job losses suffered during the 2008-09 down-turn in short order. In fact, there are 600,000 more people working today than was the case before the recession hit.
Factory job cuts but strength mostly everywhere else
Table 1 confirms that job creation has been quite broad-based across sectors over the past ten years – that is, with a few notable exceptions.
One particular outlier has been manufacturing (see Chart 2), where the sizeable upswing in employment in the 1990s almost fully reversed in the 2000s. This decade-long slump in factory labour demand occurred on the back of the longer-term run up in the Canadian dollar, right-to-work legislation in competing U.S. jurisdictions, rising energy input prices, a thickened U.S. border post 9/11, and increased competi-tion from emerging economies. The economic problems in the United States over the past five years – and the over-reliance of Canadian factories on U.S. demand – have added further insult to injury. In addition, while manufacturing
CHART 1: EMPLOYMENT LEVELS ACROSS THE G-7
80
85
90
95
100
105
110
2000 2002 2004 2006 2008 2010 2012
Canada G7 U .S .
Employment level, indexed to 2007 Q4 = 100
Source: Haver Analytics .
CHART 2: CANADIAN EMPLOYMENT WITHAND WITHOUT MANUFACTURING
95
100
105
110
115
120
125
130
135
2000 2002 2004 2006 2008 2010 2012
All IndustriesExcludes Manufacturing
Source: Haver Analytics/Statistics Canada .
Employment Index (January 2000=100)
TD Economics | www.td.com/economics
8October 22, 2013
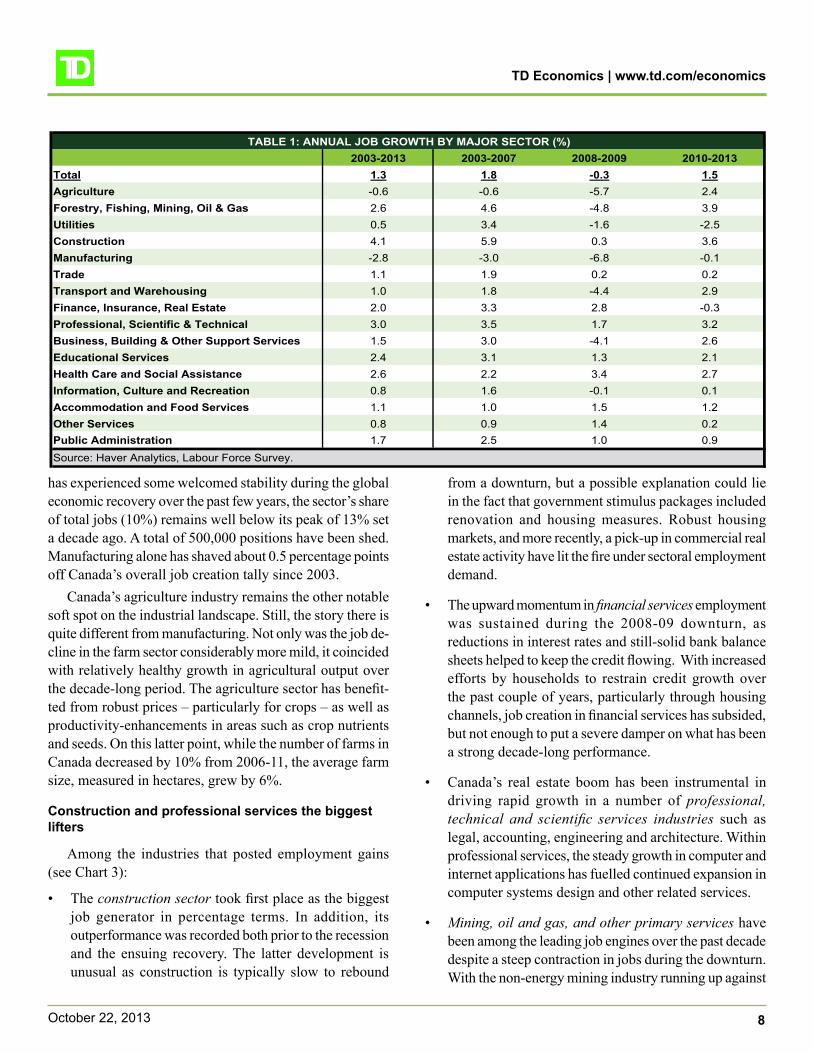
has experienced some welcomed stability during the global economic recovery over the past few years, the sector’s share of total jobs (10%) remains well below its peak of 13% set a decade ago. A total of 500,000 positions have been shed. Manufacturing alone has shaved about 0.5 percentage points off Canada’s overall job creation tally since 2003.
Canada’s agriculture industry remains the other notable soft spot on the industrial landscape. Still, the story there is quite different from manufacturing. Not only was the job de-cline in the farm sector considerably more mild, it coincided with relatively healthy growth in agricultural output over the decade-long period. The agriculture sector has benefit-ted from robust prices – particularly for crops – as well as productivity-enhancements in areas such as crop nutrients and seeds. On this latter point, while the number of farms in Canada decreased by 10% from 2006-11, the average farm size, measured in hectares, grew by 6%.
Construction and professional services the biggest lifters
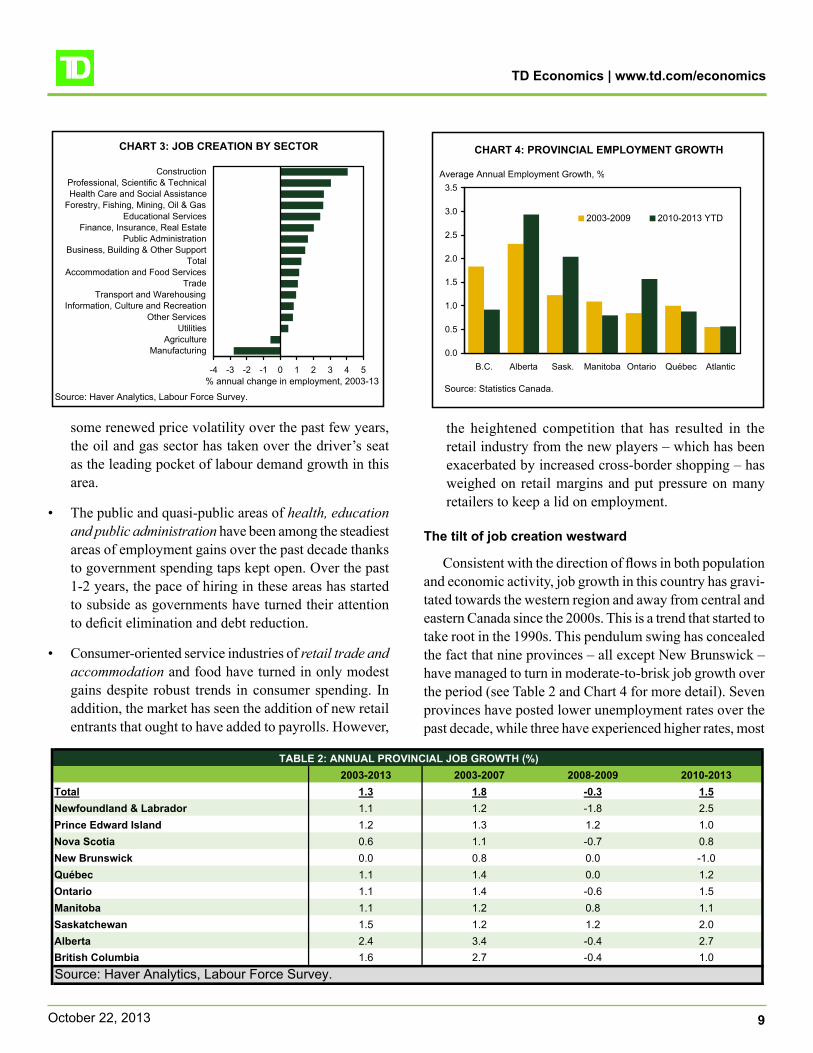
Among the industries that posted employment gains (see Chart 3):
• The construction sector took first place as the biggest job generator in percentage terms. In addition, its outperformance was recorded both prior to the recession and the ensuing recovery. The latter development is unusual as construction is typically slow to rebound
from a downturn, but a possible explanation could lie in the fact that government stimulus packages included renovation and housing measures. Robust housing markets, and more recently, a pick-up in commercial real estate activity have lit the fire under sectoral employment demand.
• The upward momentum in financial services employment was sustained during the 2008-09 downturn, as reductions in interest rates and still-solid bank balance sheets helped to keep the credit flowing. With increased efforts by households to restrain credit growth over the past couple of years, particularly through housing channels, job creation in financial services has subsided, but not enough to put a severe damper on what has been a strong decade-long performance.
• Canada’s real estate boom has been instrumental in driving rapid growth in a number of professional, technical and scientific services industries such as legal, accounting, engineering and architecture. Within professional services, the steady growth in computer and internet applications has fuelled continued expansion in computer systems design and other related services.
• Mining, oil and gas, and other primary services have been among the leading job engines over the past decade despite a steep contraction in jobs during the downturn. With the non-energy mining industry running up against
2003-2013 2003-2007 2008-2009 2010-2013Total 1.3 1.8 -0.3 1.5Agriculture -0 .6 -0 .6 -5 .7 2 .4Forestry, Fishing, Mining, Oil & Gas 2 .6 4 .6 -4 .8 3 .9Utilities 0 .5 3 .4 -1 .6 -2 .5Construction 4 .1 5 .9 0 .3 3 .6Manufacturing -2 .8 -3 .0 -6 .8 -0 .1Trade 1 .1 1 .9 0 .2 0 .2Transport and Warehousing 1 .0 1 .8 -4 .4 2 .9Finance, Insurance, Real Estate 2 .0 3 .3 2 .8 -0 .3Professional, Scientific & Technical 3 .0 3 .5 1 .7 3 .2Business, Building & Other Support Services 1 .5 3 .0 -4 .1 2 .6Educational Services 2 .4 3 .1 1 .3 2 .1Health Care and Social Assistance 2 .6 2 .2 3 .4 2 .7Information, Culture and Recreation 0 .8 1 .6 -0 .1 0 .1Accommodation and Food Services 1 .1 1 .0 1 .5 1 .2Other Services 0 .8 0 .9 1 .4 0 .2Public Administration 1 .7 2 .5 1 .0 0 .9
TABLE 1: ANNUAL JOB GROWTH BY MAJOR SECTOR (%)
Source: Haver Analytics, Labour Force Survey .
TD Economics | www.td.com/economics
9October 22, 2013
some renewed price volatility over the past few years, the oil and gas sector has taken over the driver’s seat as the leading pocket of labour demand growth in this area.
• The public and quasi-public areas of health, education and public administration have been among the steadiest areas of employment gains over the past decade thanks to government spending taps kept open. Over the past 1-2 years, the pace of hiring in these areas has started to subside as governments have turned their attention to deficit elimination and debt reduction.
• Consumer-oriented service industries of retail trade and accommodation and food have turned in only modest gains despite robust trends in consumer spending. In addition, the market has seen the addition of new retail entrants that ought to have added to payrolls. However,
the heightened competition that has resulted in the retail industry from the new players – which has been exacerbated by increased cross-border shopping – has weighed on retail margins and put pressure on many retailers to keep a lid on employment.
The tilt of job creation westward
Consistent with the direction of flows in both population and economic activity, job growth in this country has gravi-tated towards the western region and away from central and eastern Canada since the 2000s. This is a trend that started to take root in the 1990s. This pendulum swing has concealed the fact that nine provinces – all except New Brunswick – have managed to turn in moderate-to-brisk job growth over the period (see Table 2 and Chart 4 for more detail). Seven provinces have posted lower unemployment rates over the past decade, while three have experienced higher rates, most
CHART 3: JOB CREATION BY SECTOR
-4 -3 -2 -1 0 1 2 3 4 5
ManufacturingAgriculture
UtilitiesOther Services
Information, Culture and RecreationTransport and Warehousing
TradeAccommodation and Food Services
TotalBusiness, Building & Other Support
Public AdministrationFinance, Insurance, Real Estate
Educational ServicesForestry, Fishing, Mining, Oil & GasHealth Care and Social AssistanceProfessional, Scientific & Technical
Construction
% annual change in employment, 2003-13
Source: Haver Analytics, Labour Force Survey .
CHART 4: PROVINCIAL EMPLOYMENT GROWTH
0 .0
0 .5
1 .0
1 .5
2 .0
2 .5
3 .0
3 .5
B .C . Alberta Sask . Manitoba Ontario Québec Atlantic
2003-2009 2010-2013 YTD
Source: Statistics Canada .
Average Annual Employment Growth, %
2003-2013 2003-2007 2008-2009 2010-2013Total 1.3 1.8 -0.3 1.5Newfoundland & Labrador 1 .1 1 .2 -1 .8 2 .5Prince Edward Island 1 .2 1 .3 1 .2 1 .0Nova Scotia 0 .6 1 .1 -0 .7 0 .8New Brunswick 0 .0 0 .8 0 .0 -1 .0Québec 1 .1 1 .4 0 .0 1 .2Ontario 1 .1 1 .4 -0 .6 1 .5Manitoba 1 .1 1 .2 0 .8 1 .1Saskatchewan 1 .5 1 .2 1 .2 2 .0Alberta 2 .4 3 .4 -0 .4 2 .7British Columbia 1 .6 2 .7 -0 .4 1 .0
TABLE 2: ANNUAL PROVINCIAL JOB GROWTH (%)
Source: Haver Analytics, Labour Force Survey .

TD Economics | www.td.com/economics
10October 22, 2013
notably Ontario. Unemployment rates have continued to range widely over the past few years – from a low of around 4% in Saskatchewan and Alberta to a high of almost 12% in Prince Edward Island. The prevalence of seasonal workers, tax-rate differentials and a host of other structural factors continue to help explain the sizeable regional variations.
Alberta has experienced more volatility than most prov-inces over the past ten years – undergoing a boom followed by a bust. However, over the entire period, job gains have run at roughly twice the national pace, spurred by boom-ing energy development as well as a favourable business climate that has paved the way for other industries to grow in lockstep. Assisted by a surge in housing activity and large inflows of Asian capital investment, British Columbia enjoyed an impressive performance prior to the recession, although some of the bloom has come off the rose since 2011. Saskatchewan has also fared well, reflecting the prov-ince’s impressive and fragmented commodity mix. Indeed, along with the relatively diverse economies of Manitoba and Prince Edward Island, Saskatchewan took top awards for posting a steady stream of job gains – prior to, during, and after the 2008-09 recession.
Ontario and Québec have been most exposed to the troubles in manufacturing which is not surprising given their heavy concentration in the sector. Non-manufacturing em-ployment (which comprises the bulk of jobs) has increased at +1.8% annually in both provinces since the early 2000s, pointing to some underlying resiliency in hiring. These job gains emanated from strong real estate markets and the fact that Ontario and Québec are hubs for financial and profes-
sional services. Moreover, the public sector accounted for disproportionate gains over the past decade in each province.
With fewer large-scale investment projects compared to the previous decade, the Atlantic region turned in the weak-est regional job growth. This conceals a mixed picture, as Prince Edward Island and Newfoundland and Labrador put up reasonably decent job gains, while New Brunswick and Nova Scotia struggled. Newfoundland and Labrador has been among the provincial job leaders since the recession, underpinned by development within its offshore energy and hydroelectric sectors. A case in point, the Rock’s unemploy-ment rate is the lowest it has ever been since data collection began in the mid-1970s.
Urbanization continues apace
Meanwhile, job creation continued to gravitate towards urban centres (see Chart 5). The census metropolitan areas (CMAs) now account for roughly three-quarters of em-ployed Canadians, with about half of total jobs located in the six largest city regions of Toronto, Montréal, Vancouver, Calgary, Edmonton and Ottawa-Gatineau. What’s more, the suburbanization trend that was so prominent in the 1990s and the first half of the 2000s has cooled in recent years in favour of increased movement of jobs, people and real estate development to the downtown areas. This revival has been especially evident in Toronto and Montréal, and has been attributed to the growing desire of young and highly-
Medium-skill, medium-paid jobs refer to those that typically require some formal education – usually beyond high school – but not a 4-year undergraduate degree at a university or college . This category includes many white-collar, administrative and sales occupa-tions as well as blue-collar production, operator and labourer positions .
In contrast, managers, professionals and technical workers – those typically armed with at least four years of PSE – are deemed to be employed in high-skill oc-cupations . At the other end of the spectrum, low-skilled, low-wage positions encompass a number of job types in personal, food services and protective (i .e ., security) services. Generally, in these areas, “on-the-job” training is usually sufficient .
Textbox 1: Distinguishing jobs of different skill types
CHART 5: JOB CREATION IN URBANCENTRES SINCE THE DOWNTURN
0
200
400
600
800
1,000
1,200
Canada All 33 CMAs 3 Largest CMAs
Toronto: 31%
Montréal: 13%
Vancouver: 6%
87% of All Jobs Created
in Canada Since July
2009
% of Labour Force Living in 33 CMAs: 71%
Jobs Created since July 2009, 000s
Source: Statistics Canada
TD Economics | www.td.com/economics
11October 22, 2013
skilled workers locating close to the improving amenities of the downtown area. For example, individuals in the 20-39 age range now comprise half of Toronto downtown core residents, compared to about 25% in suburban areas. An increasing number of employers and retailers are relocat-ing to the downtown core in order to take advantage of the growing labour pool.
Education requirements for jobs continue to rise
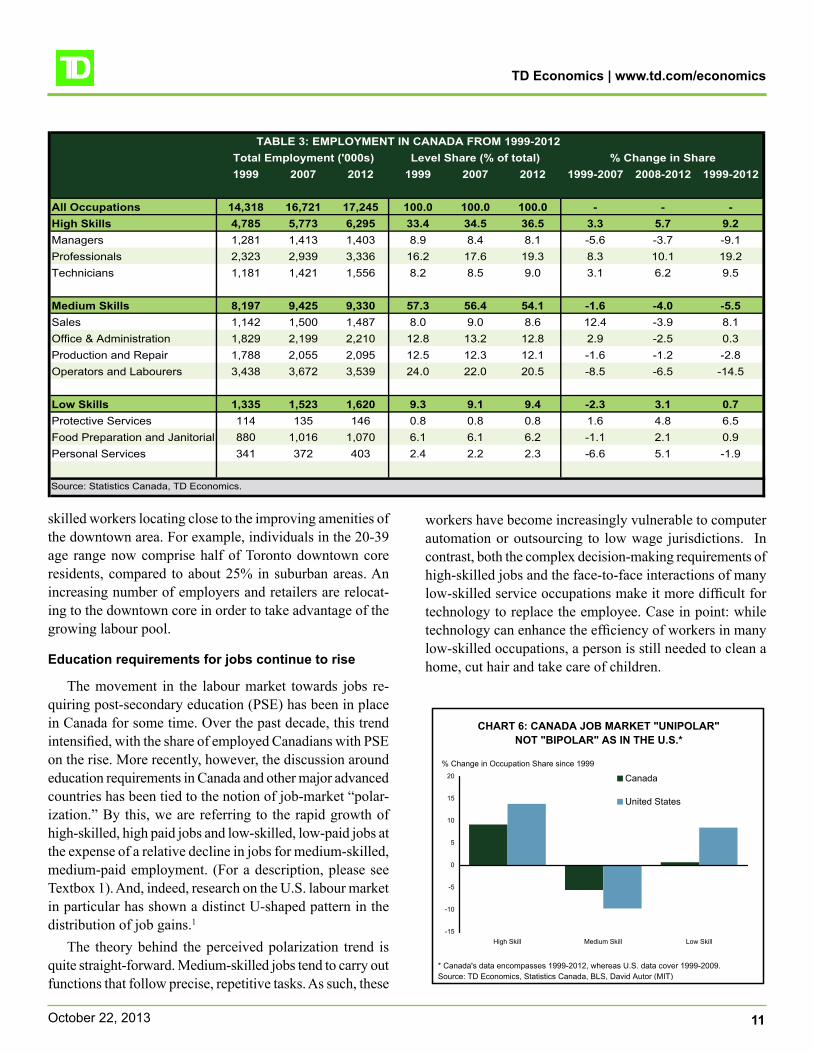
The movement in the labour market towards jobs re-quiring post-secondary education (PSE) has been in place in Canada for some time. Over the past decade, this trend intensified, with the share of employed Canadians with PSE on the rise. More recently, however, the discussion around education requirements in Canada and other major advanced countries has been tied to the notion of job-market “polar-ization.” By this, we are referring to the rapid growth of high-skilled, high paid jobs and low-skilled, low-paid jobs at the expense of a relative decline in jobs for medium-skilled, medium-paid employment. (For a description, please see Textbox 1). And, indeed, research on the U.S. labour market in particular has shown a distinct U-shaped pattern in the distribution of job gains.1
The theory behind the perceived polarization trend is quite straight-forward. Medium-skilled jobs tend to carry out functions that follow precise, repetitive tasks. As such, these
workers have become increasingly vulnerable to computer automation or outsourcing to low wage jurisdictions. In contrast, both the complex decision-making requirements of high-skilled jobs and the face-to-face interactions of many low-skilled service occupations make it more difficult for technology to replace the employee. Case in point: while technology can enhance the efficiency of workers in many low-skilled occupations, a person is still needed to clean a home, cut hair and take care of children.
1999 2007 2012 1999 2007 2012 1999-2007 2008-2012 1999-2012
All Occupations 14,318 16,721 17,245 100.0 100.0 100.0 - - -High Skills 4,785 5,773 6,295 33.4 34.5 36.5 3.3 5.7 9.2Managers 1,281 1,413 1,403 8 .9 8 .4 8 .1 -5 .6 -3 .7 -9 .1Professionals 2,323 2,939 3,336 16 .2 17 .6 19 .3 8 .3 10 .1 19 .2Technicians 1,181 1,421 1,556 8 .2 8 .5 9 .0 3 .1 6 .2 9 .5
Medium Skills 8,197 9,425 9,330 57.3 56.4 54.1 -1.6 -4.0 -5.5Sales 1,142 1,500 1,487 8 .0 9 .0 8 .6 12 .4 -3 .9 8 .1Office & Administration 1,829 2,199 2,210 12 .8 13 .2 12 .8 2 .9 -2 .5 0 .3Production and Repair 1,788 2,055 2,095 12 .5 12 .3 12 .1 -1 .6 -1 .2 -2 .8Operators and Labourers 3,438 3,672 3,539 24 .0 22 .0 20 .5 -8 .5 -6 .5 -14 .5
Low Skills 1,335 1,523 1,620 9.3 9.1 9.4 -2.3 3.1 0.7Protective Services 114 135 146 0 .8 0 .8 0 .8 1 .6 4 .8 6 .5Food Preparation and Janitorial 880 1,016 1,070 6 .1 6 .1 6 .2 -1 .1 2 .1 0 .9Personal Services 341 372 403 2 .4 2 .2 2 .3 -6 .6 5 .1 -1 .9
Source: Statistics Canada, TD Economics .
TABLE 3: EMPLOYMENT IN CANADA FROM 1999-2012Total Employment ('000s) Level Share (% of total) % Change in Share
CHART 6: CANADA JOB MARKET "UNIPOLAR",NOT "BIPOLAR" AS IN THE U.S.*
-15
-10
-5
0
5
10
15
20
High Skill Medium Skill Low Skill
Canada
United States
% Change in Occupation Share since 1999
* Canada's data encompasses 1999-2012, whereas U .S . data cover 1999-2009 .Source: TD Economics, Statistics Canada, BLS, David Autor (MIT)

TD Economics | www.td.com/economics
12October 22, 2013
In Canada, the perception of a difficult job market for those in the middle segment has been further fuelled by the relative decline of manufacturing, which traditionally has been home to many middle-to-low skilled positions that have paid decent wages and benefits.
TD Economics investigated this perceived trend of polarization in a February 2013 report.2 Consistent with the approach taken in the U.S. literature, detailed data by occupation were obtained by the typically-required skill level for 123 areas. The data were then arranged into ten occupational buckets across three major skill levels (low, medium and high). Employment changes were assessed across the major occupational groupings. We have included updated figures for 2012 and 2013, which have altered the results of the February 2013 report slightly, but not the main conclusions. Table 3 contains a breakdown of the occupa-tion types, while Chart 6 shed light on how the change in Canada’s labour market has compared to that of the U.S.
Canada’s job market distribution has followed more of an L-shape (“uni-polar”) rather than the U-shape (“bi-polar”) pattern observed in the U.S. Canada has experienced a considerably less pronounced swing in employment from the medium- to the high-skilled segments. This can be ex-plained by Canada’s greater orientation towards resources and more prolonged strength in construction activity. Both sectors have created jobs for many medium-skilled Cana-dians. Perhaps more strikingly, the Canadian job market has managed to post a slight increase in the share of office and administration positions. Yet, these are the same roles which have been most vulnerable to the impact of automa-
tion, notably administrative and clerical jobs. Although a strong rebound in government spending following the 1990s era of austerity could provide a partial explanation for this strength, it could also reflect lower investment intensity in equipment and software among Canadian businesses relative to those in the United States.
Another key distinction across the two countries is that the share of low-skilled occupations in Canada was rela-tively flat, bucking the rising trend observed in the United States. Drilling down further, this relatively strong demand for U.S. low-end jobs was driven by a 20% surge in the share of personal service jobs. In Canada, low-end jobs actually recorded just a modest increase. Protective (i.e., security) services increased on both sides of the border, but particu-larly in the United States.
Regional trends were also examined based on the 10 occupational buckets (see Chart 7). The most notable shifts from the medium- to the high-skilled segments of the em-ployment market have taken place in the Atlantic region, Ontario and Québec. In those jurisdictions, the job growth has been concentrated among professional workers as well as – in the case of the Atlantic – technicians. In the east, Ontario and Québec stood out as they registered an increase in the low-skilled share, although not nearly to the same degree as in the U.S. In contrast, the west has experienced a somewhat more stable change in the job distribution over the past decade, as the impact of the commodity boom has helped to “lift all boats.” Indeed, in Alberta, the medium-skilled area of the job market actually gained share, led by robust growth in trades and other production and repair categories.
Seniors leaving a bigger mark
In the 1970s and 1980s, there was considerable attention placed on the growing impact of women in the workforce, as evidenced by rising female labour-market participation and employment rates. While the upward trend in these rates has tapered off over the past few decades (see Chart 8), women have still managed to make up some further ground against their male counterparts since the early 2000s. In particular, the ratio of women to men in the job market reached 0.90 in 2012 compared to 0.86 in 2003, while the gap in relative employment rates across gender shrank by two percentage points. In aggregate, women have benefitted from a greater concentration in the services sector and lower presence within hard-hit manufacturing.
CHART 7: LARGEST SWING TO HIGH SKILLED IN THE EAST
-15
-10
-5
0
5
10
15
B .C . Alta . Sask . & Man . Ont . Qué . Atlantic
High Skill Medium Skill Low Skill% Change in Occupation Share, 1999-2012
Source: TD Economics, Statistics Canada, BLS, David Autor (MIT)

TD Economics | www.td.com/economics
13October 22, 2013
Over the past decade, another important demographic story – for both men and women – has been the growing footprint of older workers (see Chart 9). To a large extent, the significant increase in the share of older workers is a natural offshoot of the large bulge of Canadian baby boom-ers entering or nearing the traditional retirement age of 65.
Abstracting from this ageing population impact, how-ever, there has also been evidence that seniors in particular are opting to stay in the labour market longer than their parents. The average retirement age has been creeping up. And, since the 2008-09 financial crisis, the propensity of older workers to extend workforce attachment has been fur-ther driven up by: (1) increased longevity and better health; (2) the impact of the financial crisis on retirement savings; (3) the increased use of debt among older individuals; (4) the recent elimination of mandatory retirement policies in many organizations and for federally-regulated employees;
and (5) federal government policies which aim to provide employment opportunities for older workers, incent older workers to remain at work, and remove employment barri-ers for older workers. These initiatives include the Targeted Initiative for Older Workers and recent changes to the Guaranteed Income Supplement, Canada Pension and Old Age Security to enhance flexibility and encourage labour market participation of older workers.
The data further tell the story:
• Delayed retirement decisions have led to significant increases in employment, labour force participation and the employment-to-population ratio. In 2002, about 6.3% of people aged 65 and older were working, whereas in 2012, almost 12% were working.
• With seniors either choosing to stay in their jobs or fill new positions that have come up, employment in the
CHART 9: OLDER WORKERS* IN THE LABOUR FORCE
0%
1%
2%
3%
4%
5%
6%
Austra
lia
Canad
a
Finlan
d
France
German
y
Mexico
Netherl
ands
New Zea
land
Norway
United
Kingdo
m
United
States
% of total labour force
Note: *Ages 65 and over; Source: Organisation for Economic Co-operation and Development (OECD) .
20002012
Indicator Period 15-19 year olds 20-24 year olds 55+ year olds 65+ year oldsEmployment change Sept 2008 - Jul 2009 -173,100 (-16 .0%) -77,600 (-4 .8%) +104,000 (+3 .9%) +12,100 (+2 .8%)
Jul 2009 - Aug 2013 -92,800 (-10 .2%) +103,800 (+6 .8%) +601,100 (+21 .6%) +192,000 (+43 .6%)Sept 2008 - Aug 2013 -265,900 (-24 .6%) +26,200 (+1 .6%) +705,200 (+26 .4%) +204,200 (+47 .7%)
Unemployment rate 2003 average 18 .1% 10 .6% 5 .9% 3 .4%September 2008 14 .4% 8 .8% 5 .7% 3 .7%
August 2013 20 .0% 10 .9% 6 .5% 4 .7%
Participation Rate 2003 average 54 .8% 79 .4% 30 .0% 7 .5%September 2008 57 .3% 78 .6% 34 .5% 10 .4%
August 2013 49 .4% 76 .4% 37 .4% 13 .0%
Employment Rate 2003 average 44 .9% 71 .0% 28 .2% 7 .2%September 2008 49 .1% 71 .7% 32 .5% 10 .0%
August 2013 39 .6% 68 .1% 35 .0% 12 .4%
TABLE 4: LABOUR FORCE STATISTICS BY AGE COHORT
CHART 8: LABOUR FORCE PARTICIPATION RATESAMONG FEMALES AGED 15+
30
35
40
45
50
55
60
65
1976 1980 1984 1988 1992 1996 2001 2005 2009
Source: Statistics Canada's Labour Force Survey .
%

TD Economics | www.td.com/economics
14October 22, 2013
65+ category accounted for about 16% of the job gains from 2002-2012, even though the group makes up only about 3-4% of the national job market. Over this same time frame, seniors accounted for 11.5% of all net new full-time positions and almost one-third of part-time jobs.
• Strikingly, since the employment trough in 2009, the 65+ age category has accounted for almost 20% of overall net job gains (192K).
• Similar to the overall population, senior women have accounted for a disproportionate share of net employment gains. While this partly reflects significant growth in the female 65+ population, women have increased their workforce attachment at a faster rate than their male counterparts.
• Older workers have been making a mark within the service industries, especially real estate and leasing, retail trade, business building and support services and accommodation and food.
While facing nothing like the devastation observed in some European countries, young workers (i.e., those in the 15-24 year cohort) have experienced difficult labour market conditions, particularly since late-2008, when jobs for this cohort contracted by 250K alone (see Table 4). The dete-rioration since the onset of recession has brought the overall youth unemployment rate back up to about 14% from 11.6% in 2008. With this upward movement, youth unemployment now hovers close to its level of a decade ago.
The youth picture looks markedly different for those aged 15-19 versus 20-24 years old. Since September 2008, youth aged 15-19 have seen a contraction of roughly 265K. The similar figure for youth aged 20-24 is a net gain of 26K. Among 15-19 years, the unemployment rate has surged to around 20% from 14% in 2008. Comparable figures for 20-24 year olds are 11% and 9%, respectively (see Table 4).
The recent challenges facing youth in securing jobs ap-pears to be partly cyclical, since youth tend to be the last age cohort to benefit from a recovery following a downturn. Other drivers appear to be more structural in nature. The sharp declines in employment rates of the 15-19 age group across a number of service industries suggest that these young workers are facing increased competition for entry level jobs from their more experienced older counterparts – a development that may have some staying power. It also could be a by-product of employers increasingly wanting more education and skills from new hires.
When youth do find themselves unemployed, the dura-tion is quite short, as they move in and out of the labour force more frequently than their older counterparts. The main activity of many of those in the 15-19 age bucket is learning and/or formal education, as opposed to work. In turn, analysis and the economic literature typically focus on the different labour market outcomes of students and non-students to understand youth unemployment trends. Unfortunately, recent data on this front are difficult to find.
Temporary jobs increasingly common
Accompanying the demographic shifts has been the gradually rising tide of “non-standard” employment. Here,
CHART 10: TEMPORARY & CONTRACT WORKERSAS A SHARE OF TOTAL EMPLOYMENT
8 .0
9 .0
10 .0
11 .0
12 .0
13 .0
14 .0
1997 1999 2001 2003 2005 2007 2009 2011 20134 .0
4 .5
5 .0
5 .5
6 .0
6 .5
7 .0
7 .5
% temporary (lhs)
% term & contract (rhs)
% %
Source: Statistics Canada
CHART 11: CHANGE IN TEMPORARY AND CONTRACT WORKERS BY INDUSTRY (1997-2013)
-30 -10 10 30 50 70% Change in Employment
UtilitiesEducational
Other servicesTrade
Accommodation,Transp ., warehousing
Arts and entertainmentInformation, culture
Healthcare, social ass .Real estate, leasing
ManufacturingProf ., sc ., tech . services
Mining, quarrying, oil, gasAgriculture
Public administrationAdministrative supportWholesale tradeConstruction
Finance and insurance
Source: Statistics Canada

TD Economics | www.td.com/economics
15October 22, 2013
we are referring to the trend towards temporary positions, since other forms of non-standard employment – part-time and self-employment – have remained relatively stable in share terms over the past decade. Temporary employment accounted for roughly one-quarter of overall growth in paid employment over the past decade. After a brief pause in 2006-07, the share of temporary workers has resumed its rise to just under 14%, up from around 11.5% in 2003 (see Chart 10). Despite this rising trend, it remains the case that most Canadians are already employed in permanent positions.
In contrast to permanent positions, temporary jobs (see Chart 11) are defined as those that have a pre-determined end date or are slated to end after a specific job is completed. Contract positions account for the majority of temporary jobs, while most others fall under the categories of seasonal and casual work. Among these areas, contract positions have been the undisputed growth leader over the past decade, including post-recession. Compared with permanent jobs, contract positions are mostly concentrated in public-sector industries such as education and health care and highly-skilled private sector positions. However, a disproportionate share of casual workers resides in low-skilled jobs in arts and entertainment, administrative support and retail trade.
Along with the loss of decently-paying jobs in manufac-turing and falling unionization rates, the increasing orienta-tion of the labour market towards temporary employment has fuelled fears surrounding the quality of new jobs. Tem-porary jobs tend to pay lower wages, offer fewer benefits (medical and pension), are less likely to offer on-the-job training, and are more precarious in nature (see Chart 12 for a selective industrial breakdown).3
A recent Statistics Canada study showed that temporary workers, on average, suffer an hourly wage gap of 16%, although that gap varied depending on the type of work. For contract workers, the gap shrank to about 4-9% due to their relatively higher average education levels.3,6 With temporary wages keeping up with those of permanent employees in recent years, this wage gap has remained stable. However, the wages examined in the study exclude compensation from short-term incentive plans (e.g., cash bonus, incentives, profit-sharing, team-based incentives), long-term incentive plans (e.g., stock options, restricted share units) and medi-cal and pension benefits. Since permanent employees likely have more access to these incentives, the inclusion of them in the data would probably lead to a wider differential in wage levels.
From a benefits perspective, most working Canadians still receive some form of non-wage benefits, notably den-tal, disability and life insurance. Among non-permanent employees, however, nearly half of employers provided no benefit coverage.4 The share of the total working popula-tion not covered by a registered pension plan runs at about
Unemployment in an economy can be categorized into three different types:
• Structural (or long-term) unemployment can arise when certain industries decline or because of longer-term changes in job market conditions, which can be in turn the result of technological innovation . An example from the past is the typewriter industry . A decline in demand for this technology would lead to an increase in the structurally unemployed in that industry to the extent that their skills are not trans-ferable to other areas . Seasonal unemployment is a form of structural unemployment . It is unemploy-ment due to changes in the season/calendar (e .g ., construction, fishing, holiday retail season) .
• Frictional unemployment results from the search time required to find a new job once a worker be-comes unemployed . Better information to reduce search time can lower this form of unemployment .
• Cyclical (or short-term) unemployment occurs due to periodic business cycle fluctuations in the economy (e .g ., changes in employment as the economy cycles through booms and recessions .)
Textbox 2: A Primer on the Different Types of Unemployment
CHART 12: TEMPORARY AND CONTRACT WAGESAS A SHARE OF PERMANENT WAGES BY
INDUSTRY (2013)
0 20 40 60 80 100
Source: Statistics Canada .
ConstructionAgriculture
Mining, quarrying, oil and gasAdministrative support
Utilities
Healthcare, social assistanceWholesale trade
Educational servicesReal estate, leasing
Arts and entertainment
Trade
%

TD Economics | www.td.com/economics
16October 22, 2013
three-in-five, although that percentage has stabilized over the past 5-7 years as employers have been shifting from defined benefit plans towards defined contribution plans. Finally, approximately 80% of employers have a short-term incentive plan in place.5 The number drops to 45% for long-term incentive plans.
There is another side of the debate surrounding non-standard employment. Temporary jobs can “improve the overall functioning of the labour market by providing an inexpensive buffer to employers that reduces frictional un-employment (see Textbox 2 for definition).”6 By helping to contain overall wage and benefit costs, employment levels are higher than would otherwise be the case. Indeed, the number of temporary workers fell significantly relative to those in permanent positions during the recent downturn, reducing labour hoarding and amplifying the effects of the recession on employment levels (a similar trend was wit-nessed in part-time employment which fell relative to full time). Temporary positions are more common in smaller enterprises that face significant productivity impediments and often find themselves strapped for cash.
From an employee perspective, the desirability of non-standard employment depends on the nature of the job. If the job pays less and work schedules and income variability are higher, it is likely to be undesirable to the individuals in those jobs. However, some forms of temporary work – es-pecially those that are stable part-time or stable for a certain part of the year – may fit the individual’s needs and may help them achieve a better work-life balance. Students often use this type of work to transition into permanent employment.
Alternatively, older Canadians use non-standard employ-ment to springboard into retirement. Furthermore, seniors may seek temporary employment after retirement to keep themselves partly occupied. Rising fertility rates in recent years have also led to more parents with a working spouse seeking the flexibility of a temporary work arrangement.
The shift towards temporary work dovetails with other general trends, including the rising participation rate of older workers and the shrinking length of the average workweek (see Chart 13). That being said, the average duration of tenure for temporary employees has been lengthening in recent years. In 1997, some two-thirds of temporary em-ployees held their jobs for less than one year. By 2009, the comparable share was about one-half.
While statistics surrounding the employee desirability of temporary and non-standard work in Canada are few and far between, some surveys – including one released by McMaster University and the United Way Poverty in the Greater Toronto Area in 2013 – point to growing harmful impacts on household well-being stemming from increased income insecurity and precarious work.
THE PERCEPTION OF LABOUR SHORTAGES AND SKILLS MISMATCH
Although Canada has enjoyed a respectable job record in recent years, there has been growing speculation that hiring and recruiting in Canada have been held back by constraints on the supply side (see Chart 14). There have been numerous reports, headlines and media stories about growing labour shortages and gaps in the skills possessed by the workforce
CHART 13: AVERAGE ACTUAL HOURSWORKED PER WEEK
32 .0
32 .5
33 .0
33 .5
34 .0
34 .5
35 .0
35 .5
36 .0
1976 1979 1982 1985 1988 1991 1994 1997 2000 2003 2006 2009 2012
Hours
Note: Shaded regions represent recessionary periods .Source: Statistics Canada .
CHART 14: WHAT ARE THE GREATEST CHALLENGES FACING CANADIAN BUSINESSES?
32
30
8
8
6
5
4
4
4
9
0 5 10 15 20 25 30 35
Shortage of skilled workers
General state of the economy
Staffing challenges (general)
Retaining current staff
Foreign competition
Operating costs
High Canadian dollar
Regulation / red tape
Shortage of experiencedmanagement
Other
Note: Respondents could select 2+ answers; % do not sum to 100 .Source: Workopolis, Mind the Gap .
% of respondents
TD Economics | www.td.com/economics
17October 22, 2013
relative to the demands of employers. In this year’s round of federal and provincial budgets, the need to build skills capacity and address so-called skills mismatch topped the list of public policy priorities.
Labour supply growing at a good clip
There are two dimensions of supply-demand imbalances in the labour market. The first relates to insufficient supply at the aggregate level, which leads to economy-wide short-ages. The second surrounds imbalances which are specific to regions and occupations.
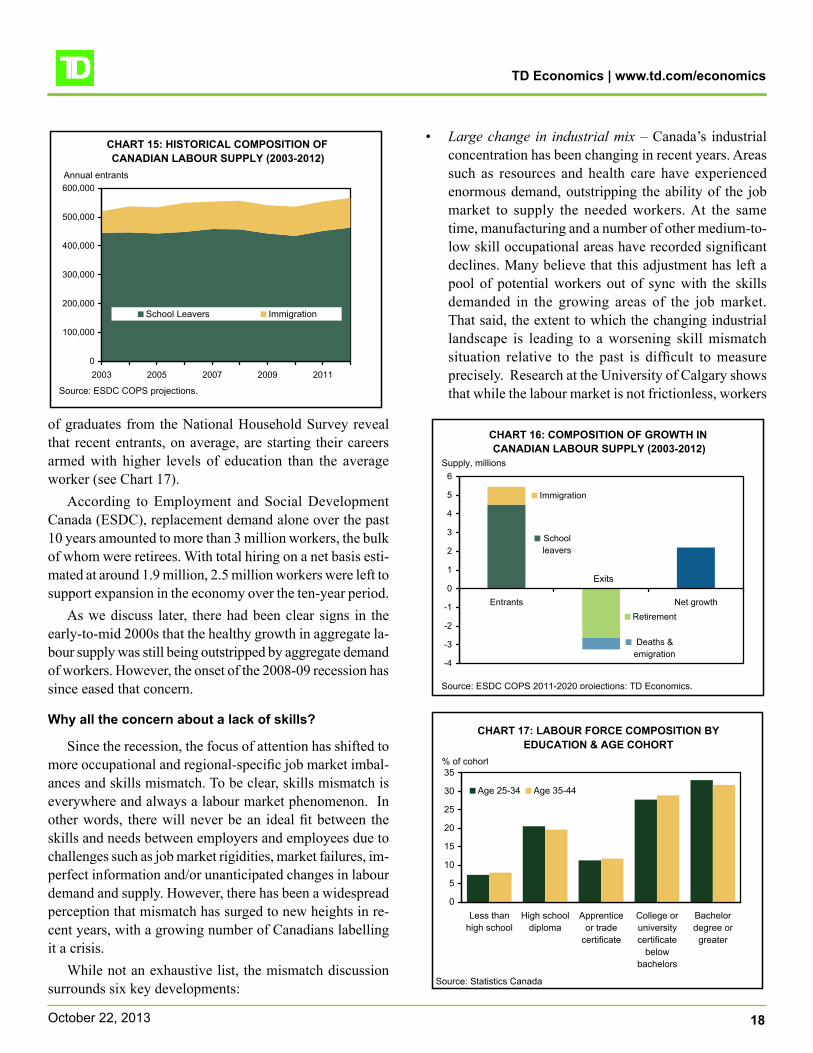
At least from an aggregate perspective, Chart 15 reveals that the total supply of labour in the job market has been expanding at a solid rate. Total additions to the pool of la-bour – in the form of immigration and new labour market participants such as school leavers – have increased by
5.5 million over the past decade. These gains have been achieved despite the downward influence on the aggregate participation rate from an ageing population over the past 3-4 years. Although the baby boomers in their 50-60s are choos-ing to remain more closely attached to the labour market than earlier cohorts of similar-aged Canadians, participation rates are lower relative to those of younger Canadians. As such, the overall labour force continues to grow, but at a more moderate rate than prior to the recession.
Chart 16 provides a more detailed breakdown of the source of labour pool gains. Of the total new entrants in the labour market since 2003, more than 80% have been so-called “school leavers”. The remainder of the supply of new entrants are sourced from immigration, as Canada has continued to add some 250,000 net new permanent mi-grants each year. In turn, data on the education attainment
Labour or skills shortages are an economic condition where there are insufficient qualified candidates to fill the marketplace demands for employment at a specific wage rate . The opposite is true for labour surpluses . Mismatch is a closely related concept . It refers to a situ-ation where positions may be filled, but with employees possessing too many skills (over-qualified) or too few (under-qualified) .
In the literature, there are efforts made to distinguish between education or qualification mismatch and skill mismatch . The latter notion is more directly based on whether workers have the actual skills – including literacy, numeracy and so-called “soft skills” – needed to suc-cessfully carry out required job tasks . In this case, there are three options: under-skilled (skill deficit), over-skilled (or skill surplus) or possessing the required skill level .
• Vertical mismatch refers to a worker that possesses education credentials that are too high or too low for the job .
• Horizontal mismatch refers to a worker who has the right level of education, but it’s not in the right field .
• Regional mismatch occurs when unemployed per-sons seeking work and firms offering suitable jobs are located in different regions, and the jobs and/or workers are immobile .
• Preference mismatch refers to a misalignment be-tween the types of jobs that unemployed people are
Textbox 3: Shortages and Mismatch: Definitions and Types
willing to accept and existing vacancies . Those out of work are unwilling to take up certain types of work because of factors such as inadequate compensation or status despite the fact that such jobs match their qualifications and skills profile, and are located in the relevant geographical region .Skills shortages and/or mismatch can be transitory or
structural in nature . At any one point in time, some degree of structural mismatch (or structural unemployment) is always present due to frictions and rigidities in the labour market . Persistent mismatch is also caused by supply-side inadequacies in education, training, as well as the challenge of imperfect information between job seekers and employers .
An in-depth discussion of skills mismatch is made difficult because policymakers and researchers are un-able to accurately measure skills outside of education and credentials . Literacy and numeracy are often used as a proxy, but these two competencies represent just a few of the skills employers demand . The measurement imprecision could also account for the differing percep-tions regarding skills in Canada . At one extreme, some researchers declare there to be insufficient evidence of a widespread skills shortage or pervasive skills mismatch problem . At the other end, employers and businesses repeatedly state they are encountering difficulty finding the right people for the job .
TD Economics | www.td.com/economics
18October 22, 2013
of graduates from the National Household Survey reveal that recent entrants, on average, are starting their careers armed with higher levels of education than the average worker (see Chart 17).
According to Employment and Social Development Canada (ESDC), replacement demand alone over the past 10 years amounted to more than 3 million workers, the bulk of whom were retirees. With total hiring on a net basis esti-mated at around 1.9 million, 2.5 million workers were left to support expansion in the economy over the ten-year period.
As we discuss later, there had been clear signs in the early-to-mid 2000s that the healthy growth in aggregate la-bour supply was still being outstripped by aggregate demand of workers. However, the onset of the 2008-09 recession has since eased that concern.
Why all the concern about a lack of skills?
Since the recession, the focus of attention has shifted to more occupational and regional-specific job market imbal-ances and skills mismatch. To be clear, skills mismatch is everywhere and always a labour market phenomenon. In other words, there will never be an ideal fit between the skills and needs between employers and employees due to challenges such as job market rigidities, market failures, im-perfect information and/or unanticipated changes in labour demand and supply. However, there has been a widespread perception that mismatch has surged to new heights in re-cent years, with a growing number of Canadians labelling it a crisis.
While not an exhaustive list, the mismatch discussion surrounds six key developments:
• Large change in industrial mix – Canada’s industrial concentration has been changing in recent years. Areas such as resources and health care have experienced enormous demand, outstripping the ability of the job market to supply the needed workers. At the same time, manufacturing and a number of other medium-to-low skill occupational areas have recorded significant declines. Many believe that this adjustment has left a pool of potential workers out of sync with the skills demanded in the growing areas of the job market. That said, the extent to which the changing industrial landscape is leading to a worsening skill mismatch situation relative to the past is difficult to measure precisely. Research at the University of Calgary shows that while the labour market is not frictionless, workers
CHART 15: HISTORICAL COMPOSITION OF CANADIAN LABOUR SUPPLY (2003-2012)
0
100,000
200,000
300,000
400,000
500,000
600,000
2003 2005 2007 2009 2011
School Leavers Immigration
Annual entrants
Source: ESDC COPS projections .
CHART 16: COMPOSITION OF GROWTH IN CANADIAN LABOUR SUPPLY (2003-2012)
Schoolleavers
Immigration
Retirement
Deaths & emigration
-4
-3
-2
-1
0
1
2
3
4
5
6
Entrants Net growth
Supply, millions
Source: ESDC COPS 2011-2020 projections; TD Economics .
Exits
CHART 17: LABOUR FORCE COMPOSITION BY EDUCATION & AGE COHORT
0
5
10
15
20
25
30
35
Less thanhigh school
High schooldiploma
Apprenticeor trade
certificate
College oruniversitycertificate
belowbachelors
Bachelordegree orgreater
Age 25-34 Age 35-44
Source: Statistics Canada
% of cohort
TD Economics | www.td.com/economics
19October 22, 2013
ultimately make the transition to other sectors and that recent declines in manufacturing employment have been more attributable to lower hiring rates than layoffs.7
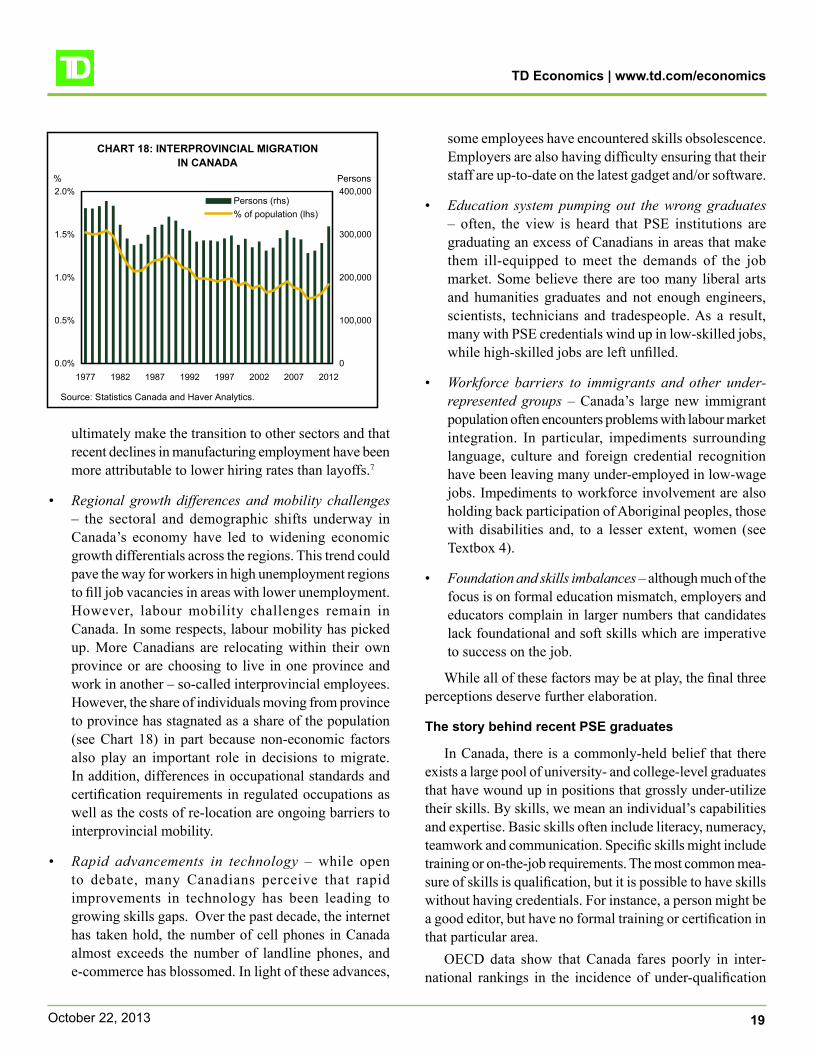
• Regional growth differences and mobility challenges – the sectoral and demographic shifts underway in Canada’s economy have led to widening economic growth differentials across the regions. This trend could pave the way for workers in high unemployment regions to fill job vacancies in areas with lower unemployment. However, labour mobility challenges remain in Canada. In some respects, labour mobility has picked up. More Canadians are relocating within their own province or are choosing to live in one province and work in another – so-called interprovincial employees. However, the share of individuals moving from province to province has stagnated as a share of the population (see Chart 18) in part because non-economic factors also play an important role in decisions to migrate. In addition, differences in occupational standards and certification requirements in regulated occupations as well as the costs of re-location are ongoing barriers to interprovincial mobility.
• Rapid advancements in technology – while open to debate, many Canadians perceive that rapid improvements in technology has been leading to growing skills gaps. Over the past decade, the internet has taken hold, the number of cell phones in Canada almost exceeds the number of landline phones, and e-commerce has blossomed. In light of these advances,
some employees have encountered skills obsolescence. Employers are also having difficulty ensuring that their staff are up-to-date on the latest gadget and/or software.
• Education system pumping out the wrong graduates – often, the view is heard that PSE institutions are graduating an excess of Canadians in areas that make them ill-equipped to meet the demands of the job market. Some believe there are too many liberal arts and humanities graduates and not enough engineers, scientists, technicians and tradespeople. As a result, many with PSE credentials wind up in low-skilled jobs, while high-skilled jobs are left unfilled.
• Workforce barriers to immigrants and other under-represented groups – Canada’s large new immigrant population often encounters problems with labour market integration. In particular, impediments surrounding language, culture and foreign credential recognition have been leaving many under-employed in low-wage jobs. Impediments to workforce involvement are also holding back participation of Aboriginal peoples, those with disabilities and, to a lesser extent, women (see Textbox 4).
• Foundation and skills imbalances – although much of the focus is on formal education mismatch, employers and educators complain in larger numbers that candidates lack foundational and soft skills which are imperative to success on the job.
While all of these factors may be at play, the final three perceptions deserve further elaboration.
The story behind recent PSE graduates
In Canada, there is a commonly-held belief that there exists a large pool of university- and college-level graduates that have wound up in positions that grossly under-utilize their skills. By skills, we mean an individual’s capabilities and expertise. Basic skills often include literacy, numeracy, teamwork and communication. Specific skills might include training or on-the-job requirements. The most common mea-sure of skills is qualification, but it is possible to have skills without having credentials. For instance, a person might be a good editor, but have no formal training or certification in that particular area.
OECD data show that Canada fares poorly in inter-national rankings in the incidence of under-qualification
CHART 18: INTERPROVINCIAL MIGRATIONIN CANADA
0 .0%
0 .5%
1 .0%
1 .5%
2 .0%
1977 1982 1987 1992 1997 2002 2007 20120
100,000
200,000
300,000
400,000Persons (rhs)% of population (lhs)
Source: Statistics Canada and Haver Analytics .
% Persons
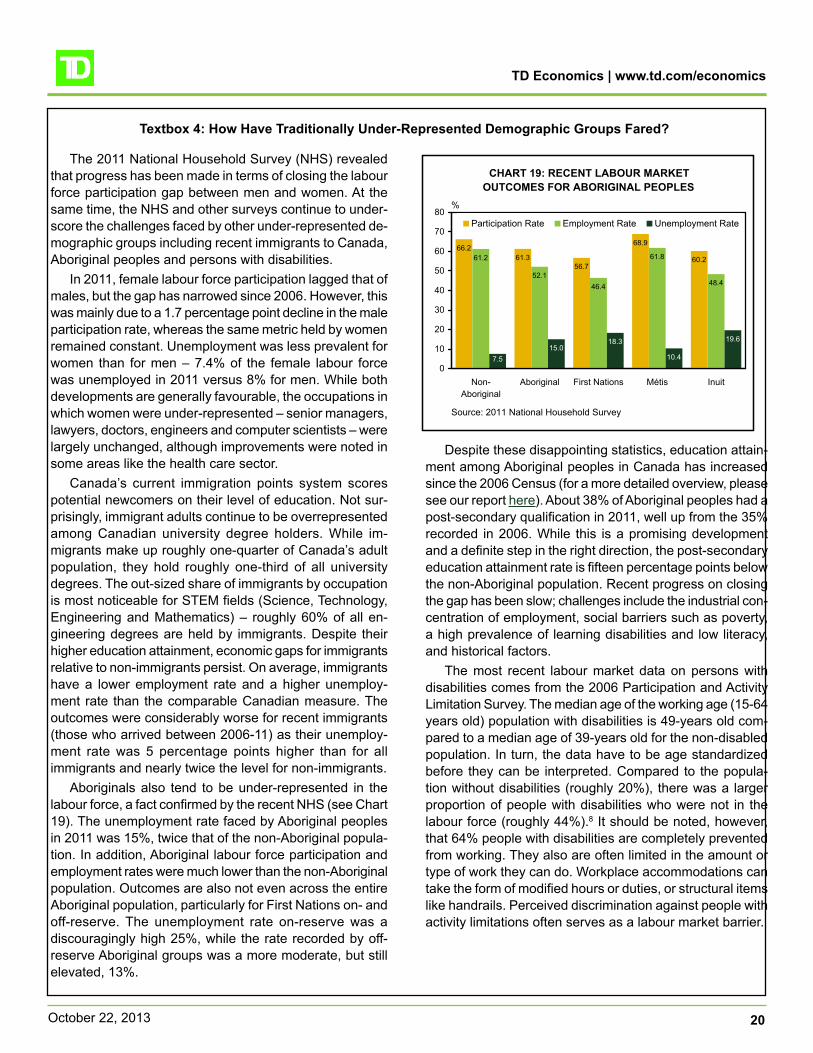
TD Economics | www.td.com/economics
20October 22, 2013
Despite these disappointing statistics, education attain-ment among Aboriginal peoples in Canada has increased since the 2006 Census (for a more detailed overview, please see our report here) . About 38% of Aboriginal peoples had a post-secondary qualification in 2011, well up from the 35% recorded in 2006 . While this is a promising development and a definite step in the right direction, the post-secondary education attainment rate is fifteen percentage points below the non-Aboriginal population . Recent progress on closing the gap has been slow; challenges include the industrial con-centration of employment, social barriers such as poverty, a high prevalence of learning disabilities and low literacy, and historical factors .
The most recent labour market data on persons with disabilities comes from the 2006 Participation and Activity Limitation Survey . The median age of the working age (15-64 years old) population with disabilities is 49-years old com-pared to a median age of 39-years old for the non-disabled population . In turn, the data have to be age standardized before they can be interpreted . Compared to the popula-tion without disabilities (roughly 20%), there was a larger proportion of people with disabilities who were not in the labour force (roughly 44%) .8 It should be noted, however, that 64% people with disabilities are completely prevented from working . They also are often limited in the amount or type of work they can do . Workplace accommodations can take the form of modified hours or duties, or structural items like handrails . Perceived discrimination against people with activity limitations often serves as a labour market barrier .
The 2011 National Household Survey (NHS) revealed that progress has been made in terms of closing the labour force participation gap between men and women . At the same time, the NHS and other surveys continue to under-score the challenges faced by other under-represented de-mographic groups including recent immigrants to Canada, Aboriginal peoples and persons with disabilities .
In 2011, female labour force participation lagged that of males, but the gap has narrowed since 2006 . However, this was mainly due to a 1 .7 percentage point decline in the male participation rate, whereas the same metric held by women remained constant . Unemployment was less prevalent for women than for men – 7 .4% of the female labour force was unemployed in 2011 versus 8% for men . While both developments are generally favourable, the occupations in which women were under-represented – senior managers, lawyers, doctors, engineers and computer scientists – were largely unchanged, although improvements were noted in some areas like the health care sector .
Canada’s current immigration points system scores potential newcomers on their level of education . Not sur-prisingly, immigrant adults continue to be overrepresented among Canadian university degree holders . While im-migrants make up roughly one-quarter of Canada’s adult population, they hold roughly one-third of all university degrees . The out-sized share of immigrants by occupation is most noticeable for STEM fields (Science, Technology, Engineering and Mathematics) – roughly 60% of all en-gineering degrees are held by immigrants . Despite their higher education attainment, economic gaps for immigrants relative to non-immigrants persist . On average, immigrants have a lower employment rate and a higher unemploy-ment rate than the comparable Canadian measure . The outcomes were considerably worse for recent immigrants (those who arrived between 2006-11) as their unemploy-ment rate was 5 percentage points higher than for all immigrants and nearly twice the level for non-immigrants .
Aboriginals also tend to be under-represented in the labour force, a fact confirmed by the recent NHS (see Chart 19) . The unemployment rate faced by Aboriginal peoples in 2011 was 15%, twice that of the non-Aboriginal popula-tion . In addition, Aboriginal labour force participation and employment rates were much lower than the non-Aboriginal population . Outcomes are also not even across the entire Aboriginal population, particularly for First Nations on- and off-reserve . The unemployment rate on-reserve was a discouragingly high 25%, while the rate recorded by off-reserve Aboriginal groups was a more moderate, but still elevated, 13% .
Textbox 4: How Have Traditionally Under-Represented Demographic Groups Fared?
CHART 19: RECENT LABOUR MARKET OUTCOMES FOR ABORIGINAL PEOPLES
66 .261 .3
56 .7
68 .9
60 .261 .2
52 .1
61 .8
48 .4
15 .010 .4
19 .6
46 .4
18 .3
7 .50
10
20
30
40
50
60
70
80
Non-Aboriginal
Aboriginal First Nations Métis Inuit
Participation Rate Employment Rate Unemployment Rate
%
Source: 2011 National Household Survey
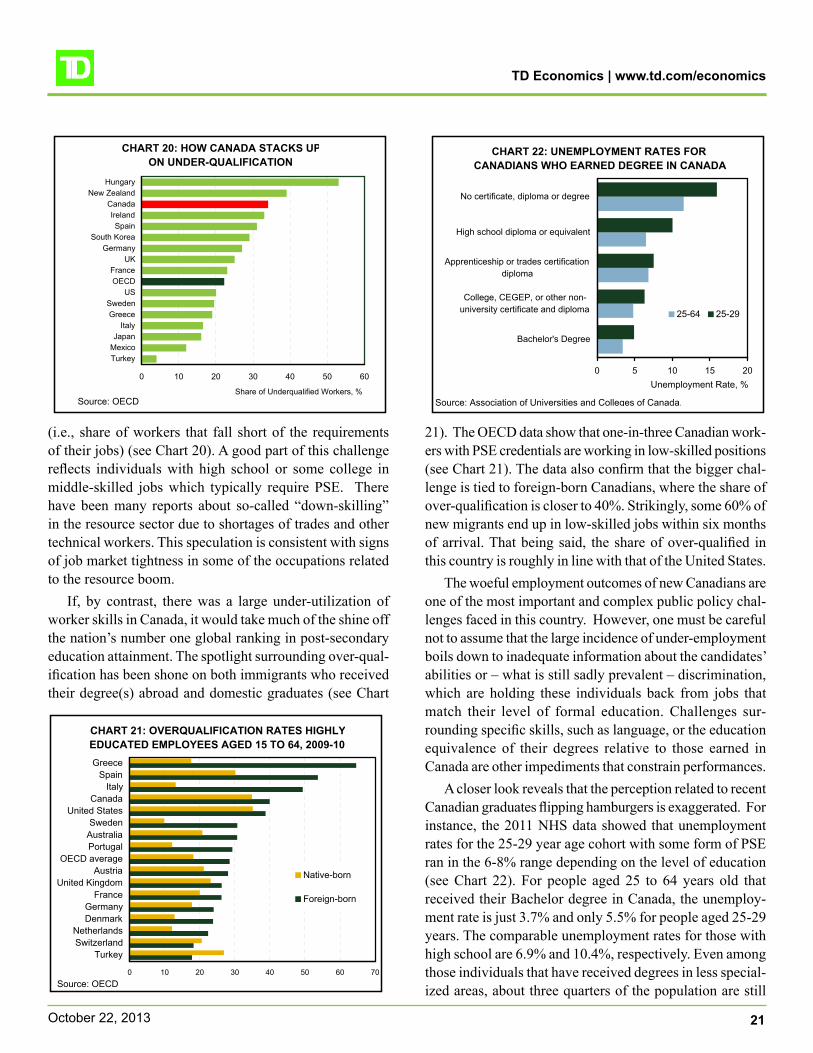
TD Economics | www.td.com/economics
21October 22, 2013
(i.e., share of workers that fall short of the requirements of their jobs) (see Chart 20). A good part of this challenge reflects individuals with high school or some college in middle-skilled jobs which typically require PSE. There have been many reports about so-called “down-skilling” in the resource sector due to shortages of trades and other technical workers. This speculation is consistent with signs of job market tightness in some of the occupations related to the resource boom.
If, by contrast, there was a large under-utilization of worker skills in Canada, it would take much of the shine off the nation’s number one global ranking in post-secondary education attainment. The spotlight surrounding over-qual-ification has been shone on both immigrants who received their degree(s) abroad and domestic graduates (see Chart
21). The OECD data show that one-in-three Canadian work-ers with PSE credentials are working in low-skilled positions (see Chart 21). The data also confirm that the bigger chal-lenge is tied to foreign-born Canadians, where the share of over-qualification is closer to 40%. Strikingly, some 60% of new migrants end up in low-skilled jobs within six months of arrival. That being said, the share of over-qualified in this country is roughly in line with that of the United States.
The woeful employment outcomes of new Canadians are one of the most important and complex public policy chal-lenges faced in this country. However, one must be careful not to assume that the large incidence of under-employment boils down to inadequate information about the candidates’ abilities or – what is still sadly prevalent – discrimination, which are holding these individuals back from jobs that match their level of formal education. Challenges sur-rounding specific skills, such as language, or the education equivalence of their degrees relative to those earned in Canada are other impediments that constrain performances.
A closer look reveals that the perception related to recent Canadian graduates flipping hamburgers is exaggerated. For instance, the 2011 NHS data showed that unemployment rates for the 25-29 year age cohort with some form of PSE ran in the 6-8% range depending on the level of education (see Chart 22). For people aged 25 to 64 years old that received their Bachelor degree in Canada, the unemploy-ment rate is just 3.7% and only 5.5% for people aged 25-29 years. The comparable unemployment rates for those with high school are 6.9% and 10.4%, respectively. Even among those individuals that have received degrees in less special-ized areas, about three quarters of the population are still
CHART 20: HOW CANADA STACKS UPON UNDER-QUALIFICATION
0 10 20 30 40 50 60
TurkeyMexicoJapan
ItalyGreece
SwedenUS
OECDFrance
UKGermany
South KoreaSpain
IrelandCanada
New ZealandHungary
Share of Underqualified Workers, %Source: OECD
CHART 21: OVERQUALIFICATION RATES HIGHLYEDUCATED EMPLOYEES AGED 15 TO 64, 2009-10
0 10 20 30 40 50 60 70
TurkeySwitzerlandNetherlands
DenmarkGermany
FranceUnited Kingdom
AustriaOECD average
PortugalAustraliaSweden
United StatesCanada
ItalySpain
Greece
Native-born
Foreign-born
Source: OECD
CHART 22: UNEMPLOYMENT RATES FOR CANADIANS WHO EARNED DEGREE IN CANADA
0 5 10 15 20
Bachelor's Degree
College, CEGEP, or other non-university certificate and diploma
Apprenticeship or trades certificationdiploma
High school diploma or equivalent
No certificate, diploma or degree
25-64 25-29
Unemployment Rate, %
Source: Association of Universities and Colleges of Canada .
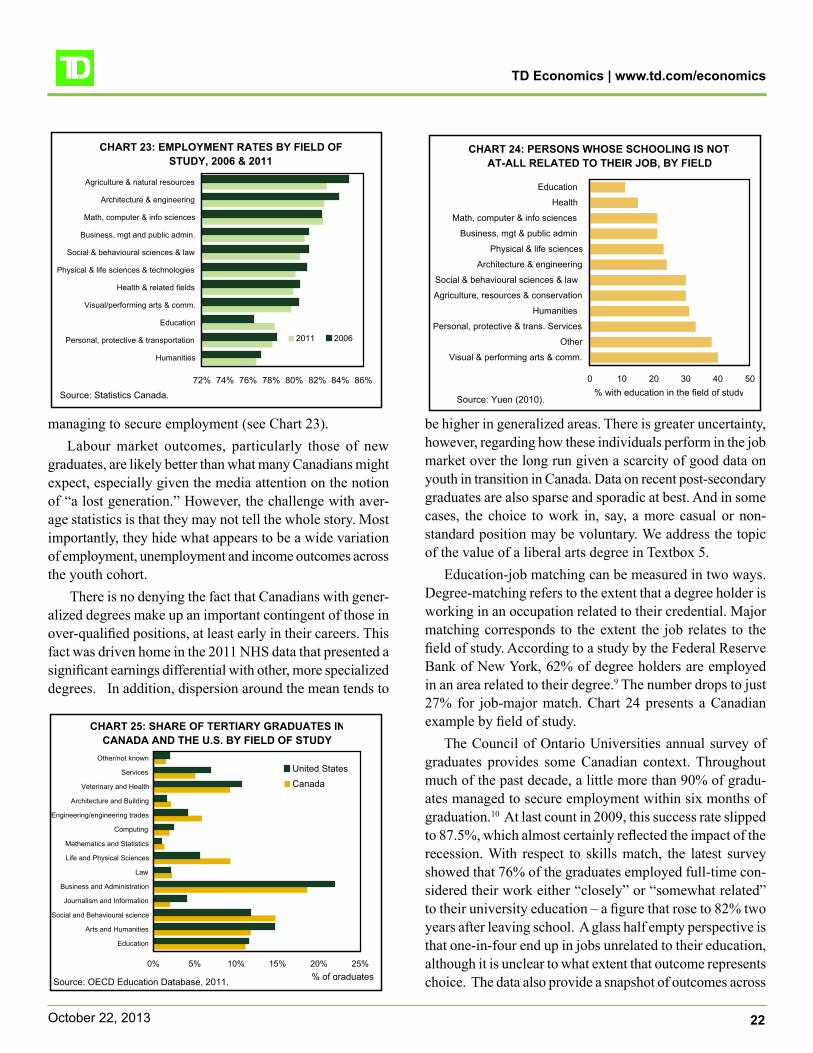
TD Economics | www.td.com/economics
22October 22, 2013
managing to secure employment (see Chart 23).Labour market outcomes, particularly those of new
graduates, are likely better than what many Canadians might expect, especially given the media attention on the notion of “a lost generation.” However, the challenge with aver-age statistics is that they may not tell the whole story. Most importantly, they hide what appears to be a wide variation of employment, unemployment and income outcomes across the youth cohort.
There is no denying the fact that Canadians with gener-alized degrees make up an important contingent of those in over-qualified positions, at least early in their careers. This fact was driven home in the 2011 NHS data that presented a significant earnings differential with other, more specialized degrees. In addition, dispersion around the mean tends to
be higher in generalized areas. There is greater uncertainty, however, regarding how these individuals perform in the job market over the long run given a scarcity of good data on youth in transition in Canada. Data on recent post-secondary graduates are also sparse and sporadic at best. And in some cases, the choice to work in, say, a more casual or non-standard position may be voluntary. We address the topic of the value of a liberal arts degree in Textbox 5.
Education-job matching can be measured in two ways. Degree-matching refers to the extent that a degree holder is working in an occupation related to their credential. Major matching corresponds to the extent the job relates to the field of study. According to a study by the Federal Reserve Bank of New York, 62% of degree holders are employed in an area related to their degree.9 The number drops to just 27% for job-major match. Chart 24 presents a Canadian example by field of study.
The Council of Ontario Universities annual survey of graduates provides some Canadian context. Throughout much of the past decade, a little more than 90% of gradu-ates managed to secure employment within six months of graduation.10 At last count in 2009, this success rate slipped to 87.5%, which almost certainly reflected the impact of the recession. With respect to skills match, the latest survey showed that 76% of the graduates employed full-time con-sidered their work either “closely” or “somewhat related” to their university education – a figure that rose to 82% two years after leaving school. A glass half empty perspective is that one-in-four end up in jobs unrelated to their education, although it is unclear to what extent that outcome represents choice. The data also provide a snapshot of outcomes across
CHART 25: SHARE OF TERTIARY GRADUATES INCANADA AND THE U.S. BY FIELD OF STUDY
0% 5% 10% 15% 20% 25%
Education
Arts and Humanities
Social and Behavioural science
Journalism and Information
Business and Administration
Law
Life and Physical Sciences
Mathematics and Statistics
Computing
Engineering/engineering trades
Architecture and Building
Veterinary and Health
Services
Other/not knownUnited StatesCanada
Source: OECD Education Database, 2011 . % of graduates
CHART 24: PERSONS WHOSE SCHOOLING IS NOT-AT-ALL RELATED TO THEIR JOB, BY FIELD
0 10 20 30 40 50
Visual & performing arts & comm .
Other
Personal, protective & trans . Services
Humanities
Agriculture, resources & conservation
Social & behavioural sciences & law
Architecture & engineering
Physical & life sciences
Business, mgt & public admin
Math, computer & info sciences
Health
Education
Source: Yuen (2010) .% with education in the field of study
CHART 23: EMPLOYMENT RATES BY FIELD OF STUDY, 2006 & 2011
72% 74% 76% 78% 80% 82% 84% 86%
Humanities
Personal, protective & transportation
Education
Visual/performing arts & comm .
Health & related fields
Physical & life sciences & technologies
Social & behavioural sciences & law
Business, mgt and public admin .
Math, computer & info sciences
Architecture & engineering
Agriculture & natural resources
2011 2006
Source: Statistics Canada .
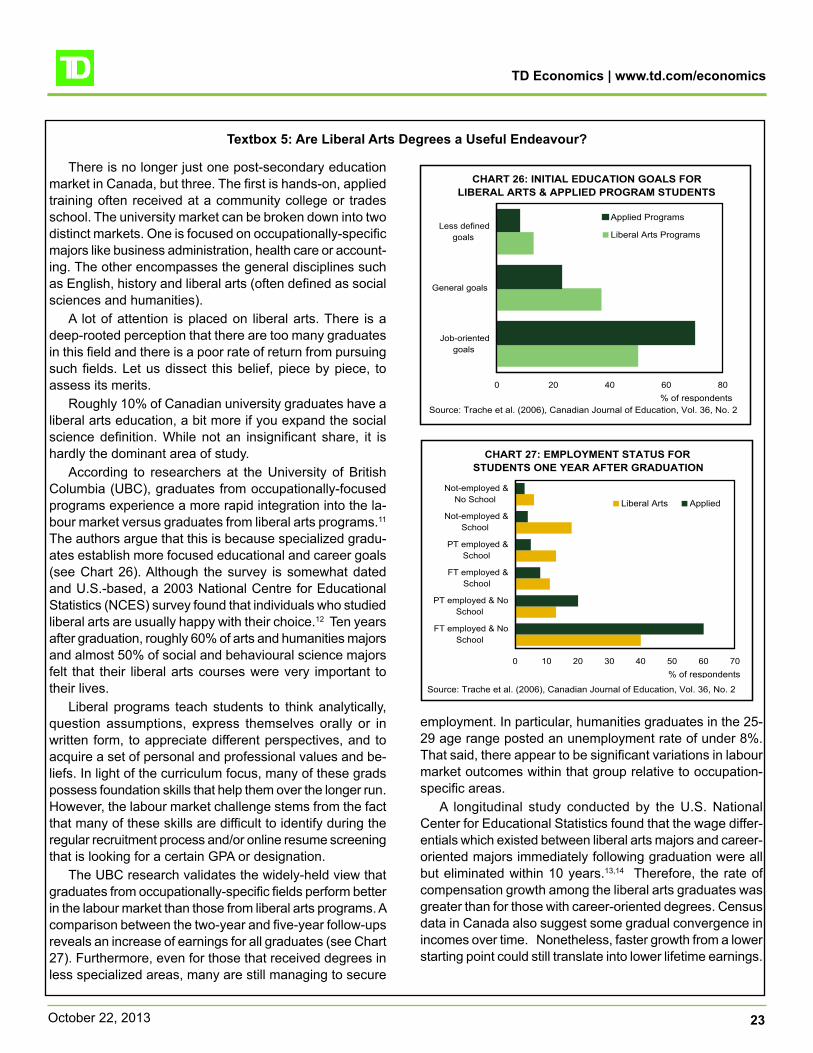
TD Economics | www.td.com/economics
23October 22, 2013
employment . In particular, humanities graduates in the 25-29 age range posted an unemployment rate of under 8% . That said, there appear to be significant variations in labour market outcomes within that group relative to occupation-specific areas .
A longitudinal study conducted by the U .S . National Center for Educational Statistics found that the wage differ-entials which existed between liberal arts majors and career-oriented majors immediately following graduation were all but eliminated within 10 years .13,14 Therefore, the rate of compensation growth among the liberal arts graduates was greater than for those with career-oriented degrees . Census data in Canada also suggest some gradual convergence in incomes over time . Nonetheless, faster growth from a lower starting point could still translate into lower lifetime earnings .
There is no longer just one post-secondary education market in Canada, but three . The first is hands-on, applied training often received at a community college or trades school . The university market can be broken down into two distinct markets . One is focused on occupationally-specific majors like business administration, health care or account-ing . The other encompasses the general disciplines such as English, history and liberal arts (often defined as social sciences and humanities) .
A lot of attention is placed on liberal arts . There is a deep-rooted perception that there are too many graduates in this field and there is a poor rate of return from pursuing such fields . Let us dissect this belief, piece by piece, to assess its merits .
Roughly 10% of Canadian university graduates have a liberal arts education, a bit more if you expand the social science definition . While not an insignificant share, it is hardly the dominant area of study .
According to researchers at the University of British Columbia (UBC), graduates from occupationally-focused programs experience a more rapid integration into the la-bour market versus graduates from liberal arts programs .11 The authors argue that this is because specialized gradu-ates establish more focused educational and career goals (see Chart 26) . Although the survey is somewhat dated and U .S .-based, a 2003 National Centre for Educational Statistics (NCES) survey found that individuals who studied liberal arts are usually happy with their choice .12 Ten years after graduation, roughly 60% of arts and humanities majors and almost 50% of social and behavioural science majors felt that their liberal arts courses were very important to their lives .
Liberal programs teach students to think analytically, question assumptions, express themselves orally or in written form, to appreciate different perspectives, and to acquire a set of personal and professional values and be-liefs . In light of the curriculum focus, many of these grads possess foundation skills that help them over the longer run . However, the labour market challenge stems from the fact that many of these skills are difficult to identify during the regular recruitment process and/or online resume screening that is looking for a certain GPA or designation .
The UBC research validates the widely-held view that graduates from occupationally-specific fields perform better in the labour market than those from liberal arts programs . A comparison between the two-year and five-year follow-ups reveals an increase of earnings for all graduates (see Chart 27) . Furthermore, even for those that received degrees in less specialized areas, many are still managing to secure
Textbox 5: Are Liberal Arts Degrees a Useful Endeavour?
CHART 26: INITIAL EDUCATION GOALS FOR LIBERAL ARTS & APPLIED PROGRAM STUDENTS
0 20 40 60 80
Job-orientedgoals
General goals
Less definedgoals
Applied Programs
Liberal Arts Programs
% of respondentsSource: Trache et al . (2006), Canadian Journal of Education, Vol . 36, No . 2
CHART 27: EMPLOYMENT STATUS FOR STUDENTS ONE YEAR AFTER GRADUATION
0 10 20 30 40 50 60 70
FT employed & NoSchool
PT employed & NoSchool
FT employed &School
PT employed &School
Not-employed &School
Not-employed &No School Liberal Arts Applied
% of respondents
Source: Trache et al . (2006), Canadian Journal of Education, Vol . 36, No . 2
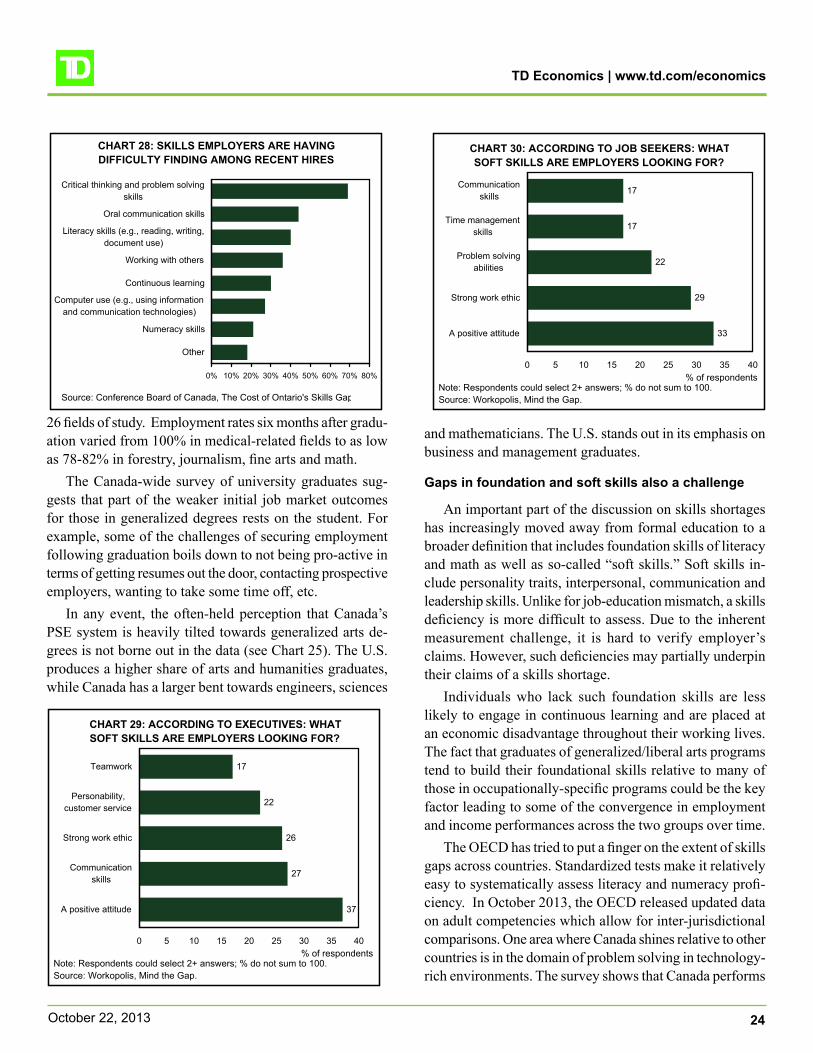
TD Economics | www.td.com/economics
24October 22, 2013
26 fields of study. Employment rates six months after gradu-ation varied from 100% in medical-related fields to as low as 78-82% in forestry, journalism, fine arts and math.
The Canada-wide survey of university graduates sug-gests that part of the weaker initial job market outcomes for those in generalized degrees rests on the student. For example, some of the challenges of securing employment following graduation boils down to not being pro-active in terms of getting resumes out the door, contacting prospective employers, wanting to take some time off, etc.
In any event, the often-held perception that Canada’s PSE system is heavily tilted towards generalized arts de-grees is not borne out in the data (see Chart 25). The U.S. produces a higher share of arts and humanities graduates, while Canada has a larger bent towards engineers, sciences
and mathematicians. The U.S. stands out in its emphasis on business and management graduates.
Gaps in foundation and soft skills also a challenge
An important part of the discussion on skills shortages has increasingly moved away from formal education to a broader definition that includes foundation skills of literacy and math as well as so-called “soft skills.” Soft skills in-clude personality traits, interpersonal, communication and leadership skills. Unlike for job-education mismatch, a skills deficiency is more difficult to assess. Due to the inherent measurement challenge, it is hard to verify employer’s claims. However, such deficiencies may partially underpin their claims of a skills shortage.
Individuals who lack such foundation skills are less likely to engage in continuous learning and are placed at an economic disadvantage throughout their working lives. The fact that graduates of generalized/liberal arts programs tend to build their foundational skills relative to many of those in occupationally-specific programs could be the key factor leading to some of the convergence in employment and income performances across the two groups over time.
The OECD has tried to put a finger on the extent of skills gaps across countries. Standardized tests make it relatively easy to systematically assess literacy and numeracy profi-ciency. In October 2013, the OECD released updated data on adult competencies which allow for inter-jurisdictional comparisons. One area where Canada shines relative to other countries is in the domain of problem solving in technology-rich environments. The survey shows that Canada performs
CHART 29: ACCORDING TO EXECUTIVES: WHATSOFT SKILLS ARE EMPLOYERS LOOKING FOR?
37
27
26
22
17
0 5 10 15 20 25 30 35 40
A positive attitude
Communicationskills
Strong work ethic
Personability,customer service
Teamwork
Note: Respondents could select 2+ answers; % do not sum to 100 .Source: Workopolis, Mind the Gap .
% of respondents
CHART 30: ACCORDING TO JOB SEEKERS: WHATSOFT SKILLS ARE EMPLOYERS LOOKING FOR?
33
29
22
17
17
0 5 10 15 20 25 30 35 40
A positive attitude
Strong work ethic
Problem solvingabilities
Time managementskills
Communicationskills
Note: Respondents could select 2+ answers; % do not sum to 100 .Source: Workopolis, Mind the Gap .
% of respondents
CHART 28: SKILLS EMPLOYERS ARE HAVING DIFFICULTY FINDING AMONG RECENT HIRES
0% 10% 20% 30% 40% 50% 60% 70% 80%
Other
Numeracy skills
Computer use (e .g ., using informationand communication technologies)
Continuous learning
Working with others
Literacy skills (e .g ., reading, writing,document use)
Oral communication skills
Critical thinking and problem solvingskills
Source: Conference Board of Canada, The Cost of Ontario's Skills Gap
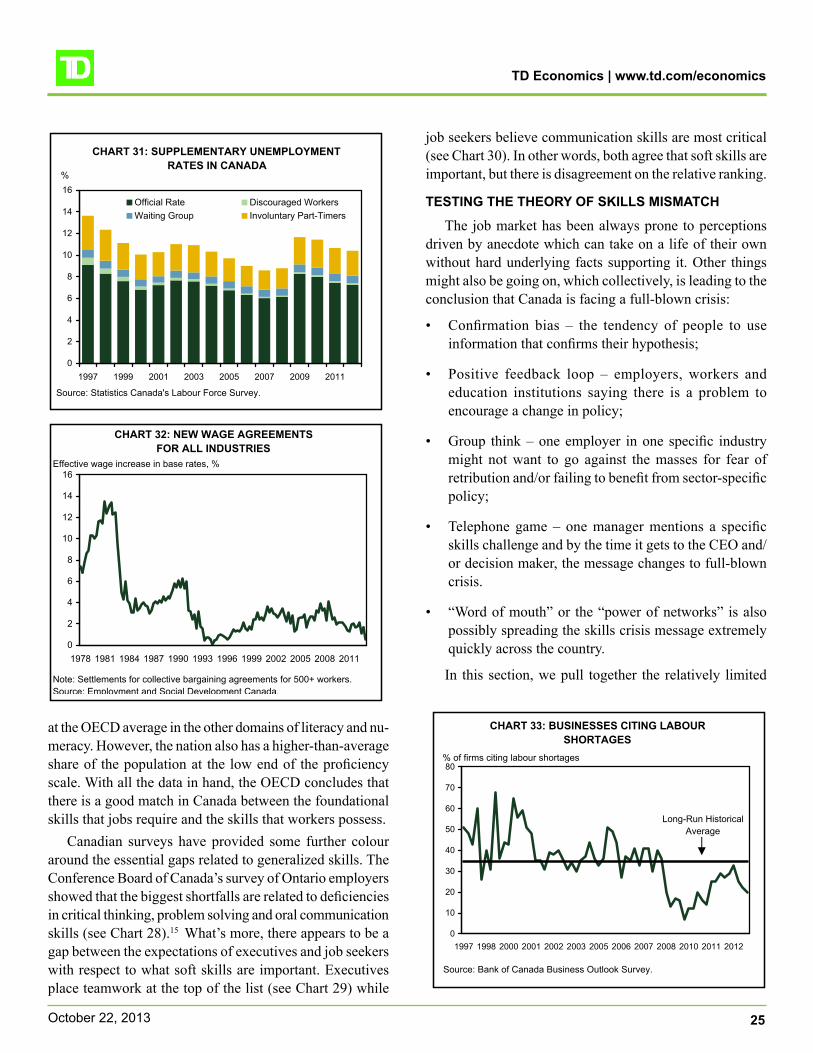
TD Economics | www.td.com/economics
25October 22, 2013
at the OECD average in the other domains of literacy and nu-meracy. However, the nation also has a higher-than-average share of the population at the low end of the proficiency scale. With all the data in hand, the OECD concludes that there is a good match in Canada between the foundational skills that jobs require and the skills that workers possess.
Canadian surveys have provided some further colour around the essential gaps related to generalized skills. The Conference Board of Canada’s survey of Ontario employers showed that the biggest shortfalls are related to deficiencies in critical thinking, problem solving and oral communication skills (see Chart 28).15 What’s more, there appears to be a gap between the expectations of executives and job seekers with respect to what soft skills are important. Executives place teamwork at the top of the list (see Chart 29) while
job seekers believe communication skills are most critical (see Chart 30). In other words, both agree that soft skills are important, but there is disagreement on the relative ranking.
TESTING THE THEORY OF SKILLS MISMATCH
The job market has been always prone to perceptions driven by anecdote which can take on a life of their own without hard underlying facts supporting it. Other things might also be going on, which collectively, is leading to the conclusion that Canada is facing a full-blown crisis:
• Confirmation bias – the tendency of people to use information that confirms their hypothesis;
• Positive feedback loop – employers, workers and education institutions saying there is a problem to encourage a change in policy;
• Group think – one employer in one specific industry might not want to go against the masses for fear of retribution and/or failing to benefit from sector-specific policy;
• Telephone game – one manager mentions a specific skills challenge and by the time it gets to the CEO and/or decision maker, the message changes to full-blown crisis.
• “Word of mouth” or the “power of networks” is also possibly spreading the skills crisis message extremely quickly across the country.
In this section, we pull together the relatively limited
CHART 31: SUPPLEMENTARY UNEMPLOYMENT RATES IN CANADA
0
2
4
6
8
10
12
14
16
1997 1999 2001 2003 2005 2007 2009 2011
Official Rate Discouraged WorkersWaiting Group Involuntary Part-Timers
%
Source: Statistics Canada's Labour Force Survey .
CHART 32: NEW WAGE AGREEMENTS FOR ALL INDUSTRIES
0
2
4
6
8
10
12
14
16
1978 1981 1984 1987 1990 1993 1996 1999 2002 2005 2008 2011
Effective wage increase in base rates, %
Note: Settlements for collective bargaining agreements for 500+ workers .Source: Employment and Social Development Canada .
CHART 33: BUSINESSES CITING LABOUR SHORTAGES
0
10
20
30
40
50
60
70
80
1997 1998 2000 2001 2002 2003 2005 2006 2007 2008 2010 2011 2012
Source: Bank of Canada Business Outlook Survey .
% of firms citing labour shortages
Long-Run Historical Average
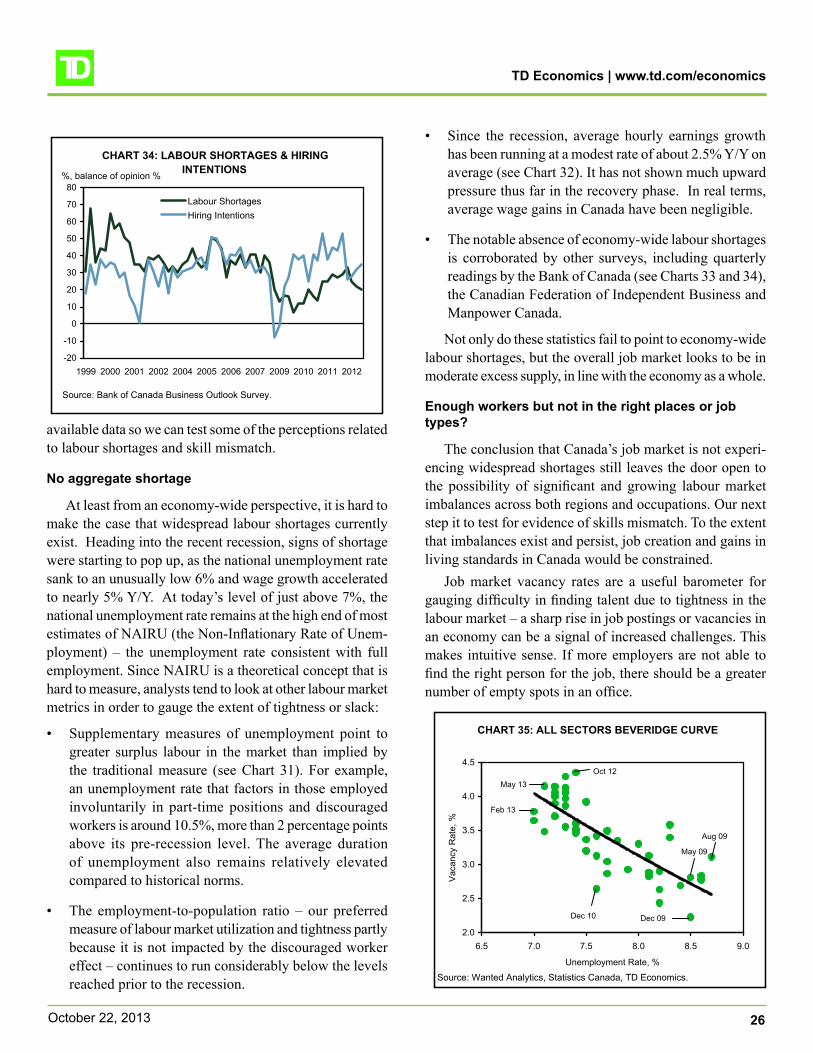
TD Economics | www.td.com/economics
26October 22, 2013
available data so we can test some of the perceptions related to labour shortages and skill mismatch.
No aggregate shortage
At least from an economy-wide perspective, it is hard to make the case that widespread labour shortages currently exist. Heading into the recent recession, signs of shortage were starting to pop up, as the national unemployment rate sank to an unusually low 6% and wage growth accelerated to nearly 5% Y/Y. At today’s level of just above 7%, the national unemployment rate remains at the high end of most estimates of NAIRU (the Non-Inflationary Rate of Unem-ployment) – the unemployment rate consistent with full employment. Since NAIRU is a theoretical concept that is hard to measure, analysts tend to look at other labour market metrics in order to gauge the extent of tightness or slack:
• Supplementary measures of unemployment point to greater surplus labour in the market than implied by the traditional measure (see Chart 31). For example, an unemployment rate that factors in those employed involuntarily in part-time positions and discouraged workers is around 10.5%, more than 2 percentage points above its pre-recession level. The average duration of unemployment also remains relatively elevated compared to historical norms.
• The employment-to-population ratio – our preferred measure of labour market utilization and tightness partly because it is not impacted by the discouraged worker effect – continues to run considerably below the levels reached prior to the recession.
• Since the recession, average hourly earnings growth has been running at a modest rate of about 2.5% Y/Y on average (see Chart 32). It has not shown much upward pressure thus far in the recovery phase. In real terms, average wage gains in Canada have been negligible.
• The notable absence of economy-wide labour shortages is corroborated by other surveys, including quarterly readings by the Bank of Canada (see Charts 33 and 34), the Canadian Federation of Independent Business and Manpower Canada.
Not only do these statistics fail to point to economy-wide labour shortages, but the overall job market looks to be in moderate excess supply, in line with the economy as a whole.
Enough workers but not in the right places or job types?
The conclusion that Canada’s job market is not experi-encing widespread shortages still leaves the door open to the possibility of significant and growing labour market imbalances across both regions and occupations. Our next step it to test for evidence of skills mismatch. To the extent that imbalances exist and persist, job creation and gains in living standards in Canada would be constrained.
Job market vacancy rates are a useful barometer for gauging difficulty in finding talent due to tightness in the labour market – a sharp rise in job postings or vacancies in an economy can be a signal of increased challenges. This makes intuitive sense. If more employers are not able to find the right person for the job, there should be a greater number of empty spots in an office.
CHART 34: LABOUR SHORTAGES & HIRINGINTENTIONS
-20
-10
0
10
20
30
40
50
60
70
80
1999 2000 2001 2002 2004 2005 2006 2007 2009 2010 2011 2012
Labour ShortagesHiring Intentions
Source: Bank of Canada Business Outlook Survey .
%, balance of opinion %
CHART 35: ALL SECTORS BEVERIDGE CURVE
2 .0
2 .5
3 .0
3 .5
4 .0
4 .5
6 .5 7 .0 7 .5 8 .0 8 .5 9 .0
Unemployment Rate, %
Vaca
ncy
Rat
e, %
Aug 09
Oct 12
Dec 10 Dec 09
Feb 13
May 09
May 13
Source: Wanted Analytics, Statistics Canada, TD Economics .

TD Economics | www.td.com/economics
27October 22, 2013
ince, and by occupation . It is important to stress that while Wanted Analytics compiles job postings at an occupational level – which no other survey can for Canada – the metric is different from a traditional vacancy rate .
The Conference Board of Canada has calculated a Help Wanted Index since 2005 . It uses Wanted Analytics data for the number of online postings . When the number of new job postings increases, it translates into a gain in the Help Wanted Index . The change in the number of job post-ings from month to month is thought to be a better indicator of job gains in the near future . The Index is available for Canada and by province, through a subscription service, and is updated on a monthly basis .
The Canadian Federation of Independent Business (CFIB) has conducted a vacancy survey with its members since 2004 . This metric has the longest time series of all the vacancy rates we use . To deal with occasional missing data points, data are smoothed before seasonal adjustment, and then re-adjusted to ensure their totals add up to national fig-ures . There are three key differences between the vacancy rate produced by CFIB and Statistics Canada . First, Statis-tics Canada’s sample includes the public sector which CFIB argues has a relatively low level of job vacancy, skewing the resulting national metric . Second, CFIB excludes the utili-ties sector; Statistics Canada, on the other hand, excludes the agriculture sector . Third, CFIB’s definition of a vacant position is less restrictive: it does not require the position to already exist . A passive search, as opposed to an active search, by the employer is also permitted .
The International Labour Organization (ILO) in its 2013 Global Employment Trends report proposed a skills mismatch index . The index captures the extent of mismatch between skill demand (the skills of the employed) and skills supply (the skills of the unemployed) . We have applied this methodology to Canada . We have taken the relative share of employment and unemployment and subtracted the two, for each major skill level and for each occupation code . Each of these differences is then summed and the absolute value is used . The resulting sum is measured on a 0-1 scale: 0 represents a perfect degree of skills matching; 1 represents a completely imperfect degree of skills matching . In other words, an increase in the index reveals deterioration in skills matching . While the index provides an additional gauge of the degree of mismatch, it is a crude calculation that uses employment as the measure of skills demand .
The Bank of Canada Business Outlook Survey asks respondents, on a quarterly basis, if their output was con-strained as a result of hiring difficulties .
Vacancy rates are a key data source to assess unmet labour demand in an economy . The rate is calculated as the number of vacancies divided by total labour demand (the sum of vacancies and employment) . Vacancy rates provide a useful gauge on the degree of tightness/slack in the labour market . The data are useful for policymakers who implement programs and monitor their effectiveness; stakeholders such as post-secondary institutions who have a vested interest in post-graduate career placement; and employers when they contemplate hiring decisions and future intentions .
In Canada, the long-standing time series on vacancies, Statistics Canada’s Help Wanted Index, was discontinued in 2003, largely because of the increased prevalence and use of online recruitment . Since then, some replacements have emerged, although it is important to stress that each metric has its own methodology, data source, advantages and disadvantages . To carry out our analysis, we have used six different indicators . Each of these measures is used to help assess whether skills mismatch – and to what extent – is present in Canada .
Statistics Canada has produced a three-month mov-ing average vacancy rate since March 2011 . Estimates are available by geography and industry . To qualify a position as vacant, three criteria must hold: (1) a specific position must exist; (2) work could start within 30 days; and (3) the employer must be actively seeking employees from outside the organization to fill the position . Full time, part time, temporary, permanent, seasonal and on-call jobs are all considered . Statistics Canada does not count employ-ees of temporary help agencies, volunteers, independent contractors and consultants . It also does not capture spots to be filled by promotion, demotion, internal transfer or a recall from a lay-off .
Wanted Analytics is a publicly-traded company on the TSX and is headquartered in Québec . The firm compiles information and analysis on hiring demand . On a minute-by-minute basis, Wanted Analytics scans a variety of job boards, collects the text of the job ad, normalizes the data, ensures no duplication and assigns an appropriate occupa-tion code . The firm estimates that it captures approximately 85% of all the jobs that are posted online in Canada . Due to its methodology, Wanted Analytics excludes positions that are not online; these are typically low-skilled, high turnover and low paying jobs . The posting could be the need to fill an existing vacancy, but also a brand new posi-tion . We have calculated an approximate vacancy rate by taking the number of online postings and dividing it by total labour demand . The data are available for Canada, by prov-
Textbox 6: Measuring Employment Vacancies in the Canadian Economy

TD Economics | www.td.com/economics
28October 22, 2013
Canada has a few published estimates of vacancy rates, and we have calculated one ourselves using data on job postings from Wanted Analytics (see Chart 35). These data only provide a few years of back history and are not directly comparable with other metrics due to different method-ologies. Increases in job postings over time from Wanted Analytics could be a result of greater usage of online job postings, changes in methodology from the data provider, or a combination of the two. Furthermore, the trend seen may not represent an actual increase in job postings and/or job vacancies. Even with this data caveat in mind, Wanted does provide an invaluable source of information. Collectively, however, the limited data we do have at our fingertips are not all telling the same story.
The most commonly cited vacancy data emanate from Statistics Canada’s quarterly survey. In the limited time span that series has been running – only two years – the share of job vacancies to total labour demand (employment plus vacancies) has been quite steady at around 1.5%. In addition, at around 6.5, the number of unemployed relative to vacancies has also showed little change over the past few years. In contrast, vacancy rate figures computed from Wanted Analytics have been on a relatively steep upward trend since 2009, and have been running at a higher level. A similar tightening picture is painted by the Canadian Federation of Independent Business (CFIB) figures, which also show that filling jobs has been more of a problem for small- and medium-sized businesses than large enterprises.
Even if the actual story is best represented by the latter statistics, a rising vacancy rate may not necessarily indicate a growing problem of skill mismatch. This is because vacan-
cies would naturally be expected to rise as a labour market recovers from the recession and absorbs excess slack. In order to adjust for this cycle effect, we have plotted the relationship between vacancy rate and the unemployment rate – known as the Beveridge curve. An upward shift in the curve over time – a higher rate of vacancies given a certain level of unemployment – indicates growing inefficiency in the job market and hence worsening mismatch. The opposite holds true for a downward shift.
Charts 36-37 present some shifts in the Beveridge curve over time:
• In a recent Bank of Canada speech, Senior Deputy Governor Tim Macklem highlighted the fact that the Beveridge curve shifted downwards between the 1980s
CHART 36: BEVERIDGE CURVE, 1983-2003
0 .4
0 .6
0 .8
1 .0
1 .2
1 .4
1 .6
1 .8
5 6 7 8 9 10 11 12 13Unemployment Rate (%)
Vaca
ncy
Rat
e (%
)
91:Q1
90:Q1 87:Q1
83:Q2
96:Q1
99:Q1
00:Q1
03:Q2
Source: Bank of Canada .
CHART 37: BEVERIDGE CURVES FOR CANADABEFORE, DURING AND AFTER RECESSION
1 .0%
1 .2%
1 .4%
1 .6%
1 .8%
2 .0%
2 .2%
2 .4%
2 .6%
2 .8%
3 .0%
5 5 .5 6 6 .5 7 7 .5 8 8 .5 9
2004-2008
Recession
Post-Recession
Source: Canadian Federation of Independent Business, Statistics Canada .
Vacancy Rate, %
Unemployment Rate, %
CHART 38: SKILLS MISMATCH INDEX
0 .74
0 .75
0 .76
0 .77
0 .78
0 .79
0 .80
2000 2001 2002 2003 2004 2005 2006 2007 2008 2009 2010
Source: Data from Statistics Canada, Methodology by the International Labour Organization, Calculations by TD Economics .
Mismatch Index (Scale: 0 to 1)

TD Economics | www.td.com/economics
29October 22, 2013
and early 2000s, arguing that structural improvements in the economy over the past 30 years had resulted in a more efficient matching in labour supply and demand (see Chart 36). These policy changes included a tightening in Employment Insurance (EI) eligibility requirements, falling inflation and declining government deficits among others.
• With the advantage of about 10 years of historical data, we leveraged the CFIB vacancy data to plot the evolution of the national vacancy/unemployment rate relationship prior to the recession, during the recession and the years subsequent (see Chart 37). These results point to at least some upward movement in the Beveridge curve (i.e., worsening in mismatch) since the recovery began in 2009.
• In order to provide another angle to the analysis, we constructed a “mismatch index” that was developed using the methodology by the International Labour Organization (see Textbox 6). The index captures the extent of mismatch between skill demand (the skills of the employed) and the skills supply (the skills of the unemployed). This relatively crude index suggests that degree of mismatch has actually declined moderately since the downturn (see Chart 38).
Evidence of regional and occupational mismatch
The prior section provides mixed signals about whether skill mismatch is worsening in Canada. Our next line of at-tack is to test whether perceptions about shortages in certain areas (and surpluses in others) have been corroborated by
CHART 39: PERCEIVED OCCUPATIONS IN SHORTAGE AND SURPLUS
0
1
2
3
4
5
6
7
8
9
2009 2013YTD
2009 2013YTD
2009 2013YTD
Shortage
Surplus
Unemployment Rate Vacancy Rate Annual Average Hourly Wage Growth
%
Source: Statistics Canada, WANTED Analytics; Calculations by TD Economics
CHART 40: WAGE GROWTH ACROSS CANADA
0
1
2
3
4
5
6
2001 2003 2005 2007 2009 2011
Canada Central CanadaAtlantic Canada Western Canada
Wage Growth, Year-over-year % Chg .
Source: Statistics Canada
Shortage* 2.8 3.9 2.0Science, Engineering & IT 4 .4 5 .3 1 .8Trades 2 .4 4 .9 2 .2Health 2 .2 2 .4 1 .7Other 2 .5 3 .1 2 .3Surplus* 2.3 3.3 2.2Manufacturing-Related/Labourers 1 .8 3 .6 1 .9Teachers 1 .0 1 .0 2 .8Clerical 2 .8 3 .5 1 .8Sales and Service 2 .6 3 .6 2 .4
TABLE 5: PERCEIVED SHORTAGE AND PERCEIVED SURPLUS (2013)
*Shortage: Science, Engineers, IT professionals, Trades, Health, Accountants, Architects, Occupations in Mining/Oil and Gas .**Surplus: Manufacturing-oriented & Labourers, Teachers, Clerical Occupations, Sales and Service .Source: Statistics Canada, WANTED Analytics; Calculations by TD Economics .
Vacancy Rate 2009 (%) Vacancy Rate 2013 (%) Average Hourly Wages, Ann . Avg . % Chg ., 2010-2013

TD Economics | www.td.com/economics
30October 22, 2013
the data. We list a number of these alleged occupations in Appendix 1. If these perceptions hold up to the test, then one would expect outsized increases in vacancy rates, fall-ing (and ultra-low) unemployment rates and growing wage pressures in areas of shortage and the converse in areas of allegedly facing soft conditions.
Our findings provide some surprises. It is the case that those occupations widely thought to be in shortage have recorded considerably lower unemployment rates than their counterparts in perceived surplus and in the overall job market (see Chart 39). Still, vacancy rates for the group are only moderately higher on balance than for those oc-cupations in surplus and have not accelerated over the past few years to the degree that one might have expected. And even more strikingly, wage pressures in these areas have been surprisingly muted (see Chart 40).
Occupations which are commonly believed to be facing weak labour markets – such as sales and service and labour-ers – have been experiencing tighter market conditions and slightly faster wage growth since the recession. Nonetheless, unemployment rates have remained persistently high on average, which likely has a lot to do with structural factors such as a higher share of temporary workers who change jobs frequently. Vacancy rates were trending upwards but have recently slowed over the past year.
Some findings across specific occupations (see Table 5):
• Some occupations in perceived shortage are indeed showing legitimate signs of considerable and growing tightness. Engineers, scientists and supervisors and
production workers in the primary industries top that list. Evidence of this tightness translating into a quickening pace of wage gains is spotty at best.
• Health care professionals have posted relatively low unemployment rates, but vacancy rates in these areas have remained relatively steady and moderate. Demand and supply in health is largely regulated by governments, which likely explains this apparent disconnect.
• Consistent with all the talk about extreme demands for trades and vocational workers, the figures point to excess demand at the national level.
• Within the occupations believed to be in surplus, the data are consistent with a lack of tightness in a number
CHART 41: ANNUAL RETIREMENTS & ENTRY OFNEW TEACHERS ACROSS CANADA
0 5,000 10,000 15,000 20,000 25,000 30,000 35,000 40,000
2008-2010
2003-2007
1998-2002
Avg . annual new teachers
Avg . annual teacherretirementsDifference (surplus)
Source: Statistics Canada, Employment & Social Development Canada .
CHART 43: SHORTAGE - A GEOGRAPHICALPHENOMENON?
0
1
2
3
4
5
6
2009 2010 2011 2012 2013 YTD
Canada Québec Ontario
Saskatchewan Alberta
Vacancy Rates - Perceived Shortage Jobs
Source: Statistics Canada, WANTED Analytics; Calculations by TD Economics
CHART 42: JOB VACANCY RATES BY LOCATION
0 .0%
0 .5%
1 .0%
1 .5%
2 .0%
2 .5%
3 .0%
3 .5%
4 .0%
2004 2005 2006 2007 2008 2009 2010 2011 2012 2013
Atlantic WestOntario Quebec
Source: Canadian Federation of Independent Business .
Vacancy Rate, %
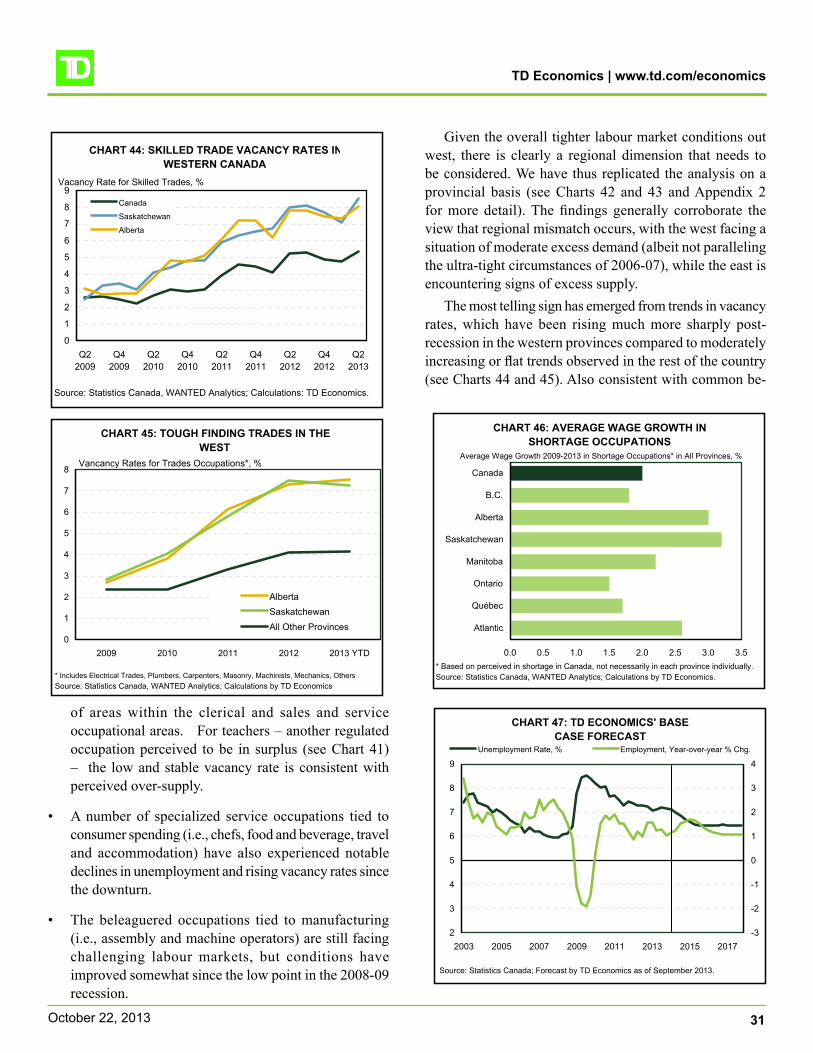
TD Economics | www.td.com/economics
31October 22, 2013
of areas within the clerical and sales and service occupational areas. For teachers – another regulated occupation perceived to be in surplus (see Chart 41) – the low and stable vacancy rate is consistent with perceived over-supply.
• A number of specialized service occupations tied to consumer spending (i.e., chefs, food and beverage, travel and accommodation) have also experienced notable declines in unemployment and rising vacancy rates since the downturn.
• The beleaguered occupations tied to manufacturing (i.e., assembly and machine operators) are still facing challenging labour markets, but conditions have improved somewhat since the low point in the 2008-09 recession.
Given the overall tighter labour market conditions out west, there is clearly a regional dimension that needs to be considered. We have thus replicated the analysis on a provincial basis (see Charts 42 and 43 and Appendix 2 for more detail). The findings generally corroborate the view that regional mismatch occurs, with the west facing a situation of moderate excess demand (albeit not paralleling the ultra-tight circumstances of 2006-07), while the east is encountering signs of excess supply.
The most telling sign has emerged from trends in vacancy rates, which have been rising much more sharply post-recession in the western provinces compared to moderately increasing or flat trends observed in the rest of the country (see Charts 44 and 45). Also consistent with common be-
CHART 45: TOUGH FINDING TRADES IN THEWEST
0
1
2
3
4
5
6
7
8
2009 2010 2011 2012 2013 YTD
AlbertaSaskatchewanAll Other Provinces
Vancancy Rates for Trades Occupations*, %
* Includes Electrical Trades, Plumbers, Carpenters, Masonry, Machinists, Mechanics, OthersSource: Statistics Canada, WANTED Analytics; Calculations by TD Economics
CHART 44: SKILLED TRADE VACANCY RATES INWESTERN CANADA
0
1
2
3
4
5
6
7
8
9
Q22009
Q42009
Q22010
Q42010
Q22011
Q42011
Q22012
Q42012
Q22013
Canada
Saskatchewan
Alberta
Vacancy Rate for Skilled Trades, %
Source: Statistics Canada, WANTED Analytics; Calculations: TD Economics .
CHART 47: TD ECONOMICS' BASE CASE FORECAST
2
3
4
5
6
7
8
9
2003 2005 2007 2009 2011 2013 2015 2017-3
-2
-1
0
1
2
3
4Unemployment Rate, % Employment, Year-over-year % Chg .
Source: Statistics Canada; Forecast by TD Economics as of September 2013 .
CHART 46: AVERAGE WAGE GROWTH INSHORTAGE OCCUPATIONS
0 .0 0 .5 1 .0 1 .5 2 .0 2 .5 3 .0 3 .5
Atlantic
Québec
Ontario
Manitoba
Saskatchewan
Alberta
B .C .
Canada
* Based on perceived in shortage in Canada, not necessarily in each province individually . Source: Statistics Canada, WANTED Analytics; Calculations by TD Economics .
Average Wage Growth 2009-2013 in Shortage Occupations* in All Provinces, %

TD Economics | www.td.com/economics
32October 22, 2013
lief, occupations widely perceived to be in shortage have been showing more telltale signs of tightness right across the country, but particularly in the west. In Alberta’s case, the data validate the claim that employers have had a tough time finding managers, tradespeople and employees in sci-ence, engineering and health care. We also see evidence that Alberta and Saskatchewan are experiencing notable tightness in the occupations where surpluses of labour are commonly perceived . This is consistent with the notion that strength in the resource sector has rippled broadly across the economy. Ironically, job conditions for resource workers have remained relatively loose compared to the heydays of pre-recession.
The story on the wage side remains somewhat curious. Wage gains in occupations that have faced the tightest condi-tions in the hottest regions of the country have been running at a faster clip than average, but the gap is not dramatic (see Chart 46). In Alberta’s case, with the sole exception of resources (where average hourly earnings have rebounded strongly since the recession), average wage gains in occupa-tions commonly believed to be in shortage have been run-ning at rates of about 3% annually since the downturn which
is in line with the province as a whole. In Saskatchewan, occupations in shortage have experienced only moderate wage growth as well and have underperformed increases in the economy as a whole.
There are a number of potential factors at play in the uniformly benign wage trends irrespective of changes in unemployment and vacancy rates. As we elaborate on in the final section, employers often prefer addressing hard-to-fill vacancies through non-wage channels and/or tap sources within their organization or in foreign markets. Another complicating factor is that wages can also rise for reasons not related to skills shortages. Examples include a hike in the minimum wage or more generous union labour contracts. Such influences tend to dampen the responsiveness of wages to labour market conditions.
It could be the case that the occupational wage data featured throughout this report, provided by Statistics Canada in its Labour Force Survey (LFS), are understat-ing actual compensation trends. This is because the wage data do not include incentive plans and bonuses. It seems that these forms of incentives have been used more widely in recent years. However, anecdotal evidence provided by
TABLE 6: 20 LARGEST PROJECTED IMBALANCES BETWEEN LABOUR DEMAND
AND SUPPLY (2011-2020)Occupations where projected demand is greater than projected
supply (shortage of workers)Administrative & Regulatory Occ's
Secretaries, Recorders & TranscriptionistsCleaners
Administrative Support ClerksContractors / Operators / Supervisors: Agriculture
Nurse Supervisors & Registered NursesFinance & Insurance Administrative Occ's
Auditors / Accountants / Investment ProfessionalsInsurance & Real Estate Sales Occ's
Human Resources & Business Service ProfessionalsSales & Service Supervisors
Sales Rep's, Wholesale TradeOther Sales & Related Occ's
College & Other Voc . InstructorsElectrical Trades & Telecommunications Occ's
Paralegals / Social Services Workers / etc .Health / Education / Social & Community Services Mgr's
Physicians / Dentists / VeterinariansSecurity Guards & Related Occ's
Technical Sales Specialists, Wholesale TradeSource: Employment and Social Development Canada (ESDC) .
TABLE 7: 20 LARGEST PROJECTED IMBALANCES BETWEEN LABOUR SUPPLY
AND DEMAND (2011-2020)Occupations where projected supply is greater than projected
demand (surplus of workers)Computer and Info . Sys . Professionals
Other Assembly & Related Occ'sRecording / Scheduling / Distributing Occ's
Machining / MetalworkingWoodworking OperatorsCarpenters & Cabinetmakers
Managers in Retail TradeOther Construction Trades
Chefs & CooksPolicy & Program Officers
Agriculture & Horticulture WorkersLibrary, Correspondence & Related Info . Clerks
Retail Salespersons & Sales ClerksAthletes, Coaches, Referees & Related Occ's
Mechanical, Electrical & Electronics AssemblersComputer & Info . Sys . Technicians
Civil / Mechanical / Electrical / Chemical EngineersMachine Operators: Fabric / Fur / LeatherMachine Operators: Pulp & Paper Prod
University Professors & AssistantsPlumbers, Pipefitters & Gas Fitters
Source: Employment and Social Development Canada (ESDC) .

TD Economics | www.td.com/economics
33October 22, 2013
HR consultants suggest there has been little change in pay structure over the past decade. Compensation costs that are compiled in the system of National Accounts (and which include incentive pay and other benefits) do point to faster growth in overall paycheques since the recession relative to the LFS average hourly earnings figures. However, without data on a detailed occupational basis, it remains unclear how the inclusion of bonuses would affect our findings and our assessment of overall wage trends.
ARE WE AT THE TIP OF THE ICEBERG?
Despite all the focus on skill mismatch in Canada, the far bigger concerns surrounding the issue relate to where the country may be headed down the road. The consensus view is that over the next decade, demand for labour will ease compared to its historical rate in tandem with projec-tions of overall economic growth. Under the assumption that participation rates for those in the 60+ age category stay the same or increase modestly over the next decade, the gap between increasing retirees and dwindling school leavers will widen dramatically. This would result in sig-nificantly slower labour force gains and downward pressure on national unemployment.
Our longer-term forecast builds in an ageing factor, but nothing dramatic (see Chart 47). Canadian demand for – and supply of – labour is expected to run at a pace of about 1% per year, once the cyclical (post-recession) boost to job growth eases by 2016,. This will hold the unemployment rate at around 6.5% on average for the remainder of the projection period.
In contrast, a number of other organizations have issued troubling projections of large and persistent labour shortages over the next decade. The Conference Board of Canada has estimated that the country faces a looming labour short-age of about 1 million workers by 2020.16 Other industries and associations from environmental and engineering to Information and Communication Technologies (ICT) and restaurant and food have joined the chorus, warning about growing gaps between supply and demand over the next 5-10 years. Textbox 7 presents some of the underpinnings of these long-term projections which can help with planning, but as we point out, one needs to be a bit cautious.
At an occupational and broad skill level, the most detailed national projections are generated by the federal Employment and Social Development Canada (ESDC). Through its Canadian Occupational Projection System
(COPS) database, the ESDC generates detailed supply and demand forecasts for more than 140 occupations. The focus of the COPS models and projections is on trends in labour supply, labour demand and their respective components and determinants over a 10-year span (for further detail, please see Appendix 3). Unfortunately, the analysis is aggregated to a national level and therefore, regional information can only be hypothesized.
According to ESDC’s model, occupations poised for growing shortages over the next ten years are largely high- and mid-skilled areas, while mid-to-low skilled groups are likely to experience growing surpluses (see Tables 6 and 7). The COPS model is quite elaborate and takes into account comprehensive occupational-specific data such as the aver-age age of workers and mortality rates. A number of pro-vincial governments – including Alberta, British Columbia and Québec – have released similar detailed occupational projections for their respective jurisdictions.
REFORM TODAY REDUCES THE RISK OF A FULL-BLOWN CRISIS IN THE FUTURE
The data analyses and tests performed thus far do not point to a glaring skill mismatch or labour shortage crisis. Absent these alarm bells, and with projections about future labour market conditions sensitive to the assumptions made, the natural question to ask is why do anything to resolve a problem that not everyone agrees is pressing? Furthermore, the public policy arena is filled with a litany of issues which need attention. Governments across Canada are pinching every penny given the overall fiscal climate. Jumping on skills, education and training could take away attention from other areas.
This line of thinking is frankly too myopic. We have showed that while data limitations make it difficult to place skills mismatch in much needed context, there appears to be some well-reasoned concerns about regional and occu-pational labour market imbalances. In any event, Canadians should not shy away from investing in education and train-ing just because a crisis has not yet fully formed. If Canada loses interest in education and training, other countries will continue to leap ahead. International labour mobility is already a global phenomenon. The 21st century economy will be more competitive and innovative than ever before. In turn, employers will demand a highly skilled workforce to realize economic gains. To maintain Canada’s standard of living today and into the future, the efficiency of Canada’s labour market needs to be maximized.

TD Economics | www.td.com/economics
34October 22, 2013
the potential for large swings in labour supply . An article by Alex Usher showed that Miner’s projected shortage would evaporate if the aggregate labour force participation rate rose relatively modestly .18
Flows of permanent and temporary immigrants are large and difficult to predict . If any of these migrants, older workers, immigrants or graduating students skew their participation to sectors experiencing labour shortage that would likely go a long way to closing the gap . Since there are many poten-tially moving parts that studies do not contemplate, it pays to be sceptical of the long-term predictions that they feature .
Shortcomings in assumptions related to growth accounting
In addition to the uncertainties around assumed vari-ables, forecasts of persistent labour shortages tend to be based on a shaky growth accounting model .
Long-term economic growth can be viewed as the prod-uct of the trend labour force increase and labour productiv-ity . As an illustration, if each variable grow at 1% over the next 10 years (the first consistent with most demographic projections, the latter consistent with recent history) then real growth in the economy would be around 2% annually . Under such a scenario, there would be no aggregate labour shortage, although economic growth would be on the low side relative to history .
Forecasts that show large, long-term labour shortages usually assume trend labour force gains and productivity that are in line with the consensus (about 1% each annually) . However, they start with the notion of some predetermined overall growth rate that the economy “should achieve”, typi-cally its historical rate of around 3% . The difference between that rate and the sum of the two components – or around 1% annually – represents the gap or labour shortage that accumulates each year .
Regardless of methodology used, the notion of an economy-wide shortage ignores the mission of the Bank of Canada, which is to set the level of interest rates in order to achieve balance in product and labour markets over the medium term .
In brief, these shortage forecasts turn the overall growth rate, which is endogenous, into an exogenous variable and let the shortfall represent the residual . This approach is likely to lead to expectations that will almost certainly be disappointed .
There is no shortage of estimates predicting large and persistent labour shortages (see Appendix 3 for just a sample of them) . For example, a Conference Board of Canada report predicted that the country would face a deficiency of nearly one million workers by 2020 .16 In his report “Jobs Without People, People Without Jobs”, Rick Miner estimated a similar figure for Ontario alone by the end of the decade “if nothing is done.”17
Theory
• Factors should close the gap between labour demand and supply UNLESS there are important AND persistent market failures;
• Labour supply can increase due to the perception of higher employment chances and the likelihood that em-ployers seeking workers will raise wages . For example, older workers can be enticed back into the labour force through financial and/or other incentives;
• Most of the analyses effectively assume a fixed pro-duction function . However, there can be substitution of capital for labour . Productivity could thus rise .
• Employers can take advantage of increased offshoring, and along with governments, help to lay the groundwork for better labour market outcomes for certain segments of the population including immigrants, Aboriginal peoples, persons with disabilities and women in certain occupations;
• Companies can carry out more training; and
• PSE institutions and student choices can adjust to meet labour market needs .
These market forces would be expected to kick in over the long term and help to equate supply and demand .
Importantly, however, there are market failures which can drive a sustained wedge between supply and demand . Witness the long-standing oversupply of teachers in On-tario . Externalities can persist that curtail private-sector training efforts . Barriers to mobility and the prevalence of seasonal workers in some regions can also lead to ex-tended periods of shortages and mismatch .
Practice
One of the most important uncertainties surrounding forecasts of growing shortages is the sensitivity of the pro-jections to the assumptions made . Case in point, there is
Textbox 7: The Long-term Forecasts of Persistent Labour Shortages: Caveat Emptor

TD Economics | www.td.com/economics
35October 22, 2013
In light of the importance of human capital, govern-ments across the country are formalizing their training and job strategies. We saw this theme emerge throughout the 2013 budget season with the announcement of the federal government’s Canada Job Grant. The CJG will be imple-mented as part of the reformed Labour Market Agreements (LMA). Ontario also jumped into the arena with its Youth Jobs Strategy. There are large pending changes to labour market policy. A discussion and evaluation of the extent of skills mismatch in Canada – if any – will allow policymak-ers and interested stakeholders to ensure that reforms and agreements are being driven by an accurate understanding of labour market realities versus anecdotal evidence or merely perception.
For all the reasons previously mentioned, it is difficult to project the specific occupations that will be in demand over the next decade. What is more certain is that ongoing impediments and rigidities threaten to lessen the responsive-ness of the labour market to adjust during a decade when large changes to the job market are almost inevitable (e.g., demographic shifts, new occupations emerging). In this context, reducing labour shortages and/or skills mismatch and improving the efficiency of the Canadian labour will provide economic gains. It is therefore important to act now to strengthen the policy framework to support the development of a skilled and mobile workforce. Delaying appropriate actions until the challenge becomes a crisis is ill-advised and imprudent. There is too much at stake to adopt a wait-and-see approach.
STRATEGIES TO MITIGATE SKILLS MISMATCH & LABOUR SHORTAGES
Present day and future challenges in the labour market are quite diverse. Impactful and successful evidence-based strategies lend themselves to a host of smaller solutions versus a panacea (see Chart 48). Yet, the market cannot be thought of a single, living, breathing entity. There are four key players in the Canadian labour market – employers/asso-ciations, workers, education institutions/training providers, and government. Each participant has differing objectives and a unique role to play in the grand scheme of things, but all are intricately-related and inter-connected.
Coordination and integration remains a distinct challenge for the inner-operations of the labour market. At present, re-ciprocal integration – where one person’s actions impact the other market participants and there is no logical sequence to interaction – describes the way the labour market functions today. Of course, a simpler reality would be sequential inte-gration where everyone would take their turn. One market player’s move would feed into the next player’s decision and the cycle would repeat itself. This simplified process is not feasible given the landscape and jurisdictional make-up of Canada. In light of prevailing labour market structure, the decision-making method becomes slower and more conver-sations are required to reach consensus. The task is much more challenging given the absence of a leader at the table.
When market failures exist, outside intervention is often required, especially if it is a high stakes situation like the one in front of Canadians. What is less clear is the kind of intervention most appropriate. Individual actions by each of
CHART 48: STEPS TO MITIGATE TALENTSHORTAGE
4642
3230
272323
2019
1717
168
0 10 20 30 40 50 60
Increased training or educationImproving the recruiting process
Recruiting from schoolsIncreased advertising efforts
Create a better working environmentBetter wages
Increasing hiring from withinBetter bonuses
Recruiting foreign workersOffer other perks / incentives
Maintain a surplus of candidatesBetter benefits
Other
Note: Respondents could select 2+ answers; % do not sum to 100 .Source: Workopolis, Mind the Gap .
% of respondents
CHART 49: FACTORS MOST IMPORTANT WHENCONSIDERING A NEW JOB
0 10 20 30 40 50 60 70 80
Career advancement
Company Culture
Company reputation
Compensation
Competitive benefits
Firm's commit . to social responsibility
Learning & Development
Location
Work / Life balance
Working environment
Student
Experienced
Note: Respondents could select 2+ answers; % do not sum to 100 .Source: Workopolis, Mind the Gap .
% of respondents

TD Economics | www.td.com/economics
36October 22, 2013
the market players have been tried, but to varying degrees of success. Some of the key measures and initiatives are summarized over the next few pages.
We recognize that strategies can be assigned to differ-ent market players simultaneously. This fact highlights that coming up with a systems-solution is a complex undertaking with a lot of moving parts. It also underscores that when ambiguity exists between responsibility and jurisdiction, we often see people sit on the sidelines waiting for the other to make the first move. Delay to action, unfortunately, is often an unintended consequence.
Employers
Raising wages, when required, would be the obvious first response to a shortage and/or mismatch scenario because compensation has been – and continues to be – a key incentive for existing or potential employees. Higher salaries would also help entice workers to relocate from a lower-cost jurisdiction in one part of the country to a high-cost jurisdiction somewhere else. According to a Workopolis Mind the Gap survey, 29-45% of workers cite compensa-tion to be the most critical element when considering a new job. Experienced workers state compensation to be a more deciding factor relative to new labour entrants or students (see Chart 49).
An absence of wage pressures even in those occupations showing real tightness today suggests that competitiveness constraints are pushing many employers to ponder other options. Consider the following example: if a company in-creases its payroll, the money must come from somewhere
else, particularly for a project that has already been approved and budgeted. If labour costs were to increase, some com-panies might be forced to shut down a project and/or move that specific operation elsewhere, even after sunk costs are taken into account.
Employees are not solely motivated by dollars. In-stead, there are many other factors at play. Non-financial employee incentives are often brought out of employers’ recruitment and retention strategy kit when wage increases are explicitly taken off the table. Examples of such initia-tives are shown in Chart 50.
Increasingly flexible work arrangements could be adopted to suit the desires of the echo and baby boom gen-erations (see Textbox 8). More options such as part-time or contract employment, a wider variety of roles, and shortened
CHART 50: HOW DO FIRMS TYPICALLY RESPOND TO RECRUITMENT PRESSURES
0 10 20 30 40 50 60
Hiring temporary foreign workers
More generous relocation packages
Sponsor students pre-employment
Outsource recruitment to HRprofessionals
Direct overseas recruitment
Training of underqualified applications
Better non-financial benefits
Higher wages & benefits
2012
2008
Source: Atlantic Provinces Economic Council and Progress Corp .
% of TOP 101 firms citing HR strategies as extremely/very important
CHART 52: BUSINESS INVESTMENT VS. ECONOMIC GROWTH IN CANADA
-20
-15
-10
-5
0
5
10
15
2002 2004 2006 2008 2010 2012 2014
Business InvestmentGDP Growth
Annual % Change
Source: Statistics Canada, Haver Analytics .Forecast by TD Economics as of September 2013 .
Forecast
CHART 51: INCIDENCE OF WORKING AT HOME
0
5
10
15
20
25
2000 2001 2002 2003 2004 2005 2006 2007 20080
14
28
42
56
70
Employees (lhs) Total (lhs)Self-employed (rhs)
Source: Statistics Canada, General Social Survey, 2000, 2001, 2003, 2005, 2006 and 2008 .
Incidence of Working at Home, %Incidence of Working at Home, %

TD Economics | www.td.com/economics
37October 22, 2013
it all” and “want it now.”• Prospects for rapid advancement: Expectations are
high when it comes to quick promotions and pay in-creases . If they encounter a ceiling at one firm, Gen Y’s are not hesitant to look elsewhere . Generally speaking, they operate under a different definition of corporate loyalty than previous generations .
• Alignment with corporate values: Corporate respon-sibility is critical to Gen Y’s – 88% of survey respondents indicated that they will seek an employer whose values match their own .
• Nurturing and feedback-heavy work environment. Gen Y’s value and expect detailed, regular feedback – 73% of respondents cited “continuous, ongoing, and informal performance feedback from their manager” as a leading quality of a great workplace .
Each generation brings a different set of rules and values to the workplace . The youngest members of the workforce are dubbed Gen Y, or Millennials, and were born between 1981 and 2000 . They are the most educated and diverse cohort in history and the first to see women surpass men in terms of post-secondary education attainment . Millen-nials have grown up with a computer and cell phone since birth or early childhood . Fifteen years from now, the last of the boomers will be reaching retirement age . When this occurs, Millennials will represent 75% of the workforce . At this point, the oldest of the Gen Y’s – who will be still quite young at 47 – will be entering leadership positions in droves .
The sheer size of the Gen Y demographic and their ensuing impact on the workforce will force corporations to re-think their talent management strategies . At present, Millennials are a challenging contradiction for employers . For instance, they are more likely to recommend their organization as a good place to work versus other age cohorts .21 Yet, workers aged 34 and younger – especially those under 25 – are far more likely to be seriously consid-ering leaving their organizations . Surveys suggest the Gen Y have a different view of work and organizational loyalty . They see work as a mutually beneficial exchange with their employer . As a consequence, when the Gen Y’s job is no longer working, he/she will simply move on to another one . This mindset – if it prevails in its current form – will have implications for how employers manage this increasingly important segment of the workforce .
What do today’s Millennials want from their job? Taking into account the recent recession, Millennials
have been forced to look beyond their paycheque when it comes to considering a new position . In a recent Price-waterhouseCoopers (PwC) survey, Millennials felt that they had to give up certain things . The top three sacrifices were: (1) accepting a lower salary than expected (32% of respondents); (2) taking fewer additional benefits than they had hoped for (17%); and (3) not being able to work in their preferred location (17%) .
A review of the literature and recent surveys suggests that Millennials want the following in a job:• Greater emphasis on work-life balance: Millennials
tend to negotiate the terms and conditions under which they work, demanding work-life balance at all career stages .
• Good pay and benefits: While work-life balance is an important career goal, pay remains important . The literature describes Millennials to be a group that “want
Textbox 8: Bridging the Generational Divide in the Workplace
CHART 54: COMPROMISES MADE WHEN ACCEPTING CURRENT POSITION
28
6
14141414151717
32
0
5
10
15
20
25
30
35
Sala
ry
Loca
tion
Addi
tiona
lbe
nefit
s
Sect
or
Opp
ortu
nitie
sfo
rad
vanc
emen
t
Job
role
Org
anisa
tion
choi
ce
Ove
rqua
lified
Oth
er
None
%
Source: PwC, Millenials at Work - Reshaping the Workplace
CHART 53: WHAT MAKES AN ORGANIZATION ATTRACTIVE?
1
8
8
10
15
15
15
20
21
31
35
44
52
0 10 20 30 40 50 60
Other
The sector in which the organisation operates
Diversity/equal opportunities record
The employer brand
A reputation as an employer of the best and brightestpeople
Corporate values that match your own
Good reputation for ethical practices
International opportunities
Flexible working arrangements
Good benefits packages
Excellent training/development programmes
Competitive wages/other financial incentives
Opportunities for career progression
%Source: PwC, Millenials at Work - Reshaping the Workplace

TD Economics | www.td.com/economics
38October 22, 2013
workweeks could provide greater incentives to remain in the labour force. In theory, allowing employees to work from home can accomplish the double aim of both a happier workforce (through a better work-life balance) and greater productivity. The approach can also save companies money given less overhead (e.g., less rent required for offices). Between 2000 and 2008, the share of Canadians working from home increased from 17% to 19% (see Chart 51).19 In addition, most of Canada’s Top 100 Employers offer a range of alternative work arrangements, including adjust-able hours, job sharing, shortened workweek options and reduced summer hours.20
It is not clear whether flexible work arrangements are net positive for GDP. Part-time employment generates less GDP than full-time employment. In addition, there might be little net growth in labour supply if more people do not enter the workforce under the new arrangements. Furthermore, partial retirement may occur faster than full retirement, a negative development to labour supply growth. Last, the jury is still out as to whether productivity gains are identical for workers telecommuting and those regularly commuting into an office or other worksite.
Business investments in capital should also be explored (see Chart 52). Such activity can help companies cope with reduced labour supply. It can also pay off in terms of higher wages if productivity accelerates. It has been well docu-mented that business spending on machinery and equipment relative to GDP in Canada has responded only tepidly to the powerful incentives of a rising Canadian dollar and falling
costs of U.S.-made capital equipment in recent years. Thus, there appear to be sizeable opportunities to take better advan-tage of productivity-enhancing equipment going forward.
Encouraging professional development training is an important means to an end. Employers have acknowl-edged this. There is also some evidence from the OECD that employer-sponsored training reduces turnover. Yet, no matter how one slices it – as expenditures per employee, as a share of GDP or relative to other countries – expenditures on training in Canada have been in decline (see Chart 55). According to the Conference Board of Canada, training expenditures per employee were 38% higher in 1993 than in 2010.22 This is the case despite considerable economic growth and increasing skill demands which have occurred in the intervening years.
Employers often view the labour market as a public good. However, the direction of training expenditure is not just a private-sector development, as public sector training has also fallen short (see Chart 56). Language training for immigrants and on-the-job training for people drawn from non-traditional labour pools will be crucial for boosting la-bour force participation. However, firms investing in human capital development can be risky due to the frequent turnover of workers, notably in the echo and Millennial generation. Obviously, employers who appeal better to Millennials, while staying profitable, will attract these workers. However, in aggregate, poaching is a zero-sum game.
CHART 56: PUBLIC SECTOR TRAININGEXPENDITURE AS A SHARE OF GDP
0 .0
0 .1
0 .2
0 .3
0 .4
0 .5
0 .6
Canada U .S . Finland Sweden Denmark OECD
Public training expenditure, % of GDP
Source: OECD Statistics
CHART 55: TRAINING COST PER EMPLOYEE 1990-2010
200
400
600
800
1,000
1,200
1,400
1990 1993 1996 1999 2002 2005 2008
1993: $1,116 (Peak)
Constant 2010 $
2010: $688
-38%
Source: Conference Board of Canada .

TD Economics | www.td.com/economics
39October 22, 2013
Federal and provincial governments
In an attempt to overcome some of the current barriers to training, the 2013 federal budget announced the introduction of the Canada Job Grant (CJG). The policy instrument aims to align spending with private sector needs by making them partners in training. The grant brings interested parties (federal and provincial governments and employers) around the table. In turn, the integration and coordination aspect of the policy design should, in theory, reduce the probability of miscommunication and increase the efficiency of how training is provided.
The CJG initiative heightens the focus on demand-oriented investments in training, and the cost-sharing nature of the measure addresses part of the negative externality
problem tied to private investments in training. However, concerns have been raised that more attention in the program is placed on short-term training related to re-employment. In addition, the funds attached to the provision of the Canada Job Grant will be distributed through reformed Labour Market Agreements. Provinces/territories have argued that for them to meet their share of the CJG, they will need to reallocate funds from existing government programs. Con-sultations surrounding the fate of the CJG with provinces, territories and the federal government are scheduled to take place this Fall.
Evidence on the productivity returns to training show that it is most effective when: (1) significant dollar invest-ments are made; and (2) training is delivered over a period of time in a classroom setting.23 Perhaps a larger obstacle to improving training is historical. In Canada, training has typically been viewed as a role for government, but employ-ers also benefit from the skilled workforce. There are also jurisdictional challenges from a governmental perspective, as skills development is arguably a provincial matter, but the federal government also has a vested interest in the overall skills held by Canadians. Another barrier related to employer-sponsored training delivery stems from the size of the firm. Large firms have economies of scale when it comes to the delivery of training.24 That being said, these same enterprises often have more high-skilled workers. The evidence suggests that it is these workers who typically demand more amount of training over their careers.
Newcomers report the lack of foreign credential recog-nition as a key challenge when they migrate to Canada. As a
CHART 57: NEW IMMIGRANT INTEGRATION AN ISSUE…
0
10
20
30
40
50
60
70
80
90
Before Landing 6 Months AfterLanding
2 Years AfterLanding
4 Years AfterLanding
Skilled (Level O, A, B)Skill Level CSkill Level D
Skill Level of Pre-Migration Jobs and Post-Migration Jobs
Source: Longitudinal Survey of Immigrants to Canada, 2005 .
CHART 58: ANNUAL NEW IMMIGRANTSIN CANADA
0
50,000
100,000
150,000
200,000
250,000
300,000
1992 1994 1996 1998 2000 2002 2004 2006 2008 2010 20120 .0
0 .1
0 .2
0 .3
0 .4
0 .5
0 .6
0 .7
0 .8
0 .9
1 .0
% of Population (rhs)Number of Immigrants (lhs)
Current Target:
Immigrants in a Given Year % of Population
Source: Statistics Canada
CHART 59: INCREASED USAGE OF TEMPORARYFOREIGN WORKER PROGRAM
0
20,000
40,000
60,000
80,000
100,000
120,000
1988 1991 1994 1997 2000 2003 2006 2009 2012
Source: Citizenship and Immigration Canada .
Foreign Workers, Total Entries

TD Economics | www.td.com/economics
40October 22, 2013
consequence, some immigrants are working in positions for which they are over-qualified (see Chart 57). The example of doctors driving cabs is frequently cited. Depending on their source country, new immigrants often encounter difficulties related to communication in one or both official languages.
A number of recent immigration reforms by the fed-eral government – including changes to the Federal Skilled Worker program – offer potential to improve immigrant socio-economic outcomes through the better matching of skills with labour market demands. A more “active” system would go a lot further in accomplishing this task. In this regard, the federal government recently announced a new Expression of Interest model designed to replace the current system of applying for permanent residence.25
While there have been some positive recent changes to the immigration system, it is the increased use of the fed-eral Temporary Foreign Worker (TFW) program which has raised eyebrows. This program has more than doubled from 103,000 to more than 213,000 over the past 10 years (see Chart 59).26 While initially intended on meeting short-term labour shortages in high-skilled occupations, the use of the TFW program has been increasingly gravitating toward lower-skilled occupations. Furthermore, over the past few years, fears have grown that companies have been circumventing the rules of the program. As a result, the federal government took actions earlier this year to safe-guard against the potential for program abuse and employee mistreatment.27 Consultations are also underway with the provinces to address concerns about unenforceable labour laws and missing information.28 The increased usage of the
TFW program could be, in part, a reflection of the failure of the current immigration system to meet Canada’s rapidly changing skilled labour needs.
On the labour mobility front, provincial governments have also been taking some action to address imbalances in regulated fields. For example, in response to a growing over-supply of teachers, the Ontario government announced that it would reduce the number of students at teachers col-lege in half and double the length of time it takes to com-plete the teaching degree.29 On the flip side, when a need for more physicians was identified, the Ontario government announced more medical school seats in 2009.30 Other ex-amples of such policy decisions are found across the country. The ultimate test of the success of these policies will be how fast the education system responds to changes in demand.
Although many occupations enjoy consistency in job requirements, workers have encountered barriers when they move from one jurisdiction to another. To achieve a more efficient labour market, governments are helping to knock down interprovincial barriers. For example, the Red Seal program certifies tradesperson competence across Canada without further examination. Furthermore, in 2009, provincial and territorial governments agreed to update the Labour Mobility Chapter of the Agreement on Internal Trade, which will help to ensure that professional certificates or licenses are recognized by all jurisdictions. However, the deal appears to be too narrow in scope and open to interpretation. As a result, while frameworks exist and intentions are positive, progress to date on eradicating interprovincial barriers has been frustratingly slow.
CHART 60: LABOUR FORCE PARTICIPATION RATEOF UNDER-REPRESENTED GROUPS
59 .0
59 .5
60 .0
60 .5
61 .0
61 .5
62 .0
62 .5
63 .0
63 .5
2001 2006 2011
Women Aboriginals*
Immigrants
Source: Statistics Canada, 2011 National Household Survey, 2001 & 2006 Census .
Participation Rate, %
CHART 61: GROWTH OF REGISTERED APPRENTICESHIP TRAINING
-10 -5 0 5 10 15 20 25 30
Machinists
Automotive service
Welders
Carpenters
Electricians
Heavy Duty Equipment
Total Major Trade Groups
Other
Metal Workers (Other)
Electronics and Related
Plumbers and Related
Early Childhood Educators and Rel .
Food Service
Landscape Related
User Support Technicians
2007-2011 Annual Growth of Registered Apprenticeship Training, by Major Trade Group, %
Source: Statistics Canada
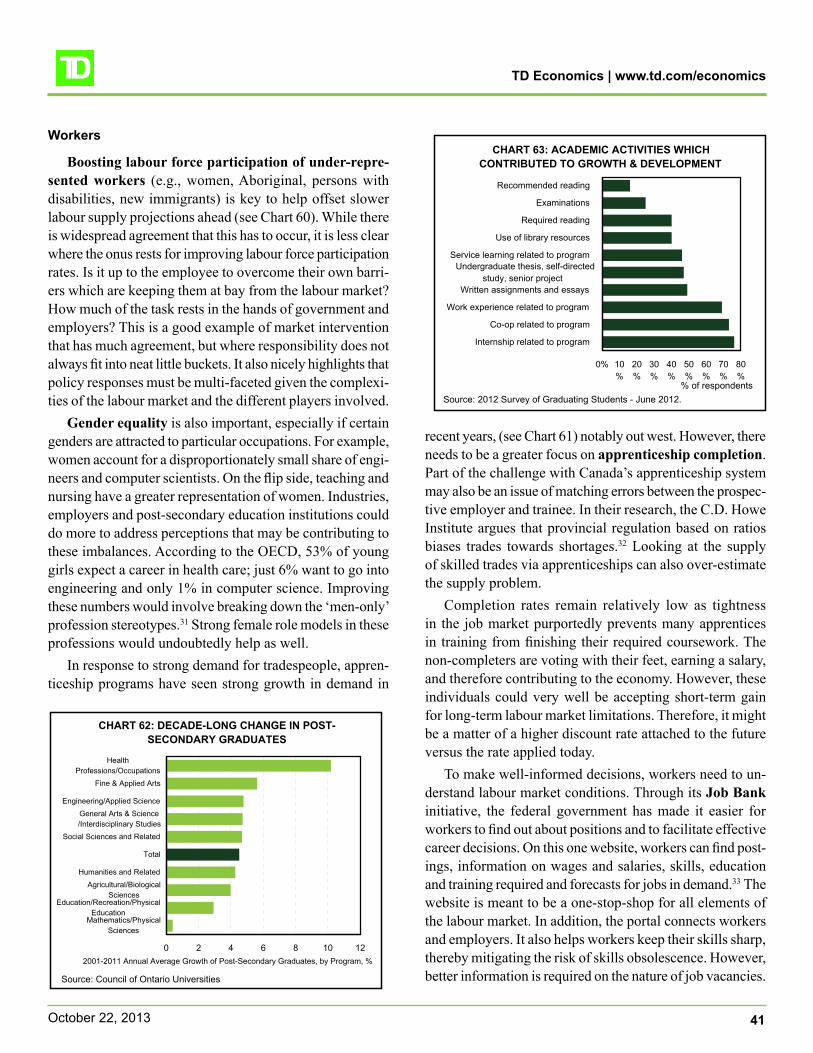
TD Economics | www.td.com/economics
41October 22, 2013
Workers
Boosting labour force participation of under-repre-sented workers (e.g., women, Aboriginal, persons with disabilities, new immigrants) is key to help offset slower labour supply projections ahead (see Chart 60). While there is widespread agreement that this has to occur, it is less clear where the onus rests for improving labour force participation rates. Is it up to the employee to overcome their own barri-ers which are keeping them at bay from the labour market? How much of the task rests in the hands of government and employers? This is a good example of market intervention that has much agreement, but where responsibility does not always fit into neat little buckets. It also nicely highlights that policy responses must be multi-faceted given the complexi-ties of the labour market and the different players involved.
Gender equality is also important, especially if certain genders are attracted to particular occupations. For example, women account for a disproportionately small share of engi-neers and computer scientists. On the flip side, teaching and nursing have a greater representation of women. Industries, employers and post-secondary education institutions could do more to address perceptions that may be contributing to these imbalances. According to the OECD, 53% of young girls expect a career in health care; just 6% want to go into engineering and only 1% in computer science. Improving these numbers would involve breaking down the ‘men-only’ profession stereotypes.31 Strong female role models in these professions would undoubtedly help as well.
In response to strong demand for tradespeople, appren-ticeship programs have seen strong growth in demand in
recent years, (see Chart 61) notably out west. However, there needs to be a greater focus on apprenticeship completion. Part of the challenge with Canada’s apprenticeship system may also be an issue of matching errors between the prospec-tive employer and trainee. In their research, the C.D. Howe Institute argues that provincial regulation based on ratios biases trades towards shortages.32 Looking at the supply of skilled trades via apprenticeships can also over-estimate the supply problem.
Completion rates remain relatively low as tightness in the job market purportedly prevents many apprentices in training from finishing their required coursework. The non-completers are voting with their feet, earning a salary, and therefore contributing to the economy. However, these individuals could very well be accepting short-term gain for long-term labour market limitations. Therefore, it might be a matter of a higher discount rate attached to the future versus the rate applied today.
To make well-informed decisions, workers need to un-derstand labour market conditions. Through its Job Bank initiative, the federal government has made it easier for workers to find out about positions and to facilitate effective career decisions. On this one website, workers can find post-ings, information on wages and salaries, skills, education and training required and forecasts for jobs in demand.33 The website is meant to be a one-stop-shop for all elements of the labour market. In addition, the portal connects workers and employers. It also helps workers keep their skills sharp, thereby mitigating the risk of skills obsolescence. However, better information is required on the nature of job vacancies.
CHART 63: ACADEMIC ACTIVITIES WHICH CONTRIBUTED TO GROWTH & DEVELOPMENT
0% 10%
20%
30%
40%
50%
60%
70%
80%
Internship related to program
Co-op related to program
Work experience related to program
Written assignments and essays
Undergraduate thesis, self-directedstudy, senior project
Service learning related to program
Use of library resources
Required reading
Examinations
Recommended reading
Source: 2012 Survey of Graduating Students - June 2012 .% of respondents
CHART 62: DECADE-LONG CHANGE IN POST-SECONDARY GRADUATES
0 2 4 6 8 10 12
Mathematics/PhysicalSciences
Education/Recreation/PhysicalEducation
Agricultural/BiologicalSciences
Humanities and Related
Total
Social Sciences and Related
General Arts & Science/Interdisciplinary Studies
Engineering/Applied Science
Fine & Applied Arts
HealthProfessions/Occupations
2001-2011 Annual Average Growth of Post-Secondary Graduates, by Program, %
Source: Council of Ontario Universities
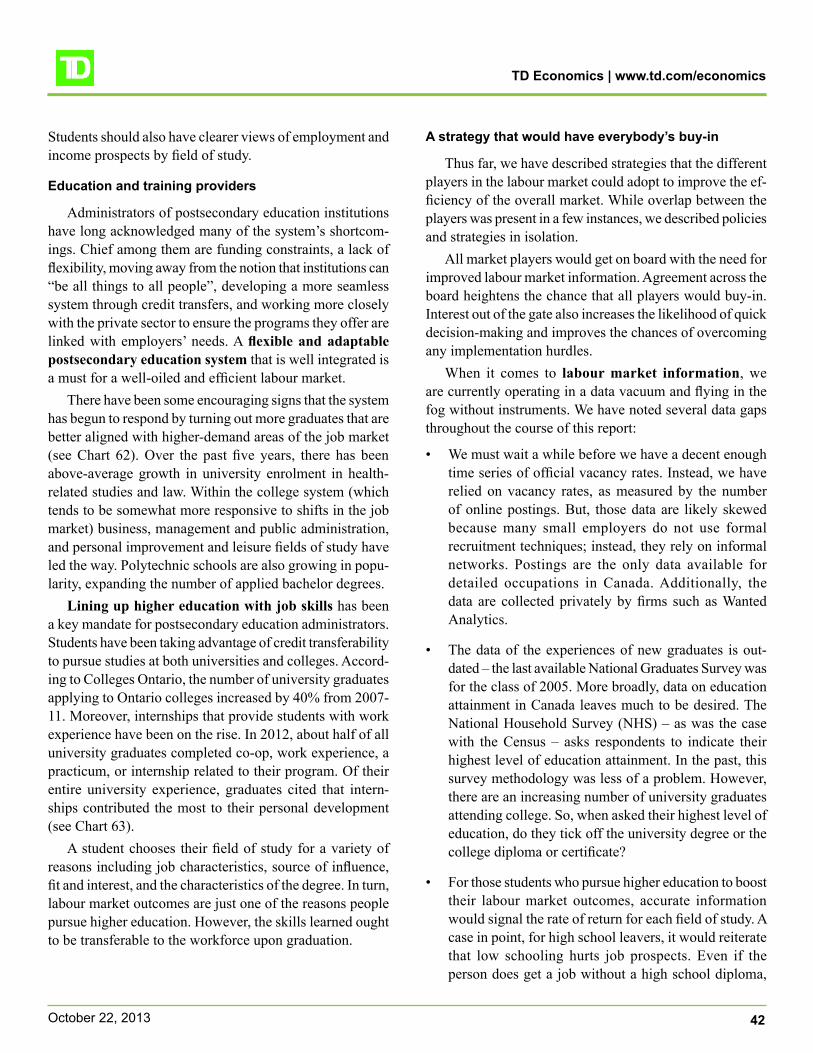
TD Economics | www.td.com/economics
42October 22, 2013
Students should also have clearer views of employment and income prospects by field of study.
Education and training providers
Administrators of postsecondary education institutions have long acknowledged many of the system’s shortcom-ings. Chief among them are funding constraints, a lack of flexibility, moving away from the notion that institutions can “be all things to all people”, developing a more seamless system through credit transfers, and working more closely with the private sector to ensure the programs they offer are linked with employers’ needs. A flexible and adaptable postsecondary education system that is well integrated is a must for a well-oiled and efficient labour market.
There have been some encouraging signs that the system has begun to respond by turning out more graduates that are better aligned with higher-demand areas of the job market (see Chart 62). Over the past five years, there has been above-average growth in university enrolment in health-related studies and law. Within the college system (which tends to be somewhat more responsive to shifts in the job market) business, management and public administration, and personal improvement and leisure fields of study have led the way. Polytechnic schools are also growing in popu-larity, expanding the number of applied bachelor degrees.
Lining up higher education with job skills has been a key mandate for postsecondary education administrators. Students have been taking advantage of credit transferability to pursue studies at both universities and colleges. Accord-ing to Colleges Ontario, the number of university graduates applying to Ontario colleges increased by 40% from 2007-11. Moreover, internships that provide students with work experience have been on the rise. In 2012, about half of all university graduates completed co-op, work experience, a practicum, or internship related to their program. Of their entire university experience, graduates cited that intern-ships contributed the most to their personal development (see Chart 63).
A student chooses their field of study for a variety of reasons including job characteristics, source of influence, fit and interest, and the characteristics of the degree. In turn, labour market outcomes are just one of the reasons people pursue higher education. However, the skills learned ought to be transferable to the workforce upon graduation.
A strategy that would have everybody’s buy-in
Thus far, we have described strategies that the different players in the labour market could adopt to improve the ef-ficiency of the overall market. While overlap between the players was present in a few instances, we described policies and strategies in isolation.
All market players would get on board with the need for improved labour market information. Agreement across the board heightens the chance that all players would buy-in. Interest out of the gate also increases the likelihood of quick decision-making and improves the chances of overcoming any implementation hurdles.
When it comes to labour market information, we are currently operating in a data vacuum and flying in the fog without instruments. We have noted several data gaps throughout the course of this report:
• We must wait a while before we have a decent enough time series of official vacancy rates. Instead, we have relied on vacancy rates, as measured by the number of online postings. But, those data are likely skewed because many small employers do not use formal recruitment techniques; instead, they rely on informal networks. Postings are the only data available for detailed occupations in Canada. Additionally, the data are collected privately by firms such as Wanted Analytics.
• The data of the experiences of new graduates is out-dated – the last available National Graduates Survey was for the class of 2005. More broadly, data on education attainment in Canada leaves much to be desired. The National Household Survey (NHS) – as was the case with the Census – asks respondents to indicate their highest level of education attainment. In the past, this survey methodology was less of a problem. However, there are an increasing number of university graduates attending college. So, when asked their highest level of education, do they tick off the university degree or the college diploma or certificate?
• For those students who pursue higher education to boost their labour market outcomes, accurate information would signal the rate of return for each field of study. A case in point, for high school leavers, it would reiterate that low schooling hurts job prospects. Even if the person does get a job without a high school diploma,
TD Economics | www.td.com/economics
43October 22, 2013
job stability and security are often ensuing concerns.
Until better information becomes readily available in Canada, public policy, business and postsecondary education administrator decisions will be driven more by perceptions than hard evidence. Better data would flag, with better precision, aggregate imbalances and details mismatches. A marriage between the Youth in Transition Survey data and income tax data would permit economists to measure the rate of return from pursuing education. Alternatively, a marriage between postsecondary education administrative data and Canada Revenue Agency data might do the trick.
PARTING THOUGHTS
Views on the job market are vulnerable to being driven by anecdote. Our findings pour some cold water on percep-tions that Canada’s job market is deeply dysfunctional and currently facing a crisis with respect to skills. Our data test uncovers some evidence of tightness in a number of occupa-tions that have been widely-perceived to be encountering labour shortages. Yet, our analysis failed to provide a real smoking gun. Vacancy rates for a number of these occupa-tions have not risen to the degree one might have expected, nor has wage growth accelerated.
The gaps in the data make it difficult to conclude whether or not the skills challenge is significantly worse today than it was five or ten years ago. Skills, in the broadest sense, are virtually impossible to measure with precision, mean-ing that much of the challenge may be undetected in the data. Are students who take more generalized degrees that much worse off over the long term? Why are Canadians not relocating to where the job opportunities exist? And, will
the situation surrounding skills steadily deteriorate as the population ages? A number of forecasters have issued dire warnings on shortages, but their analyses are highly sensi-tive to the assumptions made.
While we find no evidence of an imminent crisis, Canada can do much better to improve the efficiency of its labour market. Several strategies have been reviewed in this re-port for each of the labour market participants: employers, workers, governments and postsecondary institutions. One strategy leaps off the page that everyone would agree with right out of the gate: improved labour market information. Access to reliable, accurate and frequent comprehensive data will help answer some of the questions raised and offset some of the ill-effects of labour market inefficiencies.
Canadians would undoubtedly stand to benefit from an improved standard of living and better economic gains over the longer-term. Canada’s labour productivity growth has been in a structural decline since the 1970s. More alarmingly, productivity has slowed to a crawl since 2000, despite several favourable moves to turn the tide including: corporate tax reductions at the provincial and federal level; implementing a Harmonized Sales Tax in several provinces including Ontario, Québec and Prince Edward Island; and the western provinces have enhanced labour mobility and trade agreements in an effort to reduce barriers. Canada’s lacklustre productivity record has not been matched by other countries. As a consequence, Canada’s GDP per capita has slipped several notches among other OECD countries, de-spite a considerable rise in work effort in Canada. A more skilled workforce and efficient labour market is a vital com-ponent to achieving and sustaining improved productivity and economic growth.
Derek Burleton, VP & Deputy Chief Economist 416-982-2514
Sonya Gulati, Senior Economist 416-982-8063
Connor McDonald, Economist 416-944-5729
Sonny Scarfone, Research Associate 416-944-5069

TD Economics | www.td.com/economics
44October 22, 2013
APPENDIX 1 – OCCUPATIONS IN PERCEIVED SHORTAGE & SURPLUS – CANADA
Employment (000s)2012 2009 2012 2013 YTD 2009 2012 2013 YTD 03-07 08-09 10-13 YTD
Occupations in Perceived Shortage 4967.4 4.6 2.9 3.2 2.8 3.9 3.9 3.0 3.3 2.0Science, Engineering & IT 1182.5 4.2 2.9 3.0 4.4 5.5 5.3 2.4 3.2 1.8Managers In Engineering, Architecture, Science And IS 86 .1 1 .7 1 .2 3 .8 3 .6 4 .4 4 .1 3 .5 1 .3 1 .5Physical Science Professionals 29 .7 3 .6 2 .9 1 .2 3 .4 5 .5 4 .5 5 .0 -0 .2 3 .3Life Science Professionals 28 .2 0 .8 0 .0 0 .0 1 .8 2 .8 2 .8 3 .3 0 .8 1 .1Engineers 227 .2 4 .0 1 .9 2 .1 3 .2 4 .5 4 .2 1 .9 4 .8 1 .8Computer and IT Professionals and Technicians 554 .6 4 .1 3 .4 2 .6 6 .0 6 .6 6 .5 2 .0 3 .2 1 .6Technical Occupations in Science & Engineering 256 .7 5 .8 3 .9 5 .2 2 .7 4 .4 4 .4 2 .8 3 .2 2 .1Trades 1444.9 9.0 5.2 5.8 2.4 4.8 4.9 3.0 3.3 2.2Electrical Trades* 178 .6 7 .5 4 .4 5 .2 2 .0 3 .3 3 .4 2 .1 2 .7 2 .1Plumbers, Pipefitters And Gas Fitters 75 .4 11 .5 6 .3 6 .4 2 .4 4 .1 4 .0 2 .6 4 .0 2 .0Carpenters And Cabinetmakers 139 .2 13 .0 10 .1 13 .0 2 .5 4 .1 4 .2 4 .2 1 .6 3 .2Masonry And Plastering Trades 65 .4 14 .5 8 .8 6 .5 4 .8 8 .5 8 .6 1 .9 3 .2 2 .9Other Trades 986 .3 8 .1 4 .4 4 .9 2 .3 4 .9 5 .1 3 .1 3 .6 2 .1Health 1425.8 1.4 1.3 1.3 2.2 2.3 2.4 3.3 3.6 1.7Managers In Health** 111 .6 2 .3 2 .0 1 .7 1 .6 1 .7 1 .8 2 .6 3 .8 2 .6Physicians, Dentists And Veterinarians 122 .9 0 .0 0 .2 0 .2 0 .8 0 .9 1 .1 3 .5 2 .1 1 .8Pharmacists, Dietitians And Nutritionists 40 .7 0 .0 0 .0 0 .0 4 .0 3 .8 4 .4 3 .8 3 .1 2 .6Nurse Supervisors And Registered Nurses 304 .4 0 .6 0 .9 0 .8 1 .9 1 .6 1 .5 3 .1 4 .4 1 .5Psychologists, Social Workers 150 .0 1 .3 0 .9 1 .9 3 .3 3 .7 3 .5 2 .5 4 .1 2 .0Medical Technologists And Technicians (Exc . Dental Health) 105 .0 1 .1 1 .1 0 .8 3 .4 2 .9 3 .2 3 .1 3 .5 0 .5Assisting Occupations In Support Of Health Services 347 .3 2 .8 2 .2 2 .2 1 .2 1 .5 1 .7 3 .7 3 .2 1 .4Other Health 243 .9 1 .1 1 .2 1 .0 3 .5 3 .7 3 .9 3 .8 3 .6 2 .2Other 914.2 3.2 1.9 2.2 2.5 2.9 3.1 3.2 3.1 2.3Managers In Public Administration 32 .2 0 .0 0 .0 0 .0 6 .1 6 .8 8 .2 2 .0 1 .8 1 .9Auditors, Accountants And Investment Professionals 403 .3 2 .6 1 .9 2 .0 2 .6 2 .5 2 .4 3 .6 3 .6 1 .7Human Resources And Business Service Professionals 207 .1 2 .6 1 .6 2 .5 1 .5 1 .8 2 .1 2 .7 1 .2 2 .2Architects, Urban Planners And Land Surveyors 41 .0 3 .1 2 .9 0 .9 5 .7 8 .3 8 .2 0 .6 6 .6 3 .9Supervisors, Mining, Oil And Gas 28 .1 8 .0 0 .0 0 .7 1 .5 3 .1 2 .7 4 .5 2 .3 3 .5Underground Miners, Oil And Gas Drillers 42 .5 11 .5 5 .1 9 .1 0 .4 1 .2 1 .0 3 .5 4 .4 4 .6Managers In Financial And Business Services 110 .6 2 .3 1 .3 0 .6 2 .9 3 .5 4 .4 3 .9 1 .8 2 .6Managers In Other Services 20 .4 0 .5 0 .0 1 .3 2 .3 3 .2 3 .8 -0 .7 8 .9 0 .6Managers In Primary Production (Except Agriculture) 12 .8 0 .0 0 .9 0 .0 2 .8 4 .0 4 .0 5 .9 5 .9 5 .4Mine Service Workers And Operators In O&G Drilling 16 .2 14 .4 6 .6 8 .8 1 .6 5 .4 6 .4 2 .8 4 .2 3 .8
Occupations in Perceived Surplus 4906.2 8.0 6.0 6.4 2.3 3.3 3.3 2.5 3.8 2.2Manufacturing-Related/Labourers 947.4 15.9 9.9 11.6 1.8 3.3 3.6 2.6 3.0 1.9Managers In Manufacturing And Utilities 85 .4 4 .3 2 .1 2 .9 2 .3 2 .6 2 .9 1 .9 4 .6 1 .7Machine Operators in Manufacturing 312 .5 12 .3 5 .7 6 .1 1 .6 3 .3 3 .4 2 .3 2 .3 1 .5Labourers In Processing, Manufacturing*** 163 .0 16 .9 12 .6 13 .6 2 .1 3 .5 3 .5 2 .3 2 .5 2 .4Supervisors, Assembly And Fabrication 51 .8 7 .1 0 .2 0 .4 1 .6 3 .1 3 .0 3 .0 2 .8 0 .1Other Assembly And Related Occupations 90 .4 14 .9 8 .2 9 .6 1 .7 3 .0 3 .1 3 .4 4 .8 1 .2Trades Helpers And Labourers 144 .9 26 .1 17 .6 22 .0 1 .7 2 .9 2 .8 3 .2 2 .9 2 .9Primary Production Labourers 93 .8 27 .6 21 .7 27 .1 2 .4 4 .4 6 .7 3 .9 3 .2 3 .5Supervisors, Logging And Forestry 5 .6 2 .3 1 .7 0 .0 1 .2 2 .2 2 .5 -9 .2 8 .4 -5 .2Teachers 487.4 3.6 3.5 2.2 1.0 1.0 1.0 2.6 3.6 2.8Secondary And Elementary School Teachers 487 .4 3 .6 3 .5 2 .2 1 .0 1 .0 1 .0 2 .6 3 .6 2 .8Clerical 1176.7 4.7 4.0 4.1 2.8 3.4 3.5 2.6 3.3 1.8Clerical Supervisors 180 .0 3 .4 3 .2 3 .9 1 .7 2 .0 2 .0 1 .8 4 .2 1 .8Clerical Occupations, General Office Skills 245 .6 5 .8 5 .6 6 .3 5 .4 6 .2 5 .8 2 .8 3 .3 2 .3Finance And Insurance Clerks 395 .3 4 .4 3 .5 3 .2 3 .1 3 .9 4 .2 2 .8 3 .4 1 .6Administrative Support Clerks 255 .5 5 .2 3 .8 3 .4 0 .8 0 .9 1 .1 2 .6 2 .7 1 .7Mail And Message Distribution Occupations 100 .3 4 .4 3 .7 4 .7 2 .3 3 .1 3 .5 2 .6 3 .3 1 .2Sales and Service 2294.7 7.5 6.0 6.4 2.6 3.8 3.6 2.3 4.5 2.4Sales And Service Supervisors 278 .8 4 .0 2 .9 2 .9 2 .9 4 .2 3 .9 1 .7 3 .9 2 .6Retail Salespersons And Sales Clerks 543 .6 7 .3 5 .7 6 .2 1 .9 2 .3 2 .1 2 .3 4 .2 2 .6Cashiers 355 .8 7 .6 6 .3 7 .9 1 .0 1 .5 1 .7 2 .4 4 .8 2 .4Chefs And Cooks 235 .5 9 .0 7 .7 7 .1 5 .7 9 .3 8 .0 2 .4 4 .7 2 .1Butchers And Bakers 85 .7 5 .9 6 .2 3 .9 2 .1 3 .1 2 .7 1 .3 3 .1 2 .6Occupations In Food And Beverage Service 265 .4 8 .1 6 .5 6 .8 3 .3 5 .2 5 .1 3 .5 4 .6 2 .1Security Guards And Related Occupations 105 .9 8 .0 5 .2 6 .3 1 .7 2 .6 2 .4 1 .8 5 .2 2 .0Occupations In Travel And Accommodation 67 .5 6 .3 3 .8 3 .7 6 .9 10 .0 8 .2 2 .7 4 .9 1 .5Tour And Recreational Guides And Amusement 21 .2 8 .1 4 .2 6 .8 5 .7 7 .7 9 .4 2 .7 0 .6 2 .0Food Counter Attendants And Kitchen Helpers 335 .3 9 .3 8 .1 8 .2 1 .7 2 .7 2 .6 2 .4 5 .1 2 .6
Notes: * Includes education, Social and Community Services . ** Includes Telecommuncations Occupations . *** Includes Utilities .Source: Statistics Canada, WANTED Analytics; Calculations by TD Economics .
TABLE 8: OCCUPATIONS IN PERCEIVED SHORTAGE AND SURPLUS - CANADAAverage Hourly Wage Growth (%)Unemployment Rate (%) Vacancy Rate (%)
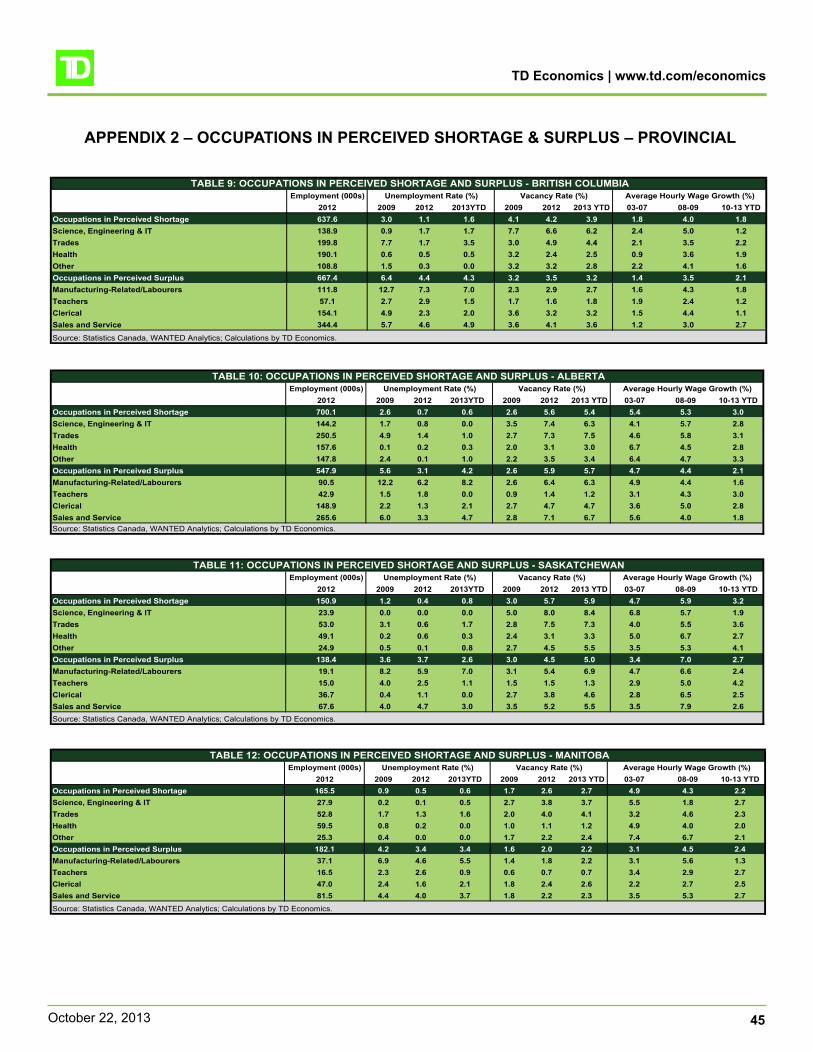
TD Economics | www.td.com/economics
45October 22, 2013
APPENDIX 2 – OCCUPATIONS IN PERCEIVED SHORTAGE & SURPLUS – PROVINCIAL
Employment (000s)2012 2009 2012 2013YTD 2009 2012 2013 YTD 03-07 08-09 10-13 YTD
Occupations in Perceived Shortage 637.6 3.0 1.1 1.6 4.1 4.2 3.9 1.8 4.0 1.8Science, Engineering & IT 138.9 0.9 1.7 1.7 7.7 6.6 6.2 2.4 5.0 1.2Trades 199.8 7.7 1.7 3.5 3.0 4.9 4.4 2.1 3.5 2.2Health 190.1 0.6 0.5 0.5 3.2 2.4 2.5 0.9 3.6 1.9Other 108.8 1.5 0.3 0.0 3.2 3.2 2.8 2.2 4.1 1.6Occupations in Perceived Surplus 667.4 6.4 4.4 4.3 3.2 3.5 3.2 1.4 3.5 2.1Manufacturing-Related/Labourers 111.8 12.7 7.3 7.0 2.3 2.9 2.7 1.6 4.3 1.8Teachers 57.1 2.7 2.9 1.5 1.7 1.6 1.8 1.9 2.4 1.2Clerical 154.1 4.9 2.3 2.0 3.6 3.2 3.2 1.5 4.4 1.1Sales and Service 344.4 5.7 4.6 4.9 3.6 4.1 3.6 1.2 3.0 2.7
TABLE 9: OCCUPATIONS IN PERCEIVED SHORTAGE AND SURPLUS - BRITISH COLUMBIAAverage Hourly Wage Growth (%)
Source: Statistics Canada, WANTED Analytics; Calculations by TD Economics .
Unemployment Rate (%) Vacancy Rate (%)
Employment (000s)2012 2009 2012 2013YTD 2009 2012 2013 YTD 03-07 08-09 10-13 YTD
Occupations in Perceived Shortage 150.9 1.2 0.4 0.8 3.0 5.7 5.9 4.7 5.9 3.2Science, Engineering & IT 23.9 0.0 0.0 0.0 5.0 8.0 8.4 6.8 5.7 1.9Trades 53.0 3.1 0.6 1.7 2.8 7.5 7.3 4.0 5.5 3.6Health 49.1 0.2 0.6 0.3 2.4 3.1 3.3 5.0 6.7 2.7Other 24.9 0.5 0.1 0.8 2.7 4.5 5.5 3.5 5.3 4.1Occupations in Perceived Surplus 138.4 3.6 3.7 2.6 3.0 4.5 5.0 3.4 7.0 2.7Manufacturing-Related/Labourers 19.1 8.2 5.9 7.0 3.1 5.4 6.9 4.7 6.6 2.4Teachers 15.0 4.0 2.5 1.1 1.5 1.5 1.3 2.9 5.0 4.2Clerical 36.7 0.4 1.1 0.0 2.7 3.8 4.6 2.8 6.5 2.5Sales and Service 67.6 4.0 4.7 3.0 3.5 5.2 5.5 3.5 7.9 2.6
TABLE 11: OCCUPATIONS IN PERCEIVED SHORTAGE AND SURPLUS - SASKATCHEWANAverage Hourly Wage Growth (%)
Source: Statistics Canada, WANTED Analytics; Calculations by TD Economics .
Unemployment Rate (%) Vacancy Rate (%)
Employment (000s)2012 2009 2012 2013YTD 2009 2012 2013 YTD 03-07 08-09 10-13 YTD
Occupations in Perceived Shortage 700.1 2.6 0.7 0.6 2.6 5.6 5.4 5.4 5.3 3.0Science, Engineering & IT 144.2 1.7 0.8 0.0 3.5 7.4 6.3 4.1 5.7 2.8Trades 250.5 4.9 1.4 1.0 2.7 7.3 7.5 4.6 5.8 3.1Health 157.6 0.1 0.2 0.3 2.0 3.1 3.0 6.7 4.5 2.8Other 147.8 2.4 0.1 1.0 2.2 3.5 3.4 6.4 4.7 3.3Occupations in Perceived Surplus 547.9 5.6 3.1 4.2 2.6 5.9 5.7 4.7 4.4 2.1Manufacturing-Related/Labourers 90.5 12.2 6.2 8.2 2.6 6.4 6.3 4.9 4.4 1.6Teachers 42.9 1.5 1.8 0.0 0.9 1.4 1.2 3.1 4.3 3.0Clerical 148.9 2.2 1.3 2.1 2.7 4.7 4.7 3.6 5.0 2.8Sales and Service 265.6 6.0 3.3 4.7 2.8 7.1 6.7 5.6 4.0 1.8
TABLE 10: OCCUPATIONS IN PERCEIVED SHORTAGE AND SURPLUS - ALBERTAAverage Hourly Wage Growth (%)
Source: Statistics Canada, WANTED Analytics; Calculations by TD Economics .
Unemployment Rate (%) Vacancy Rate (%)
Employment (000s)2012 2009 2012 2013YTD 2009 2012 2013 YTD 03-07 08-09 10-13 YTD
Occupations in Perceived Shortage 165.5 0.9 0.5 0.6 1.7 2.6 2.7 4.9 4.3 2.2Science, Engineering & IT 27.9 0.2 0.1 0.5 2.7 3.8 3.7 5.5 1.8 2.7Trades 52.8 1.7 1.3 1.6 2.0 4.0 4.1 3.2 4.6 2.3Health 59.5 0.8 0.2 0.0 1.0 1.1 1.2 4.9 4.0 2.0Other 25.3 0.4 0.0 0.0 1.7 2.2 2.4 7.4 6.7 2.1Occupations in Perceived Surplus 182.1 4.2 3.4 3.4 1.6 2.0 2.2 3.1 4.5 2.4Manufacturing-Related/Labourers 37.1 6.9 4.6 5.5 1.4 1.8 2.2 3.1 5.6 1.3Teachers 16.5 2.3 2.6 0.9 0.6 0.7 0.7 3.4 2.9 2.7Clerical 47.0 2.4 1.6 2.1 1.8 2.4 2.6 2.2 2.7 2.5Sales and Service 81.5 4.4 4.0 3.7 1.8 2.2 2.3 3.5 5.3 2.7
TABLE 12: OCCUPATIONS IN PERCEIVED SHORTAGE AND SURPLUS - MANITOBAAverage Hourly Wage Growth (%)
Source: Statistics Canada, WANTED Analytics; Calculations by TD Economics .
Unemployment Rate (%) Vacancy Rate (%)

TD Economics | www.td.com/economics
46October 22, 2013
Employment (000s)2012 2009 2012 2013YTD 2009 2012 2013 YTD 03-07 08-09 10-13 YTD
Occupations in Perceived Shortage 1887.0 4.1 2.3 2.5 3.2 3.8 3.8 2.8 2.5 1.5Science, Engineering & IT 496.8 3.9 2.6 2.1 4.9 5.3 4.9 2.2 2.6 1.4Trades 479.6 8.9 4.2 4.8 2.8 4.9 5.1 2.3 2.1 1.3Health 522.7 1.0 0.7 1.0 2.3 2.5 2.5 3.7 3.2 1.4Other 387.9 2.7 1.8 2.0 2.6 2.4 2.7 3.0 2.1 2.3Occupations in Perceived Surplus 1910.1 8.4 5.9 6.4 2.3 3.1 2.9 2.4 3.3 2.2Manufacturing-Related/Labourers 391.9 16.7 8.8 10.8 1.8 3.4 3.7 2.3 1.7 1.8Teachers 206.7 3.2 3.1 2.3 1.2 1.1 1.0 3.7 3.4 3.5Clerical 461.1 5.0 4.6 4.2 3.0 3.2 3.0 2.6 2.4 1.6Sales and Service 850.4 7.7 5.9 6.5 2.4 3.4 3.0 2.0 4.3 2.3
TABLE 13: OCCUPATIONS IN PERCEIVED SHORTAGE AND SURPLUS - ONTARIOAverage Hourly Wage Growth (%)
Source: Statistics Canada, WANTED Analytics; Calculations by TD Economics .
Unemployment Rate (%) Vacancy Rate (%)
Employment (000s)2012 2009 2012 2013YTD 2009 2012 2013 YTD 03-07 08-09 10-13 YTD
Occupations in Perceived Shortage 1102.2 3.8 1.7 2.8 2.1 2.6 2.9 2.5 2.8 1.7Science, Engineering & IT 292.0 2.9 1.1 1.6 3.2 4.0 4.3 2.2 1.9 2.0Trades 314.2 8.9 3.6 6.7 1.4 2.1 2.6 3.1 2.6 2.3Health 329.5 1.0 0.8 0.8 1.8 1.8 2.0 2.2 4.1 0.6Other 166.5 1.0 1.1 1.5 2.2 2.9 2.9 2.7 2.1 2.3Occupations in Perceived Surplus 1128.6 7.0 5.9 5.9 1.9 2.6 2.9 1.9 3.9 1.8Manufacturing-Related/Labourers 232.7 11.2 8.7 10.0 1.2 2.0 2.5 2.4 2.8 1.8Teachers 117.1 3.8 4.1 2.0 0.4 0.5 0.5 0.8 4.4 1.2Clerical 253.8 3.3 3.4 3.5 2.5 3.4 4.2 2.8 2.6 1.4Sales and Service 525.0 7.6 6.2 6.2 2.2 2.8 3.0 1.5 4.9 2.1
TABLE 14: OCCUPATIONS IN PERCEIVED SHORTAGE AND SURPLUS - QUÉBECAverage Hourly Wage Growth (%)
Source: Statistics Canada, WANTED Analytics; Calculations by TD Economics .
Unemployment Rate (%) Vacancy Rate (%)
Employment (000s)2012 2009 2012 2013YTD 2009 2012 2013 YTD 03-07 08-09 10-13 YTD
Occupations in Perceived Shortage 316.9 6.0 3.6 4.8 1.9 2.3 2.5 3.6 4.2 2.6Science, Engineering & IT 58.1 2.2 1.8 2.5 2.7 3.4 3.9 2.4 4.5 3.1Trades 94.1 16.2 9.2 13.7 1.8 3.2 3.4 3.7 3.7 3.1Health 117.5 1.1 1.2 0.5 1.7 1.4 1.4 4.0 3.9 2.5Other 47.2 2.3 0.3 0.2 1.6 1.7 1.8 3.7 5.7 1.4Occupations in Perceived Surplus 322.4 10.1 8.4 8.6 2.0 2.1 2.1 3.0 4.5 3.3Manufacturing-Related/Labourers 55.6 22.9 20.0 21.6 1.8 1.8 2.3 3.2 2.1 3.1Teachers 32.2 5.3 4.3 3.2 0.6 0.5 0.4 2.1 3.8 2.6Clerical 75.0 3.8 3.6 3.0 1.9 1.7 1.9 2.8 3.9 2.7Sales and Service 159.6 9.6 7.5 7.8 2.5 2.6 2.5 3.2 5.8 3.9
TABLE 15: OCCUPATIONS IN PERCEIVED SHORTAGE AND SURPLUS - ATLANTIC PROVINCESAverage Hourly Wage Growth (%)
Source: Statistics Canada, WANTED Analytics; Calculations by TD Economics .
Unemployment Rate (%) Vacancy Rate (%)

TD Economics | www.td.com/economics
47October 22, 2013
APPENDIX 3 – LABOUR DEMAND: SURPLUSES AND DEFICITS, NOW AND IN THE FUTURE
Employment and Social Development Canada (ESDC) produces a 10-year labour market projection for Canada which attempts to quantify and comment on future trends in labour supply and labour demand. The collection of national models is known as the Canadian Occupational Projection System (COPS).
COPS projects medium-term trends in the major com-ponents of labour demand (expansion demand and replace-ment demand) and labour supply (school leavers and new immigrants). With trends identified in both demand and supply, potential labour market imbalances can be identi-fied. A potential market shortage over the medium-term is declared if in a given occupation, the number of job openings is projected to significantly exceed the number of new job seekers. A market surplus would be the opposite scenario. The analysis pertains to non-student employment only be-cause the focus is on the permanent labour market and thus excludes young people who are employed while studying. The most recent projections were prepared in 2011 and per-tain to the 2011-2020 period.
To prepare the projections, assumptions are required sur-rounding the demographic and economic factors which will influence future labour demand and supply in Canada. Ex-amples of these factors include population growth, real GDP growth, labour force participation rates, deaths, retirements and the structure of industry and demand going forward. The macroeconomic scenario was developed in collabora-tion with the Conference Board of Canada and includes the following assumptions: • Annual growth in the population aged 15+ is projected
to average 1.0% over the 2011-2020 period, down from the 1.4% seen in the previous decade. This slowdown reflects a decline in the natural increase of the population (births minus deaths) due to low fertility rates and a rise in deaths due to population ageing.
• From 2011-2020, annual employment growth is slated to be roughly 1.1%, noticeably slower than the 1.4% observed over the previous decade.
• In the short- and medium-term, employment growth is projected to exceed labour force growth. As a consequence, the unemployment rate will be pushed down. However, over the longer term, employment growth will be constrained by slower growth in the labour force. Both forces will see the unemployment rate return
close to its pre-recession level.• The shift in the workforce age composition towards the
lower attachment group of those aged 65+ will result in a one percentage point decrease in the overall labour force participation rate by 2020.
• The real price of oil is projected to rise by 6.9% annually over the next ten years.ESDC notes that “in addition to assisting labour market
analysts and policymakers, the projections can be used in labour market information (LMI) products, such as Working in Canada, targeted at assisting Canadians in their education and career decisions.”
High-level overview of projections
According to COPS, replacement demand in Canada will account for 70% of job openings over the next decade. The largest portion of this demand stems from retirement (57%).These job openings due to replacement or expansion needs will be filled by new entrants into the labour market (i.e., school leavers and new immigrants), existing workers changing occupations and re-entrants.
The projections show a total of 6.5 million job openings (those due to economic growth plus those due to replace-ment needs) over the next 10 years. In fact, nearly 70% of the jobs created by economic expansion are expected to be in occupations requiring postsecondary education or in management roles. High-skilled and management occupa-tions accounted for 62.3% of non-student employment in 2010. Over the next ten years, just one-third of job openings
CHART 64: ANNUAL RETIREES AS A SHARE OFTOTAL CANADIAN POPULATION
0 .0%
0 .2%
0 .4%
0 .6%
0 .8%
1 .0%
1 .2%
1993 1996 1999 2002 2005 2008 2011 2014 2017 2020
Forecast
Source: Human Resources and Skills Development Canada (HRSDC) . Forecasts by HRSDC from the 2011 COPS Projections .
%
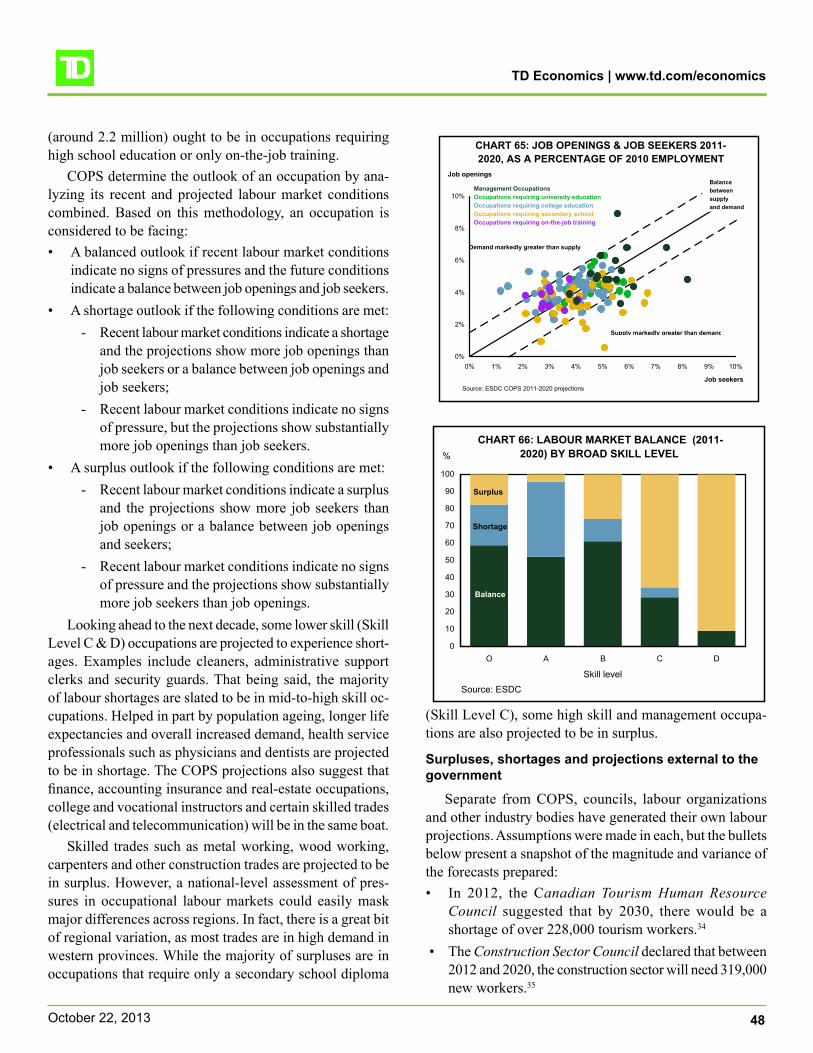
TD Economics | www.td.com/economics
48October 22, 2013
(around 2.2 million) ought to be in occupations requiring high school education or only on-the-job training.
COPS determine the outlook of an occupation by ana-lyzing its recent and projected labour market conditions combined. Based on this methodology, an occupation is considered to be facing:• A balanced outlook if recent labour market conditions
indicate no signs of pressures and the future conditions indicate a balance between job openings and job seekers.
• A shortage outlook if the following conditions are met: - Recent labour market conditions indicate a shortage
and the projections show more job openings than job seekers or a balance between job openings and job seekers;
- Recent labour market conditions indicate no signs of pressure, but the projections show substantially more job openings than job seekers.
• A surplus outlook if the following conditions are met: - Recent labour market conditions indicate a surplus
and the projections show more job seekers than job openings or a balance between job openings and seekers;
- Recent labour market conditions indicate no signs of pressure and the projections show substantially more job seekers than job openings.
Looking ahead to the next decade, some lower skill (Skill Level C & D) occupations are projected to experience short-ages. Examples include cleaners, administrative support clerks and security guards. That being said, the majority of labour shortages are slated to be in mid-to-high skill oc-cupations. Helped in part by population ageing, longer life expectancies and overall increased demand, health service professionals such as physicians and dentists are projected to be in shortage. The COPS projections also suggest that finance, accounting insurance and real-estate occupations, college and vocational instructors and certain skilled trades (electrical and telecommunication) will be in the same boat.
Skilled trades such as metal working, wood working, carpenters and other construction trades are projected to be in surplus. However, a national-level assessment of pres-sures in occupational labour markets could easily mask major differences across regions. In fact, there is a great bit of regional variation, as most trades are in high demand in western provinces. While the majority of surpluses are in occupations that require only a secondary school diploma
(Skill Level C), some high skill and management occupa-tions are also projected to be in surplus.
Surpluses, shortages and projections external to the government
Separate from COPS, councils, labour organizations and other industry bodies have generated their own labour projections. Assumptions were made in each, but the bullets below present a snapshot of the magnitude and variance of the forecasts prepared:• In 2012, the Canadian Tourism Human Resource
Council suggested that by 2030, there would be a shortage of over 228,000 tourism workers.34
• The Construction Sector Council declared that between 2012 and 2020, the construction sector will need 319,000 new workers.35
CHART 66: LABOUR MARKET BALANCE (2011-2020) BY BROAD SKILL LEVEL
0
10
20
30
40
50
60
70
80
90
100
O A B C D
Skill level
%
Source: ESDC
Surplus
Shortage
Balance
CHART 65: JOB OPENINGS & JOB SEEKERS 2011-2020, AS A PERCENTAGE OF 2010 EMPLOYMENT
0%
2%
4%
6%
8%
10%
0% 1% 2% 3% 4% 5% 6% 7% 8% 9% 10%
Job seekers
Demand markedly greater than supply
Supply markedly greater than demand
Management OccupationsOccupations requiring university educationOccupations requiring college educationOccupations requiring secondary school Occupations requiring on-the-job training
Source: ESDC COPS 2011-2020 projections
Balancebetweensupplyand demand
Job openings
TD Economics | www.td.com/economics
49October 22, 2013
• Engineers Canada projects that 95,000 professional engineers will retire by 2020 and Canada will face a skills shortage because the workforce cannot be replaced fast enough.Error! Bookmark not defined. Moreover, many of the current engineering labour markets are characterized by a surplus of recent graduates with little or no experience. Yet, there is a shortage of people with five to ten years of experience.35
• The Mining Industry Human Resources Council forecasts that more than 100,000 workers, mostly skilled new hires, will be required to sustain “modest growth” over the next decade. The industry anticipates that it will need to hire 3,990 STEM (Science, Technology, Engineering and Mathematics) professionals by 2021, of which, 1,370 would be geologists, geochemists and geophysicists and 665 would be mining engineers.36
• The Environmental Careers Organization of Canada says that with 100,000 employees reaching retirement in the next decade, numerous opportunities are opening up for students and new graduates in the sector.35 One-third of all environmental workers today are over the age of 45. About 4% of environmental workers are already beyond retirement age. At the time of publication, the group predicted that there would be 40,000 new environmental jobs in Canada. Some 14% of environmental workers will reach retirement age in the next 10 years, creating 100,000 vacancies.35
• The Conference Board of Canada predicts that by 2020, the gap between the supply and demand of truck drivers will be 25,000 to 33,000.35
• The Canadian Association of Petroleum Producers notes that the sector will need 9,500 new employees by 2015 and between 50,000 and 130,000 by 2020.35
• The Information and Communications Technology (ICT) Council declares that by 2016, Canadian employers will need to hire 106,000 workers, or over 17,000 per year. This will pose a “significant recruitment challenge.”35
• The Canadian Restaurant and Foodservices Association states that over 30% of restaurants in Canada report that a shortage of skilled labour is having a negative effect on their business.35
• The Canadian Electricity Association reports that the sector will have to recruit over 45,000 new workers—almost 48% of the current workforce—by 2016. This is almost half of the starting workforce and more than twice the number recruited in the last five years.35
• The Canadian Agricultural Human Resource Council reports that there is a 10% deficit of farm workers at present.35
• The Canadian Supply Chain Sector Council forecasts that Canada will face a shortage of 357,000 workers in the supply chain sector – at least 50,000 job openings in supply chain in Alberta alone – between now and 2020.35
Inherent limitations of projections
Like any good economic model, assumptions are re-quired to make projections. In some cases, simplifying assumptions are often too strict and do not adequately resemble reality. Unexpected shifts in exogenous variables (e.g., mobility assumptions) will have significant impacts that are not quantified by the model. As we point out in the report, changes in some of the assumptions can completely change the shortage and surplus classifications.
Digging a bit deeper, COPS projections assume a static distribution of skills within the immigrant labour force. Changes in immigration policy made to addresses supply mismatch will not be reflected. This may be a limitation, as it can overstate the size of surpluses/balance/shortage in certain occupations where immigration plays a more sig-nificant role. That said, occupational distribution of recent immigrants has been quite stable in recent years.
The COPS methodology and that of most projection models does not account for emerging occupations. It is true that new occupations have and will emerge (e.g., social me-dia and environmental-based occupations such as YouTube broadcasting professionals, Twitter and Facebook marketing professionals). However, in some cases, the “new” posi-tion has been retooled. This has two implications. First, the demand for these professionals can be met by the existing workforce with little retraining. Second, the net impact on demand may be overstated, as existing positions are rebranded and given a slightly different function.
COPS projections are also aggregated at the 3 digit NOC code. As a consequence, there still may be variability for market demand within an occupation. This is important to keep in mind when interpreting results. However, COPS has noted that the next production will provide projections at more detailed NOC aggregation than the 3-digit NOC groupings.
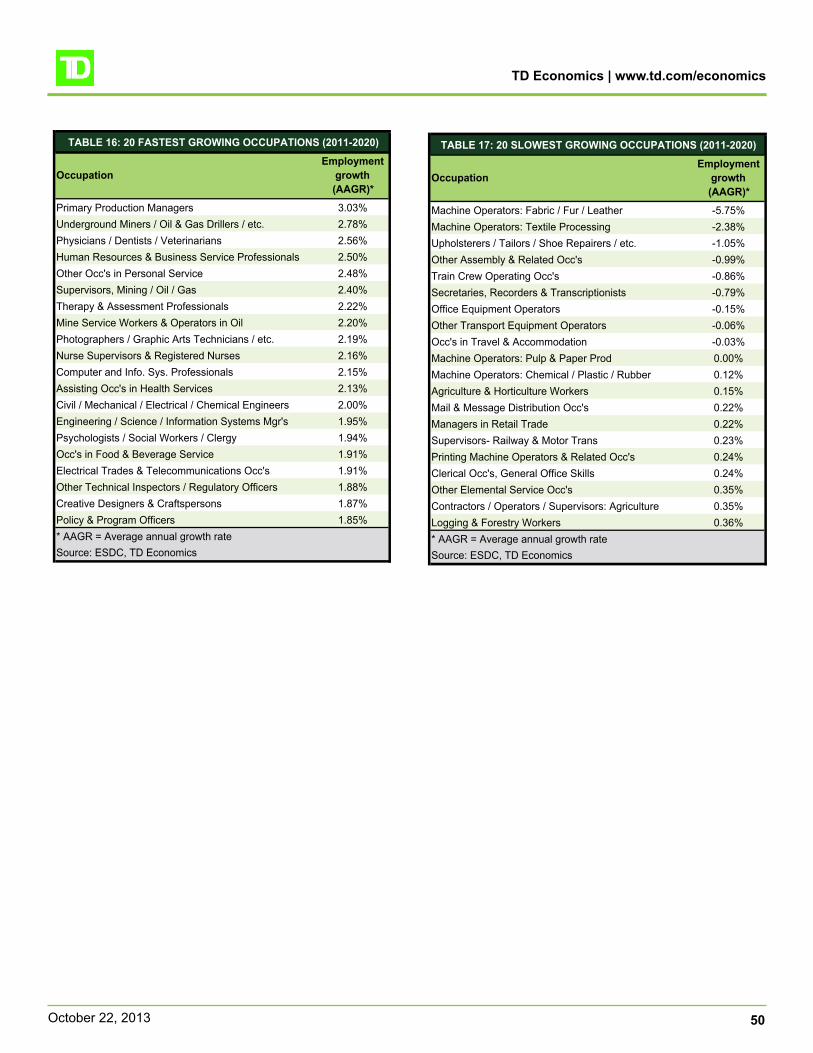
TD Economics | www.td.com/economics
50October 22, 2013
Primary Production Managers 3 .03%Underground Miners / Oil & Gas Drillers / etc . 2 .78%Physicians / Dentists / Veterinarians 2 .56%Human Resources & Business Service Professionals 2 .50%Other Occ's in Personal Service 2 .48%Supervisors, Mining / Oil / Gas 2 .40%Therapy & Assessment Professionals 2 .22%Mine Service Workers & Operators in Oil 2 .20%Photographers / Graphic Arts Technicians / etc . 2 .19%Nurse Supervisors & Registered Nurses 2 .16%Computer and Info . Sys . Professionals 2 .15%Assisting Occ's in Health Services 2 .13%Civil / Mechanical / Electrical / Chemical Engineers 2 .00%Engineering / Science / Information Systems Mgr's 1 .95%Psychologists / Social Workers / Clergy 1 .94%Occ's in Food & Beverage Service 1 .91%Electrical Trades & Telecommunications Occ's 1 .91%Other Technical Inspectors / Regulatory Officers 1 .88%Creative Designers & Craftspersons 1 .87%Policy & Program Officers 1 .85%* AAGR = Average annual growth rateSource: ESDC, TD Economics
TABLE 16: 20 FASTEST GROWING OCCUPATIONS (2011-2020)
OccupationEmployment
growth(AAGR)*
Machine Operators: Fabric / Fur / Leather -5 .75%Machine Operators: Textile Processing -2 .38%Upholsterers / Tailors / Shoe Repairers / etc . -1 .05%Other Assembly & Related Occ's -0 .99%Train Crew Operating Occ's -0 .86%Secretaries, Recorders & Transcriptionists -0 .79%Office Equipment Operators -0 .15%Other Transport Equipment Operators -0 .06%Occ's in Travel & Accommodation -0 .03%Machine Operators: Pulp & Paper Prod 0 .00%Machine Operators: Chemical / Plastic / Rubber 0 .12%Agriculture & Horticulture Workers 0 .15%Mail & Message Distribution Occ's 0 .22%Managers in Retail Trade 0 .22%Supervisors- Railway & Motor Trans 0 .23%Printing Machine Operators & Related Occ's 0 .24%Clerical Occ's, General Office Skills 0 .24%Other Elemental Service Occ's 0 .35%Contractors / Operators / Supervisors: Agriculture 0 .35%Logging & Forestry Workers 0 .36%* AAGR = Average annual growth rateSource: ESDC, TD Economics
TABLE 17: 20 SLOWEST GROWING OCCUPATIONS (2011-2020)
OccupationEmployment
growth(AAGR)*
TD Economics | www.td.com/economics
51October 22, 2013
REFERENCES AND END NOTES
1. Caranci, Beata and Jones, Chris (2011) “Caught in the Middle: The Polarization of Skills in the U.S. Labor Market” TD Economics, Special Report, April 19, 2011. < http://www.td.com/document/PDF/economics/special/td-economics-special-cj0411_polarization.pdf >
2. Burleton, Derek (2013) “Are Medium-Skilled Jobs In Canada Experiencing A Hollowing Out, U.S.-Style?” TD Economics, Special Report, Febru-ary 26, 2013. < http://www.td.com/document/PDF/economics/special/AreMediumSkilledJobsInCanadaExperiencingAHollowingOut.pdf >
3. Galarneau, Diane (2010) “Temporary Employment in the Downturn”, Perspectives on Labour and Income, Statistics Canada, November 2010, Volume 11, Number 11, Catalogue Number: 75-001-X.
4. Thorpe, Karla; Martin, Heidi; and Lamontagne, Elyse (2012) “Benefits Benchmarking 2012”, The Conference Board of Canada, October 2012.
5. Stewart, Nicole (2012) “Compensation Planning Outlook 2013”, The Conference Board of Canada, October 2012.
6. Galarneau, Diane (2005) “Earnings of Temporary versus Permanent Employees”, Perspectives on Labour and Income, Statistics Canada, January 2005, Volume 6, Number 1, Catalogue Number: 75-001-XIE.
7. Gordon, Stephen (2013) “The Canadian Manufacturing Sector, 2002-2008: Why is it Called Dutch Disease?”, University of Calgary, School of Public Policy, SPP Research Papers, < http://policyschool.ucalgary.ca/sites/default/files/research/s-gordon-dutch-disease.pdf >
8. “Participation and Activity Limitation Survey 2006: Labour Force Experience of People with Disabilities in Canada” Catalogue no. 89-628-X, ISBN 978-1-100-10258-0, Social and Aboriginal Statistics Division, < http://www.statcan.gc.ca/pub/89-628-x/89-628-x2008007-eng.htm >
9. Abel, Jaison R. and Deitz, Richard (2013) “Do Big Cities Help College Graduates Find Better Jobs?”, Federal Reserve Bank of New York, May 20, 2013 < http://libertystreeteconomics.newyorkfed.org/2013/05/do-big-cities-help-college-graduates-find-better-jobs.html >
10. “2011 Survey Highlights, Employment Outcomes of 2009 Graduates of Ontario University Undergraduate Programs,” Council of Ontario Universi-ties, November 2012.
11. Adamuti-Trache, Maria; Hawkey, Collen; Schuetze, Hans G.; and Glickman, Victor (2006) “The Labour Market Value of Liberal Arts and Applied Education Programs; Evidence from British Columbia”, Canadian Journal of Higher Education, Volume 36, No. 2, 2006, pp.49-74.
12. Gehlhaus, Diana (2007) “What Can I do with my Liberal Arts Degree?” Bureau of Labor Statistics, Occupational Outlook Quarterly, Winter 2007-08.
13. Koc, Edwin W. (2010) “NACE Research: The Liberal Arts Graduate and the College Hiring Market”, National Association of Colleges and Employ-ers, NACE November 2010.
14. Institute for Education Sciences, Ten Years after College: Employment Experiences of 1992-93 Bachelor Degree Recipients with Academic and Career-Oriented Majors, Washington: National Center for Education Statistics, February 2008.
15. Stuckey, James and Munro, Daniel (2013) “The Need to Make Skills Work: The Cost of Ontario’s Skills Gap”, The Conference Board of Canada. < http://www.conferenceboard.ca/e-library/abstract.aspx?did=5563 >
16. “Wanted: Skilled Workers to Fill the Upcoming Labour Shortage,” Performance and Potential 2000-2001, Conference Board of Canada.
17. Miner, Rick (2012) “People Without Jobs, Jobs Without People: Ontario’s Labour Market Future”, February 2010, Miner Management Consulting, < http://www.minerandminer.ca/ >
18. Usher, Alex (2013) “Revisiting the Looming Labour Shortage Theory”, Higher Education Strategy Associates, May 14, 2013. < http://highered-strategy.com/revisiting-the-looming-labour-shortage-theory/ >
19. Turcotte, Martin (2010) “Working at home: An Update,” Canadian Social Trends, Component of Statistics Canada Catalogue no. 11-008-X, < http://www.statcan.gc.ca/pub/11-008-x/11-008-x2011001-eng.htm >
20. Jermyn, Diane (2012) “Telecommuting, Flexible Time Trump Traditional 9 to 5”, Globe and Mail, October 2012, C5
21. “Reshaping the Workplace”, Pricewaterhouse Coopers < http://www.pwc.com/gx/en/managing-tomorrows-people/future-of-work/index.jhtml >

TD Economics | www.td.com/economics
52October 22, 2013
22. Bloom, Michael (2009) “Learning and Development: The Skills-Training Disconnect”, The Conference Board of Canada, < http://www.conference-board.ca/insideedge/2009/august-2009/aug17-vp-corner.aspx >
23. Hoeckel, Kathrin (2008) “Costs and Benefits in Vocational Education and Training”, OECD, EDU/EDPC/CERI(2008)3
24. “Skills Development and Training in SMEs” OECD, Local Economic and Employment Development (LEED), ISBN 978-92-64-16942-5, < http://dx.doi.org/10.1787/9789264169425-en >
25. “Expression of Interest – Transforming Canada’s Economic Immigration Programs”, Citizenship and Immigration Canada, < http://www.cic.gc.ca/english/resources/enewsletter/2012/12/interest.asp >
26. “Preliminary Tables – Permanent and Temporary Residents, 2012”, Citizenship and Immigration Canada, < http://www.cic.gc.ca/english/resources/statistics/facts2012-preliminary/03.asp >
27. More details on the changes made can be found here: http://news.gc.ca/web/article-eng.do?nid=736729
28. Wingrove, Josh (2013) “Temporary Foreign Worker Program under Review Again; Provinces Complain of Unenforceable Labour Laws because of Missing Information”, Globe and Mail, September 13, 2013.
29. “Giving New Teachers the Tools for Success: Ontario Enhancing Teacher Education, Supporting Greater Student Achievement” Ontario Ministry of Education, June 5, 2013 < http://news.ontario.ca/edu/en/2013/06/giving-new-teachers-the-tools-for-success.html >
30. “Ontario Boosts Medical School Spaces Across Province: McGuinty Government Training More Doctors, Building A Healthier Ontario”, Ministry of Training, Colleges and Universities, May 21, 2009 < http://news.ontario.ca/tcu/en/2009/05/ontario-boosts-medical-school-spaces-across-province.html >
31. “OECD’s Programme for International Student Assessment (PISA)” < http://www.oecd.org/pisa/ >
32. Brydon, Robbie and Dachis, Benjamin (2013) “Access Denied: The Effect of Apprenticeship Restrictions in Skilled Trades”, C.D. Howe Institute < http://www.cdhowe.org/pdf/Commentary_380.pdf >
33. The website can be found here: http://www.jobbank.gc.ca/intro-eng.aspx
34. The Canadian Tourism Research Institute, The Conference Board of Canada (2012) “The Future of Canada’s Tourism Sector: Shortages to Resurface as Labour Markets Tighten” March 2012 < http://hnl.ca/wp-content/uploads/2011/02/The-Future-of-Canadas-Tourism-Sector-2012-update-_EN.pdf >
35. Department of Finance Canada (2013) “Budget Plan: Jobs, Growth and Long-term Prosperity - Economic Action Plan 2013” March 21, 2013. http://www.budget.gc.ca/2013/doc/plan/budget2013-eng.pdf
36. Standing Committee on Human Resources, Skills and Social Development and the Status of Persons with Disabilities (2012) “Labour and Skills Shortages in Canada: Addressing Current and Future Challenges” House of Commons, December 12, 2012. <http://publications.gc.ca/collections/collection_2012/parl/XC67-1-1-411-09-eng.pdf>
This report is provided by TD Economics . It is for informational and educational purposes only as of the date of writing, and may not be appropriate for other purposes . The views and opinions expressed may change at any time based on market or other conditions and may not come to pass . This material is not intended to be relied upon as investment advice or recommendations, does not constitute a solicitation to buy or sell securities and should not be considered specific legal, investment or tax advice. The report does not provide material information about the business and affairs of TD Bank Group and the members of TD Economics are not spokespersons for TD Bank Group with respect to its business and affairs . The information contained in this report has been drawn from sources believed to be reliable, but is not guaranteed to be accurate or complete . This report contains economic analysis and views, including about future economic and financial markets performance. These are based on certain assumptions and other factors, and are subject to inherent risks and uncertainties. The actual outcome may be materially different. The Toronto-Dominion Bank and its affiliates and related entities that comprise the TD Bank Group are not liable for any errors or omissions in the information, analysis or views contained in this report, or for any loss or damage suffered .