jobs series issue no. 28 - open knowledge repository
TRANSCRIPT

JOBS SERIES
Issue No. 28
Her nan W ink ler and Mir iam Mon t enegr o
DIAGNOSTICDOMINICAN
REPUBLIC
Pub
lic D
iscl
osur
e A
utho
rized
Pub
lic D
iscl
osur
e A
utho
rized
Pub
lic D
iscl
osur
e A
utho
rized
Pub
lic D
iscl
osur
e A
utho
rized


Her nan W ink ler and Mir iam Mon t enegr o
DIAGNOSTICDOMINICAN
REPUBLIC

© 2021 International Bank for Reconstruction and Development / The World Bank.
1818 H Street NW, Washington, DC 20433, USA. Telephone: 202–473–1000; Internet: www.worldbank.org.
Some rights reserved
This work is a product of the staff of The World Bank with external contributions. The findings, interpretations, and conclusions expressed in this work do not necessarily reflect the views of The World Bank, its Board of Executive Directors, or the governments they represent.
The World Bank does not guarantee the accuracy of the data included in this work. The boundaries, colors, denominations, and other information shown on any map in this work do not imply any judgment on the part of The World Bank concerning the legal status of any territory or the endorsement or acceptance of such boundaries.
Rights and Permissions
This work is available under the Creative Commons Attribution 3.0 IGO license (CC BY 3.0 IGO) http://creativecommons.org/licenses/by/3.0/igo. Under the Creative Commons Attribution license, you are free to copy, distribute, transmit, and adapt this work, including for commercial purposes, under the following conditions:
Attribution —Please cite the work as follows: Winkler, H. and M. Montenegro. 2021. “Dominican Republic Jobs Diagnostic.” World Bank, Washington, DC. World Bank, Washington, DC. License: Creative Commons Attribution CC BY 3.0 IGO.
Translations — If you create a translation of this work, please add the following disclaimer along with the attribution: This translation was not created by The World Bank and should not be considered an official World Bank translation. The World Bank shall not be liable for any content or error in this translation.
Adaptations — If you create an adaptation of this work, please add the following disclaimer along with the attribution: This is an adaptation of an original work by The World Bank. Views and opinions expressed in the adaptation are the sole responsibility of the author or authors of the adaptation and are not endorsed by The World Bank.
Third‑party content — The World Bank does not necessarily own each component of the content contained within the work. The World Bank therefore does not warrant that the use of any third‑party‑owned individual component or part contained in the work will not infringe on the rights of those third parties. The risk of claims resulting from such infringement rests solely with you. If you wish to re‑use a component of the work, it is your responsibility to determine whether permission is needed for that re‑use and to obtain permission from the copyright owner. Examples of components can include, but are not limited to, tables, figures, or images.
All queries on rights and licenses should be addressed to World Bank Publications, The World Bank Group, 1818 H Street NW, Washington, DC 20433, USA; fax: 202–522–2625; e‑mail: [email protected].

v
ACKNOWLEDGMENTS
This report was prepared by a team led by Hernan Winkler and Miriam Montenegro, and comprising Maho Hatayama, Ulrich Lachler, Faruk Liriano, Janet Porras and Maria Concepcion Steta.
The report was carried out under the guidance of Tahseen Sayed, Pablo Gottret, Ian Walker, and the support of Alessandro Legrottaglie. The team received valuable advice from the peer reviewers Javier Baez, Johannes Herderschee, Aylin Isik‑Dikmelik and Juan Carlos Parra Osorio.
The team benefited from consultations and inputs from authorities of the former administration, including the Vice President of the Dominican Republic, your excellency Margarita Cedeño de Fernandez and her team. The team would like to express its thanks to the Banco Central De La República Dominicana, the Direccion General de Impuestos Internos (DGII) and the Oficina Nacional de Estadistica (ONE) for their advice and for providing the team with data that were key for the analyses implemented in this report. In particular, the team acknowledges the support received from Sara Sanchis and Pamela Ogando, in sharing the microdata from DGII and TSS to carry out the analysis of labor demand. The team benefited from productive consultations with and input from officials in the Ministerio de Economía, Planificación y Desarrollo (MEPyD), particularly Alexis Cruz Rodriguez, Evalina Gomez and Camila Hernandez; the Instituto Dominicano de Seguros Sociales (IDSS); the Superintendencia de Pensiones (SIPEN); the Tesoreria de Seguridad Social (TSS); Ministerio de Industria, Comercio y Mipymes; Ministerio de Trabajo (MT); Asociación Nacional de Hoteles y Restaurantes (ASONAHORES); Consejo Nacional de Zonas Francas de Exportación (CNZFE); Consejo Nacional de Competitividad (CNC); Instituto Tecnológico de las Américas (ITLA); Confederación Patronal de la República Dominicana (COPARDOM); Instituto Nacional de Formacion Tecnico Profesional (INFOTEP); Progresando con Solidaridad (PROSOLI); Ministerio de Educacion Superior, Ciencia y Tecnologia (MESCYT); Republica Digital; Consejo Nacional de la Empresa Privada (CONEP).


vii
CONTENTS
ACKNOWLEDGMENTS v
ABBREVIATIONS ix
EXECUTIVE SUMMARY 1
PREFATORY NOTE ON COVID‑19 1
DETERIORATING JOB QUALITY IN THE DOMINICAN REPUBLIC 2
WHAT EXPLAINS THE WAGE‑PRODUCTIVITY DISCONNECT IN THE DOMINICAN REPUBLIC? 3
MAIN FINDINGS AND ASSOCIATED POLICY IMPLICATIONS 3
1. GROWTH, JOBS, AND PRODUCTIVITY 7
CONCLUDING REMARKS 14
2. LABOR SUPPLY 17
2.1 LABOR FORCE PARTICIPATION AND EMPLOYMENT 17
2.2 THE QUALITY OF JOBS 21
2.3 SKILLS 24
2.4 GENDER 32
2.5 MIGRATION 35
CONCLUSION 36
ANNEX A. ADDITIONAL TABLES 37
3. LABOR DEMAND 49
INTRODUCTION 49
3.1 DEMOGRAPHY OF FIRMS 49

3.2 FIRM DYNAMICS 51
3.3 PRODUCTIVITY 54
3.4 BUSINESS ENVIRONMENT 55
CONCLUSION 58
ANNEX B. ADDITIONAL TABLES 59
4. POLICY IMPLICATIONS 69
POLICY PRIORITIES FOR THE SHORT TERM: ADDRESSING THE IMPACTS OF COVID‑19 70
POLICIES FOR THE MEDIUM AND LONG TERM: IMPROVING HUMAN CAPITAL AND BUSINESS ENVIRONMENT 71
REFERENCES 75
ANNEX C 79
THE WAGE‑PRODUCTIVITY GAP IN THE DOMINICAN REPUBLIC: IS IT FOR REAL OR JUST FANTASY? 79
MAIN FINDINGS 80

ix
ABBREVIATIONS
AI Artificial Intelligence
ALMP Active Labor Market Program
CCT Conditional Cash Transfer
CES Constant Elasticity of Substitution
COFEMER Comisión Federal de Mejora Regulatoria
CPI Consumer Price Index
DGII Direccion General de Impuestos Internos
DHS Demographic Household Survey
ENCFT Encuesta Nacional Continua de Fuerza de Trabajo
ENFT Encuesta Nacional de la Fuerza de Trabajo
FASE Fondo de Asistencia Social al Empleado
GCI Global Competitiveness Index
GDP Gross Domestic Product
ICT Information and Communication Technology
IMF International Monetary Fund
INFOTEP Instituto Nacional de Formacion Tecnico Profesional
MIC Ministry of Industry and Commerce
MPL Marginal Product of Labor
NDP Net Domestic Product
ONE Oficina Nacional de Estadistica
OSS One‑stop‑shop
PIAAC Programme for the International Assessment of Adult Competencies
PISA Programme for International Student Assessment
PPI Producer Price Index
PROSOLI Progresando con Solidaridad
SEDLAC Socio‑Economic Database For Latin America And The Caribbean
SEZ Special Economic Zone
SME Small and Medium Enterprises
STEP Steps Toward Employability and Productivity
TFP Total Factor Productivity
TSS Tesoreria de la Seguridad Social
WDI World Development Indicators
WFH Working from Home


1
EXECUTIVE SUMMARY
By many measures, the Dominican Republic experienced a stellar economic performance since the early 2000s. In particular, its gross domestic product (GDP) per capita grew almost 90 percent between 2000 and 2018, catching up and then surpassing the average for the Latin America and the Caribbean region. This was accompanied by strong improvements in employment and poverty reduction: total employment as a share of the working age population grew by more than 6 percentage points, while the fraction of individuals living with less than US$3.2 per day fell from 12.9 to 2.6 percentage points, or roughly on a par with the poverty reduction experience in the rest of Latin America. These favorable developments also exhibited greater inclusiveness, as women’s labor force participation and employment rates increased by about 13 percentage points, narrowing the gap with men.
Upon closer inspection, however, progress has been slower than the aggregate indicators suggest. For example, even though labor productivity increased dramatically since the early 2000s, real wages have been stagnant. At the same time, the share of workers without social security rights remains stubbornly high, on par with other Latin American countries. In other words, while the Dominican Republic’s aggregate economic performance was one of the best in the region, it has not resulted in better jobs. The fact that economic growth did not fully translate into higher job quality may help explain why the country’s poverty indicators only declined at the same average pace as other countries in Latin America and the Caribbean, even though its per capita GDP grew almost twice as fast as the regional average.
This Jobs Diagnostic argues that the main labor market challenge facing the Dominican Republic is how to increase the quality of jobs in a sustained manner. Meeting this challenge is important both for achieving greater poverty reduction and shared prosperity in the medium term, as well as for rendering jobs less vulnerable to the risks posed by longer‑term automation and globalization trends. This report presents new findings on the main bottlenecks that are hindering the creation of better jobs in the Dominican Republic and outlines the elements of a jobs strategy that can help remove them.
PREFATORY NOTE ON COVID-19
While the bulk of this report was completed before the COVID‑19 crisis unfolded, most of its analytical insights remain relevant for the post‑crisis period. As in other countries, the early projections of the impact of the crisis on employment and poverty outcomes are worrisome (see Box E.1). In addition to the unprecedented demand shock, several aspects of this crisis, such as lockdowns and social distancing policies, also pose major challenges to the normal functioning of the labor market. This report does not seek to dwell on the COVID‑19 crisis. Rather, its main goal is to analyze various structural issues that impede a better functioning of the Dominican labor market, in the belief that these issues are likely to remain important even after the crisis has passed. Nevertheless, it bears mentioning that the crisis has drawn added attention to an important labor market feature that is emphasized in this report, namely the prevalence of ‘jobs of the future’ versus ‘jobs of the past’ (see Box 4). The experience in the Dominican Republic, as well as other countries, indicates that workers with jobs more amenable to working from home, and hence less vulnerable to job extinction by COVID‑19, tend to be more educated, urban, and richer and more likely to be engaged in ‘jobs of the future’. In contrast, those

2
with more physically intensive jobs and who do not use information and communication technologies—two hallmarks of ‘jobs of the past’—are more vulnerable to both infection risks and job extinction. In this context, we hope that the report’s analysis of barriers to the creation of better jobs in the Dominican Republic may also provide some useful insights to policy makers dealing with the COVID‑19 crisis.
BOX E.1. THE PROJECTED IMPACT OF THE COVID-19 CRISIS IN THE DOMINICAN REPUBLIC
According to World Bank estimates, the unmitigated impact of the COVID‑19 crisis on poverty in the Dominican Republic ranges between 15.0 and 19.5 percentage points, or between 1.5 and 2.0 million of people falling into poverty, depending on the duration of the suspension in economic activity. Using a 2012 input‑output table and the 2019 labor force survey (Encuesta Nacional Continua de Fuerza de Trabajo—ENCFT) to simulate demand shocks for tourism and construction in a scenario that closely replicates recent unemployment dynamics, the gains in poverty reduction in the last 10 years would be reversed. Impacts on employment would range from 1.0 to 1.5 million jobs lost, with unemployment increasing to 27–35 percent, from 6.2 percent pre‑COVID. The two main mitigation measures simulated—increase in the CCT transfer and coverage expansion and wage subsidies for formal employees—would be barely enough to avoid increases in poverty only in the most optimistic scenario. The ‘Stay Home’ cash transfer combined with the FASE (Fondo de Asistencia Social al Empleado) program are expected to reduce the size of poverty increases as a result of the crisis by 8 percentage points, equivalent to preventing about 800,000 people from falling into poverty.
Source: World Bank’s Development Policy Operation design (P174145), 2020.
DETERIORATING JOB QUALITY IN THE DOMINICAN REPUBLIC
Improving the quality of jobs is a more imperative challenge for the Dominican Republic than increasing the quantity of jobs. The Dominican economy has performed quite well in terms of the number of new jobs generated over the last two decades. During 2000–2018, annual employment growth of the working age population averaged 2.08 percent, or more than enough to absorb the country’s growing labor force, which expanded at 1.99 percent. Where the economy’s performance has been less successful is in regard to the generation of high‑quality jobs, as measured along the following dimensions: (a) the level and growth of labor remuneration; (b) sectoral affiliation (whether employment growth is taking place in the better‑capitalized, productive modern sector such as manufacturing or in a less productive, unskilled‑labor intensive sector such as traditional agriculture); (c) remuneration arrangements (whether a job is wage based rather than based on self‑employment or unpaid family arrangements); and (d) job formality (whether the job offers social security or unemployment insurance). In regard to the last two dimensions, it is notable that the share of wage‑based employment is the same today as it was in 1995, while the share of workers affiliated with the social security office has barely budged over the last decade, even though total GDP per capita more than doubled over the last 25 years.
Concerns about deteriorating job quality have also emerged from a sectoral perspective, as total employment is increasingly concentrated in the services sector, whose labor productivity is rapidly declining. The Dominican Republic is well advanced in the structural transition away from agriculture that characterizes most countries on the path of development. Unfortunately, a similar transition is also occurring in the industry sector, which is losing employment share. Since the agriculture and industry sectors are not adding any workers, all the additional employment is taking place in services, where productivity growth is rapidly decelerating. In mid‑1995, the services sector displayed a similar productivity of labor as the industry sector. Since then, productivity growth in the services sector has basically stagnated and now risks being overtaken by the agriculture sector, which traditionally is the least productive of the major sectors. Meanwhile, the industry sector has seen a tripling of its labor productivity since the mid‑1990s but has failed to expand employment. As

3
discussed later, this deterioration in job quality based on sector composition could either be reflecting market failures in the form of barriers to entry into the more productive sectors (industry) or the onset of capital‑biased technical change.
The most notable manifestation of declining average job quality in the Dominican Republic is the stagnation of real wage growth since 2000 and its apparent disconnect to labor productivity growth. While labor productivity growth has been strong over this period and represents the main impulse driving the country’s rapid GDP growth, wage growth has been comparatively weak. (Between 2000 and 2016, labor productivity grew at an average annual rate of 2.8 percent, while the median wage grew at only an average rate of 0.6 percent.) Identifying the causes of this wage‑productivity divergence is needed to explain the conundrum of rapid growth with limited poverty reduction that has characterized the Dominican economy over the last two decades. An understanding of these causes is also critical for identifying corrective measures to improve job quality by removing the barriers to faster wage growth.
WHAT EXPLAINS THE WAGE-PRODUCTIVITY DISCONNECT IN THE DOMINICAN REPUBLIC?
The Dominican Republic is not alone in experiencing a wage‑productivity disconnect, which has also been observed in many other countries. This observed disconnect does not mean that both variables are delinked, however, as most studies show that real wage growth and productivity growth are significantly correlated, just not necessarily in a one‑to‑one manner. This suggests that the wage‑productivity gap is not due to a structural failure that prevents productivity growth from translating into wage growth for the average worker. Rather, it is that other factors or bottlenecks are suppressing workers’ incomes, even as productivity growth acts to increase them.
This Jobs Diagnostic identifies five factors that have plausibly contributed to the suppression of real wage growth during the last two decades—two associated with the supply of labor and three affecting the demand for labor. On the supply side, the factors are a protracted increase in labor force participation rates and the existence of gender discrimination in connection with a growing labor market participation of women. On the labor demand side, the factors likely to have contributed to this divergence are the lagging adjustment of minimum wages, market concentration and anti‑competitive behavior in various economic sectors, and factor‑biased technological growth. While one of these wage‑suppressing factors (namely, rising labor for participation) represents a natural condition reflecting demographic or relative price incentives, the other four factors can be traced to market or policy failures that impair the functioning of the labor market, resulting in suboptimal outcomes. As noted below, measures to correct these market or policy failures would lead to better labor market outcomes while improving job quality.1
MAIN FINDINGS AND ASSOCIATED POLICY IMPLICATIONS
Building human capital
The quantity and quality of education is a crucial bottleneck to job creation. The Dominican Republic lags other countries by several measures in terms of educational achievement and learning. When comparing the expected years of education of the future labor force, the Dominican Republic has the lowest level among comparator countries. That level is about 88 percent that of Chile. When adjusting for the quality of education,
1 The Jobs Diagnostic also analyzed a number of additional supply‑ and demand‑side variables, but these were discarded as plausible explanations of the sluggish wage growth observed since 2000 because they either hardly changed during the period in question or because they changed in a manner that contradicts the hypothesized behavior on the basis of market‑oriented economic reasoning. These potential factors included lagging education attainment levels, rising market informality, declining unionization, increased immigration, expanding globalization, and rising non‑wage labor costs.

4
the gap becomes even larger. The learning‑adjusted expected years of education for the Dominican Republic represent 66 percent of the corresponding value for Chile.
These gaps in the quality of education start early in the life cycle. According to the Dominican Republic’s national standardized test, just 12 percent of children in third grade achieved satisfactory levels in Spanish and 27 percent in mathematics in 2017. Accordingly, when compared to other Latin American countries that participate in the Programme for International Student Assessment (PISA), the Dominican Republic has the lowest scores for reading and also for mathematics and science among 15‑year‑olds. Moreover, these levels worsened since 2015, as the average reading test scores for the Dominican Republic declined in 2018.
The lack of an adequate educational system in the Dominican Republic is also evident when analyzing the type of tasks that workers carry out at work. This report uses a methodology to rank occupations by their skill content and categorizes them by their amenability to being substitutes or complements with new technologies. For example, jobs intensive in non‑routine analytical and interpersonal skills are more likely to benefit from technology adoption. In contrast, those in routine occupations are more likely to lose, since those jobs are more likely to disappear with technological change. Jobs in the Dominican Republic are not intensive in the skills of the future, even when compared to other countries at the same level of development. In contrast, jobs in the Dominican Republic are disproportionately intensive in routine skills. Workers in those jobs may face higher risk of unemployment and declining wages with technological progress.
This divide between the skills of the past and the skills of the future reflects other inequities in the labor market. The more educated, in formal jobs, working in large private sector firms, the public sector, or in skilled services are more likely to hold the jobs that complement new technologies. These jobs are also associated with higher wages. In contrast, jobs in the informal sector, small firms, domestic service, or agriculture rank low in terms of their intensity in the skills of the future. In contrast, they are intensive in routine skills. In other words, the jobs that may face higher risk of displacement or lower earnings growth as technological change accelerates are already of lower quality to begin with.
Reducing gender gaps
A second challenge is the reduction of gender disparities to increase the inclusion of women in the labor market. Even though significant progress was achieved in terms of reducing the gap in employment and labor force participation rates across genders, several indicators suggest that gender inequities are still important. For example, while women represent 65 percent of college enrollment and 80 percent of those who graduate with honors, they continue to be overrepresented among those with poorer job outcomes. The gender gap in earnings is stubbornly rigid despite significant changes in the labor market’s gender balance.
While men have higher employment rates and work more hours weekly according to most statistics, the latter do not capture well the amount of unpaid work that relies on women. According to a time‑use survey conducted in 2016, women allocate more than 31 hours to unpaid work per week, while men allocate only 9.6 hours. When adding up the number of paid and unpaid working hours per week, women work 4 hours more than men, which is equivalent to about 8.6 percent of men’s working hours. One key factor associated with a large gender gap in unpaid work is having children in the household. That is, most of the time allocated to family care responsibilities relies on women. These patterns of gender‑biased unpaid work reflect views regarding not only the role of women in the household but also in the labor market. In countries where anti‑egalitarian views regarding gender roles are more common, women’s employment rates are lower and gender pay gaps are wider.
Teenage pregnancy in the Dominican Republic is one of the highest in the world and may contribute to poor human capital accumulation and labor market outcomes. In 2018, there were 93 births per 1,000 women ages 15 to 19 years in the Dominican Republic. This number is not only high in absolute terms but also when compared to countries at the same level of development. This figure has declined since 2000, but the gap with other countries in the region has not shrunk. More importantly, teenage pregnancy is highly linked

5
to exclusion and poverty in the Dominican Republic. More than one‑third of teenagers in the poorest quintile had children or was pregnant at the time of the survey. That fraction was 8.7 percent for the richest quintile. Teenage pregnancy is associated with a host of negative economic outcomes later in life, including lower levels of education and poorer labor market outcomes. This association between teenage pregnancy and poverty in the Dominican Republic may contribute to perpetuate the vicious cycle of poverty, lack of human capital, and poor labor market outcomes.
Improving the business environment and promoting greater product market competition
The analysis of labor demand indicates that the jobs landscape in the Dominican Republic is dominated by large and old firms, with a limited role for new firm entrants. Firm entry rates are among the lowest in the world. This represents a major obstacle for job creation, given that it is the younger firms that tend to experience higher productivity growth—a key ingredient to increase wages and the quality of jobs.
To encourage a more dynamic entry of formal sector firms, it is important to reduce the costs and procedures involved in starting a new business. In this regard, the Dominican Republic can learn from the positive experiences from other countries in the region, such as Mexico, which has successfully implemented a number of reforms to improve the efficiency of opening and expanding businesses by reducing the number of days required to register a business and the creation of one‑stop‑shops (OSSs) in the most populous cities.
In addition to reducing the costs of starting a business, a healthy business environment depends on the containment of the costs of operating a business. In this respect, recent Doing Business (World Bank 2019, 2020) reports indicate that the Dominican Republic ranks poorly in relation to comparator countries in (a) access to credit, (b) protecting of the rights of minority investors, and (c) access to electricity. Facilitating greater access to credit and electricity helps small and younger firms disproportionately, considering that these firms are more likely to be credit constrained and less able to afford private generating capacity. Reforms in corporate governance to improve the institutional framework, transparency, and accountability would also contribute to a better business environment, especially for start‑up firms.
The high concentration of output and employment in large and old firms in the Dominican Republic also suggests that these firms have considerable market power. This is reflected, among other things, in the strong perceptions of market dominance and uneven playing field as important issues affecting the business environment. The presence of oligopolistic or monopsonistic market structures typically results in less dynamic wage responses to productivity growth, which is consistent with what has been observed in the Dominican Republic. To address the influence of increasing industry concentration and the associated market power, it is necessary to ascertain the main underlying causes of growing market power. The textbook distinction in this context is between industry concentration propelled by natural monopolies, which call for a regulatory intervention, and industry concentration propelled by anti‑competitive behavior (for example, price fixing, market collusion, political lobbying), which calls for antitrust intervention meant to break up consortia to promote more competition.
In addition to setting up a regulatory oversight office and introducing antitrust legislation, the most effective antitrust tool available to the Dominican authorities may be to promote greater openness of the economy. The Dominican economy appears to have been closing up over the last two decades. Its trade ratio has declined from around 80 percent in the late 1990s to about 50 percent currently, which may have contributed to a loss of internal competition. Under those circumstances, trade liberalizing measures should rate high on the Dominican policy agenda, together with the implementation of the Dominican Republic’s pro‑competition law and the reduction of arbitrary tax exemptions, which are crucial sources of market distortions (World Bank 2018).
Strengthening the links between the exporting sector and domestic firms could also help in creating more and better jobs in the Dominican Republic. The presence of special tax regimes for exporters contributes to an uneven playing field and creates a bias favoring imports instead of encouraging the creation of backward links with domestic producers. World Bank (2016) provides several recommendations to eliminate these biases

6
and strengthen backward links. These include creating a database of suppliers, matchmaking events, and local clusters around the industrial parks, among others. Accordingly, reducing the regulatory divide between firms in Special Economic Zones (SEZs) and outside SEZs, as well as across sectors (for example, by simplifying the minimum wage structure), will be key aspects of leveling the playing field across all firms.
Adjusting minimum wages more efficiently
The proliferation and uneven adjustment of minimum wages inhibits labor market efficiency. The Dominican Republic has about a dozen different minimum wages that apply to different industries, regions, and firm types, and even though the average level of the minimum wage is quite modest (amounting to 30 percent of the value added per worker), it has a potentially significant impact on all wages, as firms and workers often rely on it as a reference point during wage negotiations. Between 2000 and 2016, most minimum wage regimes in the Dominican Republic have at best kept pace with consumer price inflation or else allowed for some erosion of the real minimum wage to take place. So, to the extent that these various minimum wage regimes provide guidance for wage negotiations, the tendency to allow minimum wages to erode in real terms over time has contributed to the sluggish behavior of real wage growth that is reflected in the wage‑productivity gap observed over that period. A measure that would enable a more agile and efficient adjustment of wages include reducing the number of different minimum wages that are currently in effect (as these seed confusion and encourage market segmentation).

7
1. GROWTH, JOBS, AND PRODUCTIVITY
This chapter examines recent trends in macroeconomic indicators in the Dominican Republic. It shows that the Dominican Republic experienced high rates of gross domestic product (GDP) and productivity growth since the early 2000s. This accompanied a process of poverty reduction which, to some extent, fell short of expectations given such high levels of economic growth. This disconnect seems linked to stagnant labor incomes. In fact, average real wages are at about the same level as in 2000. There has been little reallocation of workers from low to high productivity sectors, and most of the productivity growth took place within sectors. This lack of reallocation may suggest the existence of distortions in the labor market. The services sector continues to absorb most of the employment, even though its productivity growth is lower than that of manufacturing and agriculture. The chapter thus sets the stage for the rest of the report, which discusses the role of labor demand and labor supply in understanding the disconnect in the performance of macro and micro indicators in the Dominican Republic.
The Dominican Republic stands out over the last 30 years as one of the fastest‑growing economies in Latin America and the Caribbean, as well as worldwide. Even in the 1980s—the ‘lost decade’ for most developing countries in the Western Hemisphere—the Dominican Republic managed to come out on the positive side of the growth ledger (Figure 1). It was during the 1970s and 1980s that the Dominican Republic took major steps in transforming itself from primarily an exporter of agricultural commodities (sugar, coffee, and tobacco) into a more diversified economy with strong roots in manufacturing (through its free trade zones), mining (gold, silver, bauxite, and nickel), and services exports (tourism). The Dominican Republic is both an immigration and emigration country, with large numbers of foreign‑born immigrants (mostly Haitian) living in the Dominican Republic as there are Dominican emigrants living abroad (about 1 million, or 10 percent of the Dominican population). Net remittances account for a significant share of foreign exchange inflows, amounting to 7.3 percent of GDP in 2018.
FIGURE 1GDP per capita growth, constant prices
–1
0
1
2
3
4
5
Ave
rag
e an
nu
al g
row
th r
ate,
p
erce
nt
1970s 1980s 1990s 2000s
Dominican Republic Latin America and Caribbean World
2010s
Source: World Bank, World Development Indicators (WDI).

8
As with most fast‑growing economies, the main driver of growth in the Dominican Republic has been the steady increase of labor productivity. Between 2000 and 2017, per capita value added grew at an annual rate of 3.45 percent, of which 2.71 percent was contributed by labor productivity growth (Table 1). Demographic trends, particularly a growing share of the working age population, as well as rising employment and labor force participation rates, also had a positive impact on economic growth, but together these contributed only one‑fifth of the overall per capita value‑added growth experienced over that period.
Despite the Dominican economy’s stellar macroeconomic performance and medium‑term favorable outlook,2 the pace of poverty reduction has been relatively slow since the late 1990s. During the last two decades, the Dominican Republic exhibited about the same amount of poverty reduction as its regional peers. As shown in Figure 2, for example, the Dominican Republic’s poverty headcount ratios (at US$1.90 per day and at US$3.20 per day) fell by roughly the same proportion between 2000 and 2017 as the average ratio in Latin America and the Caribbean. That is a significant improvement. However, considering that the Dominican Republic’s per capita GDP grew almost twice as fast as the regional average, a much faster reduction in poverty would have been warranted. While the Dominican Republic ranks 10th among 17 countries in Latin America and the Caribbean in terms of income per capita growth for the bottom 40 percent during 2008–2016, it had the fourth highest GDP growth rate (World Bank 2018). This suggests that the nature of GDP growth in the Dominican Republic has been less inclusive than in the rest of the region.
The rapid economic growth observed over the last couple of decades also does not seem to have translated into significantly better jobs outcomes. The employment to GDP growth elasticity in the Dominican
2 The Dominican Republic’s real GDP growth during 2014–2018 averaged over 7 percent per year, which may have exceeded its long‑term potential growth rate. As noted in the most recent International Monetary Fund (IMF) Article IV Consultations (IMF 2019), however, a strengthened policy framework, a favorable external environment, and improved terms of trade helped mute inflationary pressures, bring down unemployment, and maintain a stable external position that is broadly in line with fundamentals. Looking forward, economic growth is expected to remain strong but at a somewhat lower pace in the face of tighter financial conditions, a less supportive external environment, higher oil prices, and lower export and remittances growth.
TABLE 1Decomposition of growth in per capita GDP
% Yearly contribution to growth 2000–2005 2005–2010 2010–2017 2000–2017
Annual growth per capita value added 1.90 4.32 3.95 3.45
Change in labor productivity 1.18 3.81 3.06 2.71
Change in employment rate 0.10 0.32 −0.07 0.10
Change in participation rate 0.20 −0.28 0.68 0.26
Change in share of working age population 0.42 0.47 0.28 0.38
% Contribution 2000–2005 2005–2010 2010–2017 2000–2017
Annual growth per capita value added 100 100 100 100
Change in labor productivity 62 88 77 79
Change in employment rate 5 7 −2 3
Change in participation rate 11 −7 17 8
Change in share of working age population 22 11 7 11
Source for Total Value Added (WDI): Gross Domestic Product (2000–2017).

9
Republic is at levels comparable to other countries (Figure 3a). A 1 percent increase in GDP is accompanied by a 0.55 percent increase in employment. Jobs in services and female employment seemed the most responsive to economic growth (Figure 3b). Even though the economy succeeded in creating enough new jobs to keep the unemployment rate from increasing, the quality of jobs appears to have declined. This deterioration manifests itself most visibly in the stagnation of real wages. Other signs of poor or deteriorating job quality are the high degree of job informality and an increased concentration of employment in less productive, unskilled labor‑intensive sectors.
The average real wage in the Dominican Republic fell by 10 percent between 2000 and 2014, while the median wage fell by 2 percent over that period. Real wages rose in 2015–2016 but barely enough to bring the average wage to 4 percent above its value in 2000, while the median wage rose to 10 percent above its 2000 value.3 Considering that labor remuneration represents the main source of income for the majority of the population, especially for those in the bottom quintiles of the income distribution, this wage stagnation helps explain the country’s relatively weak poverty reduction response to economic growth. Since 2016, real wage growth appears to have caught up with productivity growth but not enough to make up for the lost ground in 2000–2015.
A puzzling aspect of the stagnant behavior of wages is that it has been taking place in an environment of fast labor productivity growth and seemingly low unemployment. This suggests that the primary job challenge facing the Dominican Republic is not only a matter of creating more jobs or raising labor productivity but also about raising job remuneration in line with evolving labor productivity trends. The idea that increases in labor compensation are positively associated with increases in labor productivity has a long history, supported by both empirical observation and theoretical considerations. It therefore came as a surprise to many when more recent analyses revealed wages and productivity growth to be drifting apart in the Dominican Republic since
3 It is interesting to note that between 2000 and 2016, the growth in the median wage exceeded the growth of the average wage, if ever so slightly. Changes in the ratio of the average to the median wage are a widely used measure of changes in wage inequality, so seeing that this ratio has declined since 2000 suggests that rising wage inequality does not help explain the slow poverty response to rapid income growth. Of course, we cannot rule out increasing income inequality as a contributing factor, which takes into account non‑wage incomes as well.
FIGURE 2Poverty reduction in a comparative perspective
Dominican Republic
World average
LAC average
Dominican Republic
World average
LAC average
0
20
40
60
80
100
120
140
160
180
200
2000
2001
2002
2003
2004
2005
2006
2007
2008
2009
2010
2011
2012
2013
2014
2015
2016
2017
Pove
rty
hea
dco
un
t ra
tio
(I
nd
ex, 2
000=
100)
0
20
40
60
80
100
120
140
160
180
200
2000
2001
2002
2003
2004
2005
2006
2007
2008
2009
2010
2011
2012
2013
2014
2015
2016
2017
Pove
rty
hea
dco
un
t ra
tio
(I
nd
ex, 2
000=
100)
A. Evolution of Poverty Headcount Ratios (at US$1.90/day in Latin America and Worldwide)
B. Evolution of Poverty Headcount Ratios (at US$3.20/day in Latin America and Worldwide)
Source: World Bank, WDI.

10
at least the 1990s.4 The Dominican Republic is not alone, however, in experiencing a significant decoupling of wage growth from labor productivity growth in recent decades. In fact, this same trend has been observed in the United States and in many other Organisation for Economic Co‑operation and Development (OECD) countries since the late 1970s, as well as in several other developing countries.5
Economists have pointed out that the divergence between labor productivity growth and wage growth can often be due to the mismeasurement of key variables, but this does not seem to be the case in the Dominican Republic. For example, for the case of the United States, Lawrence (2015) found that when real wages and labor productivity are properly measured, much of the wage‑productivity gap calculated over the period of 1970 through 2000 disappears.6 When these same types of data adjustments were carried out for the Dominican Republic, the wage‑productivity gap declined modestly but did not disappear (see Annex A). In particular, the size of the wage‑productivity gap (depicted in Figure 4), which initially was measured as 49 percent of the average hourly wage, fell to 37.1 percent after various adjustments were to correct for possible mismeasurement.7 This
4 Theory tells us that under competitive market conditions we should expect to see a systematic relation between real wage growth and productivity growth but not necessarily a one‑to‑one relationship, except when the elasticity of substitution of the production function equals 1 (Cobb‑Douglas); see Box 1. Another feature of the Cobb‑Douglas production function is that it leads to constant factor shares of income, and since factor income shares had exhibited little change over time in various earlier empirical studies, many analysts came to assume that such functions represented the norm rather than the exception. So, the element of surprise associated with the emergence of a wage‑productivity gap has more to do with the erroneous assumption of a unitary elastic production function than with any supposed violation of neoclassical maximizing principles.5 See, for example, OECD (2018), which reports that 15 out of 24 countries exhibited a decoupling of wage and productivity growth, together with declining labor shares of income. (From basic macroeconomic accounting we know that increases in the ratio of labor productivity to real wages translate into declining labor income shares; Box 1.) Karabarbounis and Neiman (2014) have found that in a sample of 59 countries with at least 15 years of wage‑share data between 1975 and 2012, 42 countries exhibited downward trends in their labor shares. (For 37 countries, the downward trend was statistically significant, whereas only 9 countries exhibited statistically significant increases in their labor shares.) Of the 10 largest economies, all but the United Kingdom exhibited downward trends in labor shares. Interestingly, the largest developing economies (China, India, Brazil, and Mexico) also exhibited declining labor shares.6 See also Brill et al. (2017).7 World Bank (2017) analyzes whether statistical mismeasurement can explain the wage productivity gap in the Dominican Republic, given that the national income accounts methodology was revised and the base year moved from 1991 to 2007. That analysis also found that the national accounts had previously overestimated productivity growth during the period in question but that a significant gap remained and was indeed getting larger.
FIGURE 3Employment to economic growth elasticity, 2000–2017
00.10.20.30.40.50.60.70.80.9
–0.2–0.1
00.10.20.30.40.50.60.70.80.9
Elasticity 95 CI
Braz
ilTo
tal
Agricultu
re
Industr
y
Serv
ices
Wom
en
Youth
Men
Self-
emplo
ymen
t
Pana
ma
Domin
ican
Repu
blic
Costa
Rica
Colo
mbi
aCh
ile
A. Comparator Countries B. Dominican Republic, across job categories
Source: Own elaboration based on WDI.
Notes: Each point shows the percentage change in the total number of jobs when GDP grows by 1 percentage point. The lines indicate the 95% confidence intervals.

11
gap remains quite significant: it says that if real wages in the Dominican Republic had kept up with productivity growth, they would now be 37 percent higher than they currently are. It also suggests that the disconnect between wages and productivity may be reflecting global trends rather than being primarily a homegrown phenomenon.
Stagnant wage behavior is usually associated with slack labor markets, but the behavior of open unemployment rates in the Dominican Republic appears to contradict this relationship. As seen in Figure 5, the Dominican Republic’s open unemployment rate has been systematically below the average rate observed in the rest of Latin America during the 2000s, and except for a temporary increase in the first half of the 2010s, this pattern was resumed after 2016. The pattern of comparatively low open unemployment is more consistent with the Dominican economy’s fast economic growth than with the notion of a slack labor market suggested by the pattern of stagnating wages.
FIGURE 4The disconnect between wages and productivity in the Dominican Republic
Median wage
Mean wage index
GDP per Capita
Labor Productivity
40
60
80
100
120
140
160
180
200
2000 2001 2002 2003 2004 2005 2006 2007 2008 2009 2010 2011 2012 2013 2014 2015 2016 2017
Ind
ex (
2000
= 1
00)
Source: Own elaboration based on WDI and ILO.
FIGURE 5Evolution of open unemployment rates: Dominican Republic, Latin America and the Caribbean, and worldwide
2000
2001
2002
2003
2004
2005
2006
2007
2008
2009
2010
2011
2012
2013
2014
2015
2016
2017
2018
0
1
2
3
4
5
6
7
8
9
10
Perc
enta
ges
Dominican Republic World LAC
Source: ILO Statistics (ILOSTAT) modeled estimates.

12
The comparatively low open unemployment rate disguises the slackness of the Dominican labor market, as many idle workers have become discouraged by poor job prospects and decided to withdraw from the labor market or to emigrate, which results in lower unemployment rates (Abdullaev and Estevao 2013). This explanation is consistent with the high levels of underemployment historically observed in the Dominican Republic. For example, as shown in Figure 6, the Dominican Republic’s employment rate has been consistently lower than the Latin America and the Caribbean average since the mid‑1990s, while the labor inactivity rate in the Dominican Republic has been systematically higher than the Latin America and the Caribbean average. These indicators point toward significant labor market slackness from the 1990s to around the mid‑2010s, which may have contributed to the rising wage‑productivity gap that developed during that period.
The trajectory of the Dominican Republic’s employment and inactivity rates changed course around 2010, however, and began to converge with the Latin America and the Caribbean average rates. The additional labor supply made available as the Dominican inactivity rate declined may have put downward pressure on wages in spite of strong labor demand. In any case, that downward pressure would have stopped once the inactivity rate stabilized at its new level around 2015, which may also explain the modest uptick in real wages observed since 2014. The wage increases observed so far, however, have not been large enough to make significant inroads in closing the wage‑productivity gap that has been accruing since at least 2000.
These developments suggest that the Dominican labor market has improved its capacity to generate new jobs to absorb its growing workforce. Questions remain, however, about the quality of the new jobs being created, particularly in regard to wage amount, job type (for example, wage based versus self‑employment), social insurance protection, and skills match. Also, even though the labor market appears to fulfill its market clearing function at the aggregate level, questions have arisen at a more disaggregated level about the efficiency of labor allocation across sectors. In particular, the Dominican Republic exhibits a disconnect between the sectoral evolution of output and of employment that could be reflecting barriers to factor mobility.
The Dominican Republic is well advanced in the structural transition away from agriculture that characterizes most countries on the path of development (Table 2). In the Dominican Republic, however, a similar transition is also occurring in the industry sector. It is losing employment share, even though this is the most productive sector of the economy. That leaves only the services sector to absorb all the workers that have left the other sectors.
FIGURE 6Inactivity and employment rates
2527293133353739414345
Perc
enta
ges
1995
1996
1997
1998
1999
2000
2001
2002
2003
2004
2005
2006
2007
2008
2009
2010
2011
2012
2013
2014
2015
2016
2017
2018
2019
2000
2001
2002
2003
2004
2005
2006
2007
2008
2009
2010
2011
2012
2013
2014
2015
2016
2017
2018
2019
46485052545658606264
Perc
enta
ges
Dominican Republic World LAC
A. Total Labor Inactivity Rates, Dominican Republic, LAC, and World
B. Total Employment to Population Ratio, Dominican Republic, LAC, and World
Source: World Bank (WDI); ILOSTAT.

13
The increasing concentration of employment in the services sector—coupled with its low productivity levels—hinders overall productivity growth. Figure 7 shows that in addition to falling employment shares, the agriculture and industry sectors are not adding any additional workers. All the additional employment is taking place in services, whose productivity growth is rapidly decelerating. In the mid‑1995, the Services sector displayed a similar productivity of labor as the Industry sector. Since then, productivity growth in the sector has basically stagnated and now risks being overtaken by the agriculture sector, which traditionally is the least productive of the major sectors. Meanwhile, the industry sector has seen a tripling of its labor productivity since the mid‑1990s but has failed to expand employment.
FIGURE 7Sector employment and productivity
02,0004,0006,0008,000
10,00012,00014,00016,00018,000
1991
1992
1993
1994
1995
1996
1997
1998
1999
2000
2001
2002
2003
2004
2005
2006
2007
2008
2009
2010
2011
2012
2013
2014
2015
2016
2017
2018
Co
nst
ant
2010
US$
0
1,000
2,000
3,000
4,000
5,000
6,000
1991
1993
1995
1997
1999
2001
2003
2005
2007
2009
2011
2013
2015
2017
Tho
usa
nd
s
Agriculture Industry Services
A. Dominican Republic, Evolution of Employment, by Sector
B. Dominican Republic, Evolution of Labor Productivity; 1991–2018
Source: World Bank (WDI).
TABLE 2Structural evolution of the economy by sector
Shares of GDP (%) 1991 1995 2000 2005 2010 2018
Agriculture 13 11 7 8 6 6
Industry 36 35 35 32 30 30
Services 50 54 58 60 64 64
Total 100 100 100 100 100 100
Shares of Employment (%) 1991 1995 2000 2005 2010 2018
Agriculture 21 20 16 14 12 9
Industry 27 26 25 23 18 19
Services 53 54 60 64 69 71
Total 100 100 100 100 100 100
Source: World Bank (WDI).

14
Over the last two decades, labor productivity growth in the Dominican Republic has taken place entirely through within‑sector productivity growth. If anything, between‑sector productivity growth has been negative, which means that labor was, on average, redeployed from more productive sectors to less productive sectors, which reduces overall growth. Looking over the entire period from 2000 to 2017 (last column in Table 3), the annual rate of productivity growth was 2.71 percent, of which 3.13 percent was due to within‑sector productivity growth and −0.41 percent was due to between‑sector productivity growth. The industry sector contributed the most to within‑sector productivity growth, followed by the services and agriculture sectors. From the bottom half of Table 3 we note that any gain in production that accrued to the services sector on account of labor shifts into the sector was eclipsed by the greater loss in production due to labor shifting out of the other two sectors.
Intersectoral shifts in employment were productivity enhancing between 2000 and 2007 but not thereafter. As seen in Figure 8, between 2000 and 2007, there was a positive association between the relative levels of labor productivity and changes in employment shares. Certain sectors such as finance, hotels and restaurants, and transport and information and communication technology (ICT) had higher levels of labor productivity and at the same time experience an expansion in their shares of total employment. On the other hand, the primary sector as well as the retail and wholesale sector were among the least productive and at the same time witnessed a decline in their share of employment. This process did not take place between 2008 and 2016. During that period, the most productive sectors—such as manufacturing, finance, and real estate—experienced a decline in their employment shares, while those less productive—such as wholesale and retail and the public sector—expanded. These employment shifts contributed to reduce labor productivity growth.
CONCLUDING REMARKS
This chapter has summarized some of the evidence pointing to a progressive decoupling of wages and productivity growth in the Dominican Republic that cannot be explained away as just a matter of variable mismeasurement. This decoupling has manifested itself in poor job outcomes, especially the stagnation of wages and a declining income share for labor. These are cause for much concern, triggering calls for corrective policy actions. The Dominican Republic is not unique in this regard, as other developing and OECD countries are experiencing similar problems. It means that the variables contributing to these poor job outcomes are not entirely homegrown but also reflect global trends and developments.
TABLE 3Decomposition of labor productivity growth by major sector, Dominican Republic
% Yearly contribution to growth 2000–2005 2005–2010 2010–2017 2000–2017
Overall change in productivity 1.18 3.81 3.06 2.71
Within-sector productivity growth 1.17 4.54 3.06 3.13
Agriculture 0.21 0.34 0.31 0.30
Industry 0.38 2.67 1.56 1.80
Services 0.58 1.53 1.20 1.03
Between-sector productivity growth 0.00 −0.73 0.00 −0.41
Agriculture −0.05 −0.08 −0.16 −0.13
Industry −0.27 −1.92 −0.24 −0.96
Services 0.33 1.28 0.40 0.68
Source: World Bank, Jobs Structure Tool.

15
FIGURE 8Labor productivity vs. employment structure change, 2000–2016
Primary sector
Mining
Manufacturing
Construction
Utilities
Trade
Hotels and restaurants
Transport and ICT
Finance
Real estate
Public sector
Education
Health
Other services
Primary sector
Mining
Manufacturing
Construction
Utilities
Trade
Hotels and restaurants
Transport and ICT
FinanceReal estate
Public sector
Education
HealthOther services
–1.5
–1
–0.5
0
0.5
1
1.5
–4 –3 –2 –1 0 1 2 3
–1.5
–1
–0.5
0
0.5
1
1.5
2
2.5
3
3.5
–5 –4 –3 –2 –1 0 1 2 3 4
A. 2000–2007
B. 2008–2016
Log
(sec
tor
pro
du
ctiv
ity/
tota
l pro
du
ctiv
ity)
Employment shares, change
Log
(sec
tor
pro
du
ctiv
ity/
tota
l pro
du
ctiv
ity)
Employment shares, change
Source: Own elaboration based on data from ENFT and Banco Central.

16
BOX 1. PRODUCTIVITY AND WAGES
This box seeks to remind readers of the analytical basis in positing a stable relationship between wages and average labor productivity in the context of a standard neoclassical framework. It also shows that wage growth can diverge from average productivity growth over extended periods without violating profit‑maximizing competitive market assumptions.
Theory. Consider a representative, profit‑maximizing firm in a market economy producing output (Q) using two inputs—capital (K) and labor (L)—with a constant elasticity of substitution (CES) production function technology, written as: Q = A [ δK–ρ + (1 – δ) L–ρ ]–1/ρ, where A is an efficiency parameter, δ is a distributional parameter, and ρ represents a substitution parameter, such that the elasticity of substitution is given by σ = (1 / (1 + ρ ), where −1 < ρ < ∞. To maximize profits, the representative producer hires labor until the marginal product of labor (MPL) is equal to the real wage (w) or
w = (MPL) = [Q / L]1 + ρ = [Average Labor Productivity]1+ρ. (1)
Taking the log operator to Equation (1) and differentiating, we have that
dln (w) / dt = (1 + ρ ) dln (APL ) / dt. (2)
From Equation (2) we see a stable, positive relationship between real wage growth and average labor productivity growth, but it is not one‑to‑one, except in the unique case where the parameter ρ = 0, meaning that the elasticity of substitution is 1 (Cobb‑Douglas production function). With an elastic production function (−1 < ρ < 0), wage growth is slower than labor productivity growth, whereas with an inelastic production function (ρ > 0), wage growth would exceed productivity growth.
Empirics. A common starting point of empirical research on the relation between wages and average labor productivity (in a firm, sector or economy‑wide) is through the following accounting identity:
w = W / L = [W / Q] [Q / L] = [W / Q][APL ], (3)
where W represents total labor compensation, L is the total number of hours worked, Q is total value added, and w represents the average hourly wage rate. This says that the wage rate is equal to the labor share of income (W / Q) multiplied by the average labor productivity (Q / L ≡ APL ). Taking log derivatives of this equation, we can see once more from Equation (4) that unless the labor share of income remains constant over time (which is the hallmark of Cobb‑Douglas production functions), the growth rate of wages will diverge from the growth rate of average labor productivity.
dln ( w) / dt = dln [W / Q] / dt + dln (APL ) / dt. (4)
That is, productivity growth exceeds (is less than) real wage growth if labor’s share of income is falling (rising). Whether labor’s income share is falling or rising, in turn depends on whether the elasticity of substitution of the underlying production function is in the elastic or inelastic range.
Source: World Bank, Jobs Group.
1 – δAρ
1 – δAρ

17
2. LABOR SUPPLY
This chapter reviews the characteristics of the labor supply in the Dominican Republic. It shows patterns of employment and labor force participation growth. It shows that the quality of jobs, in terms of earnings’ levels and formality rates, has been stagnant. It illustrates that despite important advances, there are still significant gaps across genders. At the same time, it provides new evidence showing that workers in the Dominican Republic lag their peers in comparable economies in terms of the skills required by the jobs of the future. It also shows who among the workers are more vulnerable to ongoing trends in automation, because of their skills being more likely to be substituted by new technologies.
2.1 LABOR FORCE PARTICIPATION AND EMPLOYMENT
The vast majority of jobs in the Dominican Republic are outside agriculture. In 2018, only about 8 percent of people employed had a job in agriculture. These jobs are mostly in low‑productive occupations with low wages and poor benefits, with only 24 percent of agricultural workers being in a salaried job. In contrast, more than 9 of every 10 people employed work in the industry or services sector. Of those, about a third work as self‑employed and almost two‑thirds as salaried workers. However, according to several dimensions discussed in this chapter, while non‑agricultural jobs tend to be of better quality than agricultural ones, the Dominican Republic faces a scarcity of good quality jobs in rapidly growing urban areas.
FIGURE 9Structure of the labor force, 2018
SELF-EMPLOYED69.6%
WAGE EMPLOYEE23.7%
UNPAID WORKER3.4%
EMPLOYER3.4%
SELF-EMPLOYED33.8%
WAGE EMPLOYEE61.3%
UNPAID WORKER1.7%
EMPLOYER3.2%
NON-AGRICULTURE91.7%
AGRICULTURE8.3%
UNEMPLOYED4.5%
EMPLOYED64.8%
INACTIVE30.7%
WORKING-AGE POPULATION (15–64)
64.7%
TOTAL POPULATION
NON-WORKING-AGE POPULATION
35.2%
Source: Own elaboration based on Encuesta Nacional Continua de Fuerza de Trabajo (ENCFT) 2018.

18
Labor market outcomes have been stagnant in the 2000s, but job creation started to increase after the 2008–2009 financial crisis. Analyzing trends in labor market outcomes is complex given that a significant methodological change was introduced to the main survey that collects labor market variables in the Dominican Republic in late 2014. However, given the overlap of the two methodologies in the years 2015 and 2016, it is possible to infer if the evolution of key labor market outcomes during the transition period were due to the change in the methodology. As seen in Figure 10, before the significant decline in 2009, the employment rate hovered between 53 and 55 percentage points since 2000. However, a substantial rebound took place afterwards, with the employment rate raising from 52.4 percentage points in 2009 to about 56.8 in 2016, the highest value since 2000. Both the ENFT (Encuesta Nacional de la Fuerza de Trabajo) and the ENCFT (Encuesta Nacional Continua de la Fuerza de Trabajo) show an increase in employment between 2015 and 2016, from 56.1 to 56.8 and from 57.3 to 57.9 percentage points, respectively. This is important as it shows that despite the change in the level of the employment rate, the trends are rather similar according to both methodologies. The increase in this variable was even larger during recent years reaching 61 percentage points in 2019, the highest value for the past two decades.
BOX 2. METHODOLOGICAL CHANGES INTRODUCED TO THE MAIN LABOR FORCE SURVEY OF THE DOMINICAN REPUBLIC
Several improvements were introduced to the ENFT. The new survey, the ENCFT, started to be conducted in a parallel mode with the ENFT from 2014 until 2016. Since 2017, the ENFT stopped being collected. The main changes introduced included the following:
1. Conceptual framework and methodology
(a) Harmonization with National Accounts: Same classification of jobs according to the final use of production (include production of goods and services for self‑consumption)
(b) Changes in reference periods for employment variables
(c) Changes in the age brackets to define working‑age population
(d) Definition of unemployment and under‑employment according to international practices
(e) Consolidation of multiple official unemployment rates into one
(f) Distinction between informal sector (if employer is registered with tax authority or has formal accounting procedures) and informal employment (if the worker has employment‑based health or pension contributions)
(g) Uses new industry and occupation classifications
2. Questionnaire
(a) Adaptation to the new conceptual framework
(b) Changes to increase the flow and improve the performance of both the interviewer and interviewee
3. Sample design: based on the 2010 Population Census (the ENFT was based on the Population censuses of 2002 and earlier ones)
Analyzing the impacts of these changes on key employment indicators is beyond the scope of this report. However, according to Figure 10 and Figure 11, it can be noticed that during the years where both the ENFT and ENCFT overlapped, the ENCFT produced larger estimates of both employment and participation rates, but lower estimates of unemployment rates. This suggests that the increase in employment was lower than the increase in participation when comparing the ENFT and the ENCFT.

19
In contrast to the dramatic increase to the employment rate since 2009, the unemployment rate has been stagnant. Between 2009 and 2013, the increase in the employment rate was accompanied by a simultaneous increase in the unemployment rate, from 5.5 to 7.4 percentage points (Figure 10). Changes in the unemployment rate are driven by changes in both the number of employed and non‑employed people looking for a job. Thereby, the increase in unemployment during a period of job creation suggests that an important share of the inactive population are discouraged workers who would join the labor force once the likelihood of finding a job improves. In contrast to this dynamic, the unemployment rate showed a significant decline between 2013 and 2016. Both the ENFT and ENCFT show a decline in the unemployment rate between 2015 and 2016, suggesting that during this period the increase in employment was larger than the increase in activity rates. However, since 2017 the increase in employment again coincided with an increase in unemployment, from 5.5 to 6.2 percentage points. In other words, the existence of discouraged workers who are considered as out of the labor force seems an important factor to explain the high rates of labor market inactivity in the Dominican Republic.
The evolution of the the overal labor force participation rates since the early 2000s reflect changes in the share of discouraged workers but also a secular increase in female labor force participation. Between 2000 and 2009, there was a decline in male labor force participation that coincided with stagnant employment rates at the aggregate level, which may reflect an increase in the fraction of discouraged workers (Figure 11). During the same period, women experienced a moderate improvement in their employment rate, but these gains were lost during the 2008–2009 financial crisis. Ever since 2009, however, women experienced a sustained increase in both activity and employment rates. While in 2009 just 39 and 36 percent of women participated in the labor market and had a job, respectively, those figures climbed up to about 53 and 48 percent in 2019. The labor force participation of men seems sensitive to the pace of job creation and the likelihood of finding a job, as it tended to grow between 2009 and 2013, and between 2017 and 2019, when the employment rate also increased.
The Dominican Republic compares favorably against countries in the region with respect to the total quantity of jobs, but not with respect to female or skilled employment. Men have higher employment rates in the Dominican Republic than in any other comparator country (Figure 12). Employment rates are also
FIGURE 10Evolution of employment and unemployment rate, 2000–2018
57.3 57.9
58.7 60
.0 61.0
54.6
53.1
53.6
52.8 54
.1
54.3 54.8
53.8 54
.6 55.4
54.9 55.5
56.1 56
.8
53.3
52.9
52.4
7.3 7.1
5.5 5.7 6.2
6.47.2 6.7 6.9
6.3 6.65.7 5.2 4.8
5.5 5.26.1
6.77.4
6.7 6.3 5.8
40
45
50
55
60
65
Emp
loym
ent
Rat
e (p
erce
nta
ge
po
ints
)
0
2
4
6
8
10
12
14
16
18
20
Un
emp
loym
ent
Rat
e (p
erce
nta
ge
po
ints
)
2000
2001
2002
2003
2004
2005
2006
2007
2008
2009
2010
2011
2012
2013
2014
2015
2016
2017
2018
2019
Employment Rate (ENCFT)Employment Rate (ENFT)
Unemployment Rate (ENCFT)Unemployment Rate (ENFT)
Source: Own elaboration based on figures from the Banco Central.
Note: The unemployment figures for the ENFT correspond to the Open Unemployment (Desocupacion Abierta) definition. Sample includes individuals ages 15 years and older.

20
FIGURE 11Evolution of employment and participation rates, by gender
Ap
ril
Oct
ob
erA
pri
lO
cto
ber
Ap
ril
Oct
ob
erA
pri
lO
cto
ber
Ap
ril
Oct
ob
erA
pri
lO
cto
ber
Ap
ril
Oct
ob
erA
pri
lO
cto
ber
Ap
ril
Oct
ob
erA
pri
lO
cto
ber
Ap
ril
Oct
ob
erA
pri
lO
cto
ber
Ap
ril
Oct
ob
erA
pri
lO
cto
ber
Ap
ril III IVI II III IVI II III IVI II III IVI II III IVI II III
IV 1
/30
35
40
45
50
55
60
65
70
75
80
‘00 ‘01 ‘02 ‘03 ‘04 ‘05 ‘06 ‘07 ‘08 ‘09 ‘10 ‘11 ‘12 ‘13 ‘14 2015 2016 2017 2018 2019
Perc
enta
ge
po
ints
Men LFP Women LFPMen Employment Rate Women Employment Rate
Source: Own elaboration based on figures from the Banco Central.
Note: The lines from 2000 to April 2014 and the dots from October 2014 to October 2016 correspond to the ENFT. The participation figures for the ENFT correspond to the Open Participation (Participacion Global Abierta) definition. Sample includes individuals ages 15 years and older.
FIGURE 12Employment rates in the Dominican Republic and comparator countries, 2017–2018
Men Women 15–24 25–64 Low Medium High Urban Rural
Gender Age Education Area
Dominican Republic Brazil Chile Colombia Costa Rica Panama
20
30
40
50
60
70
80
90
Perc
enta
ge
po
ints
Source: Own estimation based on SEDLAC (Socio‑Economic Database For Latin America And The Caribbean) databases.
Note: The survey years are 2018 for the Dominican Republic, and 2017 for the other countries. Educational categories are as follow. Low: 0–8 years of education; Medium: 9–13 years of education; High: 14+ years of education.

21
relatively high for youth and for those with 8 years of education or less. Employment rates are also relatively high in both urban and rural areas. Youth employment rates are higher than in other comparator countries except for Brazil and Colombia. In contrast, employment rates for women in the Dominican Republic are at the same levels or lower than in other countries except for Costa Rica. Accordingly, while there are sharp differences in employment rates across education levels in other countries, skilled people in the Dominican Republic do not experience significantly higher rates of employment than their least skilled peers. For example, while the employment rate gap between the high and low educated group varies from 13 percentage points (Colombia) to 24 percentage points (Brazil), this gap in the Dominican Republic is only 8 percentage points. In other words, high educational attainment is not strongly linked to better employability in the Dominican Republic.
2.2 THE QUALITY OF JOBS
Improving the quality of jobs in the Dominican Republic is a more imperative challenge than increasing their quantity. While the Dominican Republic’s economy performs relatively well in terms of the ability to generate jobs, especially in recent years, the country is lagging in terms of the quality of the existing jobs according to several dimensions. Low‑quality jobs are typically linked to low‑productive activities that provide low wages and no protection against important risks such as illness or old‑age poverty. According to the productive definition of informality—which tends to capture jobs in low‑productivity activities—the share of informal workers was stagnant at about 50 percent between 2000 and 2012 (Figure 13a), and declined slightly from 2012 until 2016.
Distinguishing between informal sector and informal employment is key in the Dominican Republic. The new labor force survey (ENCFT) allows to measure informality according to the best international practices. It distinguishes employment in the informal sector from informal employment. The informal sector is defined according to the lack of registration of the employer or self‑employed with the corresponding authorities and the absence of standard accounting practices. Informal employment is defined by the lack of social security coverage, employment contract, and other benefits. In other words, with this new definition it is possible to capture informal workers in the formal sector, and formal workers in the informal sector. Most of the informal employment in the Dominican Republic is accounted for in the informal sector. In other words, there is a very small fraction of informal employment in the formal sector, about 10 percent (Figure 13b). Accordingly, there is a negligible share of formal workers in the informal sector (less than 1 percent). About 80 percent of the informal sector is accounted by informal self‑employment, while almost 90 percent of the formal sector is accounted by formal salaried workers. Domestic workers are mostly informal, and they account for about 10 percent of informal employment. When looking at trends, the size of both the informal sector and informal employment have been rather stagnant since 2014, with a slight decline in 2019.
The incidence of informality in the Dominican Republic is high in general, and also when compared to other countries. In the Dominican Republic, 58 percent of workers did not contribute to a pension fund in 2018 (Figure 14a). According to this legal definition, informality is higher—both in absolute terms and when compared to other countries—for men, prime‑age, low‑educated, and urban workers. Workers in the Dominican Republic are significantly more likely to work in low‑productive activities than their peers from other countries. According to the productive definition of informality—which tends to capture jobs in low‑productivity activities—the Dominican Republic lags every comparator country except Colombia (Figure 14b). The incidence of informal jobs is worse for workers with low and middle educational attainment and for those in rural areas. Even though those highly educated or in urban areas have better jobs according to this dimension, they still lag other comparator countries.
Low‑skilled workers in agriculture and construction and in micro firms are more likely to have an informal job or a job in the informal sector. When comparing individuals otherwise similar in terms of their observable characteristics, econometric estimates show that high school and college graduates are 8.8 and 16.5 percentage points less likely to have an informal job than their peers that did not finish primary education (Table AA.1, column 2). Those with jobs outside agriculture and construction are significantly less likely to have an informal job. For instance, workers in finance or real estate are 18.8 and 22.3 percentage points less likely to have an informal job than their peers in agriculture. Having a job in a small firm is associated with a higher

22
likelihood of being in the informal sector and of having an informal job. The incidence of informality declines steeply between firms with 10 employees or less and those with more, but it is quite similar for those with 20 to 30 employees as for those with 100 employees or more. The likelihood of having an informal job also declines steeply between firms with 10 employees or less and those that have more. However, it continues to fall among firms of larger size. For example, while workers in firms with 11 to 19 employees are 58.9 percentage points less likely to have an informal job than those in firms with 10 employees or less, that figure for workers in large
FIGURE 13Informality trends
III IV I II III IV I II III IV I II III IV I II III IV I II III IV‘14 2015 2016 2017 2018 2019
0
10
20
30
40
50
60
70
Perc
enta
ge
po
ints
Informal SectorInformal Employment (”Informalidad Total”)Informal Employment in the Formal Sector
0
10
20
30
40
50
60
7020
0020
0120
0220
0320
0420
0520
0620
0720
0820
0920
1020
1120
1220
1320
1420
1520
16
Perc
enta
ge
po
ints
Informal (productive definition)
A. ENFT (2000–2016) B. ENCFT (2014–2019)
Source: Panel (a) shows own estimates based on SEDLAC database. Panel (b) shows estimates from the Banco Central.
Note: Panel (b): The productive definition categorizes as informal those who work as salaried workers in a small firm (four workers or less), as non‑professional self‑employed or unpaid workers. Panel (b): Informal sector is defined according to the registration status of the employer, while informal employment is based on social security benefits and other characteristics of the job (see Box 2).
FIGURE 14Informality in the Dominican Republic and comparator countries
0102030405060708090
100
Perc
enta
ge p
oint
s
0
10
20
30
40
50
60
70
80
90
Perc
enta
ge p
oint
s
Dominican Republic Brazil Chile Colombia Costa Rica Panama
Total
Men
Wom
en
15–2
4
25–6
4
Low
Med
ium
Hig
h
Urb
an
Rura
l
Gender Age Education Area Gender Age Education Area
Total
Men
Wom
en
15–2
4
25–6
4
Low
Med
ium
Hig
h
Urb
an
Rura
l
A. Legal definition B. Productive definition
Source: Own estimation based on SEDLAC databases.
Note: The legal definition categorizes as informal those without employment‑based pension contributions. The productive definition categorizes as informal those who work as salaried workers in a small firm (four workers or less), as non‑professional self‑employed or unpaid workers. The survey years are 2018 for the Dominican Republic, and 2017 for the other countries. Educational categories are as follow. Low: 0–8 years of education; Medium: 9–13 years of education; High: 14+ years of education.

23
firms with 100 employees or more is 73.9 percentage points. In summary, while the 10‑employee cut‑off seems key to determine the likelihood of being in the informal sector and having an informal job, the probability of having an informal job continues to decline with the size of the firm beyond the 10‑employee cut‑off.
Informality is linked to lower earnings. Salaried workers with an informal job have wages 33.4 percent lower than their formal peers (Table AA.2, column 3). This is not surprising considering that informality tends to be more prevalent among low‑productivity activities. The magnitude of the informality penalty, however, is very large. As a reference, the earnings penalty from having an informal job is similar to the earnings gap between workers who did not complete primary education and those who graduated from high school. This informality earnings penalty decline once we control for the size of the firm, which is expected since small firms are more likely to be less productive, have more informal employment and pay lower wages (Figure 15). In contrast to the informal job wage penalty, having a salaried job in the informal sector is not correlated with lower wages once we control for formal employment status. In other words, when we compare salaried workers with the same characteristics (including job formality status), they are expected to earn the same at a formal or informal firm. Among the self‑employed and employer, there is perfect correlation between belonging to the informal sector and having an informal job. Their informal sector (or job) earnings penalty is higher than for salaried workers. Informal self‑employed and employers earn about 42 percent less than their formal peers.
Larger firms provide higher‑quality jobs not only with respect to formality but also with respect to wages. Workers in firms with 31 to 50 employees, earn on average wages 37 percent higher than those in micro firms with 10 employees or less (Table AA.2, column 6). The corresponding figure for firms with 100 employees or more is 40 percent. As discussed in Chapter 3, barriers to firm growth or the entry of large firms are critical factors behind the low quality of jobs of the Dominican Republic.
Earnings are persistently low in the Dominican Republic. As discussed in Chapter 1, despite a successful macroeconomic performance and rapid labor productivity growth, labor market earnings remain low. They have experienced a substantial increase since 2012 in real terms, of about 20 percent, but they are still below the levels from almost 20 years ago. In 2018, the average worker’s real hourly earnings were 3.1 percent lower than in 2000 (Figure 16a). This is not driven by a particular socio‑demographic group, since earnings have been stagnant across genders, age groups, educational levels, and area of residence. The decline in real hourly earnings since 2000 was slightly smaller for those with low‑education (5 percent) when compared to those with medium
FIGURE 15Informality and firm size earnings premium
Coefficient 95 CI
–40
–30
–20
–10
0
10
20
30
40
50
Perc
enta
ge
po
ints
Informal Sector
Informal Employment
11 to 19 20 to 30 31 to 50 51 to 99 100+
Source: Own estimates based on ENCFT 2018.
Note: The blue dots show the OLS estimates, and the grey dashes are the 95 percent confidence intervals. The regression coefficients are shown in Table AA.2.

24
(11 percent) and high education (10 percent). Women and those in rural areas experienced a marginal increase, of about 1 and 3 percent, respectively.
Earnings in the Dominican Republic are also low when compared to other countries. The average worker in the Dominican Republic has earnings about half the value of those of their peers in Chile, Costa Rica, and Panama (Figure 16b). These differences are not driven by a different composition of the labor force in terms of gender, age, education, or location. In fact, the earnings gaps are evident across all these socioeconomic groups. Non‑wage benefits have not increased on average either, as suggested by the stagnant share of workers without access to social security rights. In fact, even among formal workers, the Dominican Republic also stands out in terms of the low levels of non‑wage costs when compared to other countries in Latin America and the Caribbean (World Bank 2018b). According to Alaimo et al. (2017), the Dominican Republic has one of the countries with the lowest non‑wage costs in the Latin America and the Caribbean region in terms of mandatory social contributions and job benefits such as annual leave and severance payments.
2.3 SKILLS
The educational attainment of the population has increased significantly, but there are still important gaps. While almost 70 percent of women born between 1954 and 1958 had at most 8 years of education, that fraction is less than 19 percent for their peers born between 1989 and 1993 (Figure 17). Accordingly, the fraction of women with at least 14 years of education rose from 13.4 to 31.6 percent between those cohorts. The increase in educational attainment was experienced by men, but to a lesser extent. Among those in the 25–64 age group in 2018, the share of men with at least 14 years of education was 13 percent among the oldest cohort, and 19 percent among the youngest.
Despite this progress, the Dominican Republic lags significantly in terms of the quantity and quality of education. When computing the expected years of education of the future labor force, the Dominican Republic has the lowest level among comparator countries, similar to that of Panama (Figure 18). That level is about 88 percent of that of Chile. When adjusting for the quality of education, the gap becomes even
FIGURE 16Real hourly earnings
100.0
101.3
95.8
88.4
65.8
85.4 85.2
82.586.2
88.2 88.184.3
81.4
82.782.6
89.392.2
91.2
96.9
50
60
70
80
90
100
110
Ind
ex (
2000
=10
0.0)
200020
0120
0220
0320
0420
0520
0620
0720
0820
0920
1020
1120
1220
1320
1420
1520
1620
1720
18
Urban
Rura
lTo
tal
Men
Wom
en15
–2425
–64
Low
Med
ium
High
Gender Age Education Area
0
1
2
3
4
5
6
7
8
US
Do
llars
(201
0 p
rice
s)
Dominican Republic Brazil ChileColombia Costa Rica Panama
A. Over time B. Across countries
Source: Own estimation based on SEDLAC databases.
Note: The survey years are 2018 for the Dominican Republic, and 2017 for the other countries. Educational categories are as follow. Low: 0–8 years of education; Medium: 9–13 years of education; High: 14+ years of education.

25
larger. The learning‑adjusted expected years of education for the Dominican Republic represent 66 percent of the corresponding value for Chile.
Gaps in the quality of education start early in the life cycle. According to the Dominican Republic’s national standardized test, just 12 percent of children in third grade achieved satisfactory levels in Spanish and 27 percent in mathematics in 2017 (World Bank 2018b). Accordingly, when compared to other Latin American countries that participate in the Programme for International Student Assessment (PISA), the Dominican Republic has the lowest scores for reading (Figure 19), and also for mathematics and science
FIGURE 17Educational attainment across cohorts, ages 25 to 64 in 2018
0102030405060708090
100
Perc
enta
ge
po
ints
Year of birth
0–8 years 9–13 years 14+ years
Year of birth
0102030405060708090
100
Perc
enta
ge
po
ints
1954
–195
8
1959
–196
3
1964
–196
8
1969
–197
3
1974
–197
8
1979
–198
3
1984
–198
8
1989
–199
3
1954
–195
8
1959
–196
3
1964
–196
8
1969
–197
3
1974
–197
8
1979
–198
3
1984
–198
8
1989
–199
3
A. Women B. Men
Source: Own estimation based on SEDLAC databases.
Note: Educational attainment is measured by years of education intervals. Sample includes individuals ages 25 to 64 in 2018.
FIGURE 18Expected years of education
12.912.5 12.5
11.7 11.3 11.3
9.6
8.6 8.57.6
7.26.3
4.0
5.0
6.0
7.0
8.0
9.0
10.0
11.0
12.0
13.0
14.0
Chile Costa Rica Colombia Brazil Panama Dominican Republic
Yea
rs
Expected Years of School Learning-adjusted Years of School
Source: Human Capital Project.
Note: Expected Years of School is calculated as the sum of age‑specific enrollment rates between ages 4 and 17.

26
among 15‑year‑olds. Moreover, these levels worsened since 2015, as the average reading test scores for the Dominican Republic declined in 2018.
The lack of an adequate educational system in the Dominican Republic is also evident when analyzing the type of tasks that workers carry out at work. This report uses a methodology to rank occupation by their skill content (see Box 3). It considers the extent to which different occupations rely on the following tasks:
• Non‑routine analytical: intensity of reading, use of mathematics, and thinking at work. Examples of occupations intensive in these skills include engineers, doctors, and so on.
• Non‑routine interpersonal: supervision of workers and interaction with clients. Examples of occupations intensive in these skills include managers, CEOs, and so on.
• Routine cognitive: infrequent necessity to learn new things or be independent at work, repetitive tasks. Examples of occupations intensive in these skills include bank tellers, cashiers, and so on.
• Routine manual: operate machines and use of physical strength. Examples of occupations intensive in these skills include workers in the assembly line, construction workers, and so on.
• Non‑routine manual: Driving and repairing equipment. Examples of occupations intensive in these skills include electricians, drivers, and so on.
Jobs intensive in non‑routine analytical and interpersonal skills are more likely to benefit from new technologies. In contrast, those in routine occupations are more likely to lose, since those jobs are more likely to disappear with technological change. Jobs in the Dominican Republic are not intensive in the skills of the future, even when compared to other countries at the same level of development. As seen in Figure 20, the Dominican Republic is not only below the average country (whose skill index is equal to zero) with respect to the intensity of non‑routine cognitive and interpersonal skills, but also with respect to those at the same level of GDP per capita. In contrast, jobs in the Dominican Republic are disproportionately intensive in routine skills. Workers in those jobs may face higher risk of unemployment and declining wages with technological progress.
FIGURE 19PISA average reading test score
300
320
340
360
380
400
420
440
460
Chile Uruguay Costa Rica Mexico Brazil Colombia Argentina Peru Panama Dominican Republic
Ave
rag
e te
st s
core
2015 2018
Source: Own elaboration based on data from OECD. https://pisadataexplorer.oecd.org/ide/idepisa/report.aspx.
Note: Averages for age 15 years PISA reading scale: overall reading, by all students: 2018 and 2015. The Reading, Mathematics, and Science scale ranges from 0 to 1,000.
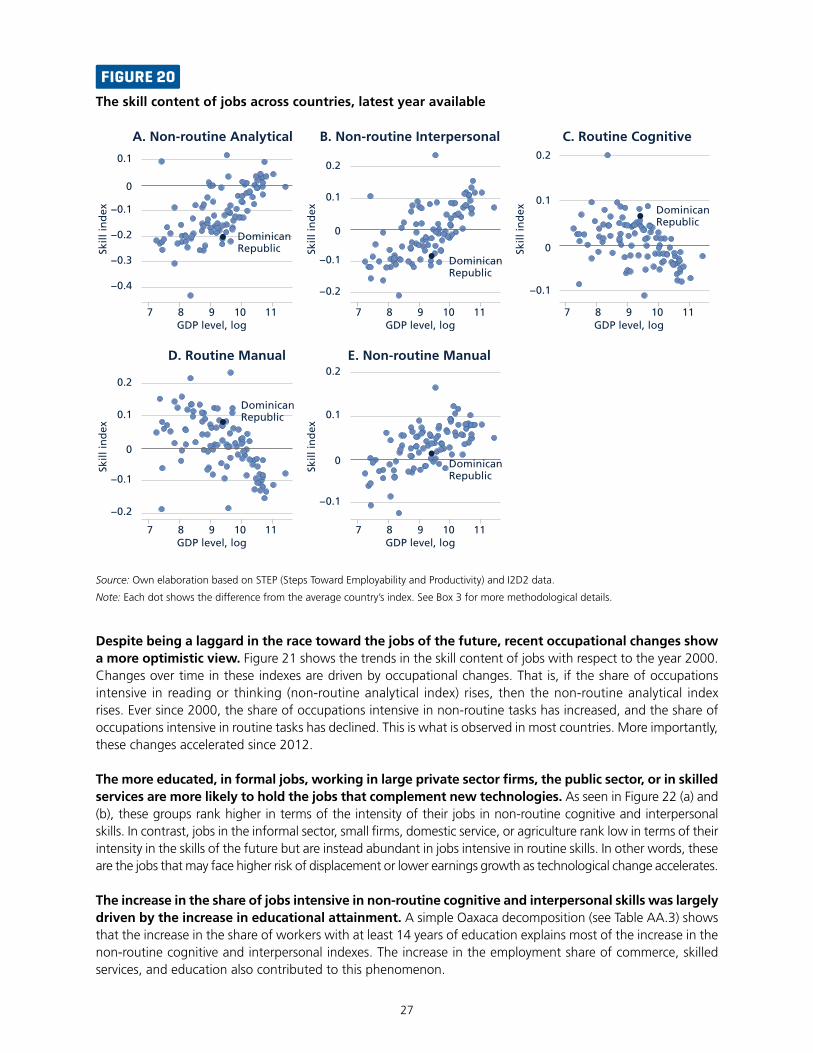
27
Despite being a laggard in the race toward the jobs of the future, recent occupational changes show a more optimistic view. Figure 21 shows the trends in the skill content of jobs with respect to the year 2000. Changes over time in these indexes are driven by occupational changes. That is, if the share of occupations intensive in reading or thinking (non‑routine analytical index) rises, then the non‑routine analytical index rises. Ever since 2000, the share of occupations intensive in non‑routine tasks has increased, and the share of occupations intensive in routine tasks has declined. This is what is observed in most countries. More importantly, these changes accelerated since 2012.
The more educated, in formal jobs, working in large private sector firms, the public sector, or in skilled services are more likely to hold the jobs that complement new technologies. As seen in Figure 22 (a) and (b), these groups rank higher in terms of the intensity of their jobs in non‑routine cognitive and interpersonal skills. In contrast, jobs in the informal sector, small firms, domestic service, or agriculture rank low in terms of their intensity in the skills of the future but are instead abundant in jobs intensive in routine skills. In other words, these are the jobs that may face higher risk of displacement or lower earnings growth as technological change accelerates.
The increase in the share of jobs intensive in non‑routine cognitive and interpersonal skills was largely driven by the increase in educational attainment. A simple Oaxaca decomposition (see Table AA.3) shows that the increase in the share of workers with at least 14 years of education explains most of the increase in the non‑routine cognitive and interpersonal indexes. The increase in the employment share of commerce, skilled services, and education also contributed to this phenomenon.
FIGURE 20The skill content of jobs across countries, latest year available
Dominican Republic
Dominican Republic
Dominican Republic
Dominican Republic
Dominican Republic
7 8 9 10 11GDP level, log
7 8 9 10 11GDP level, log
7 8 9 10 11GDP level, log
7 8 9 10 11GDP level, log
7 8 9 10 11GDP level, log
Skill
ind
exSk
ill in
dex
−0.4
−0.3
−0.2
−0.1
0
0.1
−0.2
−0.1
0
0.1
0.2
Skill
ind
exSk
ill in
dex
−0.2
−0.1
0
0.1
0.2
−0.1
0
0.1
0.2
Skill
ind
ex
−0.1
0
0.1
0.2
A. Non-routine Analytical B. Non-routine Interpersonal C. Routine Cognitive
D. Routine Manual E. Non-routine Manual
Source: Own elaboration based on STEP (Steps Toward Employability and Productivity) and I2D2 data.
Note: Each dot shows the difference from the average country’s index. See Box 3 for more methodological details.

28
Even though educational attainment is not strongly liked to higher employability in the Dominican Republic, diplomas and skills are associated to significantly higher earnings. College graduates working in a salaried job earn hourly wages almost 200 percent higher than their peers that did not graduate from high school.8 The college premium is also high among the self‑employed, at about 88 percent. Accordingly, the complexity of the tasks that workers perform at work also matter. For example, a one‑standard deviation in the non‑routine analytical content of job is associated with hourly earnings about 7 to 24 percent higher in 2015–2016 (see Table AA.4). Between 2000 and 2016, jobs intensive in routine cognitive tasks were associated with lower earnings than the rest. In contrast, non‑routine tasks, even manual ones, had a pay premium. This is expected since these are the tasks that are more difficult to replicate with new technologies.
8 See Table AA.2, column 6. This figure is estimated as exp(1.08) − 1 = 1.95.
FIGURE 22The skill content of jobs by workers and jobs’ characteristics, 2016
45–5
4
55–6
4
Men
Wo
men
Info
rmal
Form
al
Smal
l pri
vate
Larg
e p
riva
te
Pub
lic
Low
Med
ium
Hig
h
15–2
4
25–3
4
35–4
4
Urb
an
Ru
ral
Prim
ary
sect
or
Ind
ust
ry h
igh
tec
h.
Co
nst
ruct
ion
Co
mm
erce
Uti
l. an
d t
ran
s.
Skill
ed s
ervi
ces
Pub
lic s
ecto
r
Edu
c. a
nd
hea
lth
Do
mes
tic
wo
rker
s
Ind
ust
ry lo
w t
ech
.
Education Age GenderFormalstatus
Employertype Area Economic sector
Ind
ex (a
vera
ge=
0.0)
–0.8–0.6–0.4–0.2
00.20.40.60.8
1
A. Non-routine cognitive
FIGURE 21The skill content of jobs in the Dominican Republic, 2000–2016
2000 2001 2002 2003 2004 2005 2006 2007 2008 2009 2010 2011 2012 2013 2014 2015 2016
–0.1
–0.08
–0.06
–0.04
–0.02
0
0.02
0.04
0.06
0.08
0.1
Task
ind
ex (
2000
=0.
0)
Non-routine analytical
Non-routine interpersonal
Routine cognitive Routine manual Non-routine manual
Source: Own elaboration based on STEP data for Bolivia, Colombia, and El Salvador, and the ENFT 2000–2016.
Note: Each line shows the difference from the 2000’s values. See Box 3 for more methodological details. It does not include 2017 and 2018 data due to a change in the occupational classification.

29
45–5
4
55–6
4
Men
Wo
men
Info
rmal
Form
al
Smal
l pri
vate
Larg
e p
riva
te
Pub
lic
Low
Med
ium
Hig
h
15–2
4
25–3
4
35–4
4
Urb
an
Ru
ral
Prim
ary
sect
or
Ind
ust
ry h
igh
tec
h.
Co
nst
ruct
ion
Co
mm
erce
Uti
l. an
d t
ran
s.
Skill
ed s
ervi
ces
Pub
lic s
ecto
r
Edu
c. a
nd
hea
lth
Do
mes
tic
wo
rker
s
Ind
ust
ry lo
w t
ech
.
Education Age GenderFormalstatus
Employertype Area Economic sector
Ind
ex (a
vera
ge=
0.0)
–0.6–0.4–0.2
00.20.40.6
Ind
ex (a
vera
ge=
0.0)
Ind
ex (a
vera
ge=
0.0)
–0.4–0.2
00.20.40.60.8
11.2
Ind
ex (a
vera
ge=
0.0)
–0.4–0.3–0.2–0.1
00.10.20.30.40.5
–0.4–0.2
00.20.40.60.8
B. Non-routine interpersonal
C. Routine cognitive
D. Routine manual
E. Non-routine manual
Source: Own elaboration based on STEP data for Bolivia, Colombia, and El Salvador and the ENFT 2016.
Note: Each bar shows the difference from the average worker’s value. See Box 3 for more methodological details.

30
BOX 3. ESTIMATING THE TASK CONTENT OF JOBS IN THE DOMINICAN REPUBLIC
There is a large body of literature estimating the task content of jobs (Acemoglu and Autor 2011; Autor and Handel 2013; Hardy et al. 2018). To do this, data on the tasks that people do at work is needed. This can come from expert surveys (such as the O*NET for the United States) or from worker‑level surveys. Given the scarcity of these type of data for developing countries, this study exploits data from three Latin American countries with available skills surveys. These include the STEP surveys for Bolivia and Colombia, and a STEP‑like survey for El Salvador.
The methodology is based on Lo Bello, Sanchez‑Puerta, and Winkler (2019). It uses workers’ responses about specific tasks performed at work and groups them in five categories:
Each categorical index in the second column is standardized to have mean zero and standard deviation of one, then they are added up and normalized again for the three‑country sample. Then the average for each two‑digit ISCO‑88 occupational category is estimated and applied to each wave of the ENFT between 2000 and 2016. Data from ENCFT 2017 and 2018 are not used due to a change in the ISCO code, which leads to a break in the series. Then the average task content is equal to the weighted‑average occupation‑specific score, where the weights are number of workers per occupation. In other words, differences in the task content of jobs over time or across groups is purely driven by differences in the occupational structure. Lo Bello, Sanchez‑Puerta, and Winkler (2019) contains more details on the methodology.
Skill Bracket STEP Task
Non-routine Analytical
Type of document read
Length of longest document typically read
Math tasks
Thinking for at least 30 minutes to do tasks
Non-routine InterpersonalSupervising coworkers
Contact with clients
Routine Cognitive
How often your work involves learning new things
Autonomy
Repetitiveness
Routine ManualOperate
Physically demanding
Non-Routine ManualDriving
Repair

31
BOX 4. WHO CAN WORK FROM HOME DURING COVID-19 IN THE DOMINICAN REPUBLIC?
The spread of COVID‑19, lockdowns and social distancing raised the question of how many jobs can be done from home. Answering this question is crucial not only to understand how many jobs can be protected by their amenability to working from home (WFH), but also to identify the most vulnerable groups.
We apply the methodology developed by Hatayama, Viollaz, and Winkler (2020) to the 2018 ENCFT to answer this question. We calculate the occupations that have tasks less amenable to working from home in four Latin American economies with available data from PIAAC skill surveys: Chile, Ecuador, Peru, and Mexico. These tasks include physical and manual tasks that need to be carried out at a specific location and face‑to‑face interactions that require being in the same location as another person, for example a customer, coworker, or student. A third task component measures the extent to which the worker uses ICT at work. This is important as some face‑to‑face interactions can be done online and not necessarily in person. For example, a supervisor of a supermarket chain may evaluate the performance of employees using software, while the owner of an informal grocery store may be more likely to do so by visual inspection. We then impute the average value of these task indexes with the four‑digit ISCO08 classification for Chile, Ecuador, Peru, and Mexico to workers’ corresponding occupations in the Dominican Republic’s ENCFT 2018. In addition, we calculate a fourth component using data from the ENCFT 2018: internet connectivity at home. This variable is important since some individuals may have a job amenable to telework, but they may not be able to do so if they lack home connectivity.
The results indicate that amenability to working from home increases with household income per capita (see the figure below), which suggests that the pandemic may exacerbate income inequality through this channel. This positive link between WFH amenability and incomes is driven by jobs in richer deciles being less intensive in physical tasks, more intensive in ICT use at work, and higher internet connectivity at home. For example, while only 10 percent of workers in the poorest decile have an internet connection at home, the corresponding figure for workers in the richest decile is 57 percent.
The workers who are most vulnerable in terms of their jobs being least amenable to teleworking are the informal, the self‑employed, in small firms, living in rural areas, and with 8 years of schooling or less. In contrast, formal workers, employers, with at least 14 years of schooling, and in the public sector have better chances to do their jobs at home.
Consistent with the evidence for other countries, women in the Dominican Republic have jobs more amenable to WFH than men. This is because their jobs are less physically intensive. While women have jobs more intensive in face‑to‑face interaction, they are also more likely than men to use ICT at work to conduct those interactions. Accordingly, they are more likely to have internet connectivity at home. However, there are at least three important caveats. These estimates do not consider the role of essential sectors or the fact that women in the Dominican Republic are more likely to be the caregivers at home. Accordingly, they do not consider the fact that while health and social services jobs are on average more amenable to working from home, several of these workers are the most likely to be working outside the home during the pandemic. These three factors may shift the gender patterns in the amenability to WFH.
Finally, the sectors less amenable to working from home are agriculture, construction, hotels and restau‑rants, and commerce. In contrast, jobs in finance, real estate, and public administration are more prone to be done at home.

32
2.4 GENDER
Gender gaps in the labor market of the Dominican Republic have been shrinking, but important challenges remain. Women’s labor force participation and employment rates have increased significantly in the Dominican Republic, especially since 2009 (Figure 11). This helped reduce the gender gap significantly, since men’s outcomes have been stable during this period. According to these dimensions, gender gaps in the Dominican Republic are at about the average for Latin America and the Caribbean, including comparator countries (Figure 12, and World Bank 2020). However, several indicators suggest that gender inequities are still important. For example, while women represent 65 percent of college enrollment and 80 percent of those who graduate with honors, they continue to be overrepresented among those with poorer job outcomes (World Bank 2018b).
The gender gap in earnings is stubbornly rigid, despite significant changes in the labor market’s gender balance. The raw gender pay gap (that is, the simple difference between hourly earnings across genders) in terms of hourly earnings has remained stable since 2000, hovering between 6 and 16 percent (Figure 23). However, when accounting by the fact that employed women tend to have higher levels of education than men, the gender earnings gap increases to about 23 percent in 2018. This gap has also been stable since 2000, as the confidence intervals tend to overlap, and no clear trend emerges. A simple Oaxaca‑Blinder decomposition shows that while the higher levels of education of women contributes to reduce the gender gap, the disproportionate concentration of women in lower‑paid sectors (such as domestic service) contributes to widen it.
While male tertiary graduates are slightly more likely to participate and have a job than their less educated counterparts, tertiary education is associated with significantly better women’s labor market outcomes. As seen in Figure 24, while tertiary educated men are about 6.6 percentage points more likely to have a job than their peers without schooling, the corresponding figure for women is 34.4 percentage points. This is a large magnitude considering that the female employment rate is only about 48.6 percent. While it is important that education pays off in terms of better labor market outcomes, its different role across genders also shows that women with low to medium levels of education do not have many opportunities in the labor market. In other words, the employment gender gap is very narrow for people with high levels of education,
FIGURE B.4.1Jobs amenability to WFH by household per capita income deciles
1 2 3 4 5 6 7 8 9 10
WFH index (left axis) Home Internet (right axis)
0
10
20
30
40
50
60
70
Ho
me
Inte
rnet
(p
erce
nta
ge
po
ints
)
–0.6
–0.4
–0.2
0
0.2
0.4
0.6
0.8
WFH
ind
ex (
stan
dar
d
dev
iati
on
s fr
om
th
e m
ean
)
Note: The WFH measure is an index that reflects standard deviations from the average. A higher value indicates more amenability to working from home. Home internet measures the fraction of individuals with internet connectivity at home.

33
FIGURE 23Hourly earnings gender gap
2000 2001 2002 2003 2004 2005 2006 2007 2008 2009 2010 2011 2012 2013 2014 2015 2016 2017 2018
Unconditional Conditional 95 CI–30
–25
–20
–15
–10
–5
0
Perc
enta
ge
po
ints
Source: Own elaboration based on the ENFT 2000–2016 and ENCFT 2017–2018.
Note: Each bar shows the difference in the log earnings between men and women. The red dots show the coefficient associated with a dummy variable equal to one if the respondent is female, from a regression of log hourly earnings including, as control variables, education, age, sector, type of employer, geographic area, and formal status. The dotted lines are the 95 percent confidence intervals.
FIGURE 24Correlates of labor market status
Individual age
Primary incomplete
Secondary incomplete
Secondary complete
Some tertiary / post-secondary
Ever married
Size of household
Number of children
Number of youth
Number of elderly
UnemploymentEmployment Out of LF
UnemploymentEmployment Out of LF
0 0.1 0.40.30.2 –0.02 0 0.060.040.02 –0.4 –0.3 0–0.1–0.2Av. marginal effects Av. marginal effects Av. marginal effects
Av. marginal effects Av. marginal effects Av. marginal effects–0.1 0 0.20.1 –0.04 –0.02 0.020 –0.2 –0.1 0.10
Male Female
A. Individual characteristics
B. Household characteristics
Source: Own estimates using the Job Diagnostic Supply tool and ENCFT 2018.
Note: Each dot shows the marginal effect of the corresponding characteristic on the probability of being employed, unemployed or out of the labor force. The horizontal lines are the 95 percent confidence intervals.

34
but it is very large for those that did not graduate from college. More specifically, while college educated men and women have employment rates of 90 and 79 percent, respectively, those figures are 85 and 51 percent for their counterparts with primary education.
While men have higher employment rates and work more hours weekly according to most statistics, the latter do not capture well the amount of unpaid work that relies on women. According to a time‑use survey conducted in 2016, women allocate more than 31 hours (or 61 percent of their work hours) to unpaid work per week, while men allocate only 9.6 (or 21 percent of their work hours) to unpaid work.9 When adding up the number of paid and unpaid working hours per week, women work 4 hours more than men, which is equivalent to about 8.6 percent of men’s working hours. The fraction of unpaid working hours for women in the Dominican Republic is slightly above the average for the Latin America and the Caribbean region. The number of unpaid working hours by women (and the gap with men) does not vary significantly with educational attainment, that is, it is high even for women whose opportunity cost of unpaid work is high (as measured by foregone paid work hours). One key factor associated with a large gender gap in unpaid work is having children in the household. That is, most of the time allocated to family care responsibilities relies on women. While the gender gap in family care responsibilities tends to decline with income, it is still high for households in the highest socioeconomic status. These patterns of gender‑biased unpaid work reflect views regarding not only the role of women in the household, but also in the labor market. In countries where anti‑egalitarian views regarding gender roles are more common, women employment rates are lower and gender pay gaps are wider (Fortin 2005).
Teenage pregnancy in the Dominican Republic is one of the highest in the world and may contribute to poor human capital accumulation and labor market outcomes. In 2018, there were 93 births per 1,000 women ages 15 to 19 years in the Dominican Republic. This number is not only high in absolute terms, but also when compared to countries at the same level of development (Figure 25a). This figure has declined since 2000, but the gap with other countries in the region has not shrunk (Figure 25b). More importantly, teenage pregnancy is highly linked to exclusion and poverty in the Dominican Republic. According to the Demographic and Health Survey (DHS) 2013, more than one‑third (35.1 percent) of teenagers in the poorest quintile had children or were pregnant at the time of the survey (Centro de Estudios Sociales y Demográficos 2013). That fraction was 8.7 percent for the richest quintile. Accordingly, about half of teenagers with at most fourth grade education had a child or is pregnant, while that faction is 8.6 for those with tertiary education. Teenage pregnancy is higher
9 ONE and Ministerio de la Mujer 2016.
FIGURE 25Adolescent fertility
Dominican Republic
60
70
80
90
100
110
Ad
ole
scen
t Fe
rtili
ty R
ate
2000 2005 2010 2015 2018Year
Dominican Republic LAC
0
50
100
150
200
6 8 10 12
GDP level, log
Ad
ole
scen
t Fe
rtili
ty R
ate
A. By level of development B. Trends
Source: Own elaboration based on WDI data.
Note: Each number shows the number of births per 1,000 women ages 15–19.

35
in rural areas, but the gap is smaller than that by education or wealth. Empirical evidence for other countries shows that teenage pregnancy is associated with a host of negative economic outcomes later in life, including lower levels of education and poorer labor market outcomes.10 This association between teenage pregnancy and poverty in the Dominican Republic may contribute to perpetuate the vicious cycle of poverty, lack of human capital, and poor labor market outcomes. In addition to these negative impacts on mothers, teenage motherhood can increase fiscal pressures by increasing dependence on social assistance income, health‑related costs both in prevention and health‑care provision, costs of prevention programs, among other items (Azevedo et al. 2012).
2.5 MIGRATION
The Dominican Republic is both a migrant‑sending and migrant‑receiving country. There were almost 600,000 immigrants in the Dominican Republic in 2017, representing 5.6 percent of the total population (ENI 2017). When adding up those of immigrant descent, the numbers rise to about 850,000 (8.4 percent of the population). Most of the immigrant population were born in Haiti. There is a very sharp labor market segmentation across immigrants and non‑immigrants. While Haitian immigrants have employment rates higher than that of Dominicans, the quality of their jobs is worse. Even when controlling for other factors, Haitians earn significantly lower wages than Dominicans (Carneiro and Sirtaine 2017). About 68.4 percent of immigrant workers are concentrated in only three economic sectors, all of which tend to be more informal, such as agriculture, construction, and commerce, while only 36.6 percent of non‑immigrant workers are in those sectors. In addition to being less skilled than the non‑immigrant population and having language barriers, the foreign‑born (and their children) are unlikely to have the necessary documents to be eligible for a formal job (Carneiro and Sirtaine 2017). In 2017, only 5.6 percent of the population born in Haiti had a Dominican identification card (ENI 2017).11 However, due to a large effort to extend legal residence since 2013, 30.7 percent of Haitian immigrants had a registration card (Carnet de regularización para extranjeros o estiquer) by 2017. Nevertheless, while immigrants have equal rights to the native‑born in many aspects, actual access to many services are not the same across both groups. For example, Haitian‑born immigrants are less likely to have access to health or education (OECD/ILO 2018). Accordingly, while immigrants can have access to the social security system, only in 2016 the government started to provide alternative documentations so that they can actually be included in the system. As a result, the enrollment of Haitians in the system increased dramatically, although their absolute numbers are still very low, of about 6,300 in 2017 (INM 2017).
While there have been concerns about the impacts of immigration on the labor market outcomes of the local population, the evidence does not support such concerns. Given the high level of labor market segmentation, Dominicans’ labor market outcomes are not responsive to changes in the share of immigrants in the local area. Sousa, Sanchez, and Baez (2017) find that even unskilled Dominican men—who are more likely to compete directly with Haitian workers—are not affected in terms of lower wages. In contrast, they find evidence consistent with a scale or efficiency effect, as the presence of Haitian labor may help firms increase output and thereby the wages of unskilled Dominican workers.
In contrast to the skills profile of immigrants, Dominican emigrants tend to be more skilled than the local population. Almost 1.2 million Dominicans lived in the United States in 2018, and more than 400,000 in other countries in 2016 (World Bank 2018b).12 Among those living in the United States, almost two‑thirds had complete secondary education or higher, compared to just 40 percent of Dominicans living in the Dominican Republic. This may suggest that there is a weak local demand for the skills of a large share of the population in the Dominican Republic.
10 Azevedo et al. (2012) argues that estimating the impacts of teenage pregnancy is challenging because of several omitted variables and endogeneity issues. However, some papers address these issues using natural experiments or econometric techniques. See, for example, Ashcraft, Fernández‑Val, and Lang (2013); Fletcher and Wolfe (2009); and Kane et al. (2013) for the United States; Arceo‑Gómez and Campos‑Vázquez (2014) for Mexico; and Berthelon and Kruger (2012) for Chile.11 Dominican identification cards include birth certificate, ID card (celula de identidad Dominicana para Dominicanos y para extranjeros), and Dominican Passport.12 The data for 2018 come from the Migration Policy Institute (MPI) Data Hub https://www.migrationpolicy.org/programs/migration‑data‑hub.

36
The outflows of Dominicans abroad also affect the Dominican Republic labor market through remittances. These increased dramatically since 2000, from about US$1.8 to 6.8 billion (current US$) in 2018, representing about 8 percent of GDP. Remittances are an important source of income for many Dominican households. In fact, moderate and extreme poverty would increase about 2–3 and 1–2 percentage points, respectively, in the absence of remittances (World Bank 2018b). However, they may also have the unintended consequence of raising the reservation wage and weakening the incentives to look for a job. In 2018, women and men living in households that receive remittances were 6 and 10 percent less likely to be working or looking for a job (Figure 26). These negative associations between receiving remittances and labor market outcomes was stronger for those who did not complete high school and were in the 25–54 years age group. While they do not necessarily prove that remittances have a causal effect on employment and labor market participation, these findings do raise concerns about the more limited labor market engagement of remittance‑recipient households.
CONCLUSION
While the quantity of jobs is in line with the employment rates observed in other countries, the Dominican Republic is lagging in terms of the quality of jobs. Real wages are stagnant, informality is stubbornly high, gender gaps are pervasive, and jobs are intensive on the skills of the past.
Real wages in 2018 were lower than in 2000. Informality is very high, with 58 percent of workers not contributing to a pension fund. These workers tend to be low skilled and in small firms. Labor market gender gaps are large. While female labor force participation increased, the wage gender gap remained stagnant. While women work fewer hour than men outside the house, they work substantially more unpaid hours, mostly on childcare. When analyzing the type of tasks that Dominicans carry out at work and benchmark them against other countries, they are mostly focused on routine tasks that are more prone to be automated with new technologies. In contrast, the Dominican Republic lags countries at the same level of development in terms of the sophistication of the tasks that workers undertake. For example, jobs in the Dominican Republic are not intensive in cognitive or interpersonal skills that complement new technologies. High immigration rates and low inclusivity of migrants in the labor market resulted in a dual structure that is not conducive to leveraging labor market complementarities of natives and immigrants.
FIGURE 26Remittances and labor market outcomes, 2018
–16
–14
–12
–10
–8
–6
–4
–2
0Women Men
Less thanhigh
schoolHigh school Urban
Gender Education Area Age
Perc
enta
ge
po
ints
Active Employed
Rural15–24years
24–34years
35–44years
45–54years
55–64yearsCollege
Source: Own estimates based on data from ENCFT 2018.
Notes: Each bar shows the marginal effects associated with a dummy variable equal to one if the individual lives in a household that receives remittances. All coefficients are statistically significant at significance level of at least 10 percent, except for college graduates. The regression output is displayed in Table AA.5.

37
ANNEX A. ADDITIONAL TABLESTABLE AA.1
Correlates of informality
(1) (2) (3)
Informal Sector Informal EmploymentInformal employment
in informal sector
Education (omitted: Primary incomplete)
Primary complete –0.0383*** –0.0202 –0.0377***
(0.0127) (0.0125) (0.0127)
Secondary incomplete –0.0688*** –0.0522*** –0.0676***
(0.0116) (0.0115) (0.0117)
Secondary complete –0.0981*** –0.0882*** –0.0985***
(0.0107) (0.0106) (0.0107)
Tertiary incomplete –0.137*** –0.115*** –0.137***
(0.0133) (0.0131) (0.0133)
Tertiary complete –0.153*** –0.165*** –0.151***
(0.0130) (0.0128) (0.0130)
Age (omitted: 15–24 years)
[25,40] 0.0316*** –0.0113 0.0328***
(0.00999) (0.00988) (0.0100)
[41,64] 0.0566*** –0.00754 0.0588***
(0.0104) (0.0102) (0.0104)
Men 0.0277*** 0.00764 0.0268***
(0.00815) (0.00805) (0.00818)
Urban 0.0154 –0.000944 0.0148
(0.00970) (0.00959) (0.00973)
Regions (omitted: Ozama)
Cibao Norte –0.0331*** –0.0514*** –0.0331***
(0.0102) (0.0100) (0.0102)
Cibao Sur 0.00498 –0.0406*** 0.00490
(0.0143) (0.0142) (0.0144)
Cibao Nordeste 0.00149 –0.0492*** 0.000854
(0.0151) (0.0149) (0.0151)

38
(1) (2) (3)
Informal Sector Informal EmploymentInformal employment
in informal sector
Cibao Noroeste 0.0133 0.00663 0.0156
(0.0184) (0.0182) (0.0184)
Valdesia –0.0302** 0.0126 –0.0279**
(0.0126) (0.0125) (0.0126)
El Valle –0.0296 0.0102 –0.0306
(0.0228) (0.0225) (0.0229)
Enriquillo 0.0157 0.0386** 0.0181
(0.0197) (0.0195) (0.0198)
Higuamo –0.0274* –0.0375** –0.0254
(0.0162) (0.0160) (0.0162)
Yuma –0.118*** –0.0995*** –0.117***
(0.0140) (0.0138) (0.0140)
Sector (omitted: Agriculture)
Fishing 0.0387 0.0418 0.0407
(0.0756) (0.0747) (0.0759)
Mining and quarrying –0.199** –0.174** –0.199**
(0.0835) (0.0826) (0.0838)
Manufacturing –0.127*** –0.0820*** –0.128***
(0.0174) (0.0172) (0.0175)
Electricity, gas and water supply –0.295*** –0.143*** –0.295***
(0.0320) (0.0316) (0.0321)
Construction 0.0329* 0.0392** 0.0351**
(0.0170) (0.0168) (0.0171)
Wholesale and retail trade –0.0902*** –0.0460*** –0.0903***
(0.0152) (0.0150) (0.0152)
Hotels and restaurants –0.139*** –0.0889*** –0.140***
(0.0184) (0.0182) (0.0185)
Transport, storage and communications –0.0405** –0.0235 –0.0409**
(0.0175) (0.0173) (0.0175)
Financial intermediation –0.224*** –0.188*** –0.223***
(0.0254) (0.0251) (0.0255)
Real estate, renting and business activities –0.296*** –0.223*** –0.299***
(0.0217) (0.0215) (0.0218)

39
(1) (2) (3)
Informal Sector Informal EmploymentInformal employment
in informal sector
Public administration and defense –0.205*** –0.149*** –0.205***
(0.0215) (0.0213) (0.0216)
Education –0.190*** –0.143*** –0.192***
(0.0211) (0.0208) (0.0211)
Health and social work –0.282*** –0.199*** –0.283***
(0.0228) (0.0225) (0.0229)
Other services –0.146*** –0.0850*** –0.146***
(0.0177) (0.0175) (0.0178)
Extraterritorial organizations and bodies –0.256 –0.341 –0.255
(0.451) (0.445) (0.452)
Firm size (omitted: 1–10 workers)
11 to 19 –0.636*** –0.589*** –0.635***
(0.0139) (0.0137) (0.0139)
20 to 30 –0.671*** –0.683*** –0.669***
(0.0156) (0.0155) (0.0157)
31 to 50 –0.677*** –0.699*** –0.674***
(0.0165) (0.0163) (0.0165)
51 to 99 –0.685*** –0.709*** –0.683***
(0.0200) (0.0198) (0.0201)
100+ –0.681*** –0.738*** –0.678***
(0.0119) (0.0117) (0.0119)
Constant 0.900*** 0.985*** 0.896***
(0.0192) (0.0190) (0.0193)
Observations 7,824 7,824 7,824
R-squared 0.639 0.643 0.636
Standard errors in parentheses
*** p<0.01, ** p<0.05, * p<0.1
Source: Own estimates based on ENCFT 2018.
Note: OLS estimates. Each coefficient is the marginal effect of the corresponding variable on the likelihood of being in the informal sector (column 1), employment (column 2) or both (column 3).

40
TABLE AA.2Earnings equation, 2018
(1) (2) (3) (4) (5) (6) (7)
Dependent variable: Log (hourly earnings)
Salaried WorkersSelf-employed and Employers
Informal sector –0.316*** –0.0477 –0.101*** 0.0403 –0.417***
(0.0272) (0.0365) (0.0304) (0.0369) (0.0594)
Informal employment –0.346*** –0.334*** –0.194*** –0.214***
(0.0215) (0.0308) (0.0264) (0.0323)
Firm size (omitted: 1–10 workers)
11 to 19 0.190*** 0.150*** 0.156***
(0.0307) (0.0305) (0.0310)
20 to 30 0.266*** 0.210*** 0.215***
(0.0340) (0.0343) (0.0347)
31 to 50 0.421*** 0.363*** 0.369***
(0.0357) (0.0360) (0.0364)
51 to 99 0.314*** 0.255*** 0.260***
(0.0423) (0.0426) (0.0429)
100+ 0.463*** 0.399*** 0.404***
(0.0287) (0.0296) (0.0299)
Complete primary 0.164*** 0.143*** 0.164*** 0.155*** 0.155*** 0.157*** 0.0888**
(0.0370) (0.0321) (0.0365) (0.0362) (0.0360) (0.0360) (0.0391)
Incomplete secondary 0.225*** 0.184*** 0.220*** 0.221*** 0.218*** 0.219*** 0.109***
(0.0340) (0.0299) (0.0335) (0.0334) (0.0332) (0.0332) (0.0360)
Complete secondary 0.329*** 0.276*** 0.311*** 0.309*** 0.298*** 0.300*** 0.246***
(0.0309) (0.0272) (0.0305) (0.0302) (0.0301) (0.0301) (0.0344)
Incomplete tertiary 0.503*** 0.442*** 0.478*** 0.462*** 0.451*** 0.453*** 0.355***
(0.0352) (0.0322) (0.0348) (0.0346) (0.0344) (0.0344) (0.0519)
Complete secondary 1.152*** 1.074*** 1.112*** 1.099*** 1.081*** 1.082*** 0.632***
(0.0341) (0.0314) (0.0338) (0.0336) (0.0335) (0.0335) (0.0520)
25–54 years 0.286*** 0.253*** 0.258*** 0.238*** 0.228*** 0.228*** 0.223***
(0.0241) (0.0229) (0.0239) (0.0238) (0.0238) (0.0238) (0.0399)
55–64 years 0.455*** 0.403*** 0.414*** 0.387*** 0.371*** 0.372*** 0.286***
(0.0269) (0.0253) (0.0268) (0.0268) (0.0267) (0.0267) (0.0392)

41
(1) (2) (3) (4) (5) (6) (7)
Dependent variable: Log (hourly earnings)
Salaried WorkersSelf-employed and Employers
Woman –0.157*** –0.108*** –0.147*** –0.118*** –0.119*** –0.117*** –0.414***
(0.0202) (0.0184) (0.0200) (0.0200) (0.0198) (0.0199) (0.0327)
Urban –0.123*** –0.128*** –0.131*** –0.127*** –0.129*** –0.131*** –0.0587*
(0.0272) (0.0241) (0.0269) (0.0266) (0.0264) (0.0264) (0.0311)
Cibao Norte –0.0569** –0.0637*** –0.0632** –0.0368 –0.0441* –0.0445* 0.269***
(0.0259) (0.0241) (0.0256) (0.0253) (0.0252) (0.0252) (0.0361)
Cibao Sur –0.103*** –0.133*** –0.123*** –0.0835** –0.0988*** –0.100*** 0.108**
(0.0377) (0.0340) (0.0372) (0.0367) (0.0365) (0.0366) (0.0482)
Cibao Nordeste –0.178*** –0.240*** –0.208*** –0.130*** –0.154*** –0.156*** –0.0253
(0.0443) (0.0391) (0.0437) (0.0432) (0.0431) (0.0431) (0.0471)
Cibao Noroeste –0.0443 –0.0557 –0.0382 –0.0183 –0.0168 –0.0170 0.273***
(0.0515) (0.0478) (0.0507) (0.0503) (0.0501) (0.0501) (0.0586)
Valdesia –0.154*** –0.0652** –0.121*** –0.127*** –0.113*** –0.110*** –0.109***
(0.0342) (0.0305) (0.0338) (0.0336) (0.0335) (0.0335) (0.0425)
El Valle –0.0768 –0.0815 –0.0369 –0.0102 0.00332 0.00728 –0.161**
(0.0730) (0.0672) (0.0720) (0.0708) (0.0704) (0.0705) (0.0702)
Enriquillo –0.167*** –0.145*** –0.124** –0.1000* –0.0826 –0.0793 –0.327***
(0.0620) (0.0564) (0.0613) (0.0605) (0.0601) (0.0602) (0.0605)
Higuamo –0.152*** –0.152*** –0.152*** –0.132*** –0.135*** –0.135*** –0.254***
(0.0420) (0.0384) (0.0414) (0.0408) (0.0406) (0.0406) (0.0586)
Yuma 0.121*** 0.0962*** 0.119*** 0.138*** 0.131*** 0.134*** 0.0561
(0.0348) (0.0320) (0.0343) (0.0339) (0.0337) (0.0337) (0.0515)
Industry low tech –0.0575 –0.172*** –0.0511 –0.0998* –0.0957* –0.0912 –0.0467
(0.0577) (0.0435) (0.0569) (0.0564) (0.0560) (0.0561) (0.0887)
Industry high tech 0.0608 –0.0673 0.0658 0.0273 0.0329 0.0354 0.354***
(0.0596) (0.0456) (0.0588) (0.0583) (0.0579) (0.0580) (0.0723)
Construction 0.246*** 0.119** 0.243*** 0.179** 0.181*** 0.185*** 0.376***
(0.0717) (0.0602) (0.0707) (0.0702) (0.0697) (0.0699) (0.0447)
Commerce –0.0633 –0.174*** –0.0459 –0.0406 –0.0372 –0.0328 0.157***
(0.0495) (0.0316) (0.0488) (0.0481) (0.0477) (0.0479) (0.0438)
Utilities and transport –0.00261 –0.114*** 0.00856 –0.0394 –0.0343 –0.0288 0.155***
(0.0571) (0.0423) (0.0563) (0.0556) (0.0550) (0.0553) (0.0472)

42
(1) (2) (3) (4) (5) (6) (7)
Dependent variable: Log (hourly earnings)
Salaried WorkersSelf-employed and Employers
Skilled services 0.0364 –0.0828** 0.0400 0.0688 0.0637 0.0688 0.669***
(0.0557) (0.0402) (0.0549) (0.0544) (0.0539) (0.0541) (0.0722)
Public sector 0.112** –0.0207 0.0968* –0.00817 –0.0108 –0.00596
(0.0561) (0.0410) (0.0554) (0.0551) (0.0546) (0.0548)
Education and health –0.0691 –0.186*** –0.0522 –0.0529 –0.0516 –0.0460 0.0845*
(0.0514) (0.0324) (0.0507) (0.0501) (0.0495) (0.0498) (0.0513)
Special Economic Zone –0.0619 –0.118** –0.107** –0.234*** –0.245*** –0.245***
(0.0479) (0.0466) (0.0474) (0.0487) (0.0484) (0.0484)
Constant 4.050*** 4.270*** 4.129*** 3.836*** 3.927*** 3.917*** 4.497***
(0.0564) (0.0457) (0.0561) (0.0572) (0.0574) (0.0581) (0.0835)
Observations 4,003 4,488 4,003 3,908 3,908 3,908 3,457
R–squared 0.413 0.419 0.430 0.460 0.465 0.466 0.255
Standard errors in parentheses
*** p<0.01, ** p<0.05, * p<0.1
Source: Own estimates based on ENCFT 2018.
Note: OLS estimates. All specifications control for educational attainment, gender, location, sector, age, and occupation.

43
Vari
able
s
(1)
(2)
(3)
(4)
(5)
(6)
(7)
(8)
(9)
(10)
(11)
(12)
(13)
(14)
(15)
(16)
(17)
(18)
(19)
(20)
Non
-rou
tine
ana
lyti
cal
Non
-rou
tine
inte
rper
sona
lRo
utin
e co
gnit
ive
Rout
ine
man
ual
Non
-rou
tine
man
ual
Diffe
rent
ial
Endo
wm
ents
Coef
ficie
nts
Inte
ract
ion
Diffe
rent
ial
Endo
wm
ents
Coef
ficie
nts
Inte
ract
ion
Diffe
rent
ial
Endo
wm
ents
Coef
ficie
nts
Inte
ract
ion
Diffe
rent
ial
Endo
wm
ents
Coef
ficie
nts
Inte
ract
ion
Diffe
rent
ial
Endo
wm
ents
Coef
ficie
nts
Inte
ract
ion
Educ
atio
n: M
ediu
m0.
0205
***
–0.0
122*
**–0
.004
75**
*0.
0150
***
–0.0
0764
***
–0.0
0297
***
–0.0
0775
***
0.00
679*
**0.
0026
4***
–0.0
0961
***
0.02
00**
*0.
0077
7***
0.00
218*
**0.
0073
1***
0.00
284*
**
(9.4
7e–0
5)(0
.000
234)
(9.2
2e–0
5)(6
.86e
–05)
(0.0
0016
3)(6
.42e
–05)
(4.4
2e–0
5)(0
.000
126)
(4.9
8e–0
5)(6
.27e
–05)
(0.0
0017
6)(7
.28e
–05)
(6.5
6e–0
5)(0
.000
223)
(8.7
3e–0
5)
Educ
atio
n: H
igh
0.06
44**
*0.
0060
7***
0.00
295*
**0.
0417
***
0.00
165*
**0.
0008
02**
*–0
.030
0***
–0.0
0181
***
–0.0
0088
0***
–0.0
226*
**0.
0164
***
0.00
797*
**0.
0080
6***
0.00
426*
**0.
0020
7***
(0.0
0026
0)(0
.000
177)
(8.6
4e–0
5)(0
.000
169)
(0.0
0012
3)(6
.00e
–05)
(0.0
0012
2)(9
.52e
–05)
(4.6
3e–0
5)(0
.000
103)
(0.0
0013
5)(7
.16e
–05)
(6.9
9e–0
5)(0
.000
169)
(8.2
3e–0
5)
25–3
4 ye
ars
–0.0
0018
2***
–0.0
0315
***
0.00
0165
***
–0.0
0021
6***
–0.0
0749
***
0.00
0391
***
0.00
0375
***
–0.0
0035
0**
1.83
e–05
**0.
0003
09**
*0.
0063
0***
–0.0
0032
9***
–0.0
0032
7***
0.00
697*
**–0
.000
364*
**
(1.1
0e–0
5)(0
.000
284)
(1.5
3e–0
5)(8
.84e
–06)
(0.0
0019
8)(1
.38e
–05)
(1.0
4e–0
5)(0
.000
153)
(7.9
8e–0
6)(1
.10e
–05)
(0.0
0021
0)(1
.34e
–05)
(1.2
6e–0
5)(0
.000
270)
(1.6
5e–0
5)
35–4
4 ye
ars
–0.0
0027
0***
–0.0
0269
***
6.42
e–05
***
–0.0
0028
1***
–0.0
103*
**0.
0002
47**
*0.
0004
33**
*–0
.001
28**
*3.
06e–
05**
*0.
0003
16**
*0.
0140
***
–0.0
0033
3***
–0.0
0025
2***
0.01
44**
*–0
.000
343*
**
(1.5
5e–0
5)(0
.000
265)
(7.2
5e–0
6)(1
.58e
–05)
(0.0
0018
5)(1
.43e
–05)
(2.4
0e–0
5)(0
.000
143)
(3.8
0e–0
6)(1
.78e
–05)
(0.0
0019
8)(1
.89e
–05)
(1.4
5e–0
5)(0
.000
253)
(1.9
8e–0
5)
45–5
4 ye
ars
0.00
145*
**0.
0034
3***
0.00
0880
***
0.00
208*
**–0
.000
978*
**–0
.000
250*
**–0
.003
04**
*–0
.003
77**
*–0
.000
965*
**–0
.003
58**
*0.
0121
***
0.00
311*
**0.
0008
34**
*0.
0118
***
0.00
303*
**
(3.4
7e–0
5)(0
.000
180)
(4.6
5e–0
5)(2
.80e
–05)
(0.0
0012
5)(3
.22e
–05)
(2.8
5e–0
5)(9
.70e
–05)
(2.5
8e–0
5)(3
.75e
–05)
(0.0
0013
5)(4
.12e
–05)
(3.3
1e–0
5)(0
.000
172)
(4.9
2e–0
5)
55–6
4 ye
ars
0.00
168*
**–0
.001
32**
*–0
.000
634*
**0.
0026
5***
–0.0
0324
***
–0.0
0155
***
–0.0
0299
***
0.00
0745
***
0.00
0357
***
–0.0
0455
***
0.00
772*
**0.
0037
0***
0.00
0905
***
0.00
443*
**0.
0021
2***
(3.9
5e–0
5)(0
.000
107)
(5.1
3e–0
5)(3
.16e
–05)
(7.5
0e–0
5)(3
.70e
–05)
(2.7
6e–0
5)(5
.76e
–05)
(2.7
7e–0
5)(4
.17e
–05)
(8.2
0e–0
5)(4
.46e
–05)
(3.7
9e–0
5)(0
.000
103)
(5.0
6e–0
5)
Men
0.00
0931
***
0.00
861*
**–0
.000
728*
**0.
0012
1***
–0.0
0923
***
0.00
0781
***
0.00
372*
**–0
.003
33**
*0.
0002
82**
*–0
.005
86**
*0.
0253
***
–0.0
0214
***
–0.0
121*
**0.
0196
***
–0.0
0166
***
(3.2
8e–0
5)(0
.000
526)
(4.4
7e–0
5)(2
.44e
–05)
(0.0
0036
7)(3
.15e
–05)
(3.0
7e–0
5)(0
.000
283)
(2.4
0e–0
5)(4
.76e
–05)
(0.0
0039
4)(3
.63e
–05)
(8.7
6e–0
5)(0
.000
502)
(4.3
9e–0
5)
Info
rmal
0.00
555*
**0.
0592
***
–0.0
0500
***
0.00
423*
**0.
0365
***
–0.0
0308
***
–0.0
0277
***
–0.0
272*
**0.
0023
0***
0.00
139*
**0.
0262
***
–0.0
0221
***
0.00
103*
**0.
0139
***
–0.0
0117
***
(7.8
0e–0
5)(0
.000
908)
(8.9
0e–0
5)(5
.73e
–05)
(0.0
0063
7)(6
.06e
–05)
(4.1
1e–0
5)(0
.000
490)
(4.6
3e–0
5)(5
.04e
–05)
(0.0
0069
1)(6
.17e
–05)
(5.9
6e–0
5)(0
.000
871)
(7.4
4e–0
5)
Smal
l priv
ate
firm
–0.0
0011
9***
–0.0
822*
**0.
0029
9***
–0.0
0085
2***
–0.0
620*
**0.
0022
5***
0.00
172*
**0.
0338
***
–0.0
0123
***
–1.2
5e–0
50.
0345
***
–0.0
0125
***
–0.0
0067
4***
–0.0
184*
**0.
0006
68**
*
(2.7
1e–0
5)(0
.000
949)
(6.8
5e–0
5)(2
.56e
–05)
(0.0
0066
5)(5
.07e
–05)
(3.7
1e–0
5)(0
.000
512)
(3.0
6e–0
5)(2
.21e
–05)
(0.0
0072
3)(3
.61e
–05)
(2.9
8e–0
5)(0
.000
910)
(3.5
6e–0
5)
Publ
ic se
ctor
6.88
e–05
**0.
0068
5***
0.00
179*
**–0
.000
890*
**0.
0015
7***
0.00
0410
***
–0.0
0188
***
–0.0
0811
***
–0.0
0212
***
0.00
0292
***
0.00
504*
**0.
0013
1***
–0.0
0245
***
–0.0
0351
***
–0.0
0091
6***
(3.3
9e–0
5)(0
.000
172)
(4.7
3e–0
5)(2
.53e
–05)
(0.0
0012
0)(3
.15e
–05)
(2.4
6e–0
5)(9
.34e
–05)
(3.0
2e–0
5)(2
.78e
–05)
(0.0
0013
0)(3
.56e
–05)
(3.9
5e–0
5)(0
.000
164)
(4.3
5e–0
5)
Urba
n0.
0072
2***
–0.0
104*
**–0
.002
22**
*0.
0058
1***
–0.0
0775
***
–0.0
0165
***
–0.0
0375
***
0.00
541*
**0.
0011
5***
0.00
0449
***
–0.0
0604
***
–0.0
0128
***
0.00
585*
**–0
.019
2***
–0.0
0409
***
(8.3
2e–0
5)(0
.000
561)
(0.0
0011
9)(5
.97e
–05)
(0.0
0039
1)(8
.32e
–05)
(4.5
2e–0
5)(0
.000
302)
(6.4
3e–0
5)(6
.64e
–05)
(0.0
0041
6)(8
.84e
–05)
(8.1
3e–0
5)(0
.000
534)
(0.0
0011
4)
Indu
stry
low
tech
–0.0
253*
**0.
0025
7***
–0.0
0147
***
–0.0
124*
**0.
0069
8***
–0.0
0398
***
0.01
48**
*–0
.008
94**
*0.
0051
0***
–0.0
340*
**–0
.021
8***
0.01
25**
*–0
.015
6***
0.01
08**
*–0
.006
15**
*
(0.0
0011
2)(0
.000
207)
(0.0
0011
8)(6
.67e
–05)
(0.0
0014
4)(8
.30e
–05)
(6.3
4e–0
5)(0
.000
112)
(6.5
7e–0
5)(0
.000
128)
(0.0
0015
5)(9
.55e
–05)
(8.9
2e–0
5)(0
.000
196)
(0.0
0011
4)
TABLE AA.3Changes in the skill content of jobs 2000–2016, Oaxaca decomposition

44
Vari
able
s
(1)
(2)
(3)
(4)
(5)
(6)
(7)
(8)
(9)
(10)
(11)
(12)
(13)
(14)
(15)
(16)
(17)
(18)
(19)
(20)
Non
-rou
tine
ana
lyti
cal
Non
-rou
tine
inte
rper
sona
lRo
utin
e co
gnit
ive
Rout
ine
man
ual
Non
-rou
tine
man
ual
Diffe
rent
ial
Endo
wm
ents
Coef
ficie
nts
Inte
ract
ion
Diffe
rent
ial
Endo
wm
ents
Coef
ficie
nts
Inte
ract
ion
Diffe
rent
ial
Endo
wm
ents
Coef
ficie
nts
Inte
ract
ion
Diffe
rent
ial
Endo
wm
ents
Coef
ficie
nts
Inte
ract
ion
Diffe
rent
ial
Endo
wm
ents
Coef
ficie
nts
Inte
ract
ion
Indu
stry
hig
h te
ch–0
.005
62**
*0.
0059
3***
–0.0
0111
***
–0.0
0318
***
0.00
494*
**–0
.000
923*
**0.
0042
3***
–0.0
0221
***
0.00
0414
***
–0.0
0322
***
0.00
137*
**–0
.000
256*
**–0
.003
62**
*0.
0061
4***
–0.0
0115
***
(8.8
8e–0
5)(0
.000
114)
(2.7
4e–0
5)(5
.05e
–05)
(7.9
8e–0
5)(2
.06e
–05)
(6.6
3e–0
5)(6
.13e
–05)
(1.3
1e–0
5)(5
.15e
–05)
(8.4
0e–0
5)(1
.62e
–05)
(5.8
1e–0
5)(0
.000
109)
(2.7
0e–0
5)
Cons
truct
ions
0.00
316*
**0.
0016
2***
0.00
0178
***
0.00
224*
**0.
0033
4***
0.00
0368
***
–0.0
0155
***
–0.0
0124
***
–0.0
0013
7***
0.00
311*
**–0
.002
37**
*–0
.000
261*
**0.
0009
08**
*0.
0026
5***
0.00
0292
***
(8.9
6e–0
5)(0
.000
104)
(1.2
5e–0
5)(6
.35e
–05)
(7.3
0e–0
5)(1
.31e
–05)
(4.4
0e–0
5)(5
.61e
–05)
(7.2
8e–0
6)(8
.80e
–05)
(7.7
6e–0
5)(1
.13e
–05)
(2.6
8e–0
5)(9
.93e
–05)
(1.3
7e–0
5)
Com
mer
ce0.
0108
***
0.00
137*
**0.
0001
21**
*0.
0076
0***
0.00
739*
**0.
0006
51**
*–0
.008
41**
*0.
0007
38**
*6.
50e–
05**
*–0
.003
07**
*–0
.006
47**
*–0
.000
570*
**0.
0059
4***
0.00
148*
**0.
0001
30**
*
(0.0
0016
1)(0
.000
349)
(3.0
8e–0
5)(0
.000
113)
(0.0
0024
3)(2
.35e
–05)
(0.0
0012
5)(0
.000
188)
(1.6
6e–0
5)(4
.83e
–05)
(0.0
0025
8)(2
.42e
–05)
(9.0
0e–0
5)(0
.000
332)
(2.9
3e–0
5)
Utili
ties
& Tr
ansp
ort
0.00
652*
**0.
0018
1***
0.00
0343
***
0.00
396*
**0.
0047
1***
0.00
0892
***
–0.0
0392
***
–0.0
0176
***
–0.0
0033
3***
0.00
0147
***
–0.0
0271
***
–0.0
0051
3***
0.01
68**
*0.
0039
0***
0.00
0738
***
(9.9
5e–0
5)(0
.000
120)
(2.3
2e–0
5)(6
.06e
–05)
(8.4
0e–0
5)(2
.07e
–05)
(5.9
7e–0
5)(6
.45e
–05)
(1.3
2e–0
5)(1
.32e
–05)
(8.9
2e–0
5)(1
.85e
–05)
(0.0
0025
4)(0
.000
114)
(2.4
3e–0
5)
Skill
ed s
ervi
ces
0.01
12**
*–0
.000
597*
**–0
.000
191*
**0.
0067
9***
0.00
169*
**0.
0005
42**
*–0
.004
39**
*–0
.001
89**
*–0
.000
604*
**–0
.004
44**
*0.
0001
32*
4.22
e–05
*0.
0045
9***
–0.0
0088
5***
–0.0
0028
3***
(0.0
0012
6)(9
.67e
–05)
(3.1
0e–0
5)(7
.68e
–05)
(6.7
7e–0
5)(2
.24e
–05)
(5.0
1e–0
5)(5
.23e
–05)
(1.8
0e–0
5)(5
.25e
–05)
(7.2
5e–0
5)(2
.32e
–05)
(5.5
4e–0
5)(9
.23e
–05)
(2.9
7e–0
5)
Publ
ic se
ctor
0.00
739*
**–0
.002
72**
*–0
.000
906*
**0.
0048
9***
–0.0
0029
8***
–9.9
5e–0
5***
–0.0
0272
***
–9.6
3e–0
5*–3
.22e
–05*
–0.0
0354
***
0.00
264*
**0.
0008
80**
*0.
0043
9***
0.00
420*
**0.
0014
0***
(9.4
6e–0
5)(9
.23e
–05)
(3.2
7e–0
5)(6
.29e
–05)
(6.4
2e–0
5)(2
.15e
–05)
(3.6
0e–0
5)(4
.95e
–05)
(1.6
5e–0
5)(4
.78e
–05)
(6.9
5e–0
5)(2
.55e
–05)
(5.9
0e–0
5)(8
.87e
–05)
(3.4
1e–0
5)
Educ
atio
n &
heal
th0.
0308
***
–0.0
0290
***
–0.0
0104
***
0.02
23**
*0.
0016
2***
0.00
0583
***
–0.0
156*
**–0
.003
19**
*–0
.001
15**
*–0
.012
4***
0.00
338*
**0.
0012
2***
0.00
948*
**0.
0053
0***
0.00
191*
**
(0.0
0018
3)(0
.000
220)
(7.9
3e–0
5)(0
.000
132)
(0.0
0015
3)(5
.52e
–05)
(9.3
4e–0
5)(0
.000
119)
(4.3
1e–0
5)(8
.35e
–05)
(0.0
0016
4)(5
.93e
–05)
(7.6
7e–0
5)(0
.000
210)
(7.6
1e–0
5)
Dom
estic
wor
kers
0.00
0330
***
0.00
0355
***
0.00
0128
***
–0.0
0062
6***
0.00
0964
***
0.00
0347
***
–0.0
0253
***
–0.0
0063
6***
–0.0
0022
9***
–0.0
0263
***
–0.0
0036
4***
–0.0
0013
1***
0.00
246*
**0.
0001
60*
5.75
e–05
*
(2.3
5e–0
5)(8
.96e
–05)
(3.2
3e–0
5)(1
.79e
–05)
(6.2
6e–0
5)(2
.28e
–05)
(2.9
3e–0
5)(4
.83e
–05)
(1.7
6e–0
5)(3
.34e
–05)
(6.7
1e–0
5)(2
.42e
–05)
(3.4
4e–0
5)(8
.55e
–05)
(3.0
8e–0
5)
Tota
l0.
140*
**–0
.048
2***
–0.0
0845
***
0.10
2***
–0.0
378*
**–0
.006
24**
*–0
.066
1***
0.02
05**
*0.
0046
9***
–0.1
04**
*–0
.017
0***
0.02
92**
*0.
0285
***
–0.0
0187
***
–0.0
0086
5***
(0.0
0038
7)(0
.000
367)
(0.0
0021
1)(0
.000
255)
(0.0
0025
6)(0
.000
148)
(0.0
0017
5)(0
.000
198)
(0.0
0011
6)(0
.000
266)
(0.0
0027
6)(0
.000
170)
(0.0
0028
3)(0
.000
348)
(0.0
0020
0)
Aver
age
valu
e in
20
00
0.04
24**
*0.
0126
***
0.00
418*
**0.
0920
***
0.05
88**
*
(0.0
0033
8)(0
.000
225)
(0.0
0016
4)(0
.000
206)
(0.0
0027
4)
Aver
age
valu
e in
20
16
–0.0
415*
**–0
.045
4***
0.04
50**
*0.
183*
**0.
0331
***
(0.0
0036
2)(0
.000
246)
(0.0
0017
8)(0
.000
271)
(0.0
0030
0)
Diffe
renc
e0.
0839
***
0.05
80**
*–0
.040
8***
–0.0
913*
**0.
0257
***
(0.0
0049
5)(0
.000
334)
(0.0
0024
2)(0
.000
341)
(0.0
0040
6)

45
Vari
able
s
(1)
(2)
(3)
(4)
(5)
(6)
(7)
(8)
(9)
(10)
(11)
(12)
(13)
(14)
(15)
(16)
(17)
(18)
(19)
(20)
Non
-rou
tine
ana
lyti
cal
Non
-rou
tine
inte
rper
sona
lRo
utin
e co
gnit
ive
Rout
ine
man
ual
Non
-rou
tine
man
ual
Diffe
rent
ial
Endo
wm
ents
Coef
ficie
nts
Inte
ract
ion
Diffe
rent
ial
Endo
wm
ents
Coef
ficie
nts
Inte
ract
ion
Diffe
rent
ial
Endo
wm
ents
Coef
ficie
nts
Inte
ract
ion
Diffe
rent
ial
Endo
wm
ents
Coef
ficie
nts
Inte
ract
ion
Diffe
rent
ial
Endo
wm
ents
Coef
ficie
nts
Inte
ract
ion
Cons
tant
–0.0
278*
**–0
.000
160
0.03
89**
*–0
.152
***
–0.0
772*
**
(0.0
0167
)(0
.001
16)
(0.0
0089
8)(0
.001
23)
(0.0
0159
)
Obs
erva
tions
17,6
7117
,671
17,6
7117
,671
17,6
7117
,671
17,6
7117
,671
17,6
7117
,671
17,6
7117
,671
17,6
7117
,671
17,6
7117
,671
17,6
7117
,671
17,6
7117
,671
Sour
ce: O
wn
estim
ates
bas
ed o
n EN
FT 2
006–
2016
.

46
(1)
(2)
(3)
(4)
(5)
(6)
(7)
(8)
(9)
(10)
(11)
(12)
(13)
(14)
(15)
(16)
(17)
Dep
ende
nt v
aria
ble:
Log
(ear
ning
s)
2000
2001
2002
2003
2004
2005
2006
2007
2008
2009
2010
2011
2012
2013
2014
2015
2016
Non
-rout
ine
anal
ytica
l0.
248*
**0.
107*
*0.
225*
**0.
157*
**0.
240*
**0.
145*
**0.
203*
**0.
165*
**0.
115*
**0.
183*
**0.
233*
**0.
198*
**0.
141*
**0.
120*
**0.
181*
**0.
213*
**0.
0677
*
(0.0
422)
(0.0
475)
(0.0
432)
(0.0
390)
(0.0
372)
(0.0
396)
(0.0
402)
(0.0
404)
(0.0
373)
(0.0
386)
(0.0
399)
(0.0
382)
(0.0
387)
(0.0
379)
(0.0
370)
(0.0
376)
(0.0
374)
Non
-rout
ine
inte
rper
sona
l0.
347*
**0.
343*
**0.
269*
**0.
350*
**0.
154*
**0.
282*
**0.
185*
**0.
220*
**0.
365*
**0.
258*
**0.
217*
**0.
175*
**0.
210*
**0.
260*
**0.
145*
**0.
0592
0.23
8***
(0.0
583)
(0.0
657)
(0.0
590)
(0.0
539)
(0.0
514)
(0.0
535)
(0.0
542)
(0.0
547)
(0.0
486)
(0.0
511)
(0.0
523)
(0.0
504)
(0.0
508)
(0.0
491)
(0.0
487)
(0.0
490)
(0.0
489)
Rout
ine
cogn
itive
–0.1
56**
*–0
.284
***
–0.2
12**
*–0
.235
***
–0.2
09**
*–0
.189
***
–0.1
52**
*–0
.103
**–0
.027
3–0
.119
***
–0.0
637
–0.1
32**
*–0
.090
6**
–0.1
14**
*–0
.169
***
–0.1
72**
*–0
.284
***
(0.0
475)
(0.0
526)
(0.0
482)
(0.0
451)
(0.0
422)
(0.0
443)
(0.0
446)
(0.0
434)
(0.0
418)
(0.0
433)
(0.0
434)
(0.0
414)
(0.0
415)
(0.0
398)
(0.0
389)
(0.0
402)
(0.0
395)
Rout
ine
man
ual
0.02
660.
0263
0.02
400.
0417
**0.
0314
*–0
.006
99–0
.013
20.
0024
50.
0187
0.04
26**
–0.0
338*
–0.0
0458
0.02
430.
0146
0.02
940.
0101
0.03
54*
(0.0
193)
(0.0
218)
(0.0
204)
(0.0
183)
(0.0
173)
(0.0
181)
(0.0
189)
(0.0
185)
(0.0
181)
(0.0
197)
(0.0
202)
(0.0
194)
(0.0
199)
(0.0
191)
(0.0
187)
(0.0
193)
(0.0
186)
Non
-rout
ine
man
ual
0.04
08**
0.04
36**
0.06
93**
*0.
0374
***
0.07
37**
*0.
0892
***
0.07
53**
*0.
0706
***
0.07
16**
*0.
0657
***
0.09
94**
*0.
0837
***
0.08
74**
*0.
0526
***
0.06
77**
*0.
0562
***
0.01
21
(0.0
172)
(0.0
173)
(0.0
161)
(0.0
144)
(0.0
139)
(0.0
144)
(0.0
149)
(0.0
143)
(0.0
136)
(0.0
145)
(0.0
151)
(0.0
145)
(0.0
143)
(0.0
141)
(0.0
137)
(0.0
141)
(0.0
136)
Cons
tant
2.10
6***
2.34
7***
2.21
6***
2.19
4***
2.49
1***
2.61
0***
2.72
1***
2.79
5***
2.89
4***
3.06
0***
3.08
3***
3.10
7***
3.17
6***
3.25
9***
3.04
1***
3.19
0***
3.32
5***
(0.0
696)
(0.0
779)
(0.0
713)
(0.0
674)
(0.0
639)
(0.0
647)
(0.0
658)
(0.0
665)
(0.0
637)
(0.0
664)
(0.0
664)
(0.0
626)
(0.0
665)
(0.0
641)
(0.0
651)
(0.0
656)
(0.0
648)
Obs
erva
tions
7,59
97,
291
7,48
09,
911
9,44
410
,029
9,90
79,
882
10,1
8610
,075
10,0
9410
,189
9,90
710
,160
10,1
019,
937
9,84
4
R-sq
uare
d0.
329
0.25
10.
315
0.29
90.
288
0.27
50.
283
0.26
30.
299
0.30
00.
278
0.30
40.
286
0.31
70.
285
0.29
10.
294
Stan
dard
erro
rs in
par
enth
eses
***
p<0.
01, *
* p<
0.05
, * p
<0.
1
Sour
ce: O
wn
estim
ates
bas
ed o
n EN
FT 2
000
to 2
016.
Not
es: T
hese
are
the
coe
ffici
ents
fro
m a
n O
LS r
egre
ssio
n us
ing
log
earn
ings
as
the
depe
nden
t va
riabl
e. C
ontr
ols
incl
ude
age,
age
‑squ
ared
, gen
der,
firm
typ
e, a
rea,
and
sec
tor.
TABLE AA.4Earnings’ returns to skills

47
(1)
(2)
(3)
(4)
(5)
(6)
(7)
(8)
(9)
(10)
(11)
(12)
Dep
ende
nt v
aria
ble:
Lab
or fo
rce
part
icip
atio
n
Wom
enM
enLe
ss t
han
high
sch
ool
Hig
h sc
hool
Colle
geRu
ral
Urb
an15
–24
year
s24
–34
year
s35
–44
year
s45
–54
year
s55
–64
year
s
Rece
ives
rem
ittan
ces
–0.0
615*
**–0
.099
9***
–0.1
34**
*–0
.068
2***
–0.0
403
–0.0
855*
**–0
.098
6***
–0.0
506*
–0.1
12**
*–0
.115
***
–0.1
42**
*–0
.078
5**
(0.0
176)
(0.0
144)
(0.0
169)
(0.0
203)
(0.0
346)
(0.0
281)
(0.0
137)
(0.0
261)
(0.0
230)
(0.0
244)
(0.0
276)
(0.0
374)
Cons
tant
0.25
2***
0.58
2***
0.37
9***
0.54
7***
0.63
6***
0.43
1***
0.44
6***
0.41
0***
0.77
9***
0.79
1***
0.75
5***
0.63
9***
(0.0
167)
(0.0
117)
(0.0
133)
(0.0
207)
(0.0
484)
(0.0
156)
(0.0
0864
)(0
.019
6)(0
.018
1)(0
.016
8)(0
.019
5)(0
.026
7)
Obs
erva
tions
6,57
36,
451
7,70
04,
188
1,13
63,
336
9,68
83,
690
2,89
82,
590
2,26
01,
586
R-sq
uare
d0.
145
0.20
80.
149
0.08
40.
052
0.10
30.
144
0.03
20.
015
0.02
40.
027
0.01
4
Dep
ende
nt v
aria
ble:
Em
ploy
ed
Wom
enM
enLe
ss t
han
high
sch
ool
Hig
h sc
hool
Colle
geRu
ral
Urb
an15
–24
year
s24
–34
year
s35
–44
year
s45
–54
year
s55
–64
year
s
Rece
ives
rem
ittan
ces
–0.0
598*
**–0
.133
***
–0.1
45**
*–0
.090
9***
–0.0
310
–0.1
00**
*–0
.113
***
–0.0
846*
**–0
.130
***
–0.1
32**
*–0
.137
***
–0.0
714*
(0.0
176)
(0.0
153)
(0.0
171)
(0.0
213)
(0.0
384)
(0.0
285)
(0.0
142)
(0.0
256)
(0.0
253)
(0.0
262)
(0.0
288)
(0.0
376)
Cons
tant
0.18
2***
0.53
4***
0.33
7***
0.45
7***
0.56
7***
0.38
1***
0.37
1***
0.36
5***
0.73
3***
0.77
4***
0.74
4***
0.63
7***
(0.0
168)
(0.0
125)
(0.0
135)
(0.0
217)
(0.0
537)
(0.0
158)
(0.0
0892
)(0
.019
2)(0
.019
9)(0
.018
0)(0
.020
3)(0
.026
8)
Obs
erva
tions
6,57
36,
451
7,70
04,
188
1,13
63,
336
9,68
83,
690
2,89
82,
590
2,26
01,
586
R-sq
uare
d0.
155
0.22
30.
157
0.10
90.
055
0.11
30.
157
0.02
60.
015
0.02
30.
022
0.01
1
Stan
dard
erro
rs in
par
enth
eses
***
p<0.
01, *
* p<
0.05
, * p
<0.
1
Sour
ce: O
wn
estim
ates
bas
ed o
n EN
FT 2
000
to 2
016.
Not
es: T
hese
are
the
coe
ffici
ents
fro
m a
n O
LS r
egre
ssio
n us
ing
log
earn
ings
as
the
depe
nden
t va
riabl
e. C
ontr
ols
incl
ude
age,
age
‑squ
ared
, gen
der,
firm
typ
e, a
rea,
and
sec
tor.
TABLE AA.5Remittances and labor market outcomes


49
3. LABOR DEMAND
This chapter provides new evidence on patterns of job creation and labor market bottlenecks in the Dominican Republic from the firms’ side. Thereby, it helps fill an important knowledge gap in our understanding of the Dominican Republic’s labor market. It shows that the jobs landscape in the formal sector is highly dominated by large and old firms. New entrants and young firms play a negligible role, despite contributing disproportionately to productivity and wage growth. While productivity increases with the size of the firm, the average wages they pay do not. Thus, the evidence provided in this chapter may help provide new insights on the disconnect between productivity and wages in the Dominican Republic.
INTRODUCTION
This chapter reviews the structure of jobs in the formal business sector based on data from the Direccion General de Impuestos Internos (DGII) and the Tesoreria de la Seguridad Social (TSS) for the Dominican Republic, and other complementary datasets from comparator countries that serve as benchmarks. The analysis only covers enterprises that are formally registered, which represents a limited subset of all enterprises in the Dominican Republic. However, the formal sector plays an important role in wage‑based employment, which represents the most promising source of good jobs in the long run.
Wage employment in the formal sector of the economy is determined by the entry and growth of firms. Profit‑maximizing firms will only hire workers up to the point where their estimated marginal productivity equals marginal cost (wages and benefits). The existence of business opportunities and the ability of entrepreneurs and investors to finance investments and appropriate the returns are important determinants of these dynamics. Labor market distortions, on the other hand, both policy‑induced and from market failures, can lead to market segmentation or otherwise interfere with the labor market’s efficient allocation of resources, and thereby hamper job growth. Chapter 3 begins by presenting a profile of the formal sector enterprises in the Dominican Republic, followed by an analysis of the determinants of employments, wages, and productivity. Attention here focuses on whether firms and workers appear to be responding to market signals in a competitive manner or show signs of rigidity that could be linked to market distortions or protectionist policies.
3.1 DEMOGRAPHY OF FIRMS
Job dynamics in the private formal sector of the Dominican Republic are dominated by old and large firms. Almost half of all jobs in the formal private sector are in firms 11 years or older and with at least 100 employees (Figure 27a). These firms represent less than 3 percent of the total number of firms in the formal private sector. In contrast, only about 14 and 17 percent of jobs are in formal younger firms ages 5 years or lower and in formal firms with 19 employees or lower, respectively. When compared to other countries, the concentration of jobs in old and large firms in the Dominican Republic becomes even more disproportionate.

50
For example, the concentration of employment in this group of firms is about 20 percent in Turkey and Georgia, and 34 percent in Vietnam.13
The concentration of employment in old and large firms exacerbated since 2007. The 2008–2009 financial crisis increased the share of employment in larger firms even more, as lack of access to finance tends to affect smaller firms disproportionately (Figure 28a). Since 2009, however, the fraction of employment accounted by firms with at least 500 employees remained rather stable. Employment became increasingly concentrated in older firms since 2007 (Figure 28c). While young firms ages 5 years or less accounted for 18 percent of employment in 2007, that figure was 11 percent in 2018. These estimates suggest that the entry and growth of new firms plays a very limited role in the process of job creation in the formal private sector in the Dominican Republic.
The large concentration of employment in small firms in the informal sector together with the negligible share of employment in small and young firms in the formal sector suggests that the barriers to formalization are high. As shown in Chapter 2, about half of the jobs in the Dominican Republic are in the informal sector, that is in firms that are not registered with the tax authority or do not follow formal accounting procedures. These firms tend to be small. Informality is often a symptom of low productivity and low wages, but it is also part of a vicious cycle. High informality could reflect that the benefits associated with paying taxes
13 Data for Jordan, Moldova, and Bangladesh also show a smaller concentration of formal employment in large and old firms, from 15 percent in Bangladesh, to about 28 in Jordan, and 40 percent in Moldova.
FIGURE 27Distribution of formal employment by size and age of the firm
10+6–10
2–51 Age (y
ears)
Number of employees1–9 10–19 20–99 100+
60
Perc
enta
ge
po
ints 50
40
30
20
10
0
10+6–10
2–51 Age (y
ears)
Number of employees1–9 10–19 20–99 100+
60
Perc
enta
ge
po
ints 50
40
30
20
10
0
10+6–10
2–51 Age (y
ears)
Number of employees1–9 10–19 20–99 100+
60
Perc
enta
ge
po
ints 50
40
30
20
10
0
10+6–10
2–51 Age (y
ears)
Number of employees1–9 10–19 20–99 100+
60
Perc
enta
ge
po
ints 50
40
30
20
10
0
A. Dominican Republic B. Vietnam
C. Turkey, 2016 D. Georgia
Source: (a) Own estimates based on data from DGII and TSS; (b) Cunningham and Pimhidzai (2019); (c) Erdogan and Del Carpio (2019); (d) Posadas et al. (2018).
Note: Each bar shows the share of total employment by firm size and age bracket.

51
or social security contributions are low. At the same time, high informality reduces the tax base and the viability of social insurance systems, which can result in a lower quantity and quality of public goods and services. This is particularly important in the Dominican Republic, where fiscal space is limited (Mele 2017).
3.2 FIRM DYNAMICS
The role of firm entry as a driver of labor demand is weak in the Dominican Republic. As shown above, the number of jobs in young firms represents a small and slightly declining share of total employment in the formal sector. In fact, the Dominican Republic ranks poorly in terms of the relative number of new businesses when compared to other countries. In a sample of 160 countries, the Dominican Republic ranks 86 position in terms of new business registrations per 1,000 working‑age people (Figure 29). While the Dominican Republic has about 1.5 new registrations per 1,000 people ages 15 to 64, the figures for Panama and Costa Rica are 4.8 and 2.6, respectively.
Not only entry but also the size of the new entrants matter for job creation. In the Dominican Republic, the average new firm in 2018 had 6.9 employees, about 23 percent of the number of employees of incumbent firms. However, there is substantial variation across firm types (Figure 30). While new firms in the least productive quartile were about 39 percent the size of incumbents, that fraction was only 15 percent among the most productive quartile. In other words, the more productive entrants create relatively less jobs than the less productive ones. Accordingly, the relative size of new firms is higher among those with a less skilled labor force, more labor intensive and less capital intensive.
FIGURE 28Firm and employment distribution by size and age
0102030405060708090
100
0102030405060708090
100
0102030405060708090
100
0102030405060708090
100
Perc
enta
ge
Perc
enta
ge
Perc
enta
ge
Perc
enta
ge
2007
2008
2009
2010
2011
2012
2013
2014
2015
2016
2017
2018
2007
2008
2009
2010
2011
2012
2013
2014
2015
2016
2017
2018
2007
2008
2009
2010
2011
2012
2013
2014
2015
2016
2017
2018
2007
2008
2009
2010
2011
2012
2013
2014
2015
2016
2017
2018
1–5 years 6–9 years 10+ years 1–5 years 6–9 years 10+ years
1–9 empl. 10–19 20–99 100–499 500+ 1–9 empl. 10–19 20–99 100–499 500+
A. Share of employment by size B. Share of firms by size
C. Share of employment by age D. Share of firms by age
Source: Own estimates based on data from DGII and TSS.

52
FIGURE 29New business density across the world, 2018
Dominican Republic
LBR
LAO
CO
DN
ERPA
KM
DG
TSA
CA
NA
RG
PRY
LMC
BFA
LDC
IDX
MM
REA
RH
PC
SEN
SAU
ETH
JOR
TGO
SSA
LKA
UG
AM
EXZM
BW
SM BR
AN
PLD
EUG
RC
DO
MR
WA
VU
TJA
MLC
NA
ZEM
DA
MA
RC
OL
MY
S
TEC
ECA
AR
E
BH
R
LTU
BLZ
MK
DPE
RO
EDX
KX
CEB
FRA
SVK
HR
VQ
AT
NLD
RO
ULV
AM
US
DN
KB
GR
GEO
AU
SLU
XC
YP
TJK
IRN
SLV
HIC
SSF
IDB
STP
CR
I
ESP
ISR
FIN
IRL
EST
0
5
10
15
20
25
30
35
New
bu
sin
ess
den
sity
(n
ew r
egis
trat
ion
s p
er
1,00
0 p
eop
le a
ges
15–
64)
Source: WDI 2018.
BOX 5. MAIN FIRM-LEVEL DATASET USED IN THIS REPORT
The main firm‑level dataset used in this section is a random 10 percent sample of the population of firms registered in the tax authority administration (DGII). The sample covers the years 2007 to 2018, and the firms were randomly and independently selected with a 10 percent probability each tax year. Since most firms are observed only one year, in most cases the data is analyzed as repeated cross‑sections. The number of firms selected is large in principle, starting at 5,181 firms in 2007 to 9,066 in 2018. However, since many firms do not report number of employees and other key variables, the number of firms per year is about 1,000. In some cases, we do take advantage of the fact that some firms are observed in consecutive years, to understand some of the drivers of productivity, wage, and employment growth.
We also complement the DGII dataset with individual‑level data from the Social Security Administration (TSS), by linking them to the firm listed in the DGII data and thereby creating an employer‑employee matched dataset. The individual‑level data contains the gender, age, and salary of all employees in the firm.
The dataset allows to analyze entry of new businesses because it contains the date that the firm was established. It would, in theory, also allow for the analysis of exit because it contains the date of disso‑lution of each company, but this variable does not produce consistent results.
The data have some limitations. First, it does include the informal sector. However, while the latter represents a sizeable share of the Dominican Republic economy, empirical evidence shows that processes of growth and development come from the creation of highly productive formal firms (La Porta and Shleifer 2008). Second, given the large number of observations with missing values for variables that are critical to measure productivity, we define labor productivity as sales per worker, instead of as value added per worker.
Given the limited role of firm entry as a driver of job creation in the Dominican Republic, it is incumbents who play a more important role as drivers of labor demand. As seen in Figure 31, older firms create more jobs than younger ones. In particular, the net job creation of firms ages 20 years or more is 16.3 percent

53
higher than that of firms 5 years or younger. More productive incumbent firms create more jobs than their less productive counterparts. For example, those in the highest productivity quartile create 16.8 percent more jobs than those at the bottom of the productivity distribution. Firms with 20 to 499 employees create less jobs than their smaller and larger peers. In other words, when comparing firms by size, the ones that contribute the most to job creation are those with 19 employees or less, or with 500 employees or more.
FIGURE 30Relative employment size of new firms
39
2428
15
51
2519 18
27
43
65
32
20 18
0
10
20
30
40
50
60
70
Q1-low
Q2 Q3 Q4-high
Low-skill
High-skill
Q1-low
Q2 Q3 Q4-high
Q1-low
Q2 Q3 Q4-high
Productivity quartiles Skill Labor intensity Capital intensity
Perc
enta
ge
po
ints
(si
ze o
f n
ew fi
rms
rela
tive
to
siz
e o
f o
lder
firm
s)
Source: Own estimates based on data from DGII and TSS.
Note: Each bar is the number of employees of firms entering the market as a share of the average number of employees of incumbent firms in the same productivity, skill, labor, and capital intensity bracket, respectively. Productivity is measured as sales per worker; low‑skill (high‑skill) firms are those where at least 10 percent of the staff earns wages above the national median; labor intensity is the ratio of the wage bill to sales; capital intensity is the ratio of the value of fixed assets to sales.
FIGURE 31Correlates of net job creation among incumbent firms
Coefficient 95 CI
–0.25–0.2
–0.15–0.1
–0.050
0.050.1
0.150.2
0.25
10–19empl.
20–99empl.
100–499empl.
500+empl.
Q2 Q3 Q4 6–9years
10–19years
20+years
Firm size (omitted: 1–9 empl.) Labor productivity quartile (omitted: lowest quartile)
Age of the firm (omitted: 1–5 years)
Source: Own estimates based on data from DGII and TSS, 2012–2018.
Note: Each dot shows the coefficients from Table AB.2, column (6). They show the percentage change in employment by firms’ characteristics. The omitted categories are firms with 9 employees or less, in the lowest productivity quartile and ages 1–5 years.

54
3.3 PRODUCTIVITY
When comparing firms with the same age, wages, and productivity by firms’ size follow divergent paths. Firms with the highest levels of labor productivity—measured in this case as sales per worker—are larger and older (Figure 32). In particular, firms with at least 100 employees or created at least 20 years ago have levels of sales per worker about 63 and 109 percentage points higher than firms in the smallest and youngest group, respectively. Average wages at the firm level also tend to increase with the age of the firm, almost by the same percentage than productivity. However, while firms with 20 to 99 employees pay average wages 28 percentage points higher than firms with less than 20 employees, the wage premium associated with larger firms is significantly lower than the productivity premium. This is surprising considering that the worker‑level data analyzed in Chapter 2 indicated that wages paid by firms with at least 100 employees were higher than those paid by smaller firms. However, the firm‑level results are different because they control for firms’ age. Since older firms tend to be larger as well, both effects are confounded in the individual‑level data.
In the Dominican Republic, younger and larger firms have experienced larger productivity gains since 2012. Firms with 100 to 499 employees experienced labor productivity growth about 20 percent higher than firms with less than 10 employees (Table AB.5, column 6). In contrast, the contribution to productivity growth has a negative relationship with firms’ age, as older firms experienced significantly weaker productivity growth than younger ones. More specifically, firms ages 6 to 9 years experienced productivity growth about 17 percent lower than firms ages 5 years or younger. Firms aged at least 20 years had productivity growth about 32 percent lower than the youngest age group.
Productivity growth is strongly associated with wage growth at the micro level. Between 2012 and 2018, A 1 percent increase in productivity is associated with a 0.45 percent increase in average wages at the firm level (Table AB.4, column 6). Given that larger and younger firms are those who experienced higher productivity growth during this period (Table AB.5, column 6), they also made the largest contributions to wage growth.
Productivity matters for long‑term economic growth, but also has implications for wage inequality. As it is the case in other countries, wage differentials across firms are a more important driver of wage inequality than individual characteristics such as gender, age, and area of residence. As seen in Figure 33, almost a third
FIGURE 32Correlates of productivity and wage levels, 2012–2018
20–99 empl. 100+ empl. 6–9 years 10–19 years 20+ yearsNumber of employees
(omitted: less than 20 empl.)Age of the firm
(omitted: 1–5 years)
0
20
40
60
80
100
120
Perc
enta
ge
po
ints
Productivity Wages
Source: Own estimates based on data from DGII and TSS.
Note: Coefficients associated with size and age dummy variables, using the transformation to be expressed in percentage points (that is, (eβ–1) × 100). All are statistically significant at the 1 percent level. Full regression output can be found in Table AB.3, columns 2 and 4.

55
of the wage inequality of formal workers in the Dominican Republic is explained by inequality in the average wage paid by firms. Inequality in wages paid across sectors of economic activity and across firms with different productivity levels explain almost a quarter of the individual wage inequality. Given that wage and productivity levels go hand in hand, this means that more productivity dispersion across firms is related to higher wage inequality.
There is vast literature arguing that productivity dispersion is often a symptom of inefficiencies, where not all firms have access to the same prices and resources are not efficiently allocated across them (Cusolito and Maloney 2018). For example, if firms with good prospects with regard to productivity growth and job creation do not have access to finance. In the Dominican Republic, Azuero et al. (2019) show that economic distortions increased dramatically since 2007. They claim that younger and smaller firms are the most affected by these distortions and that the potential gains from removing such distortions are very high. In particular, the Dominican Republic would increase its Total Factor Productivity (TFP) by more than threefold.
3.4 BUSINESS ENVIRONMENT
According to the Doing Business 2020 indicators, the Dominican Republic ranks 115 out of 190 countries in the overall ease of doing business. This places the Dominican Republic among the weaker performers of the comparator countries in Latin America and the Caribbean (Figure 34). The Dominican Republic occupies a similar position in the Global Competitiveness Index (GCI) rankings, with an overall ranking of 78 out of 141 countries that also places it near the bottom of the range of comparator country rankings.14 The areas where the Dominican Republic ranks relatively worse with respect to comparator countries are getting electricity, getting credit, protecting minority investors, and resolving insolvency.
14 The World Bank’s Doing Business indicators are based on assessments by various national and international experts of a country’s legal and regulatory environment as they apply to the opening and operation of local firms. The GCI, prepared by the World Economic Forum and organized under 12 pillars, is built on various statistical indicators thought to be associated with a country’s productivity and long‑term prosperity, and obtained from either national or international (for example, IMF, World Bank, United Nations Development Programme [UNDP]) sources.
FIGURE 33Wage inequality decomposition, 2018
32.8
1.3 0.2
5.1
0.7
18.9
0.40
5
10
15
20
25
30
35
40
Age Size Productivity Capital intensity
Sector LocationFirms (observable and unobservable
characteristics)
Individual characteristics
(gender and age) Characteristics of the firm
Perc
enta
ge
po
ints
Source: Own estimates based on data from DGII and TSS.
Note: The share of the variance explained by observable and unobservable firms’ characteristics (first bar to the left) is the R‑squared of a regression of individual log wages on firm fixed effects. The share of the variance explained by observable firms’ characteristics (all bars except the first one to the left) was computed using a regression‑based inequality decomposition using the Stata command ineqrbd.

56
Unreliable access to electricity may have important impacts on the business environment. As mentioned above, the Dominican Republic ranks 116 in the Doing Business category getting electricity. Comparator countries rank significantly better according to this dimension. According to GCI 2019, the Dominican Republic ranks 90 and 79 out of 141 countries, in the level of access and quality of electricity supply (Schwab 2019). In fact, according to the World Bank Enterprise Surveys, electricity shortages last, on average, 7.4 days in the Dominican Republic and 2.1 days in the average Latin American and Caribbean economy. This leads several firms to invest in their own electrical infrastructure to compensate for a reliable service. Almost half of formal firms in the Dominican Republic own or share a power generator. That fraction is only 26 percent in Latin America and the Caribbean. Poor access to electricity affects small firms disproportionately, since the relative losses related to power outages decline with the size of the firm. Accordingly, cross‑country evidence suggests that quality upgrading decisions of firms are negatively related to electricity sector unreliability (World Bank 2018b).
Limited access to finance may affect firms’ ability to enter the market and grow. Even though the Dominican Republic ranks relatively well in access to credit by firms and individuals, interest rates are relatively high when compared to countries in the region except Brazil (World Bank 2018b). This may explain why the Dominican Republic has the lowest level of domestic credit to the private sector as a share of GDP among comparator countries in 2019, at 27.2 percent. In contrast, that figure goes from 50 percent in Colombia to 116.6 percent in Chile.15
The Dominican Republic ranks poor in market dominance perceptions. According to the GCI 2019, the Dominican Republic ranks 105 out of 141 countries in perceived market dominance. Poor products market competition may help explain the lack of sophistication and quality upgrading in the Dominican Republic exports (World Bank 2018b). The lack of competition seems particularly severe in the transportation sector.
The presence of special tax regimes also contributes to the uneven playing field: the Dominican Republic ranks 121 on the GCI according to the distortive effects of taxes and subsidies on competition. At the end of 2016, there were 8 tax laws that generated tax expenditures, and 31 regulations granting tax exemptions
15 WDI (https://data.worldbank.org/indicator/FS.AST.PRVT.GD.ZS?locations=DO‑PA‑CR‑BR‑CO‑CL), accessed on May 18, 2020.
FIGURE 34Doing Business Rankings
115
112
80
116
74
119
143
150
66
133 124
Overa
ll
rankin
g
Star
ting a
busines
s
Gettin
g
electr
icity
Regist
erin
g
proper
ty
Gettin
g
credit
Prote
cting
min
ority
inve
stors Pa
ying
taxe
s
Trad
ing ac
ross
border
s
Enfo
rcing
contra
cts
Resolvi
ng
inso
lvency
Dealin
g with
constr
uction
perm
its
Dominican Republic Brazil Chile Colombia Costa Rica Panama
0
20
40
60
80
100
120
140
160
180
200
Ran
kin
g (
po
siti
on
)
Source: Doing Business indicators.

57
to different sectors and for different reasons (World Bank 2018b). While these regimes have the goal of creating new jobs, they also have the consequence of lower tax revenues. According to Mele (2017), each job created in the Special Economic Zones (SEZs) costs five times more in terms of foregone tax revenues when compared to each job created due to a standard tax regime. Accordingly, the ratio between the fiscal cost of each new job and the average wage in the SEZs is 10 to 1, well above the ratio of 7 to 1 in the standard tax regime. Azuero et al. (2019) show that larger and older firms are more likely to use the special tax regimes, but they are not necessarily the most productive: over a 10‑year period, firms in special tax regimes reported almost no changes in size and productivity. These tax regimes also create a bias toward imports and disincentivize the creation of backward links between the exporting sector and the rest of the economy. By 2012, the SEZs acquired 81 percent of their inputs abroad (World Bank 2017b). The size of the SEZs is very large, they account for 3.3 percent of GDP and for 3.8 percent of employment.16
While the Dominican Republic does not stand out in regional comparisons as having unusually high minimum wages, the multiplicity of minimum wages may add distortions in the allocation of labor. Figure 35 shows the minimum wage for a representative worker (based on a 19‑year‑old cashier, with one year of experience in a grocery store), expressed as a percent of the value added of workers. With a minimum wage that is currently around 30 percent of the average value added per worker in the services sector, the Dominican Republic ranks among the countries with the lowest rates in the region. At such a low level, it appears unlikely that the minimum wage would be binding for many workers in the Dominican Republic in the sense of being close to or above the unconstrained market equilibrium wage level. However, while the representative minimum wage discussed above does not appear out of line in regional comparisons, it is important to recognize that there are at least 12 minimum wages coexisting in the Dominican Republic. Institutionally, these minimum wages are periodically set by a National Salary Committee in the Labor Ministry, which applies different rates for different sectors, firm sizes, and sometimes institutions. These minimum rates can vary by as much as 100 percent. When these rates are adjusted over time, the same rate of adjustment is often applied to all in an attempt to preserve the original wage dispersion. This is the case, for example, with the general, non‑sector‑specific rate. It distinguishes between large, medium, and small enterprises, which were subject to minimum wages of RD$2,895, RD$1,987, and RD$1,757, respectively, in 2000. The same
16 CNZFE (2018). The share of employment was calculated as the ratio of employment in SEZs (171,726 workers) to the total number of employed people (4,539,256) in 2018.
FIGURE 35Minimum wages in Latin America and the Caribbean
0
20
40
60
80
100
120
140
160
180
Mex
ico
Domin
ican
Rep
ublic Peru
Panam
aChile
Brazil
Jam
aica
Uruguay
Costa R
ica
Colom
bia
El Sa
lvador
Para
guay
Ecuad
or
Argen
tina
Guatem
ala
Honduras
Perc
ent
of
valu
e ad
ded
per
wo
rker
Source: Doing Business 2020, Country Profiles.
58
pattern holds for the sector‑specific minimum wages, such as the one for hotels, restaurants, and bars. The Free Export Zone is subject to a different minimum wage schedule from that applicable to enterprises under the Free Export Zone status located in depressed economic areas.
CONCLUSION
Large and old firms account for the vast majority of private sector jobs in the Dominican Republic. While this is true in other countries as well, it is much more pronounced in the Dominican Republic. The entry of new firms is weak, thereby most of the labor market dynamics are driven by incumbents. This is despite the fact that young and larger firms are those with the higher levels of productivity growth. Improving productivity is not only crucial for efficiency reasons, but also to increase wages and reduce inequality. While the relative low labor costs of the Dominican Republic should be an important factor to facilitate the entry and growth of new firms, other issues such as distortionary tax exemptions, poor competition, and infrastructure are important offsetting factors.

59
ANNEX B. ADDITIONAL TABLES(1
)(2
)(3
)(4
)(5
)(6
)(7
)(8
)(9
)(1
0)
By fi
rm s
ize
1–2
empl
.3–
4 em
pl.
5–9
empl
.10
–19
empl
.20
–49
empl
.50
–99
empl
.10
0+
empl
.
Valu
e ad
ded
(log)
, cha
nge
0.18
2***
0.09
77**
*0.
135*
**0.
285*
**0.
215*
**0.
206*
**0.
256*
**
(0.0
103)
(0.0
0809
)(0
.008
25)
(0.0
173)
(0.0
164)
(0.0
173)
(0.0
231)
Cons
tant
0.17
4*0.
0984
0.31
9***
0.32
9***
0.25
2***
0.11
10.
133
(0.1
02)
(0.0
748)
(0.0
673)
(0.0
923)
(0.0
950)
(0.1
10)
(0.1
14)
Obs
erva
tions
2,48
31,
819
2,31
91,
827
1,42
850
736
9
R-sq
uare
d0.
118
0.08
00.
118
0.13
90.
115
0.24
10.
289
Labo
r in
tens
ity
(wag
e bi
ll/as
sets
), de
cile
s
1
(low
est)
23
45
67
89
10
(hig
hest
)
Valu
e ad
ded
(log)
, cha
nge
0.12
4***
0.10
1***
0.11
2***
0.13
3***
0.12
6***
0.15
9***
0.22
3***
0.13
8***
0.11
3***
0.12
3***
(0.0
115)
(0.0
0867
)(0
.007
26)
(0.0
106)
(0.0
0764
)(0
.007
67)
(0.0
0962
)(0
.007
37)
(0.0
0739
)(0
.007
48)
Cons
tant
0.59
1***
0.31
4***
0.34
2***
0.07
230.
184*
**0.
0974
0.05
660.
231*
**0.
0870
0.07
26
(0.1
40)
(0.0
811)
(0.0
648)
(0.0
738)
(0.0
573)
(0.0
655)
(0.0
586)
(0.0
635)
(0.0
711)
(0.0
980)
Obs
erva
tions
2,38
82,
599
2,68
62,
711
2,72
32,
778
2,72
52,
742
2,70
02,
618
R-sq
uare
d0.
052
0.05
70.
094
0.05
90.
097
0.13
80.
168
0.11
80.
088
0.09
9
By a
ge o
f the
firm
0–1
year
s2–
3 ye
ars
4–5
year
s6–
9 ye
ars
10–1
4 ye
ars
15+
ye
ars
Valu
e ad
ded
(log)
, cha
nge
0.22
1***
0.17
3***
0.11
0***
0.11
3***
0.10
9***
0.06
81**
*
(0.0
132)
(0.0
0666
)(0
.006
37)
(0.0
0519
)(0
.006
53)
(0.0
0439
)
Cons
tant
0.59
3***
0.31
2***
0.37
3***
0.13
9***
0.12
3**
0.09
41**
(0.2
10)
(0.0
768)
(0.0
735)
(0.0
423)
(0.0
577)
(0.0
417)
Obs
erva
tions
1,25
85,
069
4,54
86,
935
5,97
47,
372
R-sq
uare
d0.
195
0.12
30.
069
0.06
70.
047
0.03
5
TABLE AB.1Determinants of changes in the wage bill (log), 2006–2018

60
(1)
(2)
(3)
(4)
(5)
(6)
(7)
(8)
(9)
(10)
(11)
(12)
(13)
(14)
Broa
d Se
ctor
s
Agr
icul
ture
Indu
stry
Serv
ices
Valu
e ad
ded
(log)
, cha
nge
0.13
9***
0.14
0***
0.14
8***
(0.0
136)
(0.0
0610
)(0
.002
88)
Cons
tant
0.25
9*0.
203*
**0.
214*
**
(0.1
46)
(0.0
713)
(0.0
286)
Obs
erva
tions
692
5,33
025
,159
R-sq
uare
d0.
143
0.09
40.
097
Det
aile
d se
ctor
s
Real
Est
ate
Who
lesa
le
and
Reta
ilCo
mm
u-
nica
tion
sCo
nstr
uc-
tion
Uti
litie
sM
inin
gH
otel
s an
d Re
stau
rant
sFi
nanc
eM
anuf
ac-
turi
ng
Spec
ial
Econ
omic
Zo
nes
Oth
er
Serv
ices
Educ
atio
nH
ealt
h
Tran
spor
t an
d St
orag
e
Valu
e ad
ded
(log)
, cha
nge
0.07
81**
*0.
179*
**0.
214*
**0.
0909
***
0.17
5***
0.66
0***
0.25
9***
0.15
2***
0.30
0***
0.18
2***
0.13
2***
0.08
65**
*0.
463*
**0.
108*
**
(0.0
0771
)(0
.004
39)
(0.0
238)
(0.0
0842
)(0
.034
2)(0
.225
)(0
.019
9)(0
.013
2)(0
.011
2)(0
.016
5)(0
.005
81)
(0.0
126)
(0.0
337)
(0.0
111)
Cons
tant
0.07
120.
230*
**0.
233
0.22
8*0.
385
–0.0
441
0.75
3***
–0.0
515
0.12
90.
186
0.31
2***
–0.0
977
–0.0
114
0.14
0
(0.0
979)
(0.0
379)
(0.1
58)
(0.1
29)
(0.3
08)
(0.8
73)
(0.1
75)
(0.1
15)
(0.0
826)
(0.1
72)
(0.0
699)
(0.1
98)
(0.1
86)
(0.1
17)
Obs
erva
tions
1,88
812
,043
464
2,27
722
237
764
992
2,57
843
85,
666
500
882
1,73
8
R-sq
uare
d0.
058
0.12
40.
186
0.05
70.
155
0.35
90.
204
0.13
20.
223
0.24
90.
088
0.13
40.
187
0.05
7
Sour
ce: O
wn
estim
ates
bas
ed o
n EN
FT 2
000
to 2
016.
Not
es: T
hese
are
the
coe
ffici
ents
fro
m a
n O
LS r
egre
ssio
n us
ing
log
earn
ings
as
the
depe
nden
t va
riabl
e. C
ontr
ols
incl
ude
age,
age
‑squ
ared
, gen
der,
firm
typ
e, a
rea,
and
sec
tor.

61
TABLE AB.2Employment growth
(1) (2) (3) (4) (5) (6)
Firm size (omitted: 1–9 employees)
10–19 employees –0.121*** –0.124*** –0.0402 –0.0469
(0.0357) (0.0356) (0.0348) (0.0345)
20–99 employees –0.149*** –0.156*** –0.0707** –0.0861***
(0.0299) (0.0299) (0.0291) (0.0289)
100–499 employees –0.215*** –0.239*** –0.127*** –0.166***
(0.0311) (0.0317) (0.0302) (0.0304)
500+ employees –0.164*** –0.172*** –0.0402 –0.0609*
(0.0335) (0.0339) (0.0326) (0.0327)
Labor productivity quartile (omitted: lowest quartile)
Q2 0.0562** 0.0638*** 0.0692*** 0.0632*** 0.0778*** 0.0844***
(0.0219) (0.0225) (0.0222) (0.0207) (0.0212) (0.0210)
Q3 0.130*** 0.142*** 0.141*** 0.145*** 0.139*** 0.147***
(0.0220) (0.0231) (0.0230) (0.0210) (0.0219) (0.0218)
Q4 0.177*** 0.178*** 0.178*** 0.170*** 0.169*** 0.168***
(0.0244) (0.0250) (0.0247) (0.0234) (0.0237) (0.0235)
Sectors (omitted: Agriculture)
Mining –0.228*** –0.210*** –0.217*** –0.175*** –0.146*** –0.171***
(0.0498) (0.0494) (0.0499) (0.0494) (0.0486) (0.0492)
Food and beverages –0.308*** –0.269*** –0.289*** –0.209*** –0.154*** –0.196***
(0.0515) (0.0511) (0.0519) (0.0507) (0.0499) (0.0507)
Textiles/leather –0.530*** –0.499*** –0.507*** –0.520*** –0.506*** –0.498***
(0.0992) (0.100) (0.0990) (0.0891) (0.0894) (0.0887)
SEZs –0.198*** –0.182*** –0.189*** –0.102** –0.0521 –0.0919**
(0.0448) (0.0412) (0.0446) (0.0447) (0.0411) (0.0442)
Other manufacturing –0.173*** –0.187*** –0.184*** –0.0719 –0.0912** –0.0900**
(0.0461) (0.0467) (0.0463) (0.0460) (0.0461) (0.0458)
Construction –0.141** –0.123** –0.137** –0.129** –0.121** –0.123**
(0.0547) (0.0557) (0.0552) (0.0542) (0.0546) (0.0543)
Wholesale and retail –0.241*** –0.212*** –0.242*** –0.115*** –0.0970** –0.118***
(0.0412) (0.0416) (0.0412) (0.0414) (0.0414) (0.0412)
Transport and communications –0.171*** –0.180*** –0.201*** –0.0482 –0.0583 –0.0838*
(0.0496) (0.0503) (0.0499) (0.0493) (0.0494) (0.0491)

62
(1) (2) (3) (4) (5) (6)
Other services –0.159*** –0.143*** –0.156*** –0.0805* –0.0631 –0.0750*
(0.0416) (0.0422) (0.0419) (0.0419) (0.0421) (0.0419)
Skilled jobs (omitted: zero skilled jobs)
Medium 0.0223 –0.0728** 0.0166 0.0971*** 0.0242 0.0809**
(0.0335) (0.0314) (0.0335) (0.0321) (0.0301) (0.0319)
High –0.0545* –0.148*** –0.0774*** 0.0349 –0.0350 0.00275
(0.0290) (0.0274) (0.0292) (0.0280) (0.0265) (0.0280)
Age of the firm (omitted: 1–5 years)
6–9 years –0.00589 0.00782 0.0339 0.0430*
(0.0249) (0.0247) (0.0237) (0.0236)
10–19 years –0.0147 0.0136 0.0552*** 0.0690***
(0.0221) (0.0222) (0.0209) (0.0210)
20+ years 0.0671*** 0.107*** 0.133*** 0.163***
(0.0243) (0.0246) (0.0232) (0.0234)
Constant 0.309*** 0.213*** 0.300*** –0.00165 –0.0853* –0.0325
(0.0486) (0.0482) (0.0503) (0.0484) (0.0476) (0.0499)
Region dummy variables Yes Yes Yes Yes Yes Yes
Weights Avg. employment
Avg. employment
Avg. employment
Lagged employment
Lagged employment
Lagged employment
Observations 1,898 1,898 1,898 1,898 1,898 1,898
R-squared 0.098 0.084 0.112 0.086 0.090 0.112
Standard errors in parentheses
*** p<0.01, ** p<0.05, * p<0.1
Source: Own estimates based on data from DGII and TSS.
TABLE AB.3Correlates of productivity and wage levels
(1) (2) (3) (4)
ln (sales per worker)
ln (sales per worker) ln (wage) ln (wage)
Number of employees (omitted: less than 20 employees)
20–99 employees 0.266*** 0.269*** 0.266*** 0.248***
(0.0250) (0.0247) (0.0172) (0.0236)
100+ employees 0.273*** 0.488*** 0.171*** 0.238***
(0.0460) (0.0234) (0.0318) (0.0223)

63
(1) (2) (3) (4)
ln (sales per worker)
ln (sales per worker) ln (wage) ln (wage)
Age of the firm (omitted: 1–5 years)
6–9 years 0.330*** 0.269*** 0.266*** 0.297***
(0.0237) (0.0282) (0.0163) (0.0270)
10–19 years 0.409*** 0.631*** 0.452*** 0.536***
(0.0220) (0.0235) (0.0151) (0.0224)
20+ years 0.467*** 0.736*** 0.622*** 0.666***
(0.0289) (0.0254) (0.0199) (0.0243)
Sectors (omitted: Agriculture)
Mining –0.448*** 0.823*** 0.171** 0.734***
(0.102) (0.0654) (0.0692) (0.0623)
Food and beverages –0.235** –0.436*** –0.158** –0.300***
(0.0956) (0.0542) (0.0653) (0.0520)
Textiles/leather –0.707*** –1.241*** –0.0697 –0.226*
(0.118) (0.139) (0.0812) (0.134)
SEZs –0.0499 –0.737*** 0.0587 –0.621***
(0.0878) (0.0510) (0.0598) (0.0490)
Other manufacturing –0.349*** –0.0950* 0.0196 0.314***
(0.0661) (0.0536) (0.0453) (0.0514)
Construction –0.0741 –0.218*** 0.144*** 0.311***
(0.0641) (0.0578) (0.0437) (0.0555)
Wholesale and retail 0.0890 0.278*** 0.107*** 0.492***
(0.0579) (0.0499) (0.0396) (0.0478)
Transport and communications –0.357*** –0.472*** 0.191*** 0.646***
(0.0653) (0.0577) (0.0447) (0.0554)
Other services –0.700*** –0.632*** 0.196*** 0.500***
(0.0584) (0.0495) (0.0399) (0.0475)
Regions (omitted: Santo Domingo)
Norte –0.510*** –0.340*** –0.416*** –0.568***
(0.0212) (0.0185) (0.0145) (0.0178)
Suroeste –0.360*** 0.177*** –0.399*** –0.557***
(0.0419) (0.0348) (0.0294) (0.0336)
Sureste –0.289*** –0.580*** –0.175*** –0.709***
(0.0343) (0.0248) (0.0237) (0.0237)

64
(1) (2) (3) (4)
ln (sales per worker)
ln (sales per worker) ln (wage) ln (wage)
Constant 6.752*** 6.531*** 4.465*** 4.242***
(0.0632) (0.0572) (0.0433) (0.0549)
Year fixed effects Yes Yes Yes Yes
Labor weights No Yes No Yes
Observations 24,397 24,397 24,816 24,816
R-squared 0.101 0.205 0.113 0.265
Standard errors in parentheses
*** p<0.01, ** p<0.05, * p<0.1
Source: Own estimates based on data from DGII and TSS.
TABLE AB.4Correlates of average wage growth
(1) (2) (3) (4) (5) (6)
Firm size (omitted: 1–9 employees)
10–19 employees 0.0123 0.0460 –0.000154 0.0305
(0.0473) (0.0466) (0.0479) (0.0470)
20–99 employees 0.0104 0.0653* 0.00276 0.0562
(0.0377) (0.0375) (0.0385) (0.0381)
100–499 employees –0.0279 0.0635 –0.0211 0.0649*
(0.0383) (0.0394) (0.0388) (0.0394)
500+ employees –0.0955** –0.0244 –0.101** –0.0395
(0.0419) (0.0425) (0.0426) (0.0427)
Labor productivity growth 0.512*** 0.471*** 0.469*** 0.511*** 0.459*** 0.456***
(0.0244) (0.0242) (0.0246) (0.0246) (0.0247) (0.0249)
Sectors (omitted: Agriculture)
Mining 0.127* 0.0934 0.148** 0.102 0.0595 0.119*
(0.0657) (0.0632) (0.0652) (0.0675) (0.0647) (0.0667)
Food and beverages 0.181*** 0.127* 0.192*** 0.154** 0.0898 0.162**
(0.0679) (0.0652) (0.0678) (0.0696) (0.0666) (0.0692)
Textiles/leather 0.164 0.170 0.176 0.138 0.150 0.152
(0.129) (0.126) (0.126) (0.120) (0.118) (0.118)
SEZs –0.0136 –0.0810 –0.00781 –0.0368 –0.116** –0.0364
(0.0575) (0.0516) (0.0567) (0.0598) (0.0539) (0.0588)

65
(1) (2) (3) (4) (5) (6)
Other manufacturing 0.139** 0.157*** 0.173*** 0.106* 0.120* 0.133**
(0.0605) (0.0598) (0.0600) (0.0628) (0.0618) (0.0620)
Construction –0.00114 –0.00767 –0.00433 –0.00246 –0.0155 –0.0163
(0.0717) (0.0707) (0.0710) (0.0739) (0.0728) (0.0730)
Wholesale and retail 0.119** 0.125** 0.135** 0.0884 0.0824 0.0921*
(0.0542) (0.0534) (0.0536) (0.0567) (0.0558) (0.0558)
Transport and communications 0.211*** 0.232*** 0.255*** 0.177*** 0.186*** 0.211***
(0.0646) (0.0638) (0.0640) (0.0667) (0.0656) (0.0657)
Other services 0.153*** 0.132** 0.145*** 0.120** 0.0867 0.0975*
(0.0545) (0.0538) (0.0539) (0.0572) (0.0564) (0.0563)
Age of the firm (omitted: 1–5 years)
6–9 years –0.170*** –0.184*** –0.186*** –0.202***
(0.0310) (0.0313) (0.0309) (0.0311)
10–19 years –0.177*** –0.184*** –0.196*** –0.203***
(0.0268) (0.0277) (0.0268) (0.0274)
20+ years –0.244*** –0.255*** –0.260*** –0.274***
(0.0299) (0.0313) (0.0301) (0.0312)
Constant –0.0548 0.0918* 0.0426 –0.0173 0.152*** 0.111*
(0.0596) (0.0529) (0.0602) (0.0622) (0.0558) (0.0628)
Region dummy variables Yes Yes Yes Yes Yes Yes
Weights Avg. employment
Avg. employment
Avg. employment
Lagged employment
Lagged employment
Lagged employment
Observations 1,751 1,751 1,751 1,751 1,751 1,751
R-squared 0.249 0.273 0.279 0.250 0.278 0.284
Standard errors in parentheses
*** p<0.01, ** p<0.05, * p<0.1
Source: Own estimates based on data from DGII and TSS.

66
TABLE AB.5Correlates of productivity growth
(1) (2) (3) (4) (5) (6)
Firm size (omitted: 1–9 employees)
10–19 employees 0.0893* 0.120** 0.0375 0.0679
(0.0535) (0.0526) (0.0538) (0.0526)
20–99 employees 0.0846** 0.145*** 0.0243 0.0875**
(0.0424) (0.0422) (0.0430) (0.0424)
100–499 employees 0.162*** 0.272*** 0.0914** 0.201***
(0.0429) (0.0439) (0.0433) (0.0437)
500+ employees 0.160*** 0.257*** 0.0802* 0.175***
(0.0462) (0.0468) (0.0466) (0.0467)
Sectors (omitted: Agriculture)
Mining 0.131* 0.217*** 0.170** 0.0570 0.129* 0.0921
(0.0743) (0.0721) (0.0735) (0.0756) (0.0727) (0.0744)
Food and beverages 0.225*** 0.289*** 0.253*** 0.143* 0.194*** 0.170**
(0.0766) (0.0742) (0.0761) (0.0777) (0.0746) (0.0768)
Textiles/leather 0.571*** 0.567*** 0.577*** 0.655*** 0.664*** 0.656***
(0.147) (0.145) (0.144) (0.135) (0.133) (0.132)
SEZs 0.107* 0.177*** 0.100 0.0260 0.0723 0.0150
(0.0647) (0.0587) (0.0636) (0.0666) (0.0603) (0.0651)
Other manufacturing 0.0338 0.117* 0.0921 –0.0381 0.0410 0.0172
(0.0685) (0.0682) (0.0678) (0.0703) (0.0692) (0.0691)
Construction 0.302*** 0.309*** 0.311*** 0.186** 0.192** 0.186**
(0.0809) (0.0804) (0.0800) (0.0827) (0.0815) (0.0814)
Wholesale and retail 0.140** 0.135** 0.169*** 0.0522 0.0501 0.0736
(0.0613) (0.0609) (0.0606) (0.0635) (0.0625) (0.0623)
Transport and communications 0.131* 0.177** 0.196*** 0.0422 0.0879 0.101
(0.0728) (0.0725) (0.0720) (0.0745) (0.0734) (0.0731)
Other services 0.0635 0.0790 0.0746 –0.00733 –0.000450 –0.00765
(0.0615) (0.0612) (0.0609) (0.0638) (0.0629) (0.0628)
Age of the firm (omitted: 1–5 years)
6–9 years
(0.0354) (0.0354) (0.0346) (0.0347)
10–19 years –0.175*** –0.226*** –0.223*** –0.255***
(0.0302) (0.0309) (0.0294) (0.0300)

67
(1) (2) (3) (4) (5) (6)
20+ years –0.224*** –0.288*** –0.273*** –0.316***
(0.0338) (0.0349) (0.0332) (0.0341)
Constant –0.217*** 0.0193 –0.125* –0.0485 0.172*** 0.0735
(0.0672) (0.0605) (0.0680) (0.0695) (0.0624) (0.0701)
N 1,837 1,837 1,837 1,837 1,837 1,837
R-squared 0.036 0.052 0.075 0.030 0.066 0.080
Standard errors in parentheses
*** p<0.01, ** p<0.05, * p<0.1
Source: Own estimates based on data from DGII and TSS.


69
4. POLICY IMPLICATIONS
As mentioned in the Executive Summary, most of the analysis in this report was carried out before the COVID‑19 crisis unfolded. While this crisis will change the policy priorities in the short and medium term, the structural issues that affect the Dominican Republic’s labor market and that are discussed in this report will remain relevant after the economy recovers. While the Dominican Republic implemented several policies to address the impacts of the ongoing crisis, the policy implications discussed in this section refer to the bottlenecks that will continue to affect the creation of better jobs in the country.
Before the ongoing crisis, the Dominican economy was projected to remain among the fastest‑growing economies in the Latin American and Caribbean region. The latest IMF Article IV Consultations report (IMF 2019) attributed this to a strengthened macroeconomic policy framework, a generally supportive external environment and favorable terms of trade. Inflation and unemployment were expected to remain low and the country’s external position was broadly in line with fundamentals.
The Dominican Republic’s demographic transition stage characterized by decelerating population growth and a stabilizing dependency ratio is favorable with regard to easing the burden of having to generate new jobs rapidly. With a rapidly growing working‑age population, the rapid generation of jobs needed to accommodate that population often entails some loss of job quality, as when workers are driven into the informal sector as a last resort. Considering the country’s past performance in regard to job creation, however, the target of generating enough good‑quality (that is, wage‑based) jobs to accommodate new entrants into the slower‑growing workforce is eminently reachable.
Most importantly, however, it is necessary to make sure that future economic growth translates into better job outcomes, which provide the foundation for effective poverty reduction. While poverty rates have not been unresponsive to growth over the last two decades, the pace of improvement has been slower than in other countries that have not benefited from such rapid growth. As noted in the Policy Notes prepared for the Dominican Republic (World Bank 2016a), a key challenge facing the Dominican economy is to understand the conundrum of rapid growth with limited poverty reduction and to address it through policies that both sustain economic growth while making it more inclusive. This Jobs Diagnostic aims to contribute to a better understanding of this conundrum and to outline the elements of a jobs strategy that can help address it.
The central aspect of this conundrum from a jobs perspective is the notable divergence between real wages and labor productivity that emerged between 2000 and 2016. While productivity growth has been strong over that period and represents the main impulse driving the rapid GDP growth, wage growth has been comparatively sluggish. (Between 2000 and 2016, labor productivity grew at an annual rate of 2.8 percent, while the median wage grew by 0.6 percent.) Equally stagnant has been the creation of formal, wage‑based jobs, which serve as a proxy for ‘good’ jobs. The rest of this section provides policy recommendations to increase the quality of jobs in the Dominican Republic. The rest of this section provides a prioritization of policies for the short and medium/long term.

70
POLICY PRIORITIES FOR THE SHORT TERM: ADDRESSING THE IMPACTS OF COVID-19
Given the pervasive impact of the COVID‑19 crisis on economic activity and jobs, protecting the newly displaced workers and facilitating their re‑employment during the recovery should be the priority for labor market policies. While the Dominican Republic is already implementing a broad response (see Box 4.1), lessons can be learned from other countries using innovative approaches.
The Dominican Republic’s response to the COVID pandemic aimed to protect jobs and firms’ dynamics. However, countries where informality is large and where existing institutions often lack mechanisms to effectively reach businesses and workers in the informal sector will face a hard recovery phase post‑COVID. They will require to develop a medium‑ to long‑term recovery plan to connect the affected population to social protection services particularly those of expanded social assistance and labor market policies and programs. Governments are resorting to policies aimed to help businesses survive and retain workers and policies to protect those who lose their jobs and see their livelihoods significantly affected. The COVID impact for the Dominican Republic’s labor market will need to be assessed to understand the number of jobs lost and the shock on the firms’ structure after the lockdown.
The country might consider adapting existing active labor market programs (ALMP) to serve as effective crisis response tools for the post‑COVID recovery phase as well as expanding social assistance programs for those informal workers whose jobs are lost and were not part of the social safety nets.17
On one side, following the systematization of how the emergency transfer programs (FASE, Quedate en Casa, and Pa’Ti) supported the workers and firms during the first phase of the pandemic, the country could consider formal workers unemployment insurance schemes to prepare for the next crisis. In addition, active labor market policies can be reoriented to train workers to meet the new needs of the post‑COVID labor demand. Workers who are suspended do not have the same skills as those that will be required in a post‑COVID world. Therefore, training programs and labor market insertion programs could be used to take advantage of technology in those sectors with a promising recovery rate or which are more productive (tourism or SEZs, for example). Also, ALMPs can support business continuity, allowing businesses and services to continue operating safely and serve the population. For example, supporting small businesses or entrepreneurship ventures to develop e‑commerce so they can continue trading and serving customers at a distance; expanding payment systems (mobile and online) with low transaction costs for small businesses and connection with financial services (including credit); and transforming the regular training courses into online courses for workers delivered by the National Training Institute (INFOTEP) could be considered in the medium to long term.
On the other side, for the informal workers and informal firms who are difficult to reach through the regular active labor market programs, the tax incentive schemes or the wage subsidy schemes, other innovative measures will be needed. For example, supporting the expansion of formal sector businesses that are linked to informal businesses, increasing the access to credit lines for informal businesses through microcredit organizations, and expanding social assistance programs such as Progresando con Solidaridad (PROSOLI) to informal workers or less‑poor households with informal jobs that might be vulnerable to income shocks in a crisis.
Finally, the country could consider designing public works programs to provide temporary employment to suspended workers in areas where firms are not able to recover quickly, particularly where the private sector network is weak, for example in the 14 poorest provinces according to the poverty map. In the absence of unemployment benefit schemes or training systems, public works can provide a source of income and job experience for low‑income workers. In past crises, they have played an important role in absorbing the unemployed in developing countries and made a difference, especially among the vulnerable and the poor.18 Public work programs that are well designed with regard to the length of the employment contract and the level of wages can provide adequate
17 “Managing the Employment Impacts of the COVID‑19 Crisis Policy Options for the Short Term.” World Bank Jobs Group Technical Note 2020.18 Almeida and Galasso 2010; Galasso and Ravallion 2004; Jalan and Ravallion 2003.

71
protection to low‑income jobseekers without reducing incentives to work or search for jobs that arise when the economy rebounds.19 Given the nature of this pandemic, public works can be developed for new areas, including ‘digital’ public works or public ‘remote’ work which can help meet ‘social distancing’ requirements and mitigate the health concerns that may linger at later stages of the crisis. ‘Digital’ public works may also help reduce the stigmatization of participating workers and can expand the scope of public works well beyond the traditional activities of community development, construction, and maintenance of physical infrastructure. Such new approaches may be particularly attractive to vulnerable youth and women, who are typically also hardest hit by economic crises.
POLICIES FOR THE MEDIUM AND LONG TERM: IMPROVING HUMAN CAPITAL AND BUSINESS ENVIRONMENT
Improve human capital accumulation
According to several indicators, the Dominican Republic lags comparator countries in terms of the stock of human capital of its labor force and of that of future generations. This holds not only when comparing years of schooling but also when looking at performance at standardized tests. Accordingly, Dominican workers do not carry out tasks associated with the skills of the future when compared to their peers in countries at similar levels of economic development. As countries move up the technology ladder, equipping their citizens with the skills to leverage new technologies will be critical.
The Systematic Country Diagnostic of the Dominican Republic (World Bank 2018b) argued that improving human capital was one of the priority areas for policy. In particular, the report emphasized the importance of expanding early childhood development, improving teacher skills and recruitment, reforming the curriculum, and improving school management.
The World Development Report 2018 on Learning to Realize Education’s Promise (World Bank 2017c) highlights that early childhood is an optimal period to acquire foundational cognitive skills because they are a prerequisite to developing further cognitive and socioemotional skills during later developmental periods. Accordingly, it lists several successful interventions across the world such as Jamaica’s Reach Up and Learn program, which promoted early child stimulation, led to lower crime rates, better mental health, and 25 percent higher earnings two decades later.
The importance of improving teachers’ skills and recruitment cannot be overemphasized. Studies of the drivers of poor learning in developing countries often point to teachers (World Bank 2017c). Teachers in developing countries often lead oversized and multigrade classes. Teacher shortages tend to increase working hours, especially if teachers have to supervise extracurricular activities. A lack of infrastructure and equipment, particularly in remote and rural areas, also contributes to handicap teachers’ efforts. There are some successful examples from other countries in this area. In India, computer‑assisted learning programs allowed teachers to better adapt to learners’ ability and helped improve math ability. Accordingly, financial incentives proved effective in countries with high absenteeism, such as India and Kenya.
Given the high rates of youth unemployment, it is important to strengthen the links between the private sector and the formal education system so that the supply of skills reflects those that firms need (see Box 4.1). This could be done by improving technical and vocational programs and expanding on‑the‑job training opportunities. Several alternatives exist for engaging employers in training programs. For example, public‑private partnerships with multinational corporations, effective national workforce development initiatives, and on‑the‑job training using training funds and tax incentives (World Bank 2017c). Apprenticeships can also serve as the steppingstone for young people into a permanent job. For example, a large formal program in Brazil (Lei do Aprendiz) increased the likelihood of finding permanent and higher‑paying jobs, particularly for less educated workers (World Bank 2017c).
19 Gehrke and Hartwig 2018; Nair et al. 2018; Subbarao et al. 2012.

72
To protect human capital accumulation from negative shocks, improving social protection systems is essential. The World Development Report 2019 (World Bank 2018a) has stated that the absence of social protection for workers continues to be the most pressing concern for emerging economies. Moreover, it highlights that tradi‑tional social protection models that are based on steady wage employment, clear definitions of employers and employees, and a fixed retirement age are becoming obsolete. This is particularly true in developing countries, where informality is the norm. The report also calls for spending on social assistance as a complement to social insurance that does not fully depend on having a formal wage job. In fact, a recent World Bank Policy report for the Dominican Republic emphasizes the importance of ensuring access to social protection services to all the extreme poor; developing policies to link the contributory and noncontributory pillars as well as interventions in the labor market; reinforcing inter‑sectoral coordination and preventing leakages and duplication or roles, among other priorities (World Bank 2016a).
Given the evolving scenario of poverty and vulnerability as a result of the pandemic, social interventions are facing the challenge of adapting to the new social requirements, while continuing to provide key basic services to protect consumption and promote human capital of the poorest. In a country where almost half of the population is considered vulnerable, the supply of social protection services should be developed to provide increased mitigation strategies for households not to fall back into poverty and improve their living conditions on a sustainable basis. Improving professional training and promoting productive entrepreneurship, cooperatives and access to financial opportunities is essential to transform human capital endowments into income‑generation capabilities. Moreover, in a context of higher frequency and intensity of shocks, whether in the form of natural disasters or economic crises, interventions must become more responsive and improve delivery at post‑disaster stages. In this context, public employment programs and public‑private partnerships (including nongovernmental organizations) can contribute to create jobs in activities that raise habitat quality, environmental sustainability, and the resilience of communities and individuals to climate and other shocks.
BOX 4.1. ACTIVE LABOR MARKET PROGRAMS IN THE DOMINICAN REPUBLIC
Active Labor Market Programs (ALMPs) and policies become important instruments to increase the employ‑ability in Dominican Republic, both in terms of solving the structural challenges of the labor market as well as responding with a strong post‑COVID economic‑reactivation plan. In both cases, labor market skills will have to be adapted to the new requirements of the labor market according to the needs that technological change and economic recovery will demand under the new normal. Public spending in ALMP is small (around 6 percent of Social Protection Spending) and concentrated around training of the labor force (77 percent) and entrepreneurship programs (15 percent). Total Social Protection Spending represented around 7.3 percent of GDP in 2018.
In the last five years, ALMPs have been focused on the economic inclusion of small and medium enter‑prises (SME), particularly supported by the Ministry of Industry and Commerce (MIC), providing access to training, access to finance, and technical assistance to entrepreneurs. Training courses are provided by the National Technical and National Training Institute (INFOTEP). Although recent market studies have derived in the revision of the curricula of some courses, there is still room to align the courses to the market needs and for the coverage expansion of these services for the most vulnerable, as they have not been adapted for low human capital individuals. Likewise, the Social Cabinet has developed an Economic Inclusion Component of the Conditional Cash Transfer Program PROSOLI that aims to provide technical and entrepreneurship training services to PROSOLI youth followed by an apprenticeship linked to private sector opportunities to increase the labor market inclusion of vulnerable youth. Links of social assistance and productive inclusion programs should be enforced; these might include the articulation of programs executed by the Social Cabinet, the MIC and the Ministry of Labor, as well as articulating the training supply of INFOTEP.

73
Improving human capital will also require addressing gender imbalances. Teenage pregnancy rates are stubbornly high in the Dominican Republic and can have negative and long‑lasting consequences in the human capital and incomes of women. Azevedo et al. (2012) provide a policy framework for addressing the issue of teenage pregnancy in Latin America. At the macro level, the evidence shows that the reduction of inequality and the creation of more opportunities for women can contribute to reduce teenage pregnancy and to reduce the impacts of early childbearing. At the more micro level, policies to widen the set of options for women and enhancing agency so that fertility decisions consider life plans and are not an unintended result.
Accordingly, gender‑biased social norms are associated with women working more hours than men when including unpaid work at home, a gap higher than in other Latin American countries. Addressing gender stereotypes early in life can help to change social norms. For example, Muller and Casabonne (2020) argue that changes to school curricula can promote positive messages about equality between women and men. Accordingly, programs to foster female entrepreneurship or to promote female employment in non‑traditional sectors may help advance women’s economic empowerment.
Improve the business environment
The analysis of the labor demand side suggested that the jobs landscape in the Dominican Republic is dominated by large and old firms, with limited role for new entrants. Entry rates are among the lowest in the world. However, it is younger and larger firms who experience higher productivity growth, a key ingredient to increase wages and thereby the quality of jobs.
It is important to strengthen the incentives to start a formal business by reducing the costs and procedures involved with registering a new business. According to the Doing Business database, the number of procedures and days to register a new business is 42 and 80 percent higher, respectively, than those of OECD high‑income economies. Accordingly, the associated cost, as a share of income per capita, is almost five times higher in the Dominican Republic. There are positive experiences from other countries in the region, such as Mexico, regarding the imple‑mentation of reforms to improve the efficiency of opening and expanding businesses. Mexico’s Federal Commission for Improving Regulation (COFEMER) introduced a reform in 2002 that reduced the number of days required to register a business from 30.1 to 1.4. The reform also created one‑stop‑shops (OSSs) in Mexico’s most populous cities to implement the accelerated registration system. The reform increased the number of registered businesses by 5 percent (Bruhn 2011). This type of reforms had mixed success in other countries such as Peru (Mullainathan and Schnabl 2010), and they may not be as successful in less populous and more rural areas (Bruhn and McKenzie 2014), because the latter may need a different type of intervention given their different capabilities and goals. Despite these moderate effects on firm creation, simplifying and reducing the costs of the processes to open and expand a business represents a reduction in operating costs for firms with incentives to become and stay formal.
Improving the links between the exporting sector and domestic firms is essential to create more and better jobs in the Dominican Republic. World Bank (2016) provides several recommendations to achieve this goal. For example, by creating a database of suppliers, matchmaking events, local clusters around the industrial parks, among others. Accordingly, reducing the regulatory divide between firms in SEZs and outside SEZs, as well as across sectors (for example, by simplifying the minimum wage structure) will be key aspects of leveling the playing field across all firms.
There are strong perceptions of market dominance and uneven playing field as important issues affecting the business environment. Implementing the Dominican Republic’s pro‑competition law and reducing arbitrary tax exemptions will be crucial to weaken distortions (World Bank 2018b). Empirical evidence for the Dominican Republic shows that increased competition in the retail sector was associated with lower prices (from 2 to 6 percent) and improved quality of service (Busso and Galiani 2019).
Improving the quality of public services such as electricity could help small and younger firms—who are more likely to be credit‑constrained—disproportionately. To achieve this goal, it will be crucial to improve the institu‑tional framework, transparency, and accountability, as well as restore the efficiency and financial sustainability of the sector (World Bank 2016b).


75
REFERENCES
Abdullaev, M. U., and M. M. Estevao. 2013. Growth and Employment in the Dominican Republic: Options for a Job‑Rich Growth. International Monetary Fund.
Acemoglu, D., and D. Autor. 2011. “Skills, Tasks and Technologies: Implications for Employment and Earnings.” In Handbook of Labor Economics. https://doi.org/10.1016/S0169‑7218(11)02410‑5.
Alaimo, V., M. Bosch, M. Gualavisí, and J. M. Villa. 2017. “Measuring the Cost of Salaried Labor in Latin America and the Caribbean.” Inter-American Development Bank (June). https://doi.org/10.18235/0000758.
Almeida, R.K. and Galasso, E., 2010. Jump‑starting self‑employment? Evidence for welfare participants in Argentina. World Development, 38(5), pp.742–755.
Arceo‑Gómez, E. O., and R. M. Campos‑Vázquez. 2014. “Teenage Pregnancy in Mexico: Evolution and Consequences.” Latin American Journal of Economics 51(1): 109–146.
Ashcraft, A., I. Fernández‑Val, and K. Lang. 2013. “The Consequences of Teenage Childbearing: Consistent Estimates when Abortion makes Miscarriage Non‑random. The Economic Journal 123(571): 875–905.
Autor, D. H., and M. J. Handel. 2013. “Putting Tasks to the Test: Human Capital, Job Tasks, and Wages.” Journal of Labor Economics 31(S1): S59–S96. https://doi.org/10.1086/669332.
Azevedo, J. P., M. Favara, S. E. Haddock, L. F. Lopez‑Calva, M. Muller, and E. Perova. 2012. Teenage Pregnancy and Opportunities in Latin America and the Caribbean: On Teenage Fertility Decisions, Poverty and Economic Achievement.
Azuero, R., M. Bosch, M. Cardoza, and D. Sanchez. 2019. Productivity, Misallocation, and Special Tax Regimes in the Dominican Republic. https://doi.org/10.18235/0001888.
Berthelon, M., and D. I. Kruger. 2012. “The Impact of Adolescent Motherhood on Education in Chile.” IZA Discussion Paper.
Brill, M., Holman, C., Morris, C., Raichoudhary, R., and N. Yosif. 2017. “Understanding the labor productivity and compensation gap,” Beyond the Numbers: Productivity, vol. 6, no. 6 (U.S. Bureau of Labor Statistics, June 2017), https://www.bls.gov/opub/btn/volume‑6/understanding‑the‑labor‑productivity‑and‑compensation‑gap.htm
Bruhn, Miriam. 2011. “License to Sell: The Effect of Business Registration Reform on Entrepreneurial Activity in Mexico.” Review of Economics and Statistics. https://doi.org/10.1162/REST_a_00059.
Bruhn, M., and D. McKenzie. 2014. “Entry Regulation and the Formalization of Microenterprises in Developing Countries.” The World Bank Research Observer. https://doi.org/10.1093/wbro/lku002.
Busso, M., and S. Galiani. 2019. “The Causal Effect of Competition on Prices and Quality: Evidence from a Field Experiment.” American Economic Journal: Applied Economics. https://doi.org/10.1257/app.20150310.
Carneiro, F., and S. Sirtaine, eds. 2017. When Growth Is Not Enough: Explaining the Rigidity of Poverty in the Dominican Republic. https://doi.org/10.1596/978‑1‑4648‑1036‑7.
Centro de Estudios Sociales y Demográficos. 2013. Encuesta Demográfica y de Salud 2013 República Dominicana 457. Retrieved from https://dhsprogram.com/pubs/pdf/FR292/FR292.pdf.
CNZFE. 2018. Sector Informe Estadístico 2018.
Cunningham, W., and O. Pimhidzai. 2019. “Vietnam’s Future Jobs.” In Vietnam’s Future Jobs. https://doi.org/10.1596/31016.
Cusolito, A. P., and W. F. Maloney. 2018. Productivity Revisited: Shifting Paradigms in Analysis and Policy. https://doi.org/10.1596/978‑1‑4648‑1334‑4.
ENI. 2017. Segunda Encuesta Nacional de Inmigrantes, ENI‑2017 Informe General Santo Domingo, República Dominicana, septiembre 2018 ISBN: 978‑9945‑015‑22‑5.
Erdogan, A. A., and X. V. Del Carpio. 2019. “Turkey Jobs Diagnostic.” In Turkey Jobs Diagnostic. https://doi.org/10.1596/32263.
Fletcher, J. M., and B. L. Wolfe. 2009. “Education and Labor Market Consequences of Teenage Childbearing Evidence using the Timing of Pregnancy Outcomes and Community Fixed Effects.” Journal of Human Resources 44(2): 303–325.

76
Fortin, N. M. 2005. “Gender Role Attitudes and the Labour‑Market Outcomes of Women across OECD countries. Oxford Review of Economic Policy. https://doi.org/10.1093/oxrep/gri024.
Galasso, Emanuela, and Martin Ravallion. “Social protection in a crisis: Argentina’s Plan Jefes y Jefas.” The World Bank Economic Review 18.3(2004): 367–399.
Gehrke, E., and Hartwig, R. 2018. Productive effects of public works programs: What do we know? What should we know?. World development, 107, 111–124.
Hardy, W., P. Lewandowski, A. Park, and D. Yang. 2018. The Global Distribution of Routine and Non-routine Work.
Hatayama, M., M. Viollaz, and H. J. Winkler. 2020. “Jobs’ Amenability to Working from Home : Evidence from Skills Surveys for 53 Countries.” Policy Research Working Paper 9241, 1–32.
IMF (International Monetary Fund). 2019. Dominican Republic: 2019 Article IV Consultation-Press Release; Staff Report; and Statement by the Executive Director for the Dominican Republic. Retrieved from https://www.imf.org/en/Publications/CR/Issues/2019/08/15/Dominican‑Republic‑2019‑Article‑IV‑Consultation‑Press‑Release‑Staff‑Report‑and‑Statement‑by‑48592.
INM. 2017. Migrantes, salud y seguridad social en la República Dominicana. Retrieved from http://inm.gob.do/index.php/noticias/%0Aitem/337‑migrantes‑salud‑y‑seguridad‑social‑en‑la‑republica‑dominicana.
Jalan, J., and Ravallion, M. (2003). Estimating the benefit incidence of an antipoverty program by propensity‑score matching. Journal of Business & Economic Statistics, 21(1), 19–30.
Kane, J. B., S. P. Morgan, K. M. Harris, and D. K. Guilkey. 2013. “The Educational Consequences of Teen Childbearing.” Demography, 50(6): 2129–2150.
Karabarbounis, L., and B. Neiman. 2014. “The Global Decline of the Labor Share.” The Quarterly Journal of Economics 129(1): 61–103.
La Porta, R., and A. Shleifer. 2008. The Unofficial Economy and Economic Development. National Bureau of Economic Research.
Lawrence, R. Z. 2015. Recent Declines in Labor’s Share in US Income: A Preliminary Neoclassical Account. National Bureau of Economic Research.
Lo Bello, S., L. Sanchez‑Puerta, and H. Winkler. 2019. From Ghana to America The Skill Content of Jobs and Economic Development. Retrieved from http://www.worldbank.org/research.
Mele, G. 2017. Gearing up for a More Efficient Tax System: An Assessment of Tax Efficiency, a Cost-Benefit Analysis of Tax Expenditures, and an Exploration of Labor Informality and its Tax Implications. 116 pp.
Mullainathan, S., and P. Schnabl. 2010. “Does Less Market Entry Regulation Generate More Entrepreneurs? Evidence from a Regulatory Reform in Peru.” In International differences in entrepreneurship, 159–177. University of Chicago Press.
Muller, M., and U. Casabonne. 2020. Closing Gender Gaps in Latin America and the Caribbean, 72 pp.
OECD. 2018. OECD Economic Outlook 2018(2). https://doi.org/10.1787/eco_outlook‑v2018‑2‑en.
OECD / ILO. 2018. How Immigrants Contribute to the Dominican Republic’s Economy. In How Immigrants Contribute to the Dominican Republic’s Economy. https://doi.org/10.1787/9789264301146‑en.
ONE (Oficina Nacional de Estadistica), and Ministerio de la Mujer. 2016. Trabajo no remunerado en Republica Dominicana: un análisis a partir de los datos del Módulo del Uso del Tiempo de la ENHOGAR 2016.
Posadas, J., M. Makovec, R. N. Fattal Jaef, C. A. Gruen, and M. I. Ajwad. 2018. Georgia at Work: Assessing the Jobs Landscape. Retrieved from http://documents.worldbank.org/curated/en/995521527068940160/Georgia‑at‑work‑assessing‑the‑jobs‑landscape.
Schwab, K. 2019. Insight Report—World Economic Forum. Retrieved from http://www3.weforum.org/docs/WEF_TheGlobalCompetitivenessReport2019.pdf.
Sousa, L. D., D. Sanchez, and J. E. Baez. 2017. “Wage Effects of Haitian Migration in the Dominican Republic.” When Growth Is Not Enough, 103.
Subbarao, K., Del Ninno, C., Andrews, C., and Rodríguez‑Alas, C. 2012. Public works as a safety net: design, evidence, and implementation. The World Bank.
World Bank. 2016a. Special Economic Zones in the Dominican Republic: Policy Considerations for a More Competitive and Inclusive Sector. World Bank, Washington, DC.

77
World Bank. 2016b. Building a Better Future Together : Dominican Republic Policy Notes. World Bank, Washington, DC. https://openknowledge.worldbank.org/handle/10986/26045.
World Bank. 2017a. Do Labor Markets Limit the Inclusiveness of Growth in the Dominican Republic? In Do Labor Markets Limit the Inclusiveness of Growth in the Dominican Republic? https://doi.org/10.1596/27681.
World Bank. 2017b. Zonas Francas en Republica Dominicana: Consideraciones de política para un sector más competitivo e incluyente. Santo Domingo: Grupo Mundial.
World Bank. 2017c. World Development Report 2018: Learning to Realize Education’s Promise. https://doi.org/10.1596/978‑1‑4648‑1096‑1.
World Bank. 2018a. World Development Report 2019: The Changing Nature of Work. In World Development Report. https://doi.org/10.1596/978‑1‑4648‑1328‑3.
World Bank. 2018b. Dominican Republic—Systematic Country Diagnostic. Retrieved from http://documents.worldbank.org/curated/en/980401531255724239/Dominican‑Republic‑Systematic‑Country‑Diagnostic.
World Bank. 2020. Closing Gender Gaps in Latin America and the Caribbean.


79
ANNEX C
THE WAGE-PRODUCTIVITY GAP IN THE DOMINICAN REPUBLIC: IS IT FOR REAL OR JUST FANTASY?
The divergence between labor compensation and labor productivity observed in the Dominican Republic since around 2000 has also been observed in other countries at various periods of time. Most notably, this divergence has been observed in the United States since the late 1970s and has prompted concerns about a possible mal‑functioning of the economy and consequent breakdown of the link between wage growth and labor produc‑tivity growth that is familiar from standard neoclassical economic analyses. A number of potential reasons and conjectures, listed in Chapter 1, have been advanced to explain this divergence.
More recently, a number of analysts (for example, Brill et al. 2017; Lawrence 2015) have argued that the size of the wage‑productivity gap in the United States has been greatly exaggerated through the mismeasurement of real wages and labor productivity, and that when these variables are appropriately measured, much of the wage‑productivity gap disappears. Lawrence (2015) draws attention to the following four variable specifications commonly used to measure real wages and labor productivity that result in measurement bias: (a) measuring wages over a limited subset of employees, (b) excluding non‑wage benefits from the definition of labor compensation, (c) using gross versus net output figures, and (d) using inappropriate price deflators to measure real wage and productivity changes.
Mismeasurement of hourly wages. When measuring average hourly wages, many studies have focused on a subset of workers (for example, production or non‑supervisory workers), rather than including all workers. This is likely to exclude the more skilled and education workers, who generally command higher salaries and whose relative incomes have risen the most since the 1970s. The omission of workers with the faster‑growing incomes biases the measurement of labor compensation growth in a downward direction. A similar problem occurs when relying on survey‑based employment and remuneration data, as these tend to underrepresent the highest‑earning households, which leads to an underestimation of wage growth during periods of increasing wage dispersion and, hence, to an overestimation of the wage‑productivity gap.
Exclusion of non‑wage benefits. Estimates of labor earnings often do not include non‑wage employment benefits received by workers (for example, health care and disability insurance, pension contributions). However, these benefits represent part of the total labor cost that influence employers’ output and employment decisions. To the extent that non‑wage benefits are growing faster than wages, the growth rate of labor remuneration is underestimated, resulting in an overestimate of the wage‑productivity gap.
Gross versus Net Value‑Added. Most measures of productivity tend to measure total output on a gross basis, instead of using net value‑added figures, the difference being the amount of capital stock depreciation taking place each year. It is arguably the case that the rate of capital depreciation has increased in the United States over the last few decades, both on account of an acceleration of technical advances (especially in information technology and artificial intelligence [AI]) that render existing capital obsolete more rapidly, as well as more generous capital depreciation allowances. To the extent that the rate of capital depreciation may have increased over time, the gross output/income figures would be overestimating output and productivity growth, as well as the wage‑productivity gap.
CPI versus PPI or GDP deflator. When making their profit‑maximizing employment decisions, the most relevant price indexes for producers are the Producer Price Index (PPI) or the GDP deflator, as they link the labor costs facing producers with the price of the goods produced by domestic labor. The Consumer Price Index (CPI) is more appropriate for seeking to evaluate labor’s purchasing power but it is inappropriate for comparing labor costs with labor productivity since the mix of goods produced by workers is very different from the mix of goods and services consumed by those workers. Nevertheless, many studies rely on the CPI because it is more readily available. Using the CPI to deflate GDP or production data leads to an overestimation of the wage‑productivity gap when consumer prices are growing faster than producer prices, as has been the case in the United States in recent years.

80
Lawrence (2015) found that when the data series for the United States are adjusted to take these four sources of measurement bias into account, the growth in hourly real compensation matched the growth in hourly real net output per worker during the period from 1970 to 2000. That is, over this period, the growing wage‑productivity gap disappears.20 While these adjustments appear to have solved the puzzle of the growing wage‑productivity gap in the United States over this period, they raise a whole new set of puzzles: in particular (a) what has been driving the increase in relative prices of goods and services consumed by workers, especially housing and education; (b) what is driving the rising costs of benefits, especially health care; and (c) why is productivity growth in the services sector so much slower than in the goods sectors?
The main question motivating this annex is whether the wage‑productivity gap observed in the Dominican Republic is also as sensitive to alternative measures of labor productivity and real hourly wages as the United States data. If the gap were to disappear under similar adjustments, then it would be necessary to revise the analytical agenda to focus less on market failure explanations and redirect attention to the other issues raised by Lawrence (2015). As shown next, the wage‑productivity gap calculated for the Dominican Republic appears to be more robust than what had originally been calculated for the United States. From that we conclude that the stagnation of labor compensation in the Dominican Republic is a real matter of concern, not the product of mismeasurement, and that it needs to be addressed both from a productivity and distributive perspective.
MAIN FINDINGS
The evolution of real hourly wages and average labor productivity presented in Figure AC.1 was calculated on the basis of the following variable specifications: the series for average nominal wages was obtained from the annual labor force survey and it excludes non‑wage benefits. Nominal wages were deflated by the CPI to obtain real wage rates. Average labor productivity was derived by dividing total GDP (in constant 2010 US$) by the total employed population of working age (15–64 years). Using these original variable specifications, the total size of the wage‑productivity gap comes out to 49 percent of the real hourly wage in 2016. In other words, had real wages not drifted apart from labor productivity during the last two decades, they would be almost 50 percent higher today than they are.
20 Lawrence (2015) does find, however, that the wage‑productivity gap has increased in the United States since the early‑2000s, driven by forces that cannot be attributed to any of the mis‑measurement reasons discussed above, which warrants further explanation.
FIGURE AC.1Dominican Republic, Wage‑Productivity Gap (original variable specification)
Mean hourly wage
Average labor productivity
60
70
80
90
100
110
120
130
140
150
160
2000
2001
2002
2003
2004
2005
2006
2007
2008
2009
2010
2011
2012
2013
2014
2015
2016
2017
Ind
ex (
2000
= 1
00)
Source: World Bank (WDI) and ILOSTAT.

81
As was noted by Lawrence (2015), some of these variable specifications have exaggerated the size of the wage‑productivity gap calculated for the United States and they may have here as well. To remove the possible bias, the gap was recalculated under the following adjustments:
• Average labor productivity was calculated by using the total employed population ages 15 or more years in the denominator, instead of limiting this variable to employed persons in the 15 to 64 age range.
• Average labor productivity was recalculated using a proxy measure for Net Domestic Product (NDP).21
• The measure of total labor remuneration was revised to include the estimated non‑wage benefits.
• The hourly wage series was deflated by the GDP deflator and the PPI, instead of the CPI.
The main outcome of these adjustments is presented next.
Employment (ages 15–64) versus Employment (ages 15+). It turns out that this adjustment has absolutely no effect on the previously estimated wage‑productivity gap. The inclusion of employed workers ages 65 and older does not alter the evolution of the employment index, which basically means that over the time period 2000–2017, the demographic evolution of the older workers is not appreciably different from that of the working‑age employees.22 So, substituting one series for the other had no impact on the wage‑employment gap.
GDP versus NDP. Figure AC.2 shows the evolution of average labor productivity using both GDP and NDP. Until about 2011, both productivity measures follow the same trajectory, and then drift increasingly apart, indicating a faster rate of capital depreciation. In this regard, the Dominican economy is reflecting a similar pattern observed in the United States. The total impact of this adjustment is to reduce the total wage‑productivity gap by 5.7 percent of the hourly wage rate.
21 This was done by comparing the gross national income (GNI) and net national income figures from the World Bank WDI to calculate the amount of capital stock depreciation as a share of GNI. That same share was then subtracted from the GDP figures used to calculate labor productivity.22 This finding is based on data from the WDI for data on employed workers ages 15+, and the ILO Stat for data on employed workers ages 15–64 years.
FIGURE AC.2Dominican Republic, Evolution of GDP versus NDP
Gross Domestic Product
Net Domestic Product
Mean wage
60
80
100
120
140
160
180
2000
2001
2002
2003
2004
2005
2006
2007
2008
2009
2010
2011
2012
2013
2014
2015
2016
2017
Ind
ex (
2000
= 1
,000
)
GDP/15+ NNP2/15+ Mean wage
Source: World Bank (WDI) and ILOSTAT.

82
Wages versus total labor remuneration. Baez (2017) reports that between 2003 and 2007, the Dominican Republic implemented a number of labor market policies that introduced old‑age, disability and health insurance, work injury compensation, medical benefits, and other mandatory contributions. These policies cover all formal public‑ and private‑sector workers and employers. Even though the total non‑wage social security costs vary considerably from firm to firm depending on differences in labor risks, medical leave, and worker turnover rates, the standard mandatory contributions (pensions, health, and payment bonuses) are currently estimated to amount, on average, to about 31 percent of the nominal wage. Of this total benefit amount, the employer is responsible for 25, or the 31 percentage points, while the employee is responsible for the remaining 6 percentage points.23 Only about half of total non‑agricultural employment is in the formal sector, however, which means that the total non‑wage labor cost bill at best amounts to about 12.5 percent of the hourly wage rate in the non‑agricultural sector, provided everyone in the formal sector is complying. Assuming the share of informal employment is similar in the agriculture sector,24 we simulate the evolution of non‑wage employment benefits as an annual increase of 2.5 percent in the wage rate for 5 years over the period from 2003 to 2007. This adjustment has a large impact on the wage‑productivity gap, reducing it by 12.5 percent of the real hourly wage.
The two outside lines in Figure AC.3 depict the evolution of the wage‑productivity gap under the original specifi‑cation, while the two inside lines depict a somewhat narrower gap that reflects the revised variable specifications associated with the use of net production figures and the inclusion of non‑wage employment benefits. While the total gap is noticeably smaller, it remains significant.
CPI versus GDP‑deflator and PPI. As noted earlier, replacing the CPI with the GDP deflator or PPI in the calculation of real wages provides a more appropriate measure of the real wage index relevant to employers. Figure AC.4 shows that the CPI and GDP deflator had been moving in tandem from 2000 to about 2010, before both indexes begin to diverge. An interesting observation to be made here is that, contrary to the trend in the United States data discussed previously, the CPI has been growing more slowly than both the GDP deflator and
23 See Baez (2017). The standard mandatory contribution comprises contributions to pensions (7.12 percent employer; 2.88 percent employee), medical benefits (7 percent employer; 3 percent employee), worker’s compensation for injuries (1.2 percent employer), payment bonus (10 percent contingent payment, employer), cross‑subsidies (0.4 percent employer), and contribution to the national institute of technical training (INFOTEP: 1 percent employer).24 The degree of informality in the agricultural sector is estimated to be higher than in the non‑agricultural sector, so this assumption tends to underestimate size of the wage‑productivity gap. The same applies to the assumption that everyone in the formal sector complies with the payment of non‑wage benefits.
FIGURE AC.3Dominican Republic, Wage‑Productivity Gap (revised variable specification)
Gross productivity
Net productivity
Hourly real wage
Real wage and benefits
60
80
100
120
140
160
Ind
ex (
2000
=10
0)
2000
2001
2002
2003
2004
2005
2006
2007
2008
2009
2010
2011
2012
2013
2014
2015
2016
2017
Gross productivity Net productivity Hourly real wageReal wage and benefits
Source: Based on data from World Bank (WDI), ILO, and ENFT.

83
FIGURE AC.4Dominican Republic, evolution of CPI, PPI, and GDP deflator
Consumer Price Index (CPI)
PPI
GDP deflator
CPI GDP deflator PPI
2000
2001
2002
2003
2004
2005
2006
2007
2008
2009
2010
2011
2012
2013
2014
2015
2016
2017
2018
2019
Ind
ex (
2000
=10
0)
80
130
180
230
280
330
380
430
Source: Based on data from World Bank (WDI), ILO, and ENFT. Source: WDI for data on CPI and GDP deflator and Oficina Nacional de Estadística (ONE) for data on the PPI.
TABLE AC.1Summary impact of various measurement adjustments on the wage‑employment gap in the Dominican Republic
(as % of real hourly wage rate)
Initial gap in 2016 49.0
Adjustments:
Employment (15+ versus 15–64) 0.0
GDP deflator versus CPI +6.2
NDP versus GDP −5.7
Non-wage benefits −12.5
Total adjustments −11.9
Remaining gap 37.1
Source: World Bank staff calculations.
the PPI. This means that replacing the CPI with either of the other two measures will yield lower values of the real wage rate and, hence, will expand the wage‑productivity gap. Specifically, replacing the CPI with the GDP deflator raises the size of the wage‑productivity gap by 6.2 percent of the hourly wage rate in 2016. The PPI also increased at a faster pace than the CPI in the period since 2013, but slower than the GDP deflator. Replacing the CPI with the PPI, therefore, would have a similar impact on the size of the gap, but would be less pronounced.
Table AC.1 summarizes the impact of the various changes in variable specifications on the wage‑productivity gap. It indicates that the size of the total gap, which amounted to 49.0 percent before adjustments—falls by almost 12 percentage points, to 37.1 percent of the hourly wage rate. Unlike Lawrence’s (2015) findings for the United States, the gap does not disappear in the Dominican Republic. Rather, it remains significant and warrants further analysis.


Address: 1776 G St NW, Washington, DC 20006
Website: http://w w w.worldbank .org/en/topic/jobsanddevelopment
Twitter : @WBG_Jobs
Blog: http://blogs.worldbank .org/jobs