joe azelby keynote address
TRANSCRIPT

© 2016 MSCI Inc. All rights reserved. Please refer to the disclaimer at the end of this document.
KEYNOTE ADDRESS
Joe Azelby, Managing Director, J.P. Morgan Asset
Management – Global Real Assets
1

Mix Your Bricks
A Diversified Approach to Real Asset Investing
STRICTLY PRIVATE | CONFIDENTIAL
Joe Azelby, Head of Global Real Assets, J.P. Morgan Asset Management

Most institutional investors have a problem…
85% or more of their assets are in stocks and bonds
STRICTLY PRIVATE | CONFIDENTIAL
Source: JPMAM, as of December 31, 2015
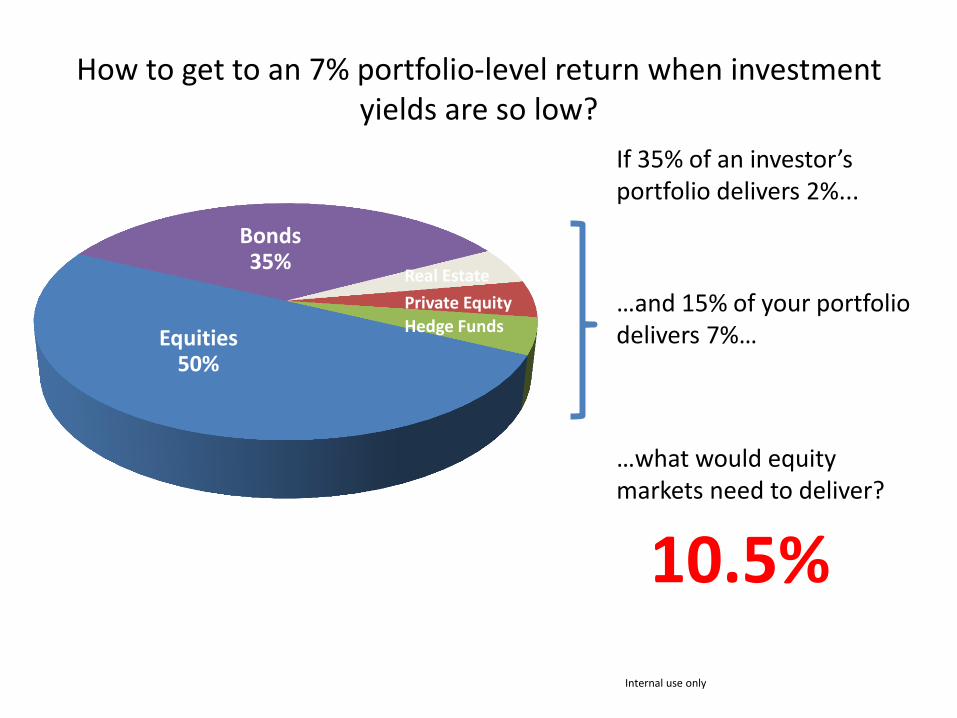
Real Estate
Hedge Funds
Private Equity
Bonds 35%
Equities 50%

How to get to an 7% portfolio-level return when investment yields are so low?
If 35% of an investor’s portfolio delivers 2%...
Internal use only
Bonds 35%

How to get to an 7% portfolio-level return when investment yields are so low?
If 35% of an investor’s portfolio delivers 2%...
Internal use only
…and 15% of your portfolio delivers 7%…
Real Estate
Hedge Funds
Private Equity
Bonds 35%

How to get to an 7% portfolio-level return when investment yields are so low?
If 35% of an investor’s portfolio delivers 2%...
Internal use only
…what would equity markets need to deliver?
Real Estate
Hedge Funds
Private Equity
Bonds 35%
Equities 50%
…and 15% of your portfolio delivers 7%…
How to get to an 7% portfolio-level return when investment yields are so low?
If 35% of an investor’s portfolio delivers 2%...
Internal use only
…what would equity markets need to deliver?
10.5%
Real Estate
Hedge Funds
Private Equity
Bonds 35%
Equities 50%
…and 15% of your portfolio delivers 7%…

8
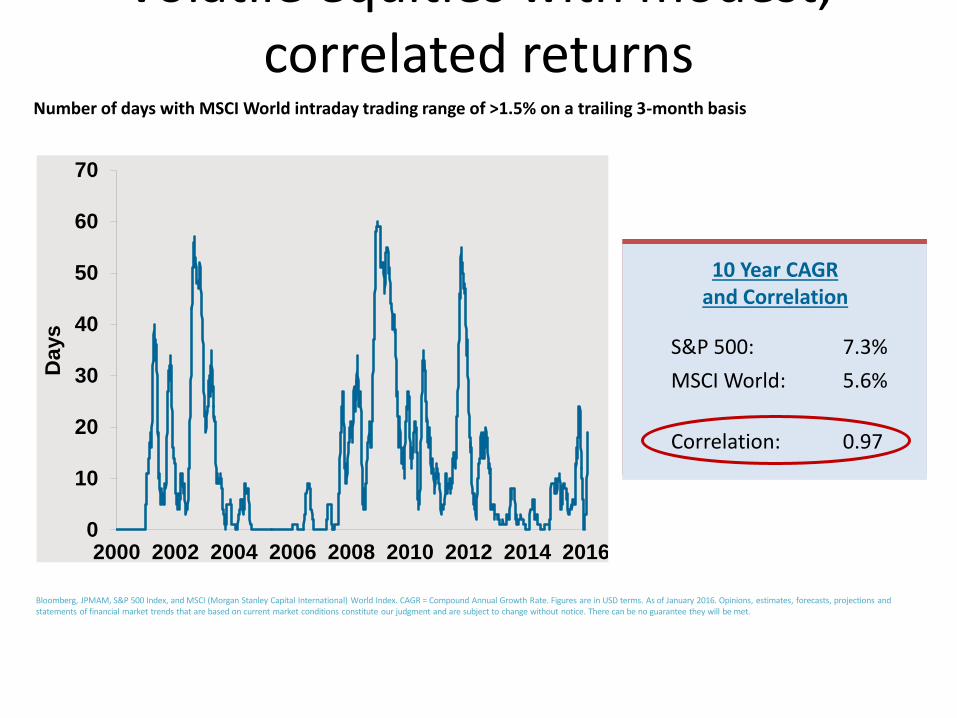
Volatile equities with modest, correlated returns
Number of days with MSCI World intraday trading range of >1.5% on a trailing 3-month basis
Bloomberg, JPMAM, S&P 500 Index, and MSCI (Morgan Stanley Capital International) World Index. CAGR = Compound Annual Growth Rate. Figures are in USD terms. As of January 2016. Opinions, estimates, forecasts, projections and statements of financial market trends that are based on current market conditions constitute our judgment and are subject to change without notice. There can be no guarantee they will be met.
S&P 500: 7.3%
MSCI World: 5.6%
Correlation: 0.97
10 Year CAGR and Correlation
0
10
20
30
40
50
60
70
2000 2002 2004 2006 2008 2010 2012 2014 2016
Da
ys

Why lock-in our outcomes with stocks?
Bloomberg, JPMAM, S&P 500 Index, and MSCI (Morgan Stanley Capital International) World Index. CAGR = Compound Annual Growth Rate. Figures are in USD terms. CAGR and correlation figures are as of December 2015
and the volatility is as of January 2016. Opinions, estimates, forecasts, projections and statements of financial market trends that are based on current market conditions constitute our judgment and are subject to change without
notice. There can be no guarantee they will be met.
STRICTLY PRIVATE | CONFIDENTIAL

50% exposure to stocks?
Bloomberg, JPMAM, S&P 500 Index, and MSCI (Morgan Stanley Capital International) World Index. CAGR = Compound Annual Growth Rate. Figures are in USD terms. CAGR and correlation figures are as of December 2015
and the volatility is as of January 2016. Opinions, estimates, forecasts, projections and statements of financial market trends that are based on current market conditions constitute our judgment and are subject to change without
notice. There can be no guarantee they will be met.
S&P 500 daily closing prices, 20 years
STRICTLY PRIVATE | CONFIDENTIAL
March 2000
Pre-tech wreck
October 2007
Pre-GFC
March 2016
Pre-?
0
500
1000
1500
2000
2500

50% exposure to stocks?
Bloomberg, JPMAM, S&P 500 Index, and MSCI (Morgan Stanley Capital International) World Index. CAGR = Compound Annual Growth Rate. Figures are in USD terms. CAGR and correlation figures are as of December 2015
and the volatility is as of January 2016. Opinions, estimates, forecasts, projections and statements of financial market trends that are based on current market conditions constitute our judgment and are subject to change without
notice. There can be no guarantee they will be met.
S&P 500 daily closing prices, 20 years
STRICTLY PRIVATE | CONFIDENTIAL
0
500
1000
1500
2000
2500
March 2000 Forward PE: 27.2x
October 2007 Forward PE: 15.7x
March 2016 Forward PE: 17.1x

13

Low yielding bonds… for the foreseeable future
Bloomberg, J.P. Morgan Asset Management, Barclays and US Global Aggregate. In USD terms, as of December 2015. Opinions, estimates, forecasts, projections and statements of financial market trends that are based on
current market conditions constitute our judgment and are subject to change without notice. There can be no guarantee they will be met.
Yield-to-Worst on Barclays Global Aggregate
STRICTLY PRIVATE | CONFIDENTIAL
1.8%
1.5%
2.0%
2.5%
3.0%
3.5%
4.0%
4.5%
5.0%
5.5%
6.0%
Barclays Global Agg
Barclays US Agg
Yield to worst
on Jan 1
Annual total
return
Yield to worst on
Jan 1
Annual total
return
2013 1.7% -2.6% 1.8% -2.0%
2014 2.1% 0.6% 2.5% 6.0%
2015 1.6% -2.3% 2.2% 0.5%

Bonds
Lazenby Moore Brosnan Connery Dalton
6’1” 6’2” 6’2” 6’1” 6’2”
STRICTLY PRIVATE | CONFIDENTIAL

Bonds 6’1” 6’2” 6’2” 6’1” 6’2”
5’10”
Craig
STRICTLY PRIVATE | CONFIDENTIAL
Lazenby Moore Brosnan Connery Dalton

17

The evolution of institutional investor portfolios
Source: J.P. Morgan. Estimates, forecasts, and projections are based on current market conditions, constitute our judgment, and are subject to change without notice. The charts and/or graphs shown above and throughout
the presentation are for illustration and discussion purposes only.
Not so long ago
Equity
including Private Equity
Fixed Income
Pre-Realization
Absolute Return
Post-Realization
Real Assets
Equity
Fixed Income
Alts
Equity
Fixed Income
In the next decade, real assets allocations will potentially rise from roughly 10% today to up to 25%
STRICTLY PRIVATE | CONFIDENTIAL

How most investors see the world…
Real Assets =
Real Estate
STRICTLY PRIVATE | CONFIDENTIAL

Real Estate …
Office
Multifamily Industrial
Retail
These examples represent some of the investments of the manager. However, you should not assume that these types of investments will be available to or, if available, will be selected for investment by the manger in the future.
STRICTLY PRIVATE | CONFIDENTIAL

21 | FOR INSTITUTIONAL USE ONLY | NOT FOR PUBLIC DISTRIBUTION
Sounds good, right?

How most investors see the world…
Real Assets >
Real Estate
STRICTLY PRIVATE | CONFIDENTIAL

23

How most investors see the world…
Equities
Large Cap
Small Cap
Micro Cap
Mid Cap
Growth
Value Income
Domestic
International
International Emerging Markets
STRICTLY PRIVATE | CONFIDENTIAL

How most investors see the world…
Fixed Income
High Yield
Corporates
Munis TIPs
CDOs
Treasuries
CMBS
EMD
Government Agencies
STRICTLY PRIVATE | CONFIDENTIAL

How most investors see the world…
Real Assets
Real Estate
STRICTLY PRIVATE | CONFIDENTIAL

How investors should see the world…
Real Assets
Real Estate
STRICTLY PRIVATE | CONFIDENTIAL
Timber
Transportation Water
Energy Farmland
Infrastructure
Real Estate Debt
Maritime
Emerging Markets
Developed Markets

28

Real Assets to the rescue

Higher yield potential than bonds and equities
Source: Barclays Capital Global Aggregate Yield-to-Worst, MSCI World Dividend Yield, FTSE/EPRA NAREIT Global Developed REITs Dividend Yield, J.P. Morgan US Core RE strategy trailing 12-month income return, J.P.
Morgan US Core-plus RE strategy trailing 12-month income return, J.P. Morgan OECD Infrastructure strategy trailing 12-month cash yield, J.P. Morgan US Real Estate Mezzanine strategy trailing 12-month income yield. Global
Maritime is represented by J.P. Morgan’s internal estimates of 12-month trailing income returns on an income-focused investment strategy. As of June 2015 for real assets, and September 2015 for financial assets.
Traditional Assets
1.8% 2.6%
3.6%
4.9% 4.9% 5.5% 5.5%
6.0%
9.0%
0%
1%
2%
3%
4%
5%
6%
7%
8%
9%
GlobalBonds
GlobalEquities
GlobalREITs
EuropeCore RE
U.S.Core RE
APACCore RE
U.S.Core+
RE
OECDInfra
Maritime(Yield)

Lower volatility than equities
Source: MSCI World Index, Global Real Assets Portfolio is representative of an equally-weighted portfolio of: US Core RE (NCREIF – ODCE), Europe Core RE (IPD/CBRE/JPM). Asia-Pacific Core RE (JLL/JPM), and OECD Infrastructure (JP Morgan GRA
Research modeled). As of December 31, 2014. All returns are in local currency (OECD infra is denominated in USD).
-25%
-15%
-5%
5%
15%
25%
19
95
19
96
19
97
19
98
19
99
20
00
20
01
20
02
20
03
20
04
20
05
20
06
20
07
20
08
20
09
20
10
20
11
20
12
20
13
20
14
Qu
arte
rly
Tota
l Ret
urn
s
MSCI Global Equities Diversified Real Assets Portfolio
Corporate Debt
S&P 500
Infrastructure
US CPI
Commodities
Real Estate
0.5
1.5
4.5
13.5
Log
Scal
e
Inflation protection when it matters
Source: Bloomberg, Barclays Capital, Standard & Poors, S&P GSCI (Standard & Poor’s Goldman Sachs Commodity Index), NCREIF, Global Financial Data, and J.P. Morgan Asset Management GRA Research.
Nominal return and inflation indices in the U.S. (growth of $1 invested from 1970-1985)

Diversifying the diversifier
Sources: Bloomberg, MSCI, Barclays Capital, NCREIF, IPD, CBRE, Jones Lang LaSalle, Wilshire, Wells Fargo, UBS, Clarksons Shipping Research, and JPMAM-Global Real Assets. For the following blended portfolios, the portfolio constituents are representative of their respective passive weights: Developed Markets Value Added RE (US Value Added RE and Europe Value Added RE), and Developed Markets Opportunistic RE (US Opportunistic RE and Europe Opportunistic RE). Europe and Asia data is denominated in local currency, all other data is denominated is in USD. Annual data as of December 2014. Note: Unlevered real estate series were levered to reflect how institutional investors typically access the representative asset classes. Global Shipping returns are unlevered. Past performance is not indicative of future results. Diversification does not guarantee investment returns and does not eliminate the risk of loss. The above table is for illustrative and discussion purposes only.
1995 - 2014 Global
Equities
Global
Bonds
Private
Equity
Hedge
Funds
Europe
Core
Real
Estate
U.S.
Core
Real
Estate
APAC
Core
Real
Estate
OECD
Core
Infra
Yield-
Oriented
Maritime/
Transport
All-
Tranche
REITs
Asian
Infra
Global Equities 1.0
Global Bonds 0.0 1.0
Private Equity 0.7 -0.2 1.0
Hedge Funds 0.7 -0.3 0.8 1.0
Europe Core Real Estate 0.4 -0.4 0.5 0.5 1.0
U.S. Core Real Estate 0.1 -0.2 0.3 0.2 0.7 1.0
APAC Core Real Estate 0.2 -0.4 0.3 0.4 0.6 0.4 1.0
OECD Core
Infrastructure 0.0 0.5 0.0 0.1 0.0 0.2 -0.4 1.0
Yield-Oriented
Maritime/Transport 0.1 0.1 0.0 0.1 0.3 0.5 0.5 0.3 1.0
All-Tranche REITs 0.4 0.1 0.2 0.5 0.3 -0.1 0.1 0.2 0.2 1.0
Asian Infrastructure -0.3 0.2 -0.2 -0.1 0.1 0.2 0.1 0.4 0.4 0.4 1.0
High (+1.0) Low (Negative)
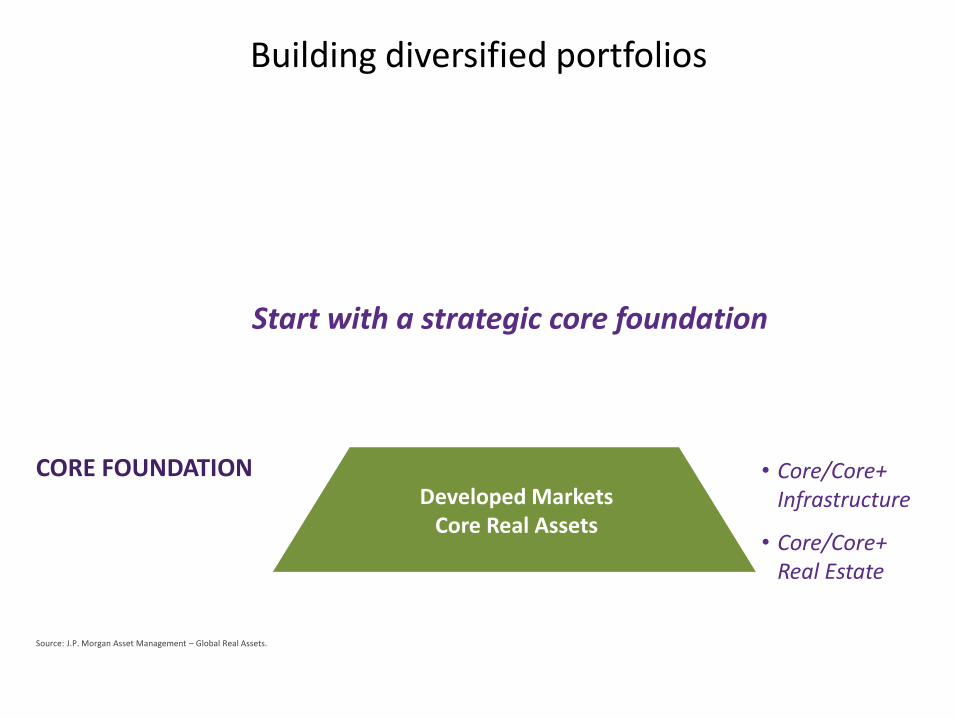
Building diversified portfolios
Source: J.P. Morgan Asset Management – Global Real Assets.
CORE FOUNDATION
Developed Markets
Core Real Assets
• Core/Core+ Infrastructure
• Core/Core+ Real Estate
Start with a strategic core foundation

Building diversified portfolios
Source: J.P. Morgan Asset Management – Global Real Assets.
CORE COMPLEMENTS
CORE FOUNDATION
Developed Markets
Core Real Assets
• Core/Core+ Infrastructure
• Core/Core+ Real Estate
Developed Markets
Complementary Real Assets
• Value Add/Opportunistic Real Assets
• Yield-Oriented Maritime
• Listed Real Assets
Build on the foundation with complementary strategies

Building diversified portfolios
Source: J.P. Morgan Asset Management – Global Real Assets.
GLOBAL DIVERSIFIERS
CORE COMPLEMENTS
CORE FOUNDATION
Developed Markets
Core Real Assets
• Core/Core+ Infrastructure
• Core/Core+ Real Estate
Developed Markets
Complementary Real Assets
Emerging Markets
Real Assets
• EM Real Estate
• EM Infrastructure
• Global Opportunistic Maritime
• Value Add/Opportunistic Real Assets
• Yield-Oriented Maritime
• Listed Real Assets
Add further diversification and return potential

Building diversified portfolios
Source: J.P. Morgan Asset Management – Global Real Assets.
GLOBAL DIVERSIFIERS
CORE COMPLEMENTS
CORE FOUNDATION
Developed Markets
Core Real Assets
• Core/Core+ Infrastructure
• Core/Core+ Real Estate
Developed Markets
Complementary Real Assets
Emerging Markets
Real Assets
• EM Real Estate
• EM Infrastructure
• Global Opportunistic Maritime
• Value Add/Opportunistic Real Assets
• Yield-Oriented Maritime
• Listed Real Assets
Add defensive yield
Real Assets Private Credit CREDIT BASE

Regulated Utilities

Transportation

Contracted Power Generation

Maritime

Real assets potential: In general, more is better and broader is better
Notes: (1) The return ranges are derived from J.P. Morgan Asset Management – GRA’s internal estimates by the investment teams for each of the respective strategies. (2) The portfolio attributes stated in the above table are estimates within ranges and are
for illustration purpose only. (3) Volatility is calculated by taking the standard deviation of annual data for the 20 year time period from 1994 – 2013. (4) Portfolios assumes annual re-balancing. (5) Data is as of December 2013. Sources: NCREIF, IPD, CBRE,
INREV, FTSE/EPRA NAREIT, UBS, Clarkson Research, and JPMAM GRA Research. DISCLAIMER: Past performance is not indicative of future results. Diversification does not guarantee investment returns and does not eliminate the risk of loss. J.P. Morgan
seeks to achieve the stated objectives, but there can be no guarantee the objectives will be met. For discussion purpose only. This information is not intended as a recommendation to invest in any particular asset class or strategy or as a promise of future
performance. References to future returns are not promises or even estimates of actual returns a client portfolio may achieve. Assumptions, opinions and estimates are provided for illustrative purposes only. They should not be relied upon as recommendations
to buy or sell securities. Forecasts of financial market trends that are based on current market conditions constitute our judgment and are subject to change without notice. We believe the information provided here is reliable, but do not warrant its accuracy or
completeness. This material has been prepared for information purposes only and is not intended to provide, and should not be relied on for accounting, and legal or tax advice.
Core RE Only + Infrastructure + Core
Complements + Global Diversifiers
Global Equities
Global Bonds
15% 20% 25% 7%
Historical
Return 7.5% 7.7% 8.1% 8.6%
Volatility 11.2% 10.4% 10.4% 10.1%
Return/
Volatility 0.67 0.74 0.78 0.86

Where many institutional investors are going
Global Real Assets Core Foundation
Global Real Estate 40 – 60%
Global Infrastructure
30 – 50%
Global Maritime/ Transport/Other
10 – 20%
For discussion purposes only. 1The target returns are gross returns for illustrative purposes only and are subject to significant limitations. An investor should not expect to achieve actual returns similar to the target returns shown above. Because of the
inherent limitations of the target returns, potential investors should not rely on them when making a decision on whether or not to invest in the strategy. Please see the complete Target Return disclosure at the conclusion of the presentation for more
information on the risks and limitation of target returns.
Target Total Return1: Target Income Return1: Sectors: Exposure:
8 – 10% 5 – 6% Diversified Global
2 – 3X more income
200 – 300 bps return premium
30 – 40% lower volatility
Better downside resilience and inflation sensitivity
vs. a 60/40 stock/bond portfolio
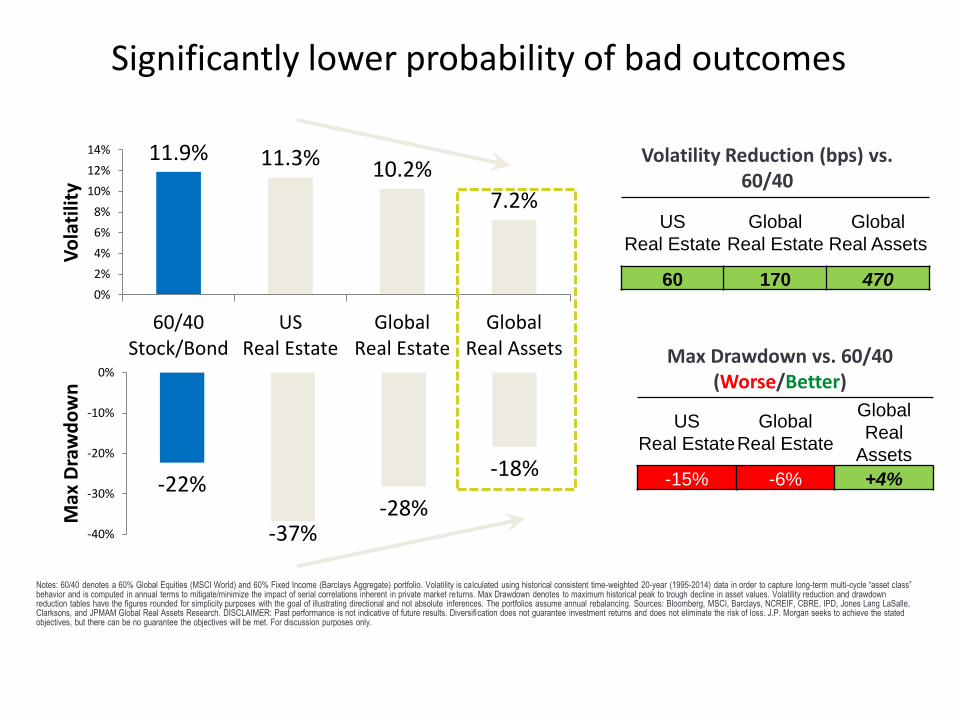
11.9% 11.3% 10.2%
7.2%
0%
2%
4%
6%
8%
10%
12%
14%
60/40Stock/Bond
USReal Estate
GlobalReal Estate
GlobalReal Assets
Vo
lati
lity
-22%
-37% -28%
-18%
-40%
-30%
-20%
-10%
0%
Max
Dra
wd
ow
n
Significantly lower probability of bad outcomes
US
Real Estate
Global
Real Estate
Global
Real Assets
60 170 470
US
Real Estate
Global
Real Estate
Global
Real
Assets
-15% -6% +4%
Volatility Reduction (bps) vs. 60/40
Max Drawdown vs. 60/40 (Worse/Better)
Notes: 60/40 denotes a 60% Global Equities (MSCI World) and 60% Fixed Income (Barclays Aggregate) portfolio. Volatility is calculated using historical consistent time-weighted 20-year (1995-2014) data in order to capture long-term multi-cycle “asset class” behavior and is computed in annual terms to mitigate/minimize the impact of serial correlations inherent in private market returns. Max Drawdown denotes to maximum historical peak to trough decline in asset values. Volatility reduction and drawdown reduction tables have the figures rounded for simplicity purposes with the goal of illustrating directional and not absolute inferences. The portfolios assume annual rebalancing. Sources: Bloomberg, MSCI, Barclays, NCREIF, CBRE, IPD, Jones Lang LaSalle, Clarksons, and JPMAM Global Real Assets Research. DISCLAIMER: Past performance is not indicative of future results. Diversification does not guarantee investment returns and does not eliminate the risk of loss. J.P. Morgan seeks to achieve the stated objectives, but there can be no guarantee the objectives will be met. For discussion purposes only.

45

Important Disclaimers
This document is confidential and intended only for the person or entity to which it has been provided. Any reproduction, retransmission, dissemination or other unauthorised use of this document or the information contained herein by any person or
entity without the express prior written consent of J.P. Morgan Asset Management is strictly prohibited. It is being provided solely for information and discussion purposes and is subject to any updating, completion, modification and amendment
without reference or notification to you.
This document is intended to report solely on investment strategies and opportunities identified by J.P. Morgan Asset Management. Additional information is available upon request. Information herein is believed to be reliable but J.P. Morgan Asset
Management does not warrant its completeness or accuracy. Opinions and estimates constitute our judgment and are subject to change without notice. It is not intended and should not to be taken as an offer or solicitation to buy or sell any security
or interest to anyone in any jurisdiction or to acquire any security or interest. Furthermore, nothing in this document constitutes or should be taken as an advice or recommendation to buy or sell any investment and the material should not be relied
upon as containing sufficient information to support an investment decision. Any investment decision should be based solely upon the information contained in the product’s offering materials. J.P. Morgan Asset Management and/or its affiliates and
employees may hold a position or act as market maker in the financial instruments of any issuer discussed herein or act as underwriter, placement agent, advisor or lender to such issuer. The investments and strategies discussed herein may not be
suitable for all investors; if you have any doubts you should consult your J.P. Morgan Asset Management Client Adviser, Broker or Portfolio Manager. You should consult your tax or legal adviser about the issues discussed herein. The investments
discussed may fluctuate in price or value. Investors may get back less than they invested. Changes in rates of exchange may have an adverse effect on the value, price or income of investments. Any forecasts, figures, opinions, views and investment
techniques, unless otherwise stated, are those of the investment manager/adviser at the time of this document. They are considered to be accurate at the time of writing, but no warranty of accuracy is given and no liability in respect of any error or
omission is accepted. They may be subject to change.
Any investment in the Fund will be accepted solely on the basis of the Memorandum and any applicable Charter Documents for the Fund. Accordingly, this presentation, in whole or in part, will not form the basis of, and should not be relied upon in
connection with, any subsequent investment in the Fund (when established and offered). To the extent that any statements are made in this presentation, they are qualified in their entirety by the terms of the Memorandum and other Fund documents.
A copy of the Memorandum and any Charter Documents must be reviewed prior to making a decision to invest in the Fund. You are urged to read all of the offering materials prior to any application to subscribe into the product. Furthermore you
should note that the Fund may not be authorised or its offering may be restricted in your jurisdiction; it is the responsibil ity of every person reading this document to satisfy himself as to the full observance of the laws of the relevant jurisdiction. You
are also advised to take all necessary legal, regulatory and tax advice on the consequences of an investment in the Fund.
Investments in alternative investments, such as those described herein, may not be suitable for certain investors and should not constitute a complete investment programme. Any investments should only be made by those who fully understand and
are willing to accept and assume the risks involved with alternative investments. Alternative investments often engage in leverage and other investment practices that can be extremely speculative and involve a high degree of risk. Such practices may
increase the volatility of performance and the risk of investment loss, including the loss of the entire amount that is invested. Moreover, there can be no assurance that the investment strategy of the product will be achieved.
The Portfolio Target Return is based on current available investment opportunities and predictions of the real asset market and economic conditions generally. Because the Fund has an indefinite term and current estimates of market conditions are
likely to change over time, prospective investors should note that the actual realized return over the term of the Fund may vary materially from the Portfolio Target Return. The Investment Adviser reserves the right to amend the Portfolio Target Return
without the consent of Investors in the event the Investment Adviser determines, in its absolute discretion, that such amendment is warranted by a material change in circumstances. While under no obligation to do so, the Fund may enter into
transactions or investments in relation to any or all of currency exchange, interest rate, inflation rate, commodity or other risks in connection with investments. There can be no assurance, in such cases, that (a) such hedges will (i) be available, (ii ) be
available at a reasonable cost, (iii) be sufficient to mitigate the relevant risk or (iv) actually eliminate the risk of fluctuation in rates being hedged or (b) counterparties to any hedging transaction would perform as expected. There is also no certainty
that any hedging transaction will prove beneficial to the Fund. The Fund may become liable for substantial costs from remedying environmental problems associated with the properties it holds. The costs of any such remediation may exceed the
value of the relevant property and/or the aggregate assets of the Fund. Environmental problems may also affect the use and operation of such properties.
The statements herein containing words such as "may," "will," "should," "expect," "anticipate," "estimate," "intend," "continue" or "believe" or the negatives thereof or other variations thereon or comparable terminology are forward-looking statements
and not historical facts. For example, the Portfolio Target Return noted herein is a forward-looking statement. Due to various risks, uncertainties and assumptions, including, without limitation, those set forth herein and in the Memorandum, actual
events or results or the actual performance of the Fund may differ materially from those reflected in or contemplated by such forward-looking statements. Among the factors that could cause actual results to differ materially are: the general economic
climate, inflationary trends, competition and the supply of, and demand for, property investments in the target markets, interest rate levels, the availability of financing, potential environmental liability and other risks associated with the ownership,
development and acquisition of real assets, changes in the legal or regulatory environment, and greater than anticipated construction or management costs.
For Institutional/Professional Clients only – not for Retail use or distribution

Important Disclaimers
You should take note that information and data from communications with you will be collected, stored and processed by J.P. Morgan Asset Management in accordance with the EMEA Privacy Policy which can be accessed through the following website
http://www.jpmorgan.com/pages/privacy
J.P. Morgan Asset Management is the brand for the asset management business of JPMorgan Chase & Co. and its affiliates worldwide. This communication is issued by the following entities: in the United Kingdom by JPMorgan Asset Management (UK)
Limited, which is regulated by the Financial Conduct Authority; in other EU jurisdictions by JPMorgan Asset Management (Europe) S.à r.l.; in Switzerland by J.P. Morgan (Suisse) SA, which is regulated by the Swiss Financial Market Supervisory Authority
FINMA; in Hong Kong by JF Asset Management Limited, or JPMorgan Funds (Asia) Limited, or JPMorgan Asset Management Real Assets (Asia) Limited, all of which are regulated by the Securities and Futures Commission; in India by JPMorgan Asset
Management India Private Limited which is regulated by the Securities & Exchange Board of India; in Singapore by JPMorgan Asset Management (Singapore) Limited, which is regulated by the Monetary Authority of Singapore; in Japan by JPMorgan
Securities Japan Limited, which is regulated by the Financial Services Agency; in Australia by JPMorgan Asset Management (Australia) Limited, which is regulated by the Australian Securities and Investments Commission; in Brazil by Banco J.P. Morgan
S.A., which is regulated by The Brazilian Securities and Exchange Commission (CVM) and Brazilian Central Bank (Bacen); and in Canada by JPMorgan Asset Management (Canada) Inc., which is a registered Portfolio Manager and Exempt Market
Dealer in all Canadian provinces and territories except the Yukon and is also registered as an Investment Fund Manager in Bri tish Columbia, Ontario, Quebec and Newfoundland and Labrador. This communication is issued in the United States by J.P.
Morgan Investment Management Inc., which is regulated by the Securities and Exchange Commission. Accordingly this document should not be circulated or presented to persons other than to professional, institutional or wholesale investors as defined
in the relevant local regulations. The value of investments and the income from them may fall as well as rise and investors may not get back the full amount invested.
IRS Circular 230 Disclosure: JPMorgan Chase & Co. and its affiliates do not provide tax advice. Accordingly, any discussion of U.S. tax matters contained herein (including any attachments) is not intended or written to be used, and cannot be used, in connection with the promotion, marketing or recommendation by anyone unaffiliated with JPMorgan Chase & Co. of any of the matters addressed herein or for the purpose of avoiding U.S. tax-related penalties.
© 2015 JPMorgan Chase & Co. All rights reserved.