joel simpson 19/05/2004 department of chemical engineerings3.amazonaws.com/zanran_storage/... ·...
TRANSCRIPT

Joel Simpson A Grindability Study of Cement Clinker: Drop Weight Testing
i
Joel Simpson
19/05/2004
Department of Chemical Engineering
Supervisors: Ian Kidd, Jim Lister

Joel Simpson A Grindability Study of Cement Clinker: Drop Weight Testing
ii
AcknowledgementsThis report would not have been successfully completed without the help andguidance of numerous people. Firstly I would like to thank both of my supervisors,Ian Kidd and Professor Jim Lister. I would like to thank all of the people at theJKMRC but in particular I would like to thank Rob Morrison, Jon Worth and DavidCollins for aiding me with all of their expertise regarding communition and thelaboratory equipment. Furthermore, I would like to thank Professor Alban Lynch forproviding me with a plethora of information regarding his work in Turkey using dropweight testing for cement clinker, which forms the basis of this report.
I would also like to thank my family for all of their support.

Joel Simpson A Grindability Study of Cement Clinker: Drop Weight Testing
iii
DeclarationThis report is submitted purely for credit for CHEE4006 Individual Inquiry in myChemical Engineering degree and for no other degree. The work presented in thisreport is original unless otherwise acknowledged.
Joel Simpson

Joel Simpson A Grindability Study of Cement Clinker: Drop Weight Testing
iv
AbstractCement clinker makes up for 95 percent of the material used to make cement. Clinkeris a synthetic rock that is the result of the granulization of limestone (decalcinated intolime), fly ash or clay in a kiln reaching 1450°C. The clinker is combined withgypsum and ground to a very fine particle size of less than 45 µm. Hence sizereduction is of vital importance in the design of a cement manufacturing process.Additionally, the structural characteristics of cement clinker can vary significantlybetween different plants, which can result in a variation of the grindability properties.As comminution (size reduction of particles) accounts for 40 percent of the totalpower usage for the entire cement manufacturing process it is critical that sizereduction units are optimized. (Benzer, Genc, Levent Ergun, Oner, 2002)
The following report is designed to assess both the Grindability of several cementclinkers using a modified version of the JK drop weight test and to assess the validityof using such a test for cement clinkers. In addition to these aims, the grindabilityresults were compared with previous work carried out on the same samples that hadundergone drop weight testing for this report. The samples were taken from cementproduction plants in Kandos, Railton (Portland cement) and Rockhampton (whitecement).
The most important information attained from this report was that of the three samplesthe relative grindability ranking (in ascending order) was: Kandos, Railton, andRockhampton. It appears that while the two Portland clinkers show some of theexpected relationship with their other physico-chemical properties, the Rockhamptonclinker behaved in a more unpredictable manner.
The Drop weight test is some what effective at determining the grindabilitycharacteristics of cement clinkers. Due to excessive time requirements, and a lack ofaccuracy for smaller particles the grindability test is not a considerably practicalmethod for assessing the grindability of cement clinker on an industrial level.

Joel Simpson A Grindability Study of Cement Clinker: Drop Weight Testing
ii
ContentsAcknowledgements .................................................................................................iiDeclaration.............................................................................................................iiiAbstract..................................................................................................................ivContents ..................................................................................................................iiList of Figures .......................................................................................................iiiList of Tables ............................................................... Erreur ! Signet non défini.1 Problem Definition ........................................................................................ 12 Literature Review .......................................................................................... 22.1 The Cement Process....................................................................................2
2.1.1 Grindability and the Cement Process...................................................22.2 Grindability ................................................................................................3
2.2.1 Rittenger’s Postulate ...........................................................................32.2.2 Kick’s law...........................................................................................42.2.3 Bonds Law..........................................................................................42.2.4 Material Properties That Affect Grindability .......................................5
2.3 The Drop Weight Test.................................................................................52.3.1 Alternative Methods for Assessing Grindability ..................................7
2.4 Cement Chemistry ......................................................................................93 Methodology ................................................................................................113.1 Methodology Background.........................................................................113.2 Equipment ................................................................................................113.3 Safety .......................................................................................................123.4 Sample Preparation ...................................................................................12
3.4.1 Sample Acquisition ...........................................................................123.4.2 Initial Sieving....................................................................................133.4.3 Test Preparation ................................................................................13
3.5 Drop Weight Testing.................................................................................14General Test Description ..................................................................................143.5.1 Operation ..........................................................................................153.5.2 Maintenance......................................................................................16
4 Results and Discussion .................................................................................164.1 PSD (Particle Size Distribution)................................................................164.2 XRF Bogue’s Compositions......................................................................194.3 Voids Fraction ..........................................................................................205 Recommendations ........................................................................................216 Conclusion....................................................................................................227 Acknowledgments ........................................................................................238 Appendices .................................................................................................... 18.1 Raw Data....................................................................................................28.2 PSD ...........................................................................................................6
Joel Simpson A Grindability Study of Cement Clinker: Drop Weight Testing
iii
List of Figures
Figure 1..............................................................................................................................................2Figure 2 The CaO-Al2O3-SiO2 system .................................................................................................9Figure 3 The CaO-SiO2 system ......................................................................................................... 10Figure 5 Drop Weight Tester Diagram .............................................................................................. 15Figure 6............................................................................................................................................ 16Figure 7............................................................................................................................................ 17Figure 8............................................................................................................................................ 18Figure 9............................................................................................................................................ 18Figure 10.......................................................................................................................................... 19Figure 11.......................................................................................................................................... 20Figure 12.......................................................................................................................................... 21

Joel Simpson A Grindability Study of Cement Clinker: Drop Weight Testing
1
1 Problem DefinitionCement clinker makes up for 95 percent of the material used to make cement. Clinkeris a synthetic rock that is the result of the granulization of limestone (decalcinated intolime), fly ash or clay in a kiln reaching 1450°C. The clinker is combined withgypsum and ground to a very fine particle size of less than 45 µm. Hence sizereduction is of vital importance in the design of a cement manufacturing process.Additionally, the structural characteristics of cement clinker can vary significantlybetween different plants, which can result in a variation of the grindability properties.As comminution (size reduction of particles) accounts for 40 percent of the totalpower usage for the entire cement manufacturing process it is critical that sizereduction units are optimized. (Benzer, Genc, Levent Ergun, Oner, 2002)
The four main substances that make up cement clinker are aluminate, ferrite and thesilicates alite and belite. The level of abundance and structural arrangement of thesecomponents in cement clinker (as well as some minor components such as periclase)is suspected to greatly alter the grindability of clinker. Also physical properties of theclinkers such as voids space should also affect grindability. As all of thesecharacteristics are resultant from plant operation and raw feed streams, which varygreatly from plant to plant, the corresponding grindability should also vary greatly.This gives rise to the need to develop relationships between grindability and thevarious before mentioned physico-chemical characteristics.
The aim of the proposed project is to measure the grindability of a set range of clinkersamples and relate them to previously measured characteristics of the same sampleset. The sample set consists of three cement clinkers as listed in the following table(Table 1). These samples have been measured for voids fraction testing, XRF (X-RayFlorescence), XRD (X-Ray Diffraction), MLA, and optical microscopy during a jointUniversity of Queensland and Cement Australia clinker characterization project. Thegrindability results generated in the proposed study will be compared with theseresults in order to further develop relationships with Cement Australia’s clinkercharacterization properties. The proposed method to assess grindability is dropweight testing which will be carried out using JKMRC equipment. The secondaryobjective for this report is to assess how effective the drop weight test is to assess thegrindability of cement clinkers.Table 1: Sample Types
Sample Name SampleNumber
DateSampled
NetWeight
Source
Kandos Clinker Sample XX00069 24/12/2003
27kg Kandos
Railton Clinker Sample XX00070 7/1/2004 17kg RailtonRockhampton ClinkerSample
XX00071 7/1/2004 10kg Rockhampton
Joel Simpson A Grindability Study of Cement Clinker: Drop Weight Testing
2
2 Literature Review
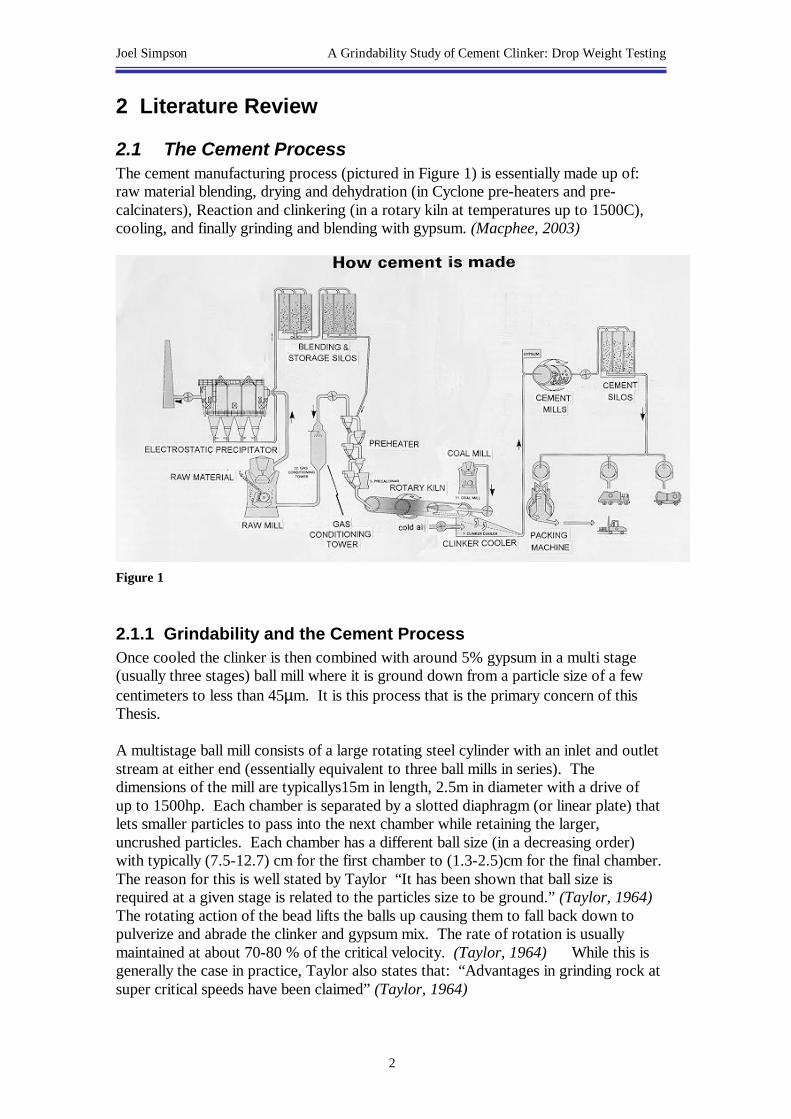
2.1 The Cement ProcessThe cement manufacturing process (pictured in Figure 1) is essentially made up of:raw material blending, drying and dehydration (in Cyclone pre-heaters and pre-calcinaters), Reaction and clinkering (in a rotary kiln at temperatures up to 1500C),cooling, and finally grinding and blending with gypsum. (Macphee, 2003)
Figure 1
2.1.1 Grindability and the Cement ProcessOnce cooled the clinker is then combined with around 5% gypsum in a multi stage(usually three stages) ball mill where it is ground down from a particle size of a fewcentimeters to less than 45µm. It is this process that is the primary concern of thisThesis.
A multistage ball mill consists of a large rotating steel cylinder with an inlet and outletstream at either end (essentially equivalent to three ball mills in series). Thedimensions of the mill are typicallys15m in length, 2.5m in diameter with a drive ofup to 1500hp. Each chamber is separated by a slotted diaphragm (or linear plate) thatlets smaller particles to pass into the next chamber while retaining the larger,uncrushed particles. Each chamber has a different ball size (in a decreasing order)with typically (7.5-12.7) cm for the first chamber to (1.3-2.5)cm for the final chamber.The reason for this is well stated by Taylor “It has been shown that ball size isrequired at a given stage is related to the particles size to be ground.” (Taylor, 1964)The rotating action of the bead lifts the balls up causing them to fall back down topulverize and abrade the clinker and gypsum mix. The rate of rotation is usuallymaintained at about 70-80 % of the critical velocity. (Taylor, 1964) While this isgenerally the case in practice, Taylor also states that: “Advantages in grinding rock atsuper critical speeds have been claimed” (Taylor, 1964)

Joel Simpson A Grindability Study of Cement Clinker: Drop Weight Testing
3
Grinding aides (such as triethanolamine) can be used to increase the efficiency of themill. Also close circuit grinding can increase the efficiency of the mill as it avoidsover production of fines and coating. The most effective cement mill operations canachieve particle sizes between 3µm and 30µm in the product stream. (Taylor, 1964)
Heat production accounts for 90% of the input energy of the mill causing a rise intemperature of 75 to 80C over the mill. This is undesirable, not only because thistemperature is a form of inefficient energy usage, but also because it can cause theGypsum to dehydrate. Hence a cooling system is required, typically in the form ofexternal wetting. (Taylor, 1964)
2.2 GrindabilityComminution refers to the size reduction of solid particles, typically from theminerals processing industry. Grindability is a measure of how much energy isrequired to change a particle from one size to another. There are many methods forassessing grindability; hence the various measures of grindability can have differentunits. However the majority of grindability measures are given in kWh/t.
Assessing grindability is important as it highly energy intensive, inefficient and variesa great deal from material to material. To further this Rhodes states: “5% of allelectricity generated is used in size reduction; based on the energy required for thecreation of a new surface, the industrial scale model is 1% efficient.” (Rhodes, 1998)To make matters worse, despite size reduction processes receiving and increasinglevel of research and development attention, the efficiency problems associated withcomminution are still present. (Rhodes, 1998)
Three fundamental comminution equations have been developed to predict the energyrequirements for particle size reduction. These are: Rittinger (1867), Kick (1885),Bond (1952). (Rhodes, 1998)
2.2.1 Rittenger’s PostulateRittenger developed the following equation (Equation 2.1) based on the assumptionthat “the energy required for particle size reduction was directly proportional to thearea of new surface created.” (Rhodes, 1998) This equation is commonly applied tosmall particle size reduction operations (ultra fine grinding).Equation 2.1Rittinger’s Postulate: (Rhodes, 1998)
E = CR 1 – 1 or in differential form dE = - CR 1x2 x1 dx x2
WhereCR = Rittinger’s constantE = Breakage energy per unit mass of feedx1 = Initial particle size (diameter)x2 = Final particle size (diameter)
Key Assumptions: Shape factors and density are constant.

Joel Simpson A Grindability Study of Cement Clinker: Drop Weight Testing
4
2.2.2 Kick’s lawKick theorized that: “the energy required in any comminution process was directlyproportional to the ratio of volume of the feed particle to the product particle.”(Rhodes, 1998) Kick’s law is usually used for larger particle size comminutionoperations (coarse crushing and crushing). However Kicks proposal is not practicalfor a large number of operations as it assumes that the same amount of energyrequired to grind a 10cm particle to a 1µm particle is required for a 1m boulder to bereduced to 10cm in size. Hence Kicks law is extremely inaccurate when used toextrapolate data to obtain a small sized particle product. (Rhodes, 1998)Equation 2.2Kick’s Law: (Rhodes, 1998)
E = CK ln x1 or in differential form dE = CK 1x2 dx x
WhereCK = Kick’s Law constantE = Breakage energy per unit mass of feedx1 = Initial particle size (diameter)x2 = Final particle size (diameter)
Key Assumptions:Shape factors are constant.E is directly proportional to the volume ratio x1
3/x23
2.2.3 Bonds LawBonds formula uses an experimentally derived parameter termed the “Bonds workindex” Wi. ”Bonds work index Wi, is defined as the energy required to reduce thesize of the unit mass of material from infinity to 100 µm.” (Rhodes, 1998) Bondsequation is reliable for approximating the energy requirement (grindability) forparticles less than 100 µm. Bonds law is highly suitable for intermediate sizedparticles and is the most commonly used of the three equations. (Rhodes, 1998)Equation 2.3Bond’s Law: (Rhodes, 1998)
EB = W1 10 - 10 or in differential form dE = CB 1√X2 √X1 dx x3/2
WhereW1 = Bond work index (determined empirically).EB = Energy required to reduce the top particle size of the material from x1 to x2.X1 = Feed sieve size 80% passing.X2 = Product sieve size 80% passing.

Joel Simpson A Grindability Study of Cement Clinker: Drop Weight Testing
5
2.2.4 Material Properties That Affect GrindabilityThe following factors all affect the grindability properties of the material to varyingdegrees: (Rhodes, 1998)
o Hardness – moh’s scale 1-10o Abrasiveness - highly abrasive material require lower mill rotation speedso Toughness/Brittleness – resistance to crack propagationo Cohesivity/adhesivity- stickiness (related to lower particle size and moisture
content)o Carrier mediumo Milling circuit –closed with multiple passes or open and single passo Melting pointo Fibrous material
2.3 The Drop Weight TestThe JK Drop Weight test was developed by the JKMRC in 1992 in order to measurethe breakage parameters resulting from impact. This test is designed for assessing thegrindability of ores in AG/SAG milling conditions and is fast becoming a standardprocedure for the minerals processing industry. (JKTech, 2003) The test is primarilydesigned to be analyzed by JKSimMet software for the design of AG/SAG mills. Adrop weight tester is defined as “a single particle double impact breakage apparatus”(Benzer, Genc, Levent Ergun, Oner, 2002) The JKMRC states the importance ofDrop weight testing with: “The effect of particle size on impact breakage is importantin AG/SAG milling. Some ores indicate a decrease in impact resistance withincreasing particle size, whereas others show little or no variation.” (JKTech, 2003)
There are two forms of breakage in most size reduction applications; these are impactand abrasion. Impact breakage usually involves high energy and is the primarymeasurement that the drop weight test is used for. Abrasion involves lower energybreakage affects such as inter-particle rubbing and particle interaction with millcomponents (walls, balls etc). The standard JK drop weight test accounts for abrasionwith the use of a tumbling test, which determines an abrasion breakage parameter ta.“The standard abrasion test tumbles 3 kg of -55 +38 mm particles for 10 minutes at70% critical speed in a 305 mm by 305 mm laboratory mill fitted with 4 x 6 mm lifterbars.” (JKTech, 2003) However the modified drop weight test for clinker can notaccount for this as the test requires 3 kg of a particle size that is far from prominent inthe current samples to be tested.
The Standard JKMRC drop weight test has an average turnaround time of one to twoweeks. The material that is to be tested should be sufficiently brittle as plasticdeformation drastically impedes test progress. The JK Drop weight test is limited bythe size distribution that can be tested. This will directly affect the drop weighttesting of clinker as the typical size distribution is much smaller than that required forthe standard drop weight test. A great deal of sample would be required to sieve outthe necessary amounts of material in the size ranges required for the JK test.Therefore a modified version of the test is required to account for the smaller particlesize distribution of cement clinker. (JKTech, 2003)
The first step of standard drop weight procedure requires that the test sample be drysieved into the following size ranges: 63+53mm, -45+37.5mm, -31.5+26.5mm, -

Joel Simpson A Grindability Study of Cement Clinker: Drop Weight Testing
6
22.4+19mm, -16+13.2mm. Sub-samples are taken form each of these size fractionsand their particles are individually broken at three different energy levels to give 25size energy combinations. .” (JKTech, 2003) The crushed samples are then sievedwith a √2 series to obtain their PSD (Particle Size Distributions). From the sizedistributions a value of t10 can be obtained. t10 is the percentage of crushed materialpassing one tenth of the original particle size (the geometric mean of the upper andlower limits of the initial size range). The t10 parameter is related to the specificenergy Ecs with the following formula:
t10=A(1-e-bEcs) (JKTech, 2003)
From this equation and the data obtained for the various energy and sizecombinations, the A and b parameters can be found using a minimization of errorsquared routine. A and b are parameters related to the impact breakage resistance ofthe test sample and is usually reported as a singe value of the product of A by b. Thisvalue represents the slope of the t10 vs. Ecs curve at a specific energy of 0 kWh/t.(JKTech, 2003) The lower the value of the A*b parameter, the higher the impactbreakage resistance of the material and the lower the “grindability”.
As the standard drop weight test is not designed specifically for cement clinkergrinding operations, a modified version of the test is required. A modified version ofthe drop weight test for cement clinker is proposed by (Benzer, Genc, Levent Ergun,Oner, 2002). The most prominent modification of this version of the drop weight testis that the initial size fractions are more appropriate for cement clinker. These sizesare (-22.6 +16), (-16 +13), (–13.2 +11.2), (-11.2 +9.5), (-9.5 +8.0), (-8.0 +6.7) mmand will be used for this study of clinker grindability. Another interesting aspectwhere this paper deviates from the standard JK test is that more than one t value iscalculated to obtain a t-family curve. T values of t2,t4,t10,t25,t50 and t75were plotted totheir corresponding geometric mean initial sizes. (Benzer, Genc, Levent Ergun, Oner,2002) Additionally, “t10 versus other distribution parameters are plotted to obtain t-family curves through which the product size distribution resulting from the breakageof the considered size fraction at any Ecs can be established.” (Benzer, Genc, LeventErgun, Oner, 2002)
The main findings of the (Benzer, Genc, Levent Ergun, Oner, 2002)report were:
o “Impact breakage distribution function of clinker changes with particle sizedistribution”
o “At about 4.5 kWh/t each size fraction start to produce approximately thesame amount of fines”
o “Since clinker is not a homogeneous material consisting of various mineralphases with different dimensions and properties, breakage property can beaffected by the microstructure and mineralogical composition beside theincluded microcracks.”
o “The most reliable results in terms of breakage pattern was obtained from thebreakage of (-9.5 +8.0) mm clinker particles at an energy level of about 3kWh/t- below this energy level the results begin to loose consistency”
o “1kWh/t is a critical specific energy – above this energy level every test sizefraction start to break in the same manner- below this level inconsistentbehaviour occurs.”
Joel Simpson A Grindability Study of Cement Clinker: Drop Weight Testing
7
o “As the particle size gets finer, self similarity of the broken product sizedistribution increases.”
o “According to the breakage test results, (-9.5, +8.0) mm size fraction and 1kWh/t was accepted as a standard for the determination of impact breakagedistribution functions of clinkers required for the modeling and simulation ofmulti-compartment ball mills in the cement industry.”
o “Simulation studies of industrial cement grinding circuits, clinkers of differentorigins should be characterized separately.” (Benzer, Genc, Levent Ergun,Oner, 2002)
2.3.1 Alternative Methods for Assessing GrindabilityMany methods have been identified that are used or could potentially be used forassessing the grindability of cement clinker. As grindability has several types ofmeasures, there are several types of corresponding methods of analysis. Thesealternative methods are primarily, the Bond test, the Hardgrove machine test, and theBlueler mill test. In addition to many other forms of grindability tests exist that maybe used to assess the grindability of cement clinker. Bayles and Buchanan describethe benefits and problems associated with using two of these methods on cementclinker with: “Both of these tests (Bonds test and Hardgrove machine method) aregood and have been used extensively to determine clinker grindability and in turn tosize finish mills when commercial grindability was not available. However, they arerelatively expensive, require a considerable equipment investment, need a largesample, and are time consuming.” (Bayles Buchanan, 1983)
Bond BMWI TestThe Bond BMWI (Bond Mill Work Index) test was invented by Fred Bond in 1952and modified in 1961. (JKTech, 2003) This test essentially used to calculate thespecific breakage energy using Bond’s Law (equation 2.3). The standard Bond’s testuses P80 and F80 for the values for X1 and X2 in the Bond’s Law equation, where P80and F80 are the 80% passing sizes for the product and feed respectively. Bayles andBuchanan have conducted bond’s BMWI test on eight clinker samples that “showed a(bonds work index) low of 10.8 a high of 18, with an average of 13.2.” (BaylesBuchanan, 1983)
The standard procedure for the Bond BMWI test (as out lined by (JKTech, 2003)) isas follows:
o Stage crush the feed to a particle size less than 3.35mm and extract arepresentative sample.
o Conduct a series of batch grinds in a standard Bond mill (0.305m by 0.305m,running at 70 rpm, with a ball charge of 285 balls with a mass of 20.125kg).Initially 700ml of sub sample is used for the first batch grind for 100revolutions.
o The product is screened to remove the undersized particles and the differencein feed weight made up with additional feed sample.
o This process is repeated at least 7 times until the weight of undersized productper revolution reaches equilibrium.
One restriction of the test is that the closing screen size must be as close as possible tothe actual screen size (less than 45µm in the case of cement). (JKTech, 2003) This
Joel Simpson A Grindability Study of Cement Clinker: Drop Weight Testing
8
restriction imposes several problems for using the test in cement grindingapplications. The test has a high dependence on the accuracy of P80. However due tothe inaccuracy of dry sieving at such a small particle size wet sieving is required.This poses further problems a cement clinker is not chemically stable in the presenceof water and the cyclic nature of the sieving and receiving of the final product wouldguarantee chemical instability in the clinker and consequently a change in its physicalproperties. One solution to this problem would be to use an alcohol solution that doesnot react with cement clinker, however this posses economic issues. Furthermore,time issues may also be present: “The bond grindability test method is a very long testwith respect to time” (Hemati, Nadir, 1995)
Hardgrove Machine TestThe Hardgrove machine test was developed by Babcock & Wilcox Co. and is nowaccepted by ASTM as the standard for coal grinding. The test has been adapted tomeasure the grindability of several other materials, including cement clinker. TheHardgrove machine index for Portland cement clinker is reported to range from 26 to50, with an average of 37.8. (Bayles Buchanan, 1983) Hematri and Nadir state thesuitability of the Hardgrove machine test for cement clinker applications with: “Theresults of Hardgrove normal (Hardgrove classic) and Kapur methods were very closeto the results of the bond grindability test.” (Hemati, Nadir, 1995)
Bleuler Mill TestBayles and Buchanan have conducted a test using a Bleuler mill to assess thegrindability of cement clinker. Bayles and Buchanan give the advantages of thisprocedure with “The Bleuler mill uses a small sample size, produces Portland cementfineness in a short period of time, and is available to most Portland cementlaboratories.” (Bayles Buchanan, 1983)
The Blueler mill in conducted firstly by grinding 47 g of clinker and 3 g of gypsum(all previously ground to minus ¼ an inch) in a Bleuler mill for varying time intervals(7.5, 15, 30 60 and 120) seconds. The Blaine fineness is measured with a porosity of0.45 for the 7.5 second sample, 0.47 for the 15 and 30 second, and 0.50 for the 60 and120 second tests. The results of grinding time versus Blaine fineness were correlatedwith other empirical data to obtain a relationship of kW vs. Blain fineness. (BaylesBuchanan, 1983)
o The following list summarizes the findings of the (Bayles Buchanan,1983/1984) tests:
o Crystal size shows a negative correlation with calcium and a positive one withpotassium, kiln type, sulfur and aphthitalite.
o Kiln Type shows a positive correlation with sulfur and size, and a negative onewith C3S.
o KW's had a positive correlation with Silica and Kiln Type.o Blaine had a positive correlation with ignition loss.o formed crystals were harder to grind than clinker showing a less prominent
crystal structure

Joel Simpson A Grindability Study of Cement Clinker: Drop Weight Testing
9
o Ignition loss plays an important part in Blaine surface area. The most probablecause of the increase in Blaine is the hydration products, which are definitelyshown in the SEM Photographs.
o Crystal size and shape definitely affect grindability. However, they areextremely hard to define as an assignable cause because of being able to see avery limited number.
o There is a definite relationship between the excess sulfate available, above thatrequired to satisfy the alkalis. Further work needs to be done on this to see ifthrough some minor chemical changes clinker grindability can be improved.”
2.4 Cement ChemistryPortland cement clinker is produced with a high temperature reaction of a limebearing substance with one bearing silica, alumina and iron oxides. Portland cementwas patented by Joseph Aspdin in the mid-1800’s as a substance containing 65-70%CaO, 18-24% SiO2, 3-8% Fe2O3, 3-8% Al2O3 plus smaller proportions of minoroxides (e.g. Na2O, K2O, MgO, etc.). The composition of modern cement issignificantly different and varies with a multitude of cement types and plantspecifications. (Macphee, 2003) factor that influence the composition of cementclinker include raw material selection, kiln design and operation. The main phases ofcement clinker are given by Taylor as:”Tricalciumsilicate C3S “alite”, β-dicalciumsilicate β-C2S “Belite”, tricalcium Aluminate C3A and ferrite C2F or C2A. AlsoPericlase MgO, Freelime CaO, and Alkali sulphates. It is well established that none ofthe major phases has an exact composition.” (Taylor, 1964)
The data regarding raw meal composition and the design of kiln conditions can beobtained by equilibrium phase diagrams picture as Figure 2 and Figure 3. (Macphee,2003) “The CaO-SiO2 (figure X) and CaO-Al2O3-SiO (figure X)2 systems are binaryand ternary systems respectively.” (Macphee, 2003) The composition of the productmay be presented in an oxide analysis or a mineral composition calculated using theBogue Equation.
Figure 2 The CaO-Al2O3-SiO2 system(Macphee, 2003)

Joel Simpson A Grindability Study of Cement Clinker: Drop Weight Testing
10
Figure 3 The CaO-SiO2 system(Macphee, 2003)

Joel Simpson A Grindability Study of Cement Clinker: Drop Weight Testing
11
3 Methodology
3.1 Methodology BackgroundThe Methodology chosen for the laboratory work included in this thesis was anadaptation of the standard JKTech drop weight test (JKTech, 2001) and the testprocedure proposed by (Genc, Benzer, Ergun and Oner, 2002). The test developed bythe JKMRC is currently the industry standard for drop weight testing. However, thestandard JKTech test is designed for comparatively larger particles than that ofcement clinker. Hence a modified version of the JKTech test must be employed toassess the grindability of cement clinker. The test outlined in the paper by (Genc,Benzer, Ergun and Oner, 2002) uses a similar method to that of the JKTech dropweight test, however the energies and size ranges have been adapted for cementclinker. Only the lower input energy (1kWh/t) of the four energies in this paper willbe employed, as the JKMRC drop weight tester is not capable of achieving the highestenergy levels. The resultant energies and particle size ranges are as follows
Particle Size Ranges–22.4 mm, +16.0 mm-16.0 mm, +13.2 mm-13.2 mm, +11.2 mm-11.2 mm, +9.5 mm-9.5 mm, +8.0 mm-8.0 mm, +6.7 mm
Input Energy Levels1.0 kWh/t2.0 kWh/t3.0 kWh/t
3.2 EquipmentThe equipment required for the drop weight test procedure for cement clinker is asfollows:
o 1 x JKMRC “small” semi-automated drop weight test apparatuso 1 x Long handled brusho 1x Pair of tongso 1 x Safety stopper (in the event that the apparatus’s safety stopper is not
functioning.o 2 x Trayso 1x Large 20kg+ tray sieve shakero 1 x Sieve bottoms trayo 7 x Sieve trays of sizes (22.4mm, 16.0mm, 13.2mm, 9.5mm, 8.0mm, 6.7mm)o 1 x Hand sieving apparatuso 1 x collection bucketo 1 x large sample bago 6 x small sample bagso Brown paper (to cover table)o 1 x Rubber stopper for the drop weight testero 1 x Small sieves

Joel Simpson A Grindability Study of Cement Clinker: Drop Weight Testing
12
o 1 x Small sieve shakero 1 x Small sieve collectoro 1 scaleo Various weights of differing mass
3.3 SafetyThe safety concerns are primarily based on the drop weight tester. The drop weighttester uses a falling weight to crush the sample particles. This has the potential to incause serious injury. Other hazards include:
o Dust (respiration)o Sieve shakers (moving parts)o Lifting heavy weights
Some precautions to be observed while using the drop weight tester areo Keep hands and other body parts from being directly under the drop weight-
use long brushes and tongs to achieve this.o Faulty, worn or loose components must be repaired before useo When cleaning or adding a particle on and around the weight, make sure that
the metal safety bar is in place.o Turn air cleaners on (not so high that sample is lost).o Wear the appropriate PPE (Personal Protective Equipment) while working
The PPE required to use the drop weight testers and the sieve shaker are as follows:o Steel-caped boots (heavy sample drums/ sieve trays)o Overalls/ long pants and long sleeved shirt.o Protective glasses/goggleso Ear plugs (while machinery is on)o Respiratory mask
3.4 Sample Preparation
3.4.1 Sample AcquisitionOnce the samples were approved for use they were located and transported to theJKMRC. The personnel at the site then provided shelf space for the samples. Thesamples had to be signed in and labeled according to the JKMRC labeling system.The following table (Table 2) shows the various names and samples numbers for allsamples tested.

Joel Simpson A Grindability Study of Cement Clinker: Drop Weight Testing
13
Table 2
Sample Name Cement AustraliaSample Number
JKMRC SampleNumber
Kandos Clinker Sample XX00069 1719-4Railton Clinker Sample XX00070 1719-5Rockhampton ClinkerSample
XX00071 1719-6
3.4.2 Initial SievingInitial sieving is primarily concerned with the separation of the samples into subsamples based on their corresponding particle size range. Before the initial sievingstage could commence, the samples were vigorously shaken by hand. Once this wasachieved the large 20 kg capacity 22.4 mm sieve was used to filter out all of theparticles larger than this particle size and the residue collected. The reason why thiswas done by hand was because the large sieve shaker only supports the use of sixsieve trays and seven sieves are required to obtain the required particle size grades.
Dust vacuum cleaners were turned on for respiratory safety. The sieve machine wasthen made ready for the insertion of sieve trays. All of the sieves required wereselected, cleaned, inserted and fastened into the sieve shaker in order of decreasingsieve size (from top to bottom). The sample passing the 22.4 mm sieve was thenplaced in the top tray (16 mm) and the doors closed. The timer was set to 3 minutesand the machine turned on.
Once the shaker was finished the residues were collected, bagged and weighed. Thetrays were then cleaned for the next user and the over and undersized particles werereturned to the original container. Sample s were labeled and stored in a largersample bag in the allocated shelf space.
3.4.3 Test PreparationThe size fraction samples were then divided into three or four (where possible) subsamples of 100g to 250g each. These samples were then weighed and a sample wascounted to find the number of particles in the sample. From this information the meanparticle mass mp was calculated. The Abrasion test requires 3kg or particles in thesize range of –55mm+37.5mm (recording the number of particles in the sample). Therelative density requires 30 particles in the size fraction of –55mm+37.5mm.
The height Hr that the drop weight is to raised to can be determined from the particlemass mp, the required specific input energy Eis, with a trial and error approach toobtain the optimum drop weight mass MD for the test. The optimum drop weightmass MD for the test is the mass that gives the highest drop weight height Hr, with outexceeding the apparatus limits (a height of 1 m). The following equations arerequired to achieve this.
Input EnergyEis = Hr*MD (JKTech, 2001)

Joel Simpson A Grindability Study of Cement Clinker: Drop Weight Testing
14
WhereEis = Input energy [kg.cm]Hr = Height of drop [cm]MD = Mass of drop weight head [kg]
Specific Input EnergyEis = Hr* MD*0.0272 (JKTech, 2001)
MpWhereEis = Input energy [kg.cm]Mp = Mean mass of a single particle
Effective Drop HeightHr = Eis* Mp . (JKTech, 2001)
MD*0.0272He = Hr + HfWhereHe = Height of the drop weight above the anvil before drop [cm]Ht = Height of the drop weight above the anvil after drop [cm]
3.5 Drop Weight Testing
General Test DescriptionThe drop weight test uses six particle size fractions, and impacts the individualparticles of these samples with three differing impact energies using a weight of aknown mass, dropped from a predetermined height. The test is repeated for all of theparticles in the size fraction and the resultant crushed particles are carefully collected.The crushed particles are then sieved to determine the PSD (Particle SizeDistribution). This is repeated for all of the energy – particle size fractioncombinations. The resultant percentage of particles passing one tenth of the originalparticle size t10, is used to find the value of the specific energy Ecs for each of thevarious size ranges. (Where the original particle size is the geometric mean of aparticular size fraction). The following formula is used to achieve this.t10 = A(1-ebEcs) (JKTech, 2003)wheret10 = Percentage passing 1/10th of the original sizeA and b = are parameters calculated using a minimization of error squared routine.Ecs = Specific Energy [kWh/t]A+b = the slope of the curve at Ecs = 0
Figure 5 is a picture of the JKTech drop weight tester used for this experiment. Thefollowing (Figure 4) is a diagram depicting the Drop weight tester.

Joel Simpson A Grindability Study of Cement Clinker: Drop Weight Testing
15
Figure 5 Drop Weight Tester Diagram
(JKTech,2003)
3.5.1 OperationThe following is that standard JKMRC procedure for the operation of the drop weighttester. (JKTech, 2001)
1. Conduct an inspection of the lifting mechanism.2. Select the required drop weight and fix in place on the truck.3. Adjust the height limiting stop to the required height and fix in place (screw
handles)4. Lift (using button) weight to higher than the metal safety block, place safety
block on the anvil (If it has not automatically done so) and lower the weight torest on the block.
5. Remove the rubber stopper with tongs6. Clean the anvil, hammer and surrounding containment area with long handled
brush. Discard any excess particle residue from previous tester.7. Insert a test particle using tongs8. close the access door9. Raise the drop weight to the height stop.10. Release the head and watch for bounce.- if bounce occurs recheck height
calculations.11. Open the door to measure the gap between the anvil and the face of the head to
obtain the resting height- this is only required for the first ten particles.Calculate the average for these ten heights.
12. Lift the head, make sure that the safety stop is in place and brush the crushedparticles off the plate with a long handled brush.
13. Check that the drop height has not moved after five tests.14. Calculate the mean resting height.15. Repeat test for all particles in the sample.16. Collect the broken fragments to sieve with a root two sieve series.17. Repeat procedure for all size energy combinations
Figure 4 Drop Weight Test

Joel Simpson A Grindability Study of Cement Clinker: Drop Weight Testing
16
3.5.2 MaintenanceThe high impacts that the drop weight has to endure means that the apparatus must bewell maintained to ensure accurate results. Impact facts should be checked andground down if any bumps have appeared. The head should never be dropped withouta particle to absorb the impact.
4 Results and DiscussionThe Raw data has been interoperated in various forms in order to obtain a n insight tothe various combinations of mass, particle size and Energy level. Note that A*bvalues could not be obtained as there was insufficient data, namely only one energylevel was tested (with the exception of the Kandos -13.2, +11.2 sample). However,several comparisons can be made with the current data for all three samples, whichwere tested to determine if any relationship concerning grindability exists between thethree types of cement clinker. From these inter-sample comparisons and thephysicochemical data obtained during previous testing by Cement Australia, anyrelationships between grindability and other physicochemical characteristics can beidentified.
4.1 PSD (Particle Size Distribution)From the raw data collected from sieving the crushed particles after having undergonedrop weight test several PSDs (Particle Size Distribution) where derived. As thisexperiment was partially modeled on the procedure outlined by (Benzer, Genc,Levent Ergun, Oner, 2002) the results will be expressed in a similar form. This paper(Benzer, Genc, Levent Ergun, Oner, 2002) also determined a standard for drop weighttesting of cement clinker as “(-9.5, +8.0) mm size fraction and 1 kWh/t was acceptedas a standard for the determination of impact breakage distribution functions ofclinkers”. Hence the data obtained for these conditions is presented in the followingthree PSD plot (Figure 6).
Cement Clinker Drop Weight Test PSD (-9.5, +8.0)mm(1kWh/t)
0.0
5.0
10.0
15.0
20.0
25.0
0.01 0.10 1.00 10.00
Particle Size (mm)
Perc
ento
fTot
alM
ass
(%)
Rockhampton Kandos Railton
Figure 6

Joel Simpson A Grindability Study of Cement Clinker: Drop Weight Testing
17
Other PSD plots for all of the other size fractions can be seen in Appendix X. Theraw data can be found in Appendix A. In all PSDs for all three clinker samples thereis a general trend that the order of grindability (in ascending order) is: Kandos,Railton, Rockhampton. This relationship was determined on the basis that a moregrindable substance should (at the same initial size and crushed with the same amountof energy) be broken down to give a PSD consisting of smaller particle sizes.Furthermore it is also apparent in all PSDs that the Rockhampton sample issignificantly different to the other two samples and that the Kandos and Rockhamptonsamples have relatively similar PSDs (and therefore, grindabilities). This could beattributed to the Rockhampton sample being a “white” cement clinker and the Railtonand Rockhampton samples being more typical Portland cement clinkers. This will bediscussed further in the XRF and voids fraction sections of this report.
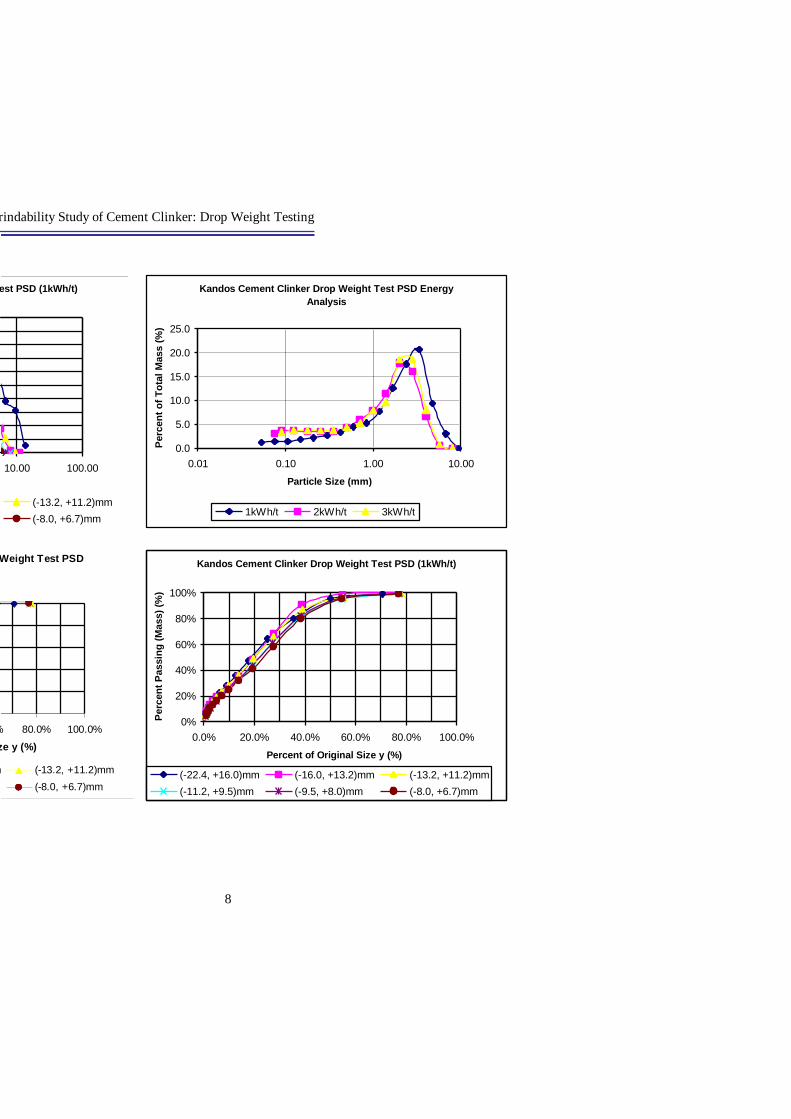
The following three figures (figures 7, 8 &9) show all of the 1kWh/t PSDs for everyinitial particle size for each of the clinker samples. Note that there is a general trendthat the final particle size decreases with decreasing initial particle size, as expectedfrom both intuition and data obtained by (Benzer, Genc, Levent Ergun, Oner, 2002).
Rockhampton Cement Clinker Drop Weight Test PSD(1kWh/t)
0.0
5.0
10.0
15.0
20.0
25.0
0.01 0.10 1.00 10.00 100.00
Particle Size (mm)
Per
cent
ofTo
talM
ass
(%)
(-22.4, +16.0)mm (-16.0, +13.2)mm (-13.2, +11.2)mm(-11.2, +9.5)mm (-9.5, +8.0)mm (-8.0, +6.7)mm
Figure 7

Joel Simpson A Grindability Study of Cement Clinker: Drop Weight Testing
18
Kandos Cement Clinker Drop Weight Test PSD (1kWh/t)
0.0
5.0
10.0
15.0
20.0
25.0
0.01 0.10 1.00 10.00 100.00
Particle Size (mm)
Per
cent
ofTo
talM
ass
(%)
(-22.4, +16.0)mm (-16.0, +13.2)mm (-13.2, +11.2)mm(-11.2, +9.5)mm (-9.5, +8.0)mm (-8.0, +6.7)mm
Figure 8
Railton Cement Clinker Drop Weight Test PSD (1kWh/t)
0.02.04.06.08.0
10.012.014.016.018.020.0
0.01 0.10 1.00 10.00 100.00
Particle Size (mm)
Per
cent
ofTo
talM
ass
(%)
(-22.4, +16.0)mm (-16.0, +13.2)mm (-13.2, +11.2)mm(-11.2, +9.5)mm (-9.5, +8.0)mm (-8.0, +6.7)mm
Figure 9
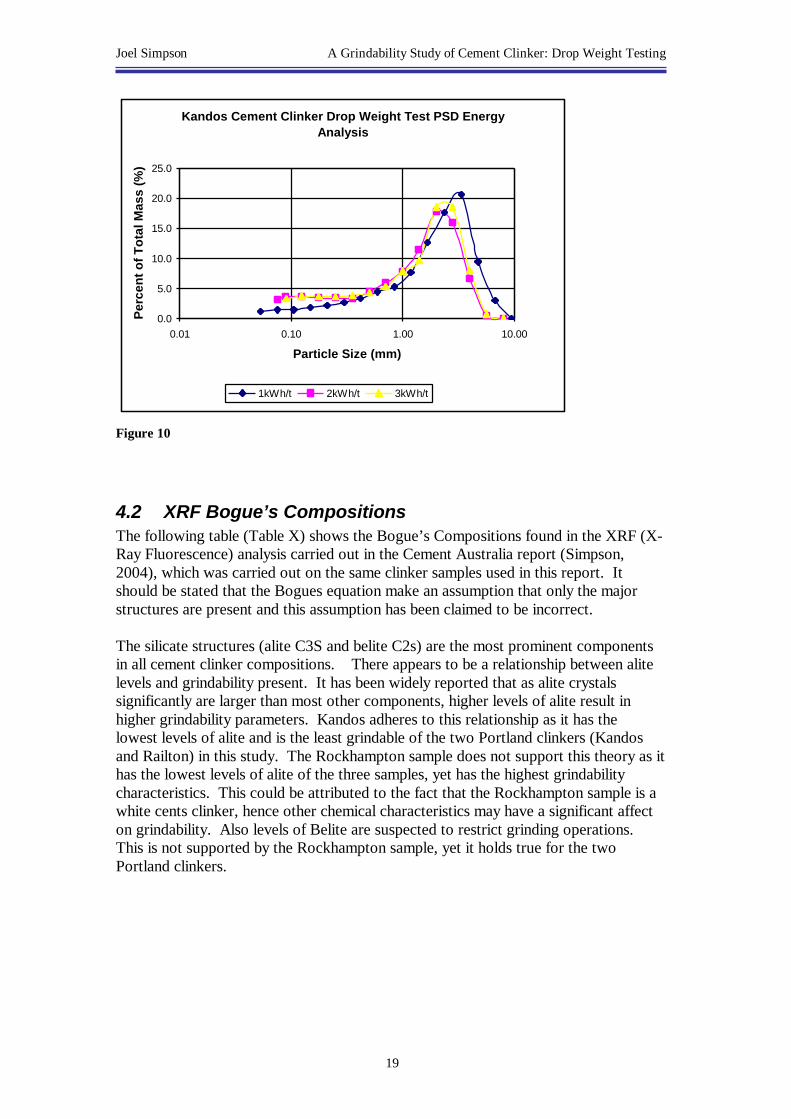
The following graph (Figure 10) shows the PSD for the three energy levels results for(13.2, +11.2) mm. Note that only the energy levels for this particle initial particle sizewas obtained. From this graph there is an trend that the higher energy level the morefines produced. However there is some interesting behavior regarding the 3 and 2kWh/t samples in that they are so similar and in some aspects the previous relationship does not hold true.
Joel Simpson A Grindability Study of Cement Clinker: Drop Weight Testing
19
Kandos Cement Clinker Drop Weight Test PSD EnergyAnalysis
0.0
5.0
10.0
15.0
20.0
25.0
0.01 0.10 1.00 10.00
Particle Size (mm)
Per
cent
ofTo
talM
ass
(%)
1kWh/t 2kWh/t 3kWh/t
Figure 10
4.2 XRF Bogue’s CompositionsThe following table (Table X) shows the Bogue’s Compositions found in the XRF (X-Ray Fluorescence) analysis carried out in the Cement Australia report (Simpson,2004), which was carried out on the same clinker samples used in this report. Itshould be stated that the Bogues equation make an assumption that only the majorstructures are present and this assumption has been claimed to be incorrect.
The silicate structures (alite C3S and belite C2s) are the most prominent componentsin all cement clinker compositions. There appears to be a relationship between alitelevels and grindability present. It has been widely reported that as alite crystalssignificantly are larger than most other components, higher levels of alite result inhigher grindability parameters. Kandos adheres to this relationship as it has thelowest levels of alite and is the least grindable of the two Portland clinkers (Kandosand Railton) in this study. The Rockhampton sample does not support this theory as ithas the lowest levels of alite of the three samples, yet has the highest grindabilitycharacteristics. This could be attributed to the fact that the Rockhampton sample is awhite cents clinker, hence other chemical characteristics may have a significant affecton grindability. Also levels of Belite are suspected to restrict grinding operations.This is not supported by the Rockhampton sample, yet it holds true for the twoPortland clinkers.

Joel Simpson A Grindability Study of Cement Clinker: Drop Weight Testing
20
Table 3
Kandos Primary Oxides (%) Bogue Mineral Analysis (%)Sample No. XX00069 CaO SiO2 Al2O3 Fe2O3 SO3 C3S C2S C3AC4AF Σ σc 1 XRF >1.18mm <2.36mm (Darra) 65.9 21.8 5.4 3.3 0.6 60.0 17.3 8.8 9.9 95.93.0812 XRF >1.18mm <2.36mm(Gladstone)
66.3 21.5 5.4 3.1 0.5 64.5 12.9 9.0 9.5 95.93.071
Mean 66.1 21.6 5.4 3.2 0.6 62.2 15.1 8.9 9.7 95.93.076Railton Primary Oxides (%) Bogue Mineral Analysis (%)Sample No. XX00070 CaO SiO2 Al2O3 Fe2O3 SO3 C3S C2S C3AC4AF Σ σc 1 XRF >1.18mm <2.36mm (Darra) 65.9 22.0 4.7 3.8 0.7 62.4 16.0 6.0 11.4 95.83.0852 XRF >1.18mm <2.36mm(Gladstone)
66.7 21.4 4.7 3.7 0.5 70.7 8.0 6.3 11.1 96.13.080
Mean 66.3 21.7 4.7 3.7 0.6 66.6 12.0 6.1511.3 96.03.083Rockhampton Primary Oxides (%) Bogue Mineral Analysis (%)Sample No. XX00071 CaO SiO2 Al2O3 Fe2O3 SO3 C3S C2S C3AC4AF Σ σc 1 XRF >1.18mm <2.36mm (Darra) 68.8 24.9 5.0 0.6 0.2 55.8 29.3 12.31.8 99.23.1652 XRF >1.18mm <2.36mm(Gladstone)
69.2 24.4 4.9 0.5 0.0 62.3 23.0 12.11.6 99.03.150
Mean 69.0 24.7 5.0 0.6 0.1 59.1 26.1 12.21.7 99.13.157
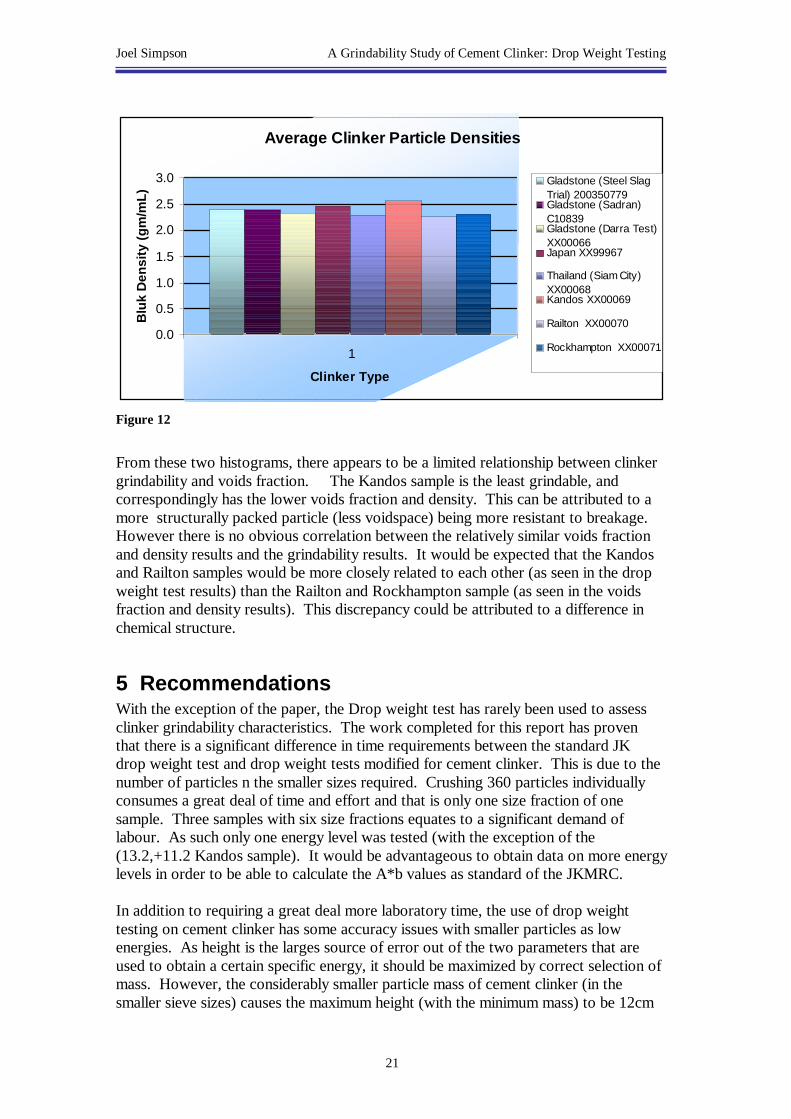
4.3 Voids FractionThe following two figures (Figures X & Y)are histograms of voids fraction and bulkdensity obtained from the Cement Australia report (Simpson, 2004).
Average Clinker Voids Fractions
0.00
0.05
0.10
0.15
0.20
0.25
0.30
Clinker Type
Void
sFr
actio
n
Gladstone (Steel SlagTrial) 200350779Gladstone (Sadran)C10839Gladstone (Darra Test)XX00066Japan XX99967
Thailand (Siam City)XX00068Kandos XX00069
Railton XX00070
Rockhampton XX00071
Figure 11
Joel Simpson A Grindability Study of Cement Clinker: Drop Weight Testing
21
Average Clinker Particle Densities
0.0
0.5
1.0
1.5
2.0
2.5
3.0
1
Clinker Type
Blu
kD
ensi
ty(g
m/m
L)
Gladstone (Steel SlagTrial) 200350779Gladstone (Sadran)C10839Gladstone (Darra Test)XX00066Japan XX99967
Thailand (Siam City)XX00068Kandos XX00069
Railton XX00070
Rockhampton XX00071
Figure 12
From these two histograms, there appears to be a limited relationship between clinkergrindability and voids fraction. The Kandos sample is the least grindable, andcorrespondingly has the lower voids fraction and density. This can be attributed to amore structurally packed particle (less voidspace) being more resistant to breakage.However there is no obvious correlation between the relatively similar voids fractionand density results and the grindability results. It would be expected that the Kandosand Railton samples would be more closely related to each other (as seen in the dropweight test results) than the Railton and Rockhampton sample (as seen in the voidsfraction and density results). This discrepancy could be attributed to a difference inchemical structure.
5 RecommendationsWith the exception of the paper, the Drop weight test has rarely been used to assessclinker grindability characteristics. The work completed for this report has proventhat there is a significant difference in time requirements between the standard JKdrop weight test and drop weight tests modified for cement clinker. This is due to thenumber of particles n the smaller sizes required. Crushing 360 particles individuallyconsumes a great deal of time and effort and that is only one size fraction of onesample. Three samples with six size fractions equates to a significant demand oflabour. As such only one energy level was tested (with the exception of the(13.2,+11.2 Kandos sample). It would be advantageous to obtain data on more energylevels in order to be able to calculate the A*b values as standard of the JKMRC.
In addition to requiring a great deal more laboratory time, the use of drop weighttesting on cement clinker has some accuracy issues with smaller particles as lowenergies. As height is the larges source of error out of the two parameters that areused to obtain a certain specific energy, it should be maximized by correct selection ofmass. However, the considerably smaller particle mass of cement clinker (in thesmaller sieve sizes) causes the maximum height (with the minimum mass) to be 12cm

Joel Simpson A Grindability Study of Cement Clinker: Drop Weight Testing
22
when it should be much higher than this to minimize error. One solution to this is todesign a more effective light weight head. A lighter head was tried available howeverit was not compatible with the current JK drop weight tester and the loss of energy tofriction was so high that the head stopped halfway down the rails on the first drop.Also, as the communition of cement clinker is a fine grinding process with a productparticle size of less than 45µm, it is questionable as to whether the grindabilityparameters obtained from the drop weight test could be extrapolated to the smallersizes of the process without significant losses in accuracy.
6 ConclusionThe Drop weight test is some what effective at determining the grindabilitycharacteristics of cement clinkers. The three samples that were tested have beencompared with the current chemical data previously obtained by Cement Australiaregarding the chemical and physical properties of the selected samples. There appearsto be some relationships with grindability and composition, voids fraction anddensity. However there are also many discrepancies with what would have beenexpected. Due to time requirements, and a lack of accuracy for smaller particles thegrindability test is not a considerably practical method for assessing the grindability ofcement clinker on an industrial level.
Joel Simpson A Grindability Study of Cement Clinker: Drop Weight Testing
23
7 AcknowledgmentsC E Buchanan Jr, H J Bayles, 1983, Influence of Chemistry and Microstructure onPortland Cement Clinker Grindability, Roan Industries inc., Coplay Cement Companyhttp://www.roanind.com/InflofChemandMicro.htm
C E Buchanan Jr, H J Bayles, 1984, Grindability of Clinker, Roan Industries inc.,Coplay Cement Companyhttp://www.roanind.com/GrindofClink.htm
Omurden Genc, A. Hakan Benzer, S. Levent Ergun, Muammer Oner., 2002,Investigation of Breakage Behaviour of Clinker Particles by Drop Weight Testing,International Mineral Processing Symposium, Cappadocia, Turkey.
Hemati, Nader, 1995, A Comparison of Grindability Methods for Cement Clinker,Middle east technical university, Natural and applied sciences, Mining engineering.Ankara, Turkeyhttp://dbase.irandoc.ac.ir/00229/00229131.htm
Jktech, 2003, Bond Mill Work Index Testing, Jktech pty ltd, Indooroopilly.http://www.jktech.com.au/LabServices/bond_ball_mill_test_2.htmLast updated October 27, 2003
Jktech, 2003, Drop Weight Testing, Jktech pty ltd, Indooroopilly.
Donald E. Macphee, 2003, Cement Chemistry, University of Aberdeen, Aberdeenhttp://www.abdn.ac.uk/chemistry/research/dem/cemhon.doc
Minerals Engineering Online, 2004, The As and Bs of SMCs - A New Small-SampleRock Fracture Test, Minerals Engineering Online(Jan.26, 2004) http://www.min-eng.com/commin_recent.html
Martin Rhodes, 1998, Introduction to Particels Technology, John Wiley & Sons,Brisbane.
J.M.Simpson, 2004, Clinker Sample Preparation and Testing, Cement Australia,Milton
H.F.W.Taylor, 1964, The Chemistry of Cements Vol1, Academic Press, London.
A Grindability Study of Cement Clinker: Drop Weight Testing
2
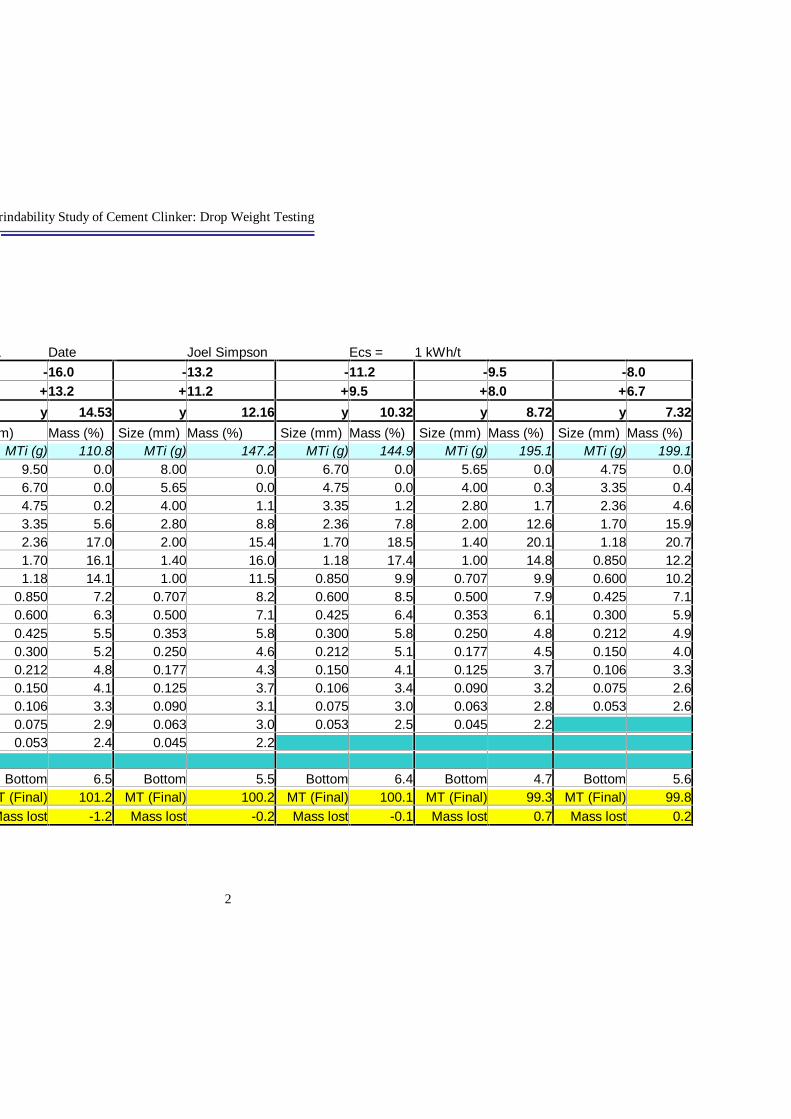
XX00071 Date Joel Simpson Ecs = 1 kWh/t-16.0 -13.2 -11.2 -9.5 -8.0+13.2 +11.2 +9.5 +8.0 +6.7y 14.53 y 12.16 y 10.32 y 8.72 y 7.32
Size (mm) Mass (%) Size (mm) Mass (%) Size (mm) Mass (%) Size (mm) Mass (%) Size (mm) Mass (%)MTi (g) 110.8 MTi (g) 147.2 MTi (g) 144.9 MTi (g) 195.1 MTi (g) 199.1
9.50 0.0 8.00 0.0 6.70 0.0 5.65 0.0 4.75 0.06.70 0.0 5.65 0.0 4.75 0.0 4.00 0.3 3.35 0.44.75 0.2 4.00 1.1 3.35 1.2 2.80 1.7 2.36 4.63.35 5.6 2.80 8.8 2.36 7.8 2.00 12.6 1.70 15.92.36 17.0 2.00 15.4 1.70 18.5 1.40 20.1 1.18 20.71.70 16.1 1.40 16.0 1.18 17.4 1.00 14.8 0.850 12.21.18 14.1 1.00 11.5 0.850 9.9 0.707 9.9 0.600 10.2
0.850 7.2 0.707 8.2 0.600 8.5 0.500 7.9 0.425 7.10.600 6.3 0.500 7.1 0.425 6.4 0.353 6.1 0.300 5.90.425 5.5 0.353 5.8 0.300 5.8 0.250 4.8 0.212 4.90.300 5.2 0.250 4.6 0.212 5.1 0.177 4.5 0.150 4.00.212 4.8 0.177 4.3 0.150 4.1 0.125 3.7 0.106 3.30.150 4.1 0.125 3.7 0.106 3.4 0.090 3.2 0.075 2.60.106 3.3 0.090 3.1 0.075 3.0 0.063 2.8 0.053 2.60.075 2.9 0.063 3.0 0.053 2.5 0.045 2.20.053 2.4 0.045 2.2
Bottom 6.5 Bottom 5.5 Bottom 6.4 Bottom 4.7 Bottom 5.6MT (Final) 101.2 MT (Final) 100.2 MT (Final) 100.1 MT (Final) 99.3 MT (Final) 99.8Mass lost -1.2 Mass lost -0.2 Mass lost -0.1 Mass lost 0.7 Mass lost 0.2

A Grindability Study of Cement Clinker: Drop Weight Testing
3
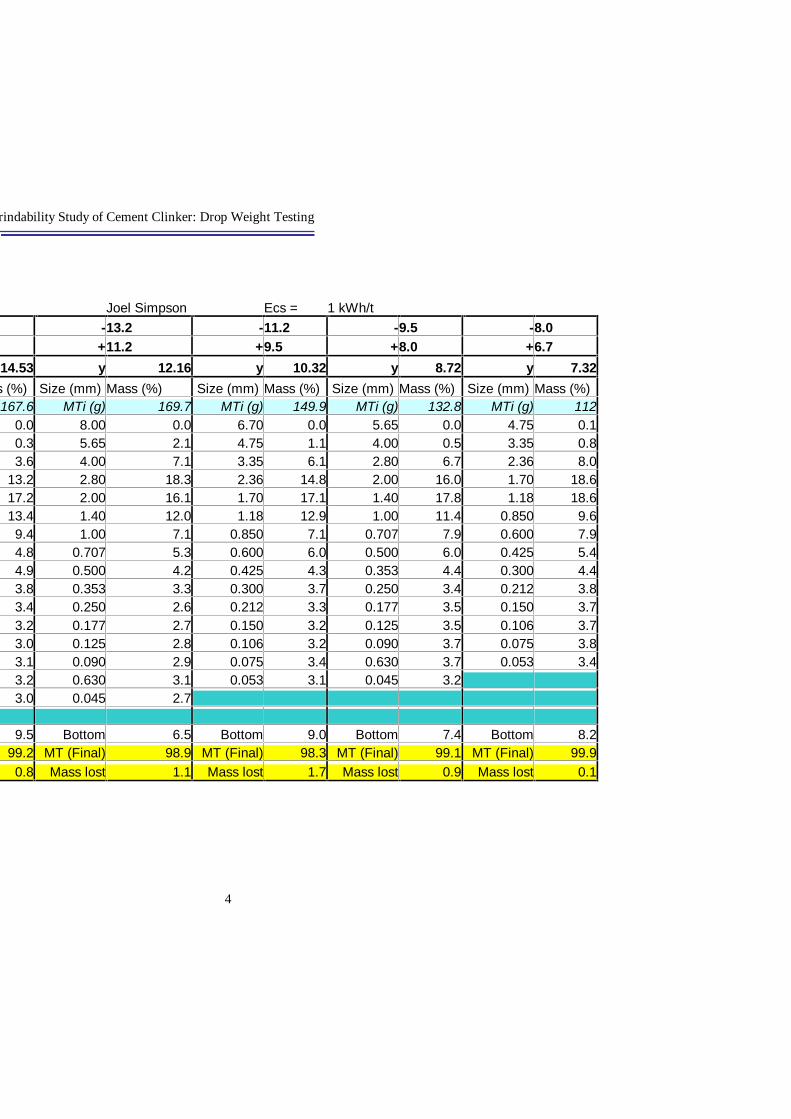
Joel Simpson Ecs = 1 kWh/t-13.2 -11.2 -9.5 -8.0+11.2 +9.5 +8.0 +6.7
14.53 y 12.16 y 10.32 y 8.72 y 7.32Mass (%) Size (mm) Mass (%) Size (mm) Mass (%) Size (mm) Mass (%) Size (mm) Mass (%)
240.1 MTi (g) 246.6 MTi (g) 246.7 MTi (g) 245.7 MTi (g) 195.70.0 8.00 0.0 6.70 0.4 5.65 0.2 4.75 0.41.2 5.65 3.0 4.75 3.6 4.00 3.1 3.35 3.78.5 4.00 9.4 3.35 13.2 2.80 13.8 2.36 15.4
22.7 2.80 20.6 2.36 20.1 2.00 21.2 1.70 21.819.9 2.00 17.6 1.70 17.4 1.40 17.7 1.18 17.412.8 1.40 12.6 1.18 12.2 1.00 10.7 0.850 8.98.8 1.00 7.7 0.850 6.4 0.707 7.1 0.600 7.35.2 0.707 5.3 0.600 5.4 0.500 5.5 0.425 4.91.8 0.500 4.5 0.425 3.9 0.353 4.0 0.300 3.83.5 0.353 3.4 0.300 3.1 0.250 2.8 0.212 3.12.9 0.250 2.7 0.212 2.6 0.177 2.5 0.150 2.52.5 0.177 2.2 0.150 2.1 0.125 2.0 0.106 2.02.0 0.125 1.9 0.106 1.7 0.090 1.7 0.075 1.81.6 0.090 1.5 0.075 1.3 0.063 1.6 0.053 1.61.4 0.063 1.5 0.053 1.3 0.045 1.41.2 0.045 1.2
4.4 Bottom 4.3 Bottom 4.5 Bottom 4.2 Bottom 5.3100.4 MT (Final) 99.5 MT (Final) 99.2 MT (Final) 99.6 MT (Final) 99.7
-0.4 Mass lost 0.5 Mass lost 0.8 Mass lost 0.4 Mass lost 0.3
A Grindability Study of Cement Clinker: Drop Weight Testing
4
Joel Simpson Ecs = 1 kWh/t-13.2 -11.2 -9.5 -8.0+11.2 +9.5 +8.0 +6.7
14.53 y 12.16 y 10.32 y 8.72 y 7.32Mass (%) Size (mm) Mass (%) Size (mm) Mass (%) Size (mm) Mass (%) Size (mm) Mass (%)
167.6 MTi (g) 169.7 MTi (g) 149.9 MTi (g) 132.8 MTi (g) 1120.0 8.00 0.0 6.70 0.0 5.65 0.0 4.75 0.10.3 5.65 2.1 4.75 1.1 4.00 0.5 3.35 0.83.6 4.00 7.1 3.35 6.1 2.80 6.7 2.36 8.0
13.2 2.80 18.3 2.36 14.8 2.00 16.0 1.70 18.617.2 2.00 16.1 1.70 17.1 1.40 17.8 1.18 18.613.4 1.40 12.0 1.18 12.9 1.00 11.4 0.850 9.69.4 1.00 7.1 0.850 7.1 0.707 7.9 0.600 7.94.8 0.707 5.3 0.600 6.0 0.500 6.0 0.425 5.44.9 0.500 4.2 0.425 4.3 0.353 4.4 0.300 4.43.8 0.353 3.3 0.300 3.7 0.250 3.4 0.212 3.83.4 0.250 2.6 0.212 3.3 0.177 3.5 0.150 3.73.2 0.177 2.7 0.150 3.2 0.125 3.5 0.106 3.73.0 0.125 2.8 0.106 3.2 0.090 3.7 0.075 3.83.1 0.090 2.9 0.075 3.4 0.630 3.7 0.053 3.43.2 0.630 3.1 0.053 3.1 0.045 3.23.0 0.045 2.7
9.5 Bottom 6.5 Bottom 9.0 Bottom 7.4 Bottom 8.299.2 MT (Final) 98.9 MT (Final) 98.3 MT (Final) 99.1 MT (Final) 99.90.8 Mass lost 1.1 Mass lost 1.7 Mass lost 0.9 Mass lost 0.1
A Grindability Study of Cement Clinker: Drop Weight Testing
5
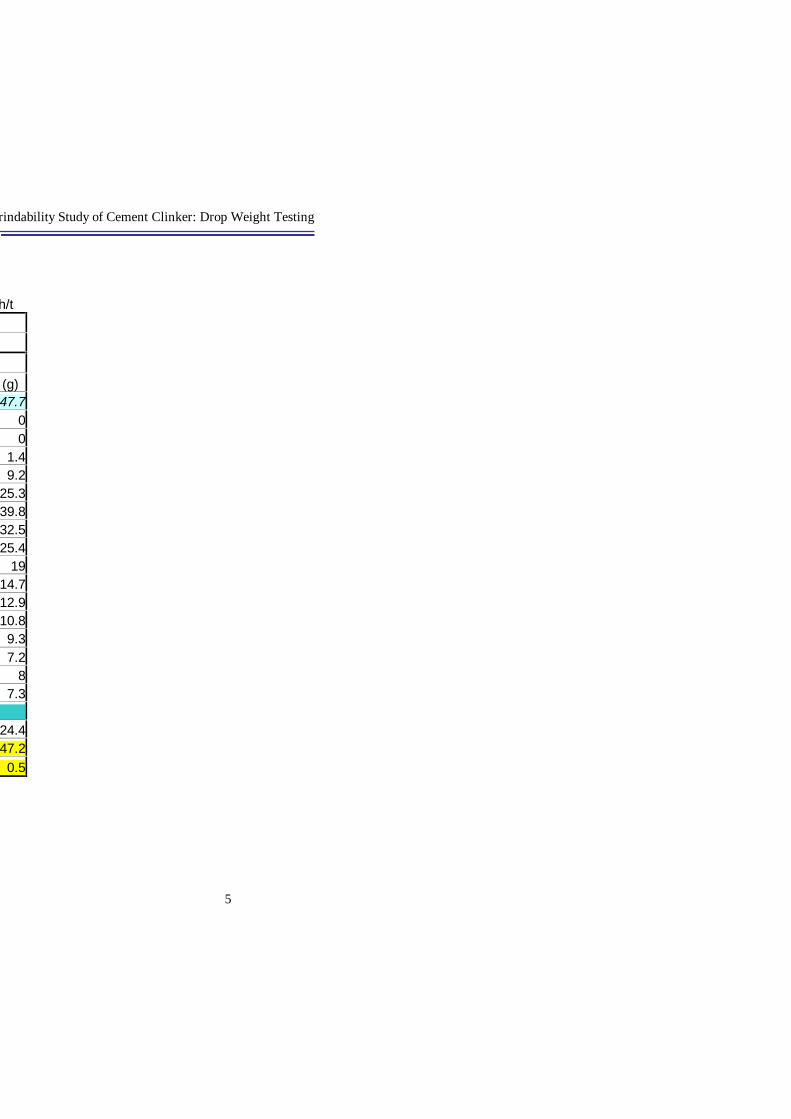
3 kWh/t
Mass (g)247.7
00
1.49.2
25.339.832.525.4
1914.712.910.89.37.2
87.3
24.4247.2
0.5

A Grindability Study of Cement Clinker: Drop Weight Testing
6
Cement Clinker Drop Weight Test PSD (-22.4, +16.0)mm(1kWh/t)
0.0
5.0
10.0
15.0
20.0
0.01 0.10 1.00 10.00 100.00
Particle Size (mm)
Perc
ento
fTot
alM
ass
(%)
Rockhampton Kandos Railton
Cement Clinker Drop Weight Test PSD (-16.0, +13.2)mm (1kWh/t)
10.00 100.00
Particle Size (mm)
Kandos Railton
Cement Clinker Drop Weight Test PSD (-13.2, +11.2)mm (1kWh/t)
1.00 10.00
Particle Size (mm)
Kandos Railton
Cement Clinker Drop Weight Test PSD (-11.2, +9.5)mm (1kWh/t)
0.0
5.0
10.0
15.0
20.0
25.0
0.01 0.10 1.00 10.00
Particle Size (mm)
Perc
ento
fTot
alM
ass
(%)
Rockhampton Kandos Railton

A Grindability Study of Cement Clinker: Drop Weight Testing
7
Cement Clinker Drop Weight Test PSD (-8.0, +6.7)mm (1kWh/t)
1.00 10.00
Particle Size (mm)
Kandos Railton
Cement Clinker Drop Weight Test PSD (-9.5, +8.0)mm(1kWh/t)
0.0
5.0
10.0
15.0
20.0
25.0
0.01 0.10 1.00 10.00
Particle Size (mm)
Per
cent
ofTo
talM
ass
(%)
Rockhampton Kandos Railton
Rockhampton Cement Clinker Drop Weight Test PSD(1kWh/t)
1.00 10.00 100.00
Particle Size (mm)
(-16.0, +13.2)mm (-13.2, +11.2)mm(-9.5, +8.0)mm (-8.0, +6.7)mm
Kandos Cement Clinker Drop Weight Test PSD (1kWh/t)
0.0
5.0
10.0
15.0
20.0
25.0
0.01 0.10 1.00 10.00 100.00
Particle Size (mm)
Perc
ento
fTot
alM
ass
(%)
(-22.4, +16.0)mm (-16.0, +13.2)mm (-13.2, +11.2)mm(-11.2, +9.5)mm (-9.5, +8.0)mm (-8.0, +6.7)mm
A Grindability Study of Cement Clinker: Drop Weight Testing
8
Railton Cement Clinker Drop Weight Test PSD (1kWh/t)
10.00 100.00
(-13.2, +11.2)mm(-8.0, +6.7)mm
Rockhampton Cement Clinker Drop Weight Test PSD
60.0% 80.0% 100.0%
Percent of Original Size y (%)
(-16.0, +13.2)mm (-13.2, +11.2)mm(-8.0, +6.7)mm
Kandos Cement Clinker Drop Weight Test PSD EnergyAnalysis
0.0
5.0
10.0
15.0
20.0
25.0
0.01 0.10 1.00 10.00
Particle Size (mm)
Per
cent
ofTo
talM
ass
(%)
1kWh/t 2kWh/t 3kWh/t
Kandos Cement Clinker Drop Weight Test PSD (1kWh/t)
0%
20%
40%
60%
80%
100%
0.0% 20.0% 40.0% 60.0% 80.0% 100.0%
Percent of Original Size y (%)
Per
cent
Pas
sing
(Mas
s)(%
)
(-22.4, +16.0)mm (-16.0, +13.2)mm (-13.2, +11.2)mm(-11.2, +9.5)mm (-9.5, +8.0)mm (-8.0, +6.7)mm

A Grindability Study of Cement Clinker: Drop Weight Testing
9
Railton Cement Clinker Drop Weight Test PSD (1kWh/t)
60.0% 80.0% 100.0%
Percent of Original Size y (%)
(-16.0, +13.2)mm (-13.2, +11.2)mm(-9.5, +8.0)mm (-8.0, +6.7)mm
Kandos Cement Clinker Drop Weight Test Energy Analysis
0%10%20%30%40%50%60%70%80%90%
100%
0.0% 20.0% 40.0% 60.0% 80.0% 100.0%
Percent of Original Size y (%)
Per
cent
Pas
sing
(Mas
s)(%
)
1 kWh/t 2 kWh/t 3 kWh/t