johan fourie and dieter von fintel - stellenbosch university · settler skills and colonial...
TRANSCRIPT

Settler skills and colonial development
Johan Fourie and Dieter von Fintel
Working Paper Number 213
March 2011

Settler skills and colonial development∗
Johan Fourie†and Dieter von Fintel‡
March 30, 2011
Abstract
The emphasis on location-specific factors, such as climate or disease environment, in theexplanation of development outcomes in colonial societies implicitly assumes that settler groupswere homogenous. Using tax records, this paper shows that the French Huguenots who immi-grated to Dutch South Africa at the end of the 17th century were more productive wine-makersthan the already-established non-French farmers. Standard factors of production usually as-sociated with faster growth do not explain the differences between the two groups. We positthat the skills of the Huguenots — the ability to make quality wines — provided a sustainablecompetitive advantage that not only explains initial but persistent productivity differences. Wetest this hypothesis by dividing the French settlers into two groups — those originating fromwine regions, and those from wheat regions — and comparing them with other settler groups.Potential differences between the French (overall) and the Dutch may be attributable to insti-tutional and cultural differences, while variations within the French group are more likely to beskill-related. This intuitive but important insight — that home-country production determinessettler-society productivity, even in later generations — sheds new light on our understanding ofhow newly settled colonial societies develop, and of the importance of knowledge and skills ineconomic growth.
Keywords: South Africa, Cape Colony, French Huguenots, VOC, wine, slavesJEL: N37, D31, D63
1 IntroductionRecent investigations into the causes of cross-country growth performance identify institutions asone of the fundamental causes of economic growth. Proponents of this view argue that institutionsinfluence the incentives for the productive use of resources, which in turn affects the future distribu-tion of resources. Furthermore, capital accumulation, quantity and quality of labour, and innovationand technology are merely the embodiments or proximate causes of growth and are themselves influ-enced by institutions (Acemoglu et al. 2005). Colonial societies are the setting for three importantcontributions to the field. Acemoglu, Johnson and Robinson (2001) (AJR hereafter) posit thatsettler mortality determined the institutional outcomes of colonies — low settler mortality ensuredthat a settler society developed with institutions favourable for growth, while high settler mortalityresulted in growth-debilitating, extractive institutions. Engerman and Sokoloff (2000; 2000; 2005)emphasise the importance of initial factor endowments — climate, soil quality and the availability of
∗We are grateful to Jan Luiten van Zanden, William Collins, Stan du Plessis, Christiaan van Bochove, an anony-mous referee, participants at the Economic History Association meetings in Evanston, Illinois, the ERSA/FRESHWorkshop in Stellenbosch and seminar participants at Utrecht University, Stockholm University, the University ofPretoria, Northwest University (South Africa) and the University of the Witwatersrand for their comments andsuggestions on earlier versions. We also acknowledge the research assistance of Lydia-Maré Beukes and Hans Heese
†Department of Economics, Stellenbosch University; Department of Economic and Social History, Utrecht Univer-sity. Corresponding author: Johan Fourie. E-mail: [email protected]
‡Department of Economics, Stellenbosch University
1
a large native population — in explaining the formation of different institutions, and consequentlydiverse growth trajectories. La Porta et al. (2008) show that the legal origins transplanted by thecolonial powers created different incentives for investors which influenced financial development incolonies. Institutions are determined by local conditions in both the AJR and Engerman/Sokoloffhypotheses. Both theories and the empirical strategies by extension posit that settlers were, how-ever, a homogenous group, and that variations only exist across the territories colonised. In thecontext of La Porta et al. (2008), colonial settlers only differed to the extent that legal origins arenot the same in each territory; these institutions do not account for the role that various settlergroups may have in the development of individual colonies.The notion of homogenous settler groups (which is implicit in earlier work) is challenged by recent
contributions which link the origin of settler migrations to explain modern development differences(Olsson and Hibbs 2005; Comin et al. 2010). The most recent contribution by Putterman and Weil(2010), for example, construct a migration matrix to show empirically that conditions in settlers’countries of origin in the year 1500 (technological, institutional or even geographical) possess highexplanatory power in determining 2000 GDP differences between countries. Even here, homogeneityis assumed amongst settlers that originate within the same country borders.This paper contributes to our understanding of the transmission of origin country conditions to
settler welfare in the destination (settler) country. Instead of using cross-country measures to verifycorrelations between historical indicators and modern levels of development, we use historical micro-level production data of a specific region to identify the mechanism through which settler origin mayinfluence the production function in a new setting. The arrival of French Huguenots in the newlysettled Dutch Cape Colony is used as a natural experiment: this allows the analysis of two settlergroups with different legal origins and cultures. To enable this type of analysis, it is necessary to holdall other possible unmeasured influences constant: throughout, the analysis is conducted in a settingwhere the local geography and institutions (which were introduced by Dutch East India Company(VOC1 henceforth) rule) were identical for both the already-settled European and new inflows ofimmigrant populations. We show that new French Huguenot migrants were more productive atviticulture than wheat farming. This impact persists for later generations of settlers. Given thatin later generations the French were completely assimilated into Dutch society, culture and religionmattered little in explaining productivity and welfare: by implication, human capital (agriculturalskills and wine-making secrets) was transferred within various groups across generations. This is notthe case for wheat production where, controlling for other factors, any advantage the French mayhave disappears.We develop this hypothesis further by splitting the French Huguenots into two groups, those
originating from wine regions in France and those descended from wheat-farming regions. Giventhat both groups were French Huguenots, we would expect no differences in their use of capital andlabour and in the formal and, especially, (possibly inherited) informal institutions that they wereexposed to and their shared cultural identity. Their skills set is therefore exogenously determinedby the geography within their homeland.To demonstrate these propositions, we use data from the opgaafrolle. These constituted produc-
tion figures which were recorded for the purposes of tax collection by the VOC. Detailed household-level inventories and records of agricultural activities were captured during most of the first Dutchoccupation (1652-1795), and even in the early period of British rule (1795-1803). The data used inthis analysis spans the period from 1700 to 1773.Viticulture had important implications for the development trajectory of the Cape. While the
shift in output from cattle and wheat to wine seems insignificant, viticulture required a differentproduction function to cattle and (to some extent) wheat farming. Viticulture was associated withshort periods of seasonally high labour demand. While the indigenous Khoekhoe potentially couldbe forced to supply their labour, Dutch policy prevented farmers from enslaving them. But the
1Verenigde Oostindische Companje, the original Dutch version of the company name
2

displacement of Khoesan settlements through frontier migration often left the Khoe with little al-ternative than to find work on European farms. This process was accelerated through the smallpoxepidemic that ravaged the Cape Colony in 1713, and in its aftermath the Cape policy unit in 1717proposed to the Lords XVII in Amsterdam to import slaves rather than encourage European immi-gration in order to satisfy the demand for labour. Wine making thus raised the demand for labour,encouraging slave imports and, as our earlier work shows, increasing inequality (Fourie and vonFintel 2010a; 2011). Following the Engerman-Sokoloff hypothesis, severe initial inequality sustainsunequal institutions that result in a lower level of comparative development. South Africa today isa case in point.Our results have important implications for the literature on colonial societies. Colonial insti-
tutions are shaped not only by whether settlers stay or not (as per AJR), which legal system theyadopt (as per La Porta et al.), or their language, religion or beliefs, but by the set of skills, knowledgeand experience brought from their country of origin. Even more specifically, this study identifiesthat regions within origin countries may differ, suggesting that cross-country comparisons may cloudmuch of the underlying impact that settlers have on the destination country. Skills affect labourproductivity and their areas of specialisation in the adopted homeland. This determines the incen-tives for productive activity and shapes the future distribution of resources and growth potential ofthe colonial settlement.
2 Settlers, institutions and human capitalWhile the debate still rages on as to which of geography or institutions explain economic devel-opment, it arguably has become more refined. Initial proponents of the geography-endowmentshypothesis explained economic underdevelopment as a result of the quality of land, climate, thedisease environment and labour availability, with each influencing the production technologies avail-able. Temperate zones, for example, are considered to produce higher crop yields, provide moresuitable living conditions and are more conducive for technology-augmenting production techniquesvis-à-vis tropical zones (Diamond 1997; Bloom and Sachs 1998; Landes 1998; Sachs and Warner2001; Sachs and Malaney 2002). Landlocked areas far from major markets also struggle to trade(Frankel and Romer 1999; Anderson and Van Wincoop 2004), while ruggedness may increase tradecosts and inhibit growth (Nunn and Puga 2009).Recently, the institutional perspective has emerged as the more dominant view. Building on the
role of geography, Engerman and Sokoloff (2000; 2005) argue that initial factor endowments (such asclimate, soil and labour availability) influence the early level of inequality. However, while it is notthe geographic features that constrain or promote growth, the level of early inequality influences thetype of political and economic institutions adopted. Severe inequality resulted in growth-debilitatinginstitutions that preserved the ruling elite’s hegemony by way of a narrow franchise, restrictedproperty rights and poor access to education. Easterly (2007) empirically verifies the Engerman-Sokoloff hypothesis, finding that agricultural endowments predict inequality, and that inequalitypredicts development.In a seminal contribution, Acemoglu, Johnson and Robinson (2001) posit that geography’s impact
on today’s development levels manifests through the colonial disease environment. They argue thattwo types of colonisation strategies were adopted: a favourable disease environment (in dominantlytropical regions) yielded low settler mortality rates and consequently the adoption of institutionsconducive to economic growth (such as the protection of property rights for a large and expandingsettler population). A poor disease environment resulted in high rates of settler mortality, whichcaused the adoption of extractive institutions (such as power concentrated in the hands of a smallelite). The US, Australia and New Zealand are examples of the former, while extractive institutionswere mostly limited to the tropical countries of Congo, Ghana, Peru and Mexico to name a few.Moreover, AJR argue that these institutions remained after independence, influencing modern-day
3

development levels. Easterly and Levine (2003) also show that measures of geography only explaincross-country differences in income today through their impact on institutions.La Porta et al. (1997; 1998; 2008) were the first to emphasise factors specific to settlers’ origins
to explain cross-country variation in colonies’ welfare. They show that the legal origins of settlersdetermine the path of economic development through the laws pertaining to, in part, investor protec-tion, the quality of their implementation and ownership concentration. While not without criticism(Klerman and Mahoney 2007), Le Porta et al. move closer to identifying the mechanisms throughwhich colonial institutions influence later economic performance.The diverse explanations in the early attempts to understand cross-country variation in economic
development have prompted further investigations to identify the causal mechanisms. Forced laboursystems (Nunn 2008; Nunn and Wantchekon 2009; Dell 2010), property right systems (Banerjeeand Iyer 2005), public investment and infrastructure (Huillery 2009), technology and innovation(Mokyr 2002; Comin, et al. 2010), culture (Guiso, et al. 2006; Tabellini 2008), religion (Jha2008) and values (McCloskey 2006) all influence modern economic outcomes through institutions.Yet the connection between these institutions and settler migration (the vehicle by which theseinstitutions migrate to new destinations) remains elusive. In an important contribution, Puttermanand Weil (2010) show empirically that correlations between historical (year 1500) and current (year2000) country-level economic performance measures improve significantly once settler migrationbetween countries is accounted for. They construct a matrix of the year-1500 origins of the currentpopulation by country, which is used to convert historical cross-country measures into measuresthat instead capture the historical performance of the ancestors of the people who now live ineach country. For example, whereas the technologies available to South Africa in the year 1500would have reflected those available to the Khoesan and various Bantu tribes present in the region,the ancestry-adjusted technological variable (in addition to the Khoesan and Bantu technologies)includes technologies used by the Dutch, French, German, British, Indian and Indonesian settlers,slaves and servants that migrated to South Africa in the intervening 500 years. The ancestry-adjusted measures have higher explanatory power than the unadjusted indicators, which Puttermanand Weil (2010) argue is proof of the importance of how country-of-origin settler differences matterfor economic performance today. Yet, their ancestry adjustments improve the explanatory power ofboth geographic and institutional variables, which again masks the true mechanisms which determinelong-run development; their empirical results, for example, predict both a positive and large role fora variable measuring government structure (called state history, an institutional variable) and therise of agriculture (a geographic variable), providing no hint as to underlying forces at play. Theyacknowledge this shortcoming: “(O)ne would want to know the specific channel through which thiseffect flows. For the most part, we consider this an issue for future research” (Putterman and Weil2010:1652).One such mechanism through which historical linkages influence modern development outcomes
is education (or more broadly, human capital). Education seems to be a particularly persuasivefactor, also drawing support from the new growth theory (Lucas 1988; Romer 1990; Becker 1993;Romer 1994). Glaeser et. al. (2004) point out that “human capital is a more basic source of growththan are the institutions”. And in a detailed review of the empirical literature, Hanushek andWoesmann (2008) find that the relationship between education and earnings is remarkably robust,notably the quality of education. They insist that the relationship cannot be “explained away by aset of plausible alternative hypotheses about other forces of mechanisms that might lie behind therelationship”.History also provides a valuable laboratory to test education’s impact on economic outcomes,
although it requires innovative ways of quantification. Literacy rates are often the most reliable his-torical proxy for education, and are used widely to measure human capital’s impact on development.Chaudhary, for example, identifies the causes of illiteracy in India in order to explain educational,and consequently economic, inequality (Chaudhary 2009; Chaudhary 2010). Baten and Van Zan-den (2008) use book production as a proxy for literacy. They show that those regions that had
4

greater book production, controlling for various other factors, also yielded higher economic growthrates. Another innovative technique to measure numeric competency is the prevalence of age heapingin various regions: poorly educated individuals in historical sources are found to round their agemore often than the well-educated. These studies reveal similar positive influences of human capitalaccumulation on growth (A’Hearn et al. 2009; Crayen and Baten 2010).Education also affects growth through institutions. Bolt and Bezemer (2009) show that an instru-
ment for colonial human capital is more robust in explaining growth performance than instrumentsfor extractive institutions, as per AJR. Their results are also stable when including measures ofgeography and legal origins in their specification. Of course, while all of these are theoreticallyplausible causes of growth, problems of endogeneity and multicollinearity haunt the researcher.Bhattacharyya (2009) uses dynamic panel regressions and finds that both human capital (embodiedin schooling) and institutions cause growth. While Bhattacharyya (2009) does not explain the mech-anism through which schooling might affect institutions and growth, two recent examples by Beckerand Woessmann (2009) and Nunn (2009) illustrate how religious institutions may impact growththrough education. Becker and Woessmann (2009) posit that Weber’s hypothesis of the Protestantethic is, in fact, captured in the higher literacy rates of the Protestants vis-à-vis Catholics. WhileProtestantism led to better economic performance (as per Weber), it also led to better education.Using evidence of Christian missionaries in Africa, Nunn (2009) shows that Protestant missionarieshad a significant impact on Christian conversion rates, educational outcomes and economic perfor-mance indicators. Again, the link is through education. Agbor, Fedderke and Viegi (2010) also link,both theoretically and empirically, human capital transfers from the colonisers to the colonial elitethrough post-colonial institutions.Mostly because of data constraints, these studies often treat human capital (or education) as a
homogenous concept by focussing on educational attainment levels only. In reality, of course, it ismulti-faceted: human capital can be acquired in different ways (learning-by-doing, formal education),and consists of different skills or capabilities (innate talents, trained competencies or specialisedknowledge acquisition). One distinction that is relevant for our later discussion is between skillsand literacy, which we classify as two different capabilities. The former is associated with learning-by-doing and experience while the latter reflects formal education. We also distinguish betweenspecific skills and generic skills. This derives from the literature on capability theory (Langlois andRobertson 1993; Argyres 1996; Teece, et al. 1997; Nelson and Winter 2002) which goes beyond thestandard production function approach to explain organisational structure. We adapt Jensen andMeckling’s (1992) definition of “specific skills” to include only skills that are difficult (or costly)to transfer among agents; in comparison, “generic skills” are easy and inexpensive to transmit.2
Reasons why “specific skills” are more difficult or expensive to acquire are not clear, but may be dueto their technical nature, their applicability to limited work spaces and types, or simply the speedat which knowledge can be transferred. It may also be that they can be concealed. We return tothese issues in the final sections.
3 The HuguenotsThe first Europeans to settle in South Africa arrived in 1652 to establish a refreshment station forships sailing between Europe and the East. The station was under command of the Dutch EastIndia Company officer Jan van Riebeeck. His initial plan was to maintain a small community in andaround the newly constructed fort to supply the passing ships with fresh produce, water and fuelfor their journey ahead. Cattle could be traded with the indigenous Khoekhoe population.Van Riebeeck soon realised the difficulty in supplying enough fresh produce for the Company
servants and soldiers, and in 1657 he released nine Company officials to become free farmers. Thefarmers expanded into the interior and by the 1680s had already moved close to theWestern mountain
2Jensen and Meckling (1992) refer to specific versus general knowledge
5

ranges that separate the Cape peninsula from the interior. Based on a European blueprint, VanRiebeeck had imagined labour-intensive agriculture with thousands of farmers on small plots in theCape Peninsula. By the 1670s, however, cattle herding was the dominant economic activity of thefarmers, with a small number of households covering a large territory.At the same time, the Revocation of the Edict of Nantes in France in October 1685 increased the
supply of labour in the Netherlands significantly. The Edict, instated in 1598 by Henry of Navarre,sought to create circumstances within which French Roman Catholics and Protestants could co-exist peacefully. With the murder of Henry of Navarre in 1610, however, religious intolerance andviolence surfaced once more, which eventually culminated in the Revocation of the Edict in 1685. Itis estimated that more than 400 000 Huguenots left France, settling in the neighbouring countriesof Britain, Prussia, the Dutch Republic and Switzerland, or to the more remote French colonies ofNorth America and the Cape Colony (Morison 1972).Only 159 French Huguenots arrived in 1688 at the Cape, augmenting the small number of free
farmers by nearly a third. Even given these new arrivals, the Colony expanded slowly. The supplyof agricultural produce only exceeded the demand from local residents and ships after 1700. Dueto frequent harvest failures and epidemics, it was another three decades before supply stabilisedabove demand. After the land west of the first mountain ranges had been exhausted, farmers movedinto the interior, switching to pastoral farming and in many cases living an isolated and subsistencelifestyle.While Van Riebeeck already harvested the first grapes on the slopes of Table Mountain in 1658,
cattle and wheat farming dominated agricultural output until the turn of the century. The arrival ofHuguenots, however, shifted production towards viticulture, also satisfying the demand for alcoholfrom the growing number of passing sailors and soldiers (and for profit from the mercantilist DutchEast India Company) (Boshoff and Fourie 2008; Boshoff and Fourie 2010). In the following section,we show empirically that the Huguenots produced more wine — and did so more efficiently — thanthe other settlers.The Huguenots who left France made significant contributions to the domestic economies wher-
ever they settled. Scoville (1951; 1952; 1952) documents the impact of Huguenot immigration onEngland, Ireland, Holland, Germany and Switzerland, finding evidence of improvements in espe-cially the textile (high-quality fabrics such as silk) and clothing (including hat-making) industries(Rothstein and Thornton 1960; Mathias 1975). Not only did they contribute directly to production,but they established schools, improved literacy and diffused knowledge through on-the-job trainingprogrammes in their adopted countries (O’Mullane 1946; Hornung 2010). Because of this, cities wereeager to attract immigrants and provided various incentives to entice them to settle permanently.3
Moreover, the en masse emigration of the wealthiest Huguenots had a highly detrimental impact onthe French economy (Scoville 1953).For these same reasons, Simon van der Stel, then commander of the Cape Colony, was eager to
attract Huguenots to the Cape. He hoped to augment the existing settler population to ensure astable supply of fresh produce for the Company’s ships. While many Huguenots relied heavily onCompany and Church support, struggling through the first few decades, the rapid growth in the wineindustry during the eighteenth century suggests at least some tentative correlation between Frencharrival and output growth. It is therefore strange that few scholars have empirically investigated theimpact of the French on Cape Colony production.While the earlier historians speak in romantic terms of the French arrival — highlighting their
significant demographic contribution to the Afrikaner people (Nathan 1939) — recent investigationsinto the early Cape economy have attributed less weight to the impact of the Huguenots (Guelke1980; Schutte 1980; van Duin and Ross 1987; Giliomee 2003).These studies often even neglect tomention their economic impact. Nevertheless, in what is now the standard text on the FrenchHuguenots in South Africa, Coertzen (1997) notes that before the Huguenots’ arrival, the Dutch
3Except in the case of Geneva, Switzerland, where there was a strong local opposition to their settlement.
6

farmers (knowing little about wine-making) focused mostly on cattle and wheat production. It wasonly through the endeavours of the Company (notably the Commander Simon van der Stel) thatwine production took off before the arrival of the Huguenots. On arrival, according to Coertzen(1997), the Huguenots did not all take up viticulture, mostly due to the slow return on investmentand the immediate need to produce other goods for own consumption. Yet, from Company records itis clear that some farmers did pursue viticulture soon after settlement, notably those that “with somecertainty could be linked to possessing some knowledge of viticulture” (Coertzen 1997:111). Thesewere Isaac Taillefert, Pierre Joubert, Jacques Malan, François Retif, Josue Cellier, Paul Couvretand the three brothers, Pierre, Jacques and Abraham de Villiers.The wine produced in the Cape Colony throughout the period of Dutch rule was widely considered
to be of inferior quality to that of France.4 For this reason many historians have downplayed theHuguenots role in the Cape wine industry (Bolsmann 2008). While there was some improvementin quality after Huguenot arrival (Coertzen 1997), the general consensus is that the few Frenchviticulturalists were not necessarily better than their Dutch or German counterparts. While someHuguenot families seemed to have been very successful only two decades after arrival, others “movedbackward and gave up when the droughts and plagues hit them” (Coertzen 1996). He attributesthis to the “hard work and an enterprising spirit” of the successful farmers and, to some extent,marrying into wealthy families. The skills brought over from the homeland seem to have beenrelatively unimportant.Some evidence does exist to support the notion that French Huguenots that settled elsewhere
“exported” some knowledge of viticulture. Huguenots who settled in the American colonies (incontrast to those whom remained in Europe) tended to favour agriculture (and often viticulture).According to Hirsch (1930), French settlers in the Americas displayed an interest in viticulture fromtheir earliest residence. While vine grew wild in the Southern colonies, Huguenots introduced itsartificial culture, and “generous bounties were often bestowed for their industry in this branch ofagriculture” (Hirsch 1930:4). According to Hirsch (1930), had a £250 000 bribe not been offeredto the British Minister to the American Department in the late eighteenth century to withdraw hissupport from the American wine industries, “America might easily have become one of the greatestwine marts of the world and France’s most daring rival” (Hirsch 1930:5).In the following sections we consider the possible impact that the French settlers had on Cape
Colony production of wine. Differentiating between French and non-French farmers, we show thatFrench Huguenots produced more wine than their non-French compatriots and, controlling for a hostof different inputs, maintained this advantage over time. We also split the French Huguenots intotwo groups: those originating from regions in France where wine was made versus those regions withlittle or no wine production. If we find that wine production was dominant amongst those farmersoriginating from regions in France which also produced wine, it supports our hypothesis that settlerskills matter for colonial development.
4 Wine skills and qualityWhich “skills” matter for wine production? In general, three stages are involved when making wine:viticulture (or the cultivations of grapes), vinification (or how grapes turn into alcohol through thefermentation of sugar) and maturation. Wine-making therefore refers to both agriculture (viticul-ture, producing grapes) and manufacturing (vinification and maturation).There is no doubt that the environment — climate, soil quality and grape varieties — is a key
input in the first stage of production. According to Unwin (1996:34), “climatic conditions largelydetermine the parts of the world where it is possible to grow vines”, thriving in areas with “longfairly hot summers and cool winters”. The terroir — an inclusive term which relates to the slope,
4The notable exception being the sweet wines of Constantia which was sent to dignitaries across Europe and whichNapoleon requested while in exile on St. Helena.
7

aspect, soils, altitude, humidity, shelter and drainage — was, at least before the twentieth century,the main factor influencing the character of a wine (Unwin 1996). Yet, skills are required throughoutthe production process. Given the importance of location, knowledge of terroir in selecting the areafor cultivation is not a trivial skill of the viticulturalist. Moreover, the first stage of productionrequires knowledge of pruning, irrigation, fertilisation, cultivation and the timing of the harvest(Unwin 1996).Different to wheat, the quality of wine is not necessarily correlated with the quantity of produc-
tion. A successful grain farmer may measure his success in the number of muids (the unit of measureused by the VOC) reaped over the number of muids sown — the yield — and probably not in thequality of wheat produced. Put differently, bread produced from the wheat of a successful harvestwould taste roughly similar to that of a bad harvest, with the difference only in quantity produced.The same is not true of wine. The quality of grapes produced depends on the terroir ; while a farmermay produce a high quantity of grapes, the quality of it may be inadequate for wine production.Thus, different to the wheat farmer, the knowledge and expertise of the viticulturalist — choosing theideal terrain and complimentary cultivar — is an essential first step in producing marketable wine.The second stage — the “manufacturing” of wine through vinification — and the third stage
— maturation — practiced by an oenologist (wine-maker), require more specialised knowledge andskills. As Spurrier and Dovaz (1983) remark: “The oenologist’s mastery of vinification techniquesis just as important as the grape variety, the soil and the climate ... A good oenologist can stamp awine with distinction; a bad oenologist can produce a bad wine even from excellent grapes.” Unwin(1996:50) confirms that “each vigneron, or wine maker, builds on local traditions ... and his orher own skills and experience to create a particular style of wine”. These skills include pressing,sugaring, control of the fermentation process and ageing (or maturation).In a description of the early eighteenth-century Cape Colony, traveller O.F. Mentzel (Mentzel
2008) notes that “the inhabitants of the Cape do not yet know how to treat their wine properly”,although he points to some exceptions: “(I)nstead of the muscatel wines which are openly sold inGermany under this name, I prefer the Cape wines”, notably the “red muscatel grape of whichdelicious red wine is made at Constantia”. His detailed depiction of harvesting and wine-makingsuggests four elements that enable quality wine production: location (“those of Constantia takingfirst place, and those round the Tygerberg being the most inferior”), availability of a press or squeezer(“he who possesses neither press nor squeezer has everything pressed out by hand but obtains lesswine as a result and can use what remains in the husks for brandy only”), and the availability ofbarrels (“many a farmer, if only he had enough barrels, would certainly like to own a press or atleast a crusher, and thereby obtain more wine without the necessity of first distilling bad brandy[which is very difficult on many farms in any case through lack of firewood] ... but barrels are veryscarce and expensive.”) (Mentzel 2008:184-186). Land (location) and capital (availability of a press,squeezer and barrels) thus seems to be the critical constraint for wine-makers. Yet, Mentzel is mostpersuasive about the final element: preparation. In particular, he claims that preparation is the keybetween good and bad quality wine: “It must be understood that not all Cape wines are suitablefor maturing. What is not good wine by nature and quality (or, as I think, has not been properlyprepared) is not improved by long seasoning, but only becomes sharp and prickly as they say there.Really good, well prepared and well cellared Cape wines improve with age.” Quality wine — winethat has longevity — is the result of knowledge and skills.
5 DataThe opgaafrolle are household-level censuses of all free men at the Cape that were drawn up annuallyfor tax purposes by the Dutch East India Company. Fourteen of these opgaafrolle — spaced roughlyevery five years and subject to the quality of archival sources — have been converted into user-friendly
8

format by the authors based on unpublished earlier work by historian Hans Heese.5 A more completedescription of these censuses can be found in Fourie and Von Fintel (2010).Apart from household members, slaves and weapons, the censuses include primarily agricultural
indicators: wheat, barley and rye sown and reaped, vines planted, wine produced, and cattle, sheep,horses and pigs owned. Most scholars agree that farmers underreported variables to evade Companytaxation. Van Duin and Ross (1987) and Brunt (2008) have adjusted these figures upwards based onprojections of consumption in the Cape Colony. Fourie (2011) argues that secondary and tertiaryproduction was much greater than previously assumed and that, based on an analysis of probateinventories, a too narrow focus on agricultural indicators underestimates total production in theCape Colony. Because we focus on comparative production between households, adjustments foraggregate discrepancies would not influence our results if we assume that underreporting occurredrandomly across the groups we wish to compare.The analysis of settler performance is conducted by analysing household production of two out-
puts that dominated agriculture in the Cape colonial period: wheat and wine. These products werealso traditionally cultivated in the settlers’ respective countries of origin. To construct a Huguenotdummy variable, we trace the surnames of each of the 159 Huguenot arrivals for all the censuses after1700.6 A subset of French provinces traditionally excelled at wine production while other regionswithin that country, as well as Holland, did not enjoy this advantage. Their competitive advantagelay in the cultivation of wheat. A further sub-classification of the French is therefore introduced:surnames of settlers that were known to have come to the Cape from provinces in France that werewine-producing regions during the late seventeenth century were separated from those that werenot. Here we follow the guidance of historians, primarily Boucher’s French Speakers at the Cape:The European background (Boucher 1981). Figure 1 provides a visual presentation of these areas.The numbers provided on the map represent the number of Huguenot households in our datasetover all years in the sample. While we use historical sources to identify wine-producing regions, wealso show that these are roughly correlated with Encyclopaedia Britannica’s (2009) major Frenchwine regions today. Throughout the rest of this paper, we label WH-farmers as the Huguenots thatoriginate from wine-producing provinces in France. NWH-farmers are Huguenots that originate fromnon-wine producing regions in France. NH-farmers are non-Huguenots.A measure of formal human capital is also included in the French sub-sample. We obtain this
from Dorothee Crayen and Jörg Baten’s age-heaping estimates of human capital in pre-industrialFrance (Crayen and Baten 2010). This variable represents the extent of numeracy in the areas fromwhich each of the French settlers came. Potentially more numerate farmers would perform better attheir trade. However, numeracy (a more general skill) may not necessarily be relevant to farming,and in particular wine farming (which possibly requires specific knowledge or skills). In this mannerwe separate the impact of generic from specific skills on production, which we discuss later.We construct a further dummy — Married — based on the work of Coertzen (1997) and Botha
(1939) to indicate when settlers married Huguenot women, differentiating between those women whooriginated from wine-producing and non-wine producing regions.7 Another dummy — Born abroad— indicates whether the relevant household head was a first-generation Huguenot. Another indicatorvariable — Coertzen — separately classifies the descendents of the farmers named in Coertzen (1997).These farmers were the first Huguenots to plant vines at the Cape.Given the predominance of agricultural indicators, we remove all non-farmers (those households
5The following years are included: 1663, 1670, 1678, 1682, 1685, 1688, 1692, 1695, 1700, 1702, 1705, 1709, 1712,1719, 1723, 1731, 1738, 1741, 1752, 1757, 1762 and 1773.
6Observations are presented at the household level and are classified by the surname of the household head. Inmost cases this person was male. As a result, if a settler with a Dutch surname had a French maternal grandfather,for instance, this descent is not recorded in this measure. This classification therefore only captures French descentthat can be followed via a complete line of exclusively paternal links to an original Huguenot.
7This partially accounts for the fact that we can only identify Huguenots with completely paternal links to theoriginal settler. However, this measure also only accounts for maternal links within the current generation and cannottrace Huguenot marriages higher up the family tree for a particular household.
9

with zero scores on all agricultural variables) from the 17 292 household observations in our datasetto exclusively focus on the farming population. There is a possibility that we remove rural farmerswho simply had no farming assets on record. However, using only the farming population eliminatesthe possible bias in undercounting the productive contribution in urban Cape Town for which wehave no data to indicate wealth (especially housing and trading stock).
6 Estimation and ResultsWe commence with a descriptive analysis to establish whether differences did indeed exist betweenthe various groups of farming settlers. Following this, an extensive set of regression models uncoversthe patterns that underlie the differences.
6.1 Descriptive results
Table 1 provides the average household ownership by group over the full sample of censuses. On allmeasures, the three groups appear roughly similar, except for vines and wine, where the WH-farmersown on average more than double what the other two groups own.The average household per capita wine and wheat production by group over time is provided
in the Table 2. While no formal tests for mean differences are shown, it is evident that wineproduction was strongest amongst WH-farmers. This is illustrated in Figure 2, where the mean percapita household output for various years between 1700 and 1773 is plotted.Initially there appears to be little difference between the three groups. The first difference
between Huguenots from wine-producing regions and the other two groups appear in 1719 andthe disparity remains and increases towards the end of the period. Hence, there is already someevidence in the descriptive results that point to an increasing advantage in viticulture at the Cape forHuguenots from wine-producing regions. While this suggests that the inherent advantage by regionof descent was present from the beginning, these initial advantages amplified into persistently higherwine yields over almost a century. This is contrary to what one might expect, as later generationspresumably do not inherit “more” of the advantage compared to the first arrivals of wine-producingHuguenots. We investigate this trend more closely in the regression models, when controls for thesefirst arrivals are introduced.A similar story emerges for wheat production, though now non-Huguenot settlers are the clear
winners (see Table 2). This group had, however, already established their presence at the Capebefore the arrival of the French, so that the initial advantage may only be a reflection of moremature farming operations. In most periods, the Huguenots from wine-producing regions appear tobe the poorest wheat farmers, probably reflecting their focus towards wine production. However,the gap between the groups narrows across time, so that the rankings do not hold by the end ofthe period. This suggests that acquiring the necessary skills for successful wheat farming was notas costly as for wine making.
6.2 Model-based analysis
We estimate standard production functions of household mean per capita production to finally modelthe following process:
Yit=α+βSettlerGroupit+γK it+δLit+θAit+λt+εit (1)
where Yit is household output per capita. Settler Groupit represents our variables of interest— constituted by a dummy variable for Huguenots from wine-producing regions (WH) and one forHuguenots from non-wine producing regions (NWH), with other European settlers as a base group.In the analysis of the French sub-sample the base group is the NWH. Kit is a vector of controls
10

for capital (represented here by slave labour), Lit is a vector of controls for paid labour (EuropeanKnechts), Ait is a vector of additional controls, including the effects of being an original Huguenotand marrying an original Huguenot wife. In the analysis of the French sub-sample this also includesnon-numeracy to capture the effects of generic human capital. , λt is a set of time fixed effects andεit is a randomly distributed error term.Controls for other important determinants of production are also introduced. Most notably,
we control for inputs into the production process; in the case of wine, vines, and in the case ofwheat reaped, wheat sown. Inputs also act as a proxy for land size. Slavery serves as one of thestrongest predictors of success and most closely proxies for capital, while European labour (knechts)controls for labour. We also include cattle and horses as control variables; in addition to providingmeat, oxen were required for productive activities such as ploughing and transportation, especiallyover the sandy terrain of the Cape peninsula. Horse ownership was initially limited, but increasedsubstantially during the course of the eighteenth century (Fourie 2011). When estimating wineproduction, we also control for wheat reaped, and vice versa, to determine the complementarity orsubstitutability of the two crops.While the dummy variables directly measure the production premium of being a descendant
from various regions in France vis-a-vis other European settlers, we propose that they identify othereffects more specifically.
βj= ProductionPremiumj= E (Prod |Huguenotj ,K ,L,A, )− E(Prod |NonHuguenot ,K ,L,A)= E (Prod |FR,Cape)− E (Prod |NL,Cape)= ValueofSpecificSkillsWH+GenericHumanCapitalPremium + InheritedHomeCountryVirtuesPremium
(2)where j = WH; NWH. FR and NL represent inherited (institutional, cultural, religious and
geographical) characteristics from home countries, while Cape includes the same factors in the colony,in additional to K,Land A.Arguably, this impact captures multiple effects simultaneously. The geography, culture, religion,
legal origin and other institutions in the home country differed for these groups (captured by FRand NL). However, the institutions were identical for both groups at the Cape, and we controlfor selection into better agricultural regions with a set of Cape district dummies in A(see Cape).Further, the French culture and religion was assimilated largely into the Dutch culture, so that thisimpact too was equal for both groups. Therefore many “local” colonial differences are conditionedfor either implicitly or directly in the regression estimates, so that the impact can be attributedalmost completely to characteristics inherited from respective motherlands. While it is unlikely thathome geography directly influenced production in the colony (particularly of much later generations),it nevertheless had an impact on the specific skills set that families inherited. Descendants fromwine-producing regions were likely to have received a transfer of wine-producing skills. Hence, muchof what we identify can be attributed to this type of human capital that is arguably importantfor the success of settlers in a new colony. Equation (1) shows that we in actual fact estimate anupperbound for the production premium of specific skills, assuming that the remaining influences ofgeneric human capital and inherited home country virtues are small.Simple ANOVA-type regressions are employed to confirm our hypothesis that Huguenots from
wine-producing regions (WH) were more apt at producing wine than either their non-wine regionHuguenot compatriots (NWH) or the non-Huguenots (in Table 2, the control group).The strong economic and statistical significance on the WH-dummies throughout suggests that we
cannot reject our hypothesis that specific skills were inherited and employed by the wine-descendantHuguenots. The coefficients suggest that Huguenots from wine-producing regions produce between65% and 191% (depending on conditional variables) more wine than the non-Huguenots. Conse-quently, an upper-bound for the specific skills premium of the WH above the NH is 65%. TheNWH dummy has mostly positive and significant coefficients (though deviations from this scenarioare common), indicating that they too possessed an advantage in wine production relative to non-
11

Huguenots. Consequently a “shared” French wine production premium apparently arises whereestimates on both the NWH and WH dummies are positively significant (depending on what is con-trolled for). This arguably could be attributed to unobservable characteristics such as home countryculture, institutions, human capital and religion. However, given that the WH premium exceeds thatof the NWH, the evidence points to the fact that a specific skills premium in wine production alsorealises relative to the NWH. Furthermore, the NWH dummies become insignificant once productioninputs (particularly vines in column (4)) are controlled for, while the same is not true for the WHdummy. As a result, we have effectively controlled for the differences between the NWH and the NHwith local characteristics, so that it is unlikely that the influence of unobserved home country factors(shared by the WH and the NWH) drive the results. Consequently the remaining premium for theWH can be largely attributed to a specific set of skills. When we control for a direct maternal linkto the WH through the positively significant marriage dummy (columns (6) and (7)), it is evidentthat the previous NWH premium turns into a significant disadvantage, suggesting that much ofthis group’s advantage also came through the transfer of skills from marriage to a WH. However, itappears (through the negative NWH coefficient) that the non-Huguenots benefitted more from thistransfer than the NWH. Consequently, all unexplained premia in wine production can be traced tolinks with the WH, suggesting that a specific skills component sourced in this group dominates ourestimates.While one might contend that virtues (religious, cultural and those rooted in other informal insti-
tutions) from the home country could still have an impact on family success in the colonial setting,these effects are likely to be dominated by the setting into which these people were transplanted.However, to remove this potential identification problem, we also analyse the Huguenot sub-sampleseparately to equalise each of these home country factors. This more focussed analysis also allowsus to use French human capital data estimated by Crayen and Baten (2010). The non-numeracyscores are included to control for the “generic skills” component of human capital that was inheritedfrom the home country. While this does not account for the generic human capital of individualhouseholds in the Cape, it does remove this component from the home country premium that we es-timate.8 Hence, the most clearly identified “specific skills” premium in production can be expressedas:
β = ProductionPremiumWH= E (Prod |WH ,K ,L,A,HCFR)− E(Prod |NWH ,K ,L,A,HCFR)= E (Prod |WH ,Cape)− E(Prod |NWH ,Cape) = ValueofSpecificSkillsWH
(3)Table 4 presents a similar exercise, except that the sample is now limited to only the Huguenot
population. The dummies on Huguenots from wine-producing regions are consistently large, positiveand statistically significant, confirming our hypothesis of a discontinuity between the Huguenots fromwine-producing regions and those from non-wine producing regions. Also, this effect seems to remainpositive and large regardless of which factors are controlled for. These estimates implicitly controlfor both inherited home country and local colonial factors, so that the premium does not depend onculture, geography and institutions. As mentioned above, the critical factor that remains unobservedis the “current” generic human capital achieved by individual families at the Cape, though thereis no reason to believe that the WH and NWH would have systematically different scores on thisaccount. Hence, the specific wine-making skills premium — of 114% relative to NWH farmers —remains the strongest explanation for the production premium.The use of interaction terms in Tables 3 and 4 allows for the separation of production functions
by settler origin. We find that vines (as the most important input into wine production) andslaves consistently yield positive and statistically significant coefficients. The first controls for the
8Another premium that may remain is if Huguenots from wine-producing regions received more formal educationat the Cape. Although the Huguenots were allowed a separate school initially, the Company soon abolished thesebenefits with the aim to integrate the Huguenots into Dutch society (Coertzen 1997). There is thus no evidence thatformal education at the Cape differed between French and Dutch, or, more pertinently here, between the WH andNWH groups.
12
potentially unequal distribution of initial inputs, and also serves as a proxy for land size (Columns(4) to (7)). It is evident that an additional 1000 vines increased production by approximately 12%for the NH, with an additional 11% premium per 1000 vines for the NWH and a small differencefrom this figure for the WH. Given that the NWH planted the least vines on average, while the WHpossessed the most (see Table 1), these results indicate that increasing returns to scale were realisedinitially, but that these started flattening off (as per Table 3, columns (4) — (6)). Table 3 reveals astatistically significant but small negative coefficient on the interaction term between slaves and theWH-dummy, suggesting that this group somehow did not gain as much as the non-Huguenots fromemploying slaves. This may be due to the specialisation of WH farmers in viticulture (as per Table1), with slave use mostly restricted to the harvest season of one crop type. The literature seemsto suggest that the intensive use of slavery could be attributed to the success of a number of elitewine farmers (see for instance, Fourie & von Fintel 2010b). However, the results here suggest thaton aggregate, productive wine-makers tended to favour fewer slaves per household and to use themsub-optimally.9
The WH-group does gain a large productivity advantage through the use of knechts. Whileknechts do not seem to add to wine production for the two other groups (especially once controls fordistricts are introduced from Column (4) of Table 3), Huguenots originating from wine-producingregions produce as much as 191% more wine when an extra knecht is employed compared to non-Huguenots (Column (7) in Table 3), though there is no noticeable premium when compared to otherNWH (Table 4). This result may be attributable to returns to scale: in Table 1 it is evident thatthe WH had the smallest number of knechts on average, so that returns are still high at low numberof knechts. However, given that the other groups did not possess substantially more knechts (withthe average not even reaching a quarter per household within all groups), it may suggest that someother characteristic is at play.Including wheat and cattle production in specification (4) in both Tables 3 and 4 accounts for the
fact that the Huguenot advantage could have accrued to them because of complementarities betweenproduction types. It also quantifies the benefit of using capital invested in other modes of productionfor multiple purposes. Wheat production is robustly complementary to wine production (though theimpact is small), while cattle production shows no significant complementarity. Similarly, we alsocontrol for the number of horses farmers possess, without any notable impact. More importantly, itis evident that the Huguenot advantage did not manifest as a spill-over from other production andthe lessons learnt there. Rather, the specific skills related to this production type remained moreimportant.In column (5) of Table 3 and column (4) of Table 4 we introduce controls for regions of settlement,
with the base category being Cape Town. These controls are introduced to account for the fact thatthe quality of land (as opposed to the size of farms, which is proxied for by vines, as above) mayhave differed in the various districts of the colony (these factors are discussed below). Noticeablepremia emerge for wine production in regions that still dominate the industry up until this day— in particular the Stellenbosch and Drakenstein regions enjoyed more favourable wine-producingconditions in all specifications. This is of particular importance, because Huguenots were dominantlyallocated land in exactly these regions. However, selection into the various regions does not alter themain result, so that the advantage of the WH and NWH relative to the NH is not likely attributableto farmers settling in regions that are more conducive to wine production.We also control for other familial ties which could have aided the transmission of specific knowl-
edge. It is evident that being married to a Huguenot explains some of the premium, with thecoefficients being significantly positive, and (in column (6) of Table 2) the dummy of interest re-ducing in magnitude. All that this suggests is that specific knowledge is not only transferred via
9Two points of concern: firstly, slaves may have been loaned to neighbouring farmers during off-peak season, andthe profit from such transactions would not be reflected in the opgaafrolle. Secondly, wine farmers may rather haveused Khoe labour during the harvest season, as some evidence suggests (Worden 1985; Green 2010). Without dataon the number of Khoe employed, this hypothesis is unverifiable.
13

paternal links, but also through maternal family lines. Further, we wish to understand whetherthe advantage only realised amongst the first group of immigrants (which implies that the specificknowledge eroded and was not transferred to later generations). In the final specifications of Tables3 and 4 it is evident that Huguenots that were born abroad did indeed enjoy a greater premiumthan those that were not. While the coefficient of interest diminishes in magnitude, its size andsignificance remain notable, so that knowledge transfers to later generations remain evident in thedata. Similarly, it is also possible that the advantage that the whole Huguenot group enjoys couldbe driven entirely by the specialist wine farmers — the first movers — identified by Coertzen (1997).However, this coefficient is not statistically significant in any specification.Given that wheat production does not, as argued above, require the same specific skills as wine
making, one expects that any initial advantages in this mode of production can be easily transferredand would thus erode over time. Table 5 reproduces the results of Table 3, but with wheat reaped asthe dependent variable. Wheat sown is now used as the input, while wine controls for other capital(and land size).It is sufficient to note here that while in specifications with limited controls (columns (1) to (3))
the WH also enjoys an inherent advantage, the significance of this finding is eroded as soon as districtcontrols are introduced. Moreover, the coefficient turns negative when the Born Abroad dummy isintroduced. In contrast, the advantage relevant to wine production cannot be explained away byany of the controls, and the specific skills in wine production effect has been as closely identified asequations (2) and (3) suggest.
7 Discussion of ResultsThe arrival of the French Huguenots increased the production of wine at the Cape. Our regressionresults suggest that a selection of the French descended from wine-producing regions, and that thisgroup was significantly better at viticulture than either their French compatriots from non-wineproducing areas, or the non-Huguenots.A possible first explanation for this advantage is of course the standard factors of production —
land, capital and labour. Maybe the French had access to more or better land, a greater stock ofcapital or access to more labour? Given that no information on land is contained in the opgaafrolle,we turn to historical sources and anecdotal accounts.The Huguenots settled mostly in the areas today known as Franschhoek (literally meaning French
corner), Simondium, Drakenstein and Dal Josafat (today merged into the town of Paarl) and Wa-genmakersvallei (Wellington). They were not the only settlers to inhabit these areas — many Dutchsettlers moved to farms in the vicinity as it was the policy of the Dutch East India Company toamalgamate the French into Dutch society. All farmers were allocated similar land sizes — 60 morgeneach (which equal roughly 51 hectares) — on condition that they cultivate it within the first threeyears. Figure 3 shows the location of 37 of the Huguenot households. Except for Franschhoek, thefarms are evidently separated, and would have been interspersed with non-Huguenot farms (notshown).O.F. Mentzel, travelling through the Cape Colony roughly five decades after the arrival of the
Huguenots, provides the following summary of the French influence in Franschoek:This valley is on account of its extraordinary fertility the best portion of the Cape. It was
unusually well cultivated through the diligence and untiring industry of the first French colonistsand has been maintained in this state by their successors. The fertility of this little district canbe imagined from the fact that the first colonists arrived there destitute of all means, and like allothers had to borrow from the Company their cattle, farm implements, seed and bread-corn andeverything else they needed; yet were the first to repay their debt amounting to many thousands ofgulden.” (Mentzel 1944:64, 65, our emphasis)While Mentzel refers to the “extraordinary fertility” of the region, it is clear from his quotation
14

that he refers in fact to its productivity, rather than soil quality or other environmental characteristics.His observations therefore correspond closely with our empirical results. He refutes the notion thatthe French had any advantage in capital or land; the greater productivity of the Huguenots, accordingto Mentzel, is simply due to their greater “diligence and untiring industry”, reflecting Coertzen’s(1997) observation relating to “hard work and an enterprising spirit”. Such qualitative evidenceis supported by our empirical analysis; the inclusion of district dummies does not eliminate theWH-group dummy, implying that the so-called “Franschhoek effect” (an advantage gained throughthe size and fertility of the land, as some scholars have suggested) is separate from the skills effect.While we control for the quality and quantity of land and capital, the question remains whether
the French possibly had access to more or better labour. We have already pointed out the varying useof wage and slave labour by the settlers, with the WH-group using more (but less efficient) slaves thanknechts. It is unclear why such a distinction would arise along groups originating from different partsof France. One possible explanation might be that WH-settlers, given their competitive advantagein wine, specialized in wine production, whereas the NWH-settlers diversified production into wheatand cattle. While we do control for both wheat and cattle outputs, it might be that the large,positive coefficient on the slave-interaction variable for NWH-farmers may, in fact, relate to themore efficient use of slave labour by the NWH-farmers across all agricultural outputs — i.e. fewerslaves are required when the harvest season is spread over the entire year (when one has productiondiversification) rather than concentrated in March (when grapes are harvested).WH-farmers tended also to have larger families than the other two groups (see Table 1). This re-
sult is perplexing and as yet unexplained.10 Given the difference in household size, we use per capitaproduction figures throughout. However, it is possible that larger households afforded economiesof scale (specialisation within the household), which may partly explain the additional advantageexperienced by the WH-group.Could the differences between the Huguenots and Dutch have arisen from institutional factors?
While the French did have a different legal tradition to the Dutch, they were subject to the same setof legal institutions in the Cape Colony. This is unlike the investment-inducing mechanisms positedby La Porta et al. (2008) in explaining cross-country variations in economic performance. There isalso little indication that language or culture, broadly defined, could have mattered (based on therobustness of the results in the French sub-sample). The French language disappeared within twogenerations at the Cape. Simon van der Stel, Governor at the Cape at the time of the Huguenot’sarrival, made it clear that he expected them to amalgamate fully into Dutch society. The onlyconcession that was made was to provide a small church and a minister to preach in French. However,there should have been little Weberian differences as both the Huguenots and the Dutch wereProtestant.Regardless of the inclusion of additional explanatory variables, the coefficient of the WH-dummy
is positive and statistically significant. We therefore posit that the productivity disparities betweenthe Huguenots and other settlers arise from specific human capital differences (abstracting from thepotential local generic human capital differences which could potentially have arisen, as in equation(2)). These differences are constituted by the “specific skills” in viticulture that the Huguenotfarmers brought from France. Why “specific skills” in viticulture? The results for wheat farmingsuggest that, although the French from wine-producing regions were initially more productive inboth wheat and wine production, the advantage in wheat production dissipated once other controlsare included. We hypothesise that wheat farming, different to viticulture, utilises more genericknowledge and farming skills, especially in the secondary production processes of flour- and bread-making. All groups had equal access (at low cost) to such knowledge or skills. The “specific skills”of viticulture and wine-making, where knowledge is transferred from father to son through extensive
10The result is contrary to what is expected. Gourbert (1970) finds that women in the northeast of France —including French Flanders — were nearly three times more fecund than their southwestern counterparts. Given thatwe treat the southwest mostly as wine-producing areas, while most of the non-wine producing Huguenots are fromthe northeast, origin cannot explain this trend at the Cape.
15

learning-by-doing, do not disseminate into the broader farming community; even controlling for thefarmers born abroad (and thus the direct carriers of the specific skills), the WH-dummy remainspositive and significant. Following capability theory, the specialised skills gave farmers (firms) asustainable competitive advantage, which they maintained independently from the enhancementsbrought about by acquisitions of capital (slaves) and labour (knechts). While such an advantagecould be countered through the acquisition of more capital, there is little evidence that such anadvantage could be sustained given the higher cost implications.The set of regressions which only include Huguenot farmers provide more compelling evidence
that it was a “specific skill” in viticulture, rather than other institutional factors, that explain thedifference. Given that only French Huguenots are included in the sample, all cross-group culturalmeasures, such as religion, language or other traits, are implicitly eliminated. Our variable ofinterest is thus provincial origin of the two Huguenot groups and only factors correlated with thiscould potentially bias the results.One such measure could potentially be the educational attainment of the citizens. It might be
that provinces more conducive to viticulture were also relatively more affluent and could thus affordhigher educational attainment. Our inclusion of a measure of average educational levels for regionsof origin (non-numeracy scores) attempts to control for this possible bias. This further supports ournotion that “human capital” as it is commonly understood may be too generic to determine settlersuccess. By differentiating human capital along the lines of (specific) skills and (generic) education,a more complete picture emerges of the underlying causal mechanism that drives differences inproduction.It may simply be that the French Huguenots enjoyed first-mover advantage. Once they settled
and utilised their superior skills in viticulture to obtain higher wine yields, they could acquirethe best farms and expand their production. Given that a wine farm is a medium- to long-runinvestment, their initial skills advantage would in one or two generations grow to yield significantdifferences where they had control over the scarce resource, land. There is however little evidenceof such amalgamation of production over the period.11 In fact, the evidence suggests that farmsbecame smaller, not larger, because of Dutch inheritance laws enforced at the Cape. These lawsdivided ownership of property at death amongst the deceased’s partner and their offspring in twoequal shares. As noted above, fertility rates were relatively high, which meant that farms were oftensplit between sons, partitioning the property into smaller and smaller units.12 Moreover, land wasnot a scarce resource. Viticulture was not only restricted to the Stellenbosch or Franschhoek region.In fact, as is evidenced by crop choice today, the land beyond the first mountains provided fertileopportunity for expansion in viticulture.13
The benefits of a first-mover advantage could also transpire through market relations. In astrongly regulated market such as the Cape Colony it helped to have good associations with theowners of the alcohol pachts (the monopoly contracts that restricted the number of sellers of wine,beer and brandy). They were the only permitted private wine buyers together with the Company.14
These pachts were sold annually by the Company to the leading bidders, although it seems to have
11We also include a dummy of the descendants of six farmers named by Coertzen (1997) who were the first toestablish wine farms. The coefficients in Table 3 and 4 are both negative and insignificant, suggesting few first-moveradvantages12 In fact, it may be that smaller households were able to sustain the scale required to remain more productive,
because of fewer claims on the existing land. This would imply that the Huguenots from wine-producing regions hadto have fewer offspring because they realised the importance of maintaining a certain operational size. This is of coursecontrary to the empirical evidence. Perhaps having fewer children does not explain the difference, but that only oneor two inherited the farm. Others were forced to move away, or marry the daughters of other wealthy farmers. Whythe French from wine-producing regions would have been comparatively more amenable to this idea is not clear.13 It should be pointed out, though, that because of the difficulty of transporting goods across the mountains in the
absence of any adequate passes (which was the case before the nineteenth century), viticulture in the interior wouldhave been extremely costly. While Swellendam was the first magisterial district to be established in this region in1743, our data show that no wheat or wine farming was practiced here up until 1773.14Most beer was imported.
16
not always been a perfectly competitive process (Groenewald 2004:15).15 Possibly, the Huguenots,having established early roots in the wine industry, obtained privileged access to these monopolyrights. These pachts became an extremely lucrative industry during the eighteenth century, the onlyone outside of agriculture that was open to the private market. And given the large and growingdemand for alcohol and such pleasures from sailors and soldiers stationed on the passing ships duringthe first few decades of the eighteenth century, the rights to sell liquor in the taverns and inns ofCape Town might have provided the Huguenots with a more profitable outlet for their produce. Yet,there is even less evidence to support that the French had any unique privileges (or social capital)with regards to the pachts. In fact, in a survey of the 27 individuals who invested in the alcoholpachts during the 1730s (just as the Huguenots began to increase their advantage), there is only oneFrench descendant — Jan le Roux, born in the Cape, who acquired four pachts (Groenewald 2009)16
Both these arguments are unconvincing. While other channels may have contributed to thegrowth in observed productivity differences, the specific viticulture skills of the WH-farmers, seemthe most plausible in explaining their competitive advantage. As the results suggest, their advantagewas not necessarily in producing more wine given the number of inputs. It was in producing winethat could last longer — a higher quality wine.The demand for Cape wine was concentrated in the demand from the passing ships. Every year,
between 9000 and 11000 soldiers and sailors anchored in Table Bay on their voyage between Europeand the East, a journey that would last at least three months either way. Fresh produce, includingwine, was the Cape’s major expert commodity, both for consumption in Cape Town and for thenext voyage (Boshoff and Fourie 2008; Boshoff and Fourie 2010). What was needed, therefore, waswine that would last the three months at sea: quality wine.Private17 wine production flourished with the arrival of the Huguenots in the Cape Colony. Yet,
a subset of these Huguenots — most of them from wine-producing regions in France — was better thantheir compatriots at producing quality wine. Their sons, benefiting from the secrets and know-howof their fathers, continued and improved these techniques, producing quality wines for which therewas always a market in Cape Town. The traveller Mentzel (1944: 186-187) alludes to this in hisdescription of wine-making at the Cape:“This then is the way in which wine is treated at the Cape of Good Hope, but every sensible
man will surely presume that for good wine-making something more is necessary than what hasbeen mentioned. There is no doubt that many colonists at the Cape do indeed know the secret ofpreparing good wine and therefore wines are made which stand the test, and grow mellower withage: but they are not such fools as to give away their secret and thus make the good wines morecommon.”Wine-making, different to wheat farming, requires specific skills and knowledge that the Huguenots
from wine-producing regions possessed when they arrived at the Cape. They maintained their advan-tage by protecting these “secrets” — either deliberately through protective behaviour or accidentallydue to the high cost of transfer (i.e. years of learning-by-doing). Other settlers may have attemptedto catch up — either through using resources such as capital (slaves) more efficiently or throughmarrying Huguenot wives — but the sustainable competitive advantage of the Huguenots from wine-producing regions allowed them to prosper independently from these tactics.WH-farmers sustained and expanded their advantage, even in the face of increased supply and
(sometimes) faltering demand during the eighteenth century. Yet, there was always a demand inCape Town for quality (long-lasting) wines. Produced by the WH-farmers, such wines would be soldat the fixed price imposed by the VOC. However, in the absence of a market mechanism to regulateprice and quantity, equilibrium was infrequent and surplus production common, as the numerous15As Groenewald (2004:15) notes after reviewing the apparent pacht auctions: “I do not think that the state of the
evidence allows us to deduce that these concessions were really auctioned off every year to the highest bidder.”16 12 are German nationals, 8 are Dutch, 6 were born in the Cape Colony and one is from Denmark (Groenewald
2009).17Until 1700, wine production was mostly concentrated on the properties of VOC officials — especially Simon van
der Stel (Constantia) and Willem Adriaan van der Stel (Vergelegen).
17

references to the streets of Cape Town overflowing with run-off wine for which no buyer could befound, attests to (De Kock 1924). Given a fixed quantity demanded and a fixed demand price (set bythe Company), an increase of production by WH-farmers (i.e. quality wine) would crowd out wineproduction from other groups, resulting in surplus production.18 Such surpluses were often used asillegal trade goods (either with local inns and taverns, with passing ships, or most probably, withthe native Khoekhoe), as inputs for brandy manufacturing (which was of a particularly low qualityand again mostly used for trading with the Khoekhoe) or, in the worst cases, let to flow away inthe streets of Cape Town when the Company’s allotment had been filled (De Kock 1924). In themedium to long run, the producers (and their descendants) of lower quality wines were forced tofind alternatives, either as wheat farmers or, more likely, as pastoral farmers in the poorer interior.A similar result emerges when supply is held constant and demand falls (for example, fewer ships
arrive in Table Bay): the monopsonist Company would tend to favour quality wine producers (givenan equal price) rather than producers that aim for low-quality, high volume. These suppliers are thenforced to either discard their wine, trade it illegally (often with the native Khoekhoe population) oruse it for brandy manufacturing (which was of a particularly low quality and mostly used for tradingwith the Khoekhoe).Slowly during the eighteenth century, a farming elite emerged that would include mostly affluent
wine farmers (Guelke and Shell 1983; Fourie and von Fintel 2010; Fourie and von Fintel 2011).Indeed, Figure 4 shows that by 1773 wine production was non-existent for much of the lower tailof each settler group’s production distribution. However, from the 80th percentile, the WH clearly(stochastically) dominated wine production, suggesting that only an elite secured the premia that wediscuss throughout this paper. While a decision to restrict immigration and encourage slave importswas already taken by the Council of Policy in Cape Town in 1717, this decision was reinforced duringthe 1750s when the Lords XVII again suggested European immigration as a way to supplement labourshortages experienced by the farmers (Giliomee 2003). This time, the elite farmers were consulted.Engerman and Sokoloff’s hypothesis, that initial colonial inequality would result in institutions thatprotect the position of the elite (through restricting immigration, for example) and ultimately leadingto persistent inequality, seems to prove true in the eighteenth century Cape Colony, although theconditions for its emergence — a tropical crop and a large native population — did not exist (Fourieand Von Fintel 2010). The wine elite continued to permeate Cape society well into the nineteenthcentury and were later perhaps reinforced by the diamond and gold-mining elites. South Africaninequality today can — indirectly, at least — trace its roots to the arrival of the Huguenots in SouthAfrica and the skills and secrets they brought from France.
8 ConclusionThe institutional literature does not suggest a link between settler’s origin and the development ofsettler regions. In fact, the seminal contributions nearly all reflect on the environmental conditionsthe settlers experienced on arrival to explain why certain regions developed growth-inducing versusgrowth-inhibiting institutions. We posit that this neglects an important component of migration anddevelopment theory. The French Huguenots that arrived at the Cape Colony in 1688/89 possesseduniquely different skills than the incumbent farmers, that allowed them to become more productivewine-makers.None of the standard factors of production explain these differences, nor any “institutional”
difference between the French and the Dutch. In fact, we control for the unquantifiable cross-group differences by showing that Huguenots who originated from wine-producing regions were moreproductive in viticulture than the Huguenots from non-wine producing regions and also all other
18A similar result emerges when supply is held constant and demand falls (for example, fewer ships arrive in TableBay): the monopsonist Company would tend to favour quality wine producers (given an equal price) rather thanproducers that aim for low-quality, high volume.
18

countries. We posit that the Huguenots from wine-producing areas possessed “specialised skills” inviticulture that could not be easily (cheaply) acquired, as was possible for the “general skills” ofwheat farming. In fact, we see that an elite of Huguenot descendants from wine-producing regionsmaintained their advantage in wine-making at the Cape. This disparity cannot be satisfactorilyexplained through first-mover advantage in production, ownership or social capital, or the Capeinheritance laws. Specialised skills — trade secrets — gave the Huguenots from wine-producing regionsa sustainable competitive advantage.Our results point to strong evidence that settler capabilities — specific skills acquired in the land
of origin — matter in colonial development and should be considered an important element — togetherwith environmental conditions and resource endowments in the destination region — in explainingwhy countries follow different development paths.
References[1] Agbor J.A, Fedderke J.W. and Nicola V. (2010) “How Does Colonial Origin matter for Economic
Performance in Africa?” ERSA Working Paper no 176
[2] A’Hearn, B., J. Baten and Crayen, D. (2009). "Quantifying Quantitative Literacy: Age Heapingand the History of Human Capital." Journal of Economic History 69(3): 783-808.
[3] Acemoglu, D., S. Johnson and Robinson, J. (2001). "The colonial origins of comparative devel-opment: an empirical investigation." American Economic Review 91: 1369-1401.
[4] Acemoglu, D., S. Johnson and Robinson, J. (2005). "The rise of Europe: Atlantic trade, insti-tutional change and economic growth." American Economic Review 95(5469579).
[5] Anderson, J. E. and E. Van Wincoop (2004). "Trade Costs." Journal of Economic Literature42(3): 691-751.
[6] Argyres, N. (1996). "Evidence on the role of firm capabilities in vertical integration decisions."Strategic Management Journal 17: 129-150.
[7] Banerjee, A. and L. Iyer (2005). "History, Institutions and Economic Performance: the Legacyof Colonial Land Tenure Systems in India." American Economic Review 95(4): 1190-1213.
[8] Baten, J. and J.-L. van Zanden (2008). "Book production and the onset of modern economicgrowth." Journal of Economic Growth 13: 217-235.
[9] Becker, G. (1993). Human capital: a theoretical and empirical analysis, with special reference to education.Chicago, University of Chicago Press.
[10] Becker, S. O. and L. Woessmann (2009). "Was Weber Wrong? A Human Capital Theory ofProtestant Economic History." Quarterly Journal of Economics 124(2): 531-596.
[11] Bhattacharyya, S. (2009). "Unbundled institutions, human capital and growth."Journal of Comparative Economics 37: 106-120.
[12] Bloom, D. E. and J. D. Sachs (1998). "Geography, demography, and economic growth in Africa."Brookings Papers on Economic Activity 2: 207-273.
[13] Bolsmann, E. (2008). French Footprints in South Africa. Pretoria, Be My Guest Publishers.
[14] Bolt, J. and D. Bezemer (2009). "Understanding Long-Run African Growth: Colonial Institu-tions or Colonial Education?" The Journal of Development Studies 45(1): 24-54.
19

[15] Boshoff, W. H. and J. Fourie (2008). "Explaining the Ship Traffic Fluctuations in the EarlyCape Settlement: 1652-1793." South African Journal of Economic History 23: 1-27.
[16] Boshoff, W. H. and J. Fourie (2010). "The significance of the Cape trade routeto economic activity in the Cape Colony: a medium-term business cycle analysis."European Review of Economic History 14(3): 469-503.
[17] Botha, C. G. (1939). Die Kaapse Hugenote. Cape Town, Nasionale Pers.
[18] Boucher, M. (1981). French Speakers at the Cape: The European background. Pretoria, Uni-versity of South Africa.
[19] Brittanica Online (2009). Major French Wine Producing Regions, Brittanica.com.
[20] Brunt, L. (2008). Property Rights and Economic Growth: Evidence from a Natural Experiment.CEPR Discussion Papers No. 6404. London, Centre for Economic Policy Research.
[21] Chaudhary, L. (2009). "Determinants of Primary Schooling in British India."Journal of Economic History 69(1): 269-302.
[22] Chaudhary, L. (2010). "Taxation and Educational Development: Evidence from British India."Explorations in Economic History forthcoming
[23] Coertzen, P. (1997). Die Hugenote van Suid-Afrika 1688-1988. Cape Town, Tafelberg.
[24] Comin, D., W. Easterly and E. Gong (2010). "Was the Wealth of Nations Determined in 1000BC?" American Economic Journal 2: 57-69.
[25] Crayen, D. and J. Baten (2010). "New evidence and new methods to measure human capitalinequality before and during the industrial revolution: France and the US in the seventeenthto nineteenth centuries." Economic History Review 63(2): 452-478.
[26] Dell, M. (2010). "The Persistent Effects of Peru’s Mining Mita." Econometrica forthcoming
[27] Diamond, J. (1997). Guns, Germs and Steel: the Fate of Human Societies. New York, Norton.
[28] Easterly, W. (2007). "Inequality does cause underdevelopment: Insights from a new instru-ment." Journal of Development Economics 84: 755-776.
[29] Easterly, W. and R. Levine (2003). "Tropics, germs, and crops: how endowments influenceeconomic development." Journal of Monetary Economics 50(1): 3-39.
[30] Engerman, S. L., S. Haber and K. L. Sokoloff. (2000). Inequality, Institutions, and DifferentialPaths of Growth among new World Economies. Institutions, Contracts, and Organizations. C.Menard. Cheltenham, Edward Elgar.
[31] Engerman, S. L. and K. L. Sokoloff (2005). Colonialism, Inequality, and long-run paths of de-velopment. NBER Working Paper Series 11057. Cambridge, MA, National Bureau of EconomicResearch.
[32] Fourie, J. (2010). The nature and growth of wealth in the Dutch Cape Colony: measurementsfrom probate inventories. Stellenbosch, Stellenbosch University.
[33] Fourie, J. (2011). The nature and growth of wealth in the Cape Colony: measurements fromprobate inventories. Stellenbosch, Stellenbosch University.
[34] Fourie, J. and D. von Fintel (2010a). "The dynamics of inequality in a newly settled, pre-Industrial society: Evidence from Cape Colony tax records." Cliometrica 4(3): 229-267.
20

[35] Fourie, J. and D. Von Fintel (2010b). The Fruit of the Vine: An augmented endowments-inequality hypothesis and the Rise of an Elite in the Cape Colony. Elites in Development. A.Amsden, J. Robinson and A. DiCaprio. Helsinki, UN-WIDER.
[36] Fourie, J. and D. von Fintel (2011). "Income Inequality in the Dutch Cape Colony."Economic History of Developing Regions forthcoming
[37] Frankel, J. and D. Romer (1999). "Does trade cause growth?" American Economic Review 89:379-399.
[38] Giliomee, H. (2003). The Afrikaners. Cape Town, Tafelberg.
[39] Glaeser, E. L., R. La Porta, F. Lopez-de-Silanes and A. Shleifer. (2004). "Do Institutions CauseGrowth?" Journal of Economic Growth 9(3): 271-303.
[40] Goubert, P. (1970). "Historical Demography and the Reinterpretation of Early Modern FrenchHistory: A Research Review." Journal of Interdisciplinary History 1(1): 37-48.
[41] Groenewald, G. (2004). From tappers to pachters: The evolution of the alcohol pacht systemat the Cape, c.1656-1680. ’Company, Castle and Control’ research group seminar. University ofCape Town.
[42] Groenewald, G. (2009). Kinship, Entrepreneurship and Social Capital: Alcohol Pachters andthe Making of a Free-Burgher Society in Cape Town, 1652-1795. History department. CapeTown, University of Cape Town. Doctorate
[43] Guelke, L. (1980). The white settlers, 1652-1780. The Shaping of South African Society, 1652-1820.R. Elphick and H. Giliomee. Cape Town, Longman Penguin Southern Africa.
[44] Guelke, L. and R. Shell (1983). "An early colonial landed gentry: land and wealth in the CapeColony 1682-1731." Journal of Historical Geography 9(3): 265-286.
[45] Guiso, L., P. Sapienza, and L. Zingales (2006). "Does Culture Affect Economic Outcomes?"Journal of Economic Perspectives 20(2): 23-48.
[46] Hanushek, E. A. and L. Woessmann (2008). "The Role of Cognitive Skills in Economic Devel-opment." Journal of Economic Literature 46(3): 607-668.
[47] Hirsch, A. H. (1930). "French Influence on American Agriculture in the Colonial Period withSpecial Reference to Southern Provinces " Agricultural History 4(1): 1-9
[48] Hornung, E. (2010). Immigration and the Diffusion of Technology: The Huguenot Diaspora inPrussia. Munich, Institute for Economic Research.
[49] Huillery, E. (2009). "History Matters: The Long-Term Impact of Colonial Public Investmentsin French West Africa." American Economic Journal: Applied Economics 1(2): 176-215.
[50] Jensen, M. C. and W. H. Meckling (1992). Specific and general knowledge, and organizationalstructure. Contract Economics. L. Werin and H. Wijkander. Oxford, Blackwell: 251-274.
[51] Jha, S. (2008). Trade, Institutions and Religious Tolerance: Evidence from India.Research Papers 2004. Stanford, Stanford University, Graduate School of Business.
[52] Klerman, D. and P. G. Mahoney (2007). "Legal Origin?" Journal of Comparative Economics35(2): 278-293.
[53] La Porta, R., F. Lopez-de-Silanes, A. Shleifer and R. Vishny. (1997). "Legal determinants ofexternal finance." Journal of Finance 52(3): 1131-1152.
21

[54] La Porta, R., F. Lopez-de-Silanes, A. Shleifer and R. Vishny. (1998). "Law and Finance."Journal of Political Economy 106(6): 1113-1156.
[55] La Porta, R., F. Lopez-de-Silanes and A. Shleifer. (2008). "The Economic Consequences ofLegal Origins." Journal of Economic Literature 46: 285-332.
[56] Landes, D. (1998). The Wealth and Poverty of Nations. New York, W.W. Norton.
[57] Langlois, R. N. and P. L. Robertson (1993). "Business organization as a coordination problem:towards a dynamic theory of the boundaries of the firm." Business and Economic History 22:31-41.
[58] Lucas, R. E. (1988). "On the mechanics of economic development."Journal of Monetary Economics 22: 3-42.
[59] Mathias, P. (1975). "Skills and the Diffusion of Innovations from Britain in the EighteenthCentury " Transactions of the Royal Historical Society 25: 93-113.
[60] McCloskey, D. (2006). The Bourgeois Virtues: Ethics for an Age of Commerce. Chicago, Uni-versity of Chicago Press.
[61] Mentzel, O. F. (2008). A geographical-topographical description of the Cape of Good Hope. Part II.Cape Town, Van Riebeeck Society.
[62] Mokyr, J. (2002). The Gifts of Athena: Historical Origins of the Knowledge Economy. Prince-ton, Princeton University Press.
[63] Morison, S. E. (1972). The Oxford History of the American People. New York, Mentor.
[64] Nathan, M. (1939). The Huguenots in South Africa. South Africa, Central News Agency.
[65] Nelson, R. R. and S. G. Winter (2002). "Evolutionary Theorizing in Economics."Journal of Economic Perspectives 16(2): 23-46.
[66] Nunn, N. (2008). "The Long Term Effects of Africa’s Slave Trades."Quarterly Journal of Economics 123(1): 139-176.
[67] Nunn, N. (2009). Christians in Colonial Africa. Cambridge, MA, Harvard University.
[68] Nunn, N. and D. Puga (2009). Ruggedness: The Blessing of Bad Geography in Africa.NBER Working Papers 14918. Cambridge, MA, National Bureau of Economic Research.
[69] Nunn, N. and L. Wantchekon (2009). The Slave Trade and the Origins of Mistrust in Africa.NBER Working Papers 14783. Cambridge, MA, National Bureau of Economic Research.
[70] O’Mullane, B. (1946). "The Huguenots in Dublin: Part I." Dublin Historical Record 8(4): 121-134
[71] Olsson, O. and D. A. Hibbs (2005). "Biogeography and long-run economic development."European Economic Review 49: 909-938.
[72] Putterman, L. and D. Weil (2010). "Post-1500 population flows and the long-run determinantsof economic growth and inequality." The Quarterly Journal of Economics 125(4): 1627-1682.
[73] Romer, P. (1990). "Human capital and growth: Theory and evidence."Carnegie-Rochester Conference Series on Public Policy, Elsevier 32(1): 251-286.
[74] Romer, P. M. (1994). "The Origins of Endogenous Growth."The Journal of Economic Perspectives 8(1): 3-22.
22

[75] Rothstein, N. and P. Thornton (1960). "The Importance of the Huguenots in the London SilkIndustry." Proceedings of the Huguenot Society 20(1).
[76] Sachs, J. D. and P. Malaney (2002). "The Economic and Social Burden of Malaria." Nature415: 680-685.
[77] Sachs, J. D. and A. Warner (2001). "The Curse of Natural Resources."European Economic Review 45: 827-838.
[78] Schutte, G. (1980). Company and colonists at the Cape.The Shaping of South African Society, 1652-1820. R. Elphick and H. Giliomee. Cape Town,Longman Penguin Southern Africa.
[79] Scoville, W. C. (1951). "Spread of Techniques: Minority Migrations and the Diffusion of Tech-nology." Journal of Economic History 11(4): 347-360
[80] Scoville, W. C. (1952). "The Huguenots and the Diffusion of Technology I."Journal of Political Economy 60(4): 294-311.
[81] Scoville, W. C. (1952). "The Huguenots and the Diffusion of Technology. II "Journal of Political Economy 60(5): 392-411.
[82] Scoville, W. C. (1953). "The Huguenots in the French Economy, 1650-1750 "The Quarterly Journal of Economics 67(3): 423-444
[83] Sokoloff, K. L. and S. L. Engerman (2000). "History Lessons." Journal of Economic Perspectives14(3): 217-232.
[84] Spurrier, S. and M. Dovaz (1983). Academie du Vin Wine Course. London, Century.
[85] Tabellini, G. (2008). "Presidential Address: Institutions and Culture."Journal of the European Economic Association 6(2-3): 255-294.
[86] Teece, D. J., G. Pisano and A. Shuen. (1997). "Dynamic capabilities and strategic management."Strategic Management Joumal 18(7): 509-533.
[87] Unwin, T. (1996). Wine and the vine. New York, Routledge.
[88] van Duin, P. and R. Ross (1987). The Economy of the Cape Colony in the 18th Century. Lei-den, The Centre for the Study of European Expansion.
23

Table 1: Average household ownership per type of asset, farmer sample
Group N HH Slaves Knechts Vines Wine Wheat Reaped Cattle Horses
NH 6848 M 3.57 5.04 0.15 3.80 2.28 22.98 35.55 5.80
SD 2.86 8.46 0.77 11.54 7.64 64.22 65.07 10.08
NWH 1038 M 3.62 3.73 0.06 3.65 2.26 20.01 31.78 4.42
SD 2.82 6.28 0.29 8.81 6.55 55.14 44.15 6.69
WH 1192 M 4.05 4.03 0.08 6.88 4.83 15.58 31.01 4.54
SD 3.16 6.70 0.36 12.87 10.92 41.05 40.86 6.81
Total 9078 M 3.64 4.76 0.13 4.19 2.61 21.67 34.52 5.48
SD 2.90 8.04 0.69 11.49 8.08 60.71 60.32 9.39
Notes: N = observations, HH = household size, M = mean, SD = standard deviation. Only farming households are included in the sample.
Table 2: Mean household per capita production levels, by population groups over time
Wine (leaguers) Wheat Reaped (muids)
NH NWH WH NH NWH WH
1700 1.16 1.18 1.40 4.32 2.65 3.69
1709 0.98 0.55 0.83 17.45 7.30 8.14
1719 0.80 0.44 0.98 9.45 5.93 3.76
1731 0.75 0.55 1.13 8.68 6.65 5.46
1741 0.33 0.25 0.67 10.55 11.76 8.33
1752 0.49 0.54 1.18 4.72 3.54 4.20
1757 0.61 0.82 1.23 3.36 1.64 1.53
1773 0.63 0.93 1.89 3.73 5.51 2.82
NOTES: All figures are weighted to reflect the household size of each farmer. Only farming households are included in the sample.
24

Table 3: Dependent Variable: log (Wine per household member produced) (in leaguers), full farmer sample, OLS
(1) (2) (3) (4) (5) (6) (7)
NWH 0.191 0.482*** 0.510*** -0.128 -0.081 -0.343*** -0.516***
WH 1.721*** 1.917*** 1.793*** 0.899*** 1.030*** 0.764*** 0.653***
Slaves 0.168*** 0.166*** 0.044*** 0.068*** 0.068*** 0.067***
Slaves*NWH -0.011 -0.022 -0.016 -0.009
Slaves*WH 0.014 -0.074*** -0.073*** -0.066***
Knechts 0.416** 0.369** 0.008 0.096 0.093 0.106
Knechts*NWH 1.468 -0.894 -0.84 -0.842
Knechts*WH 2.218* 1.877** 2.004** 1.914**
Vines 0.132*** 0.120*** 0.120*** 0.121***
Vines*NWH 0.112*** 0.117*** 0.117*** 0.114***
Vines*WH 0.03 0.048** 0.048** 0.047**
Cattle -0.001 -0.003* -0.003* -0.002
Wheat reaped 0.011*** 0.010*** 0.010*** 0.010***
Horses 0.01 0.018 0.018 0.017
Stellenbosch 1.419*** 1.403*** 1.399***
Drakenstein 0.781*** 0.726*** 0.693***
Swellendam 0.125 0.095 0.067
Married to NWH 0.369*** 0.380***
Married to WH 0.368*** 0.421***
Born abroad 0.687***
Coertzen -0.22
Y1702 -0.904*** -0.815*** -0.818*** -0.769*** -0.745*** -0.734*** -0.733***
Y1705 -0.815** -0.741** -0.744** 0.237 0.153 0.159 0.162
Y1709 -1.141*** -1.364*** -1.365*** -1.551*** -1.534*** -1.528*** -1.538***
Y1712 -1.652*** -1.942*** -1.947*** -1.947*** -1.954*** -1.943*** -1.932***
Y1719 -1.433*** -1.940*** -1.949*** -1.642*** -1.681*** -1.669*** -1.638***
Y1723 -1.547*** -2.093*** -2.102*** -1.633*** -1.652*** -1.643*** -1.585***
Y1731 -1.981*** -2.771*** -2.775*** -1.979*** -2.031*** -2.024*** -1.935***
Y1738 -2.682*** -3.733*** -3.738*** -2.716*** -2.772*** -2.756*** -2.655***
Y1741 -2.956*** -3.817*** -3.821*** -2.848*** -2.901*** -2.893*** -2.785***
Y1752 -2.996*** -3.219*** -3.229*** -2.743*** -2.800*** -2.790*** -2.659***
Y1757 -3.116*** -3.437*** -3.445*** -2.887*** -2.817*** -2.805*** -2.679***
Y1762 -2.907*** -3.364*** -3.378*** -2.880*** -2.938*** -2.930*** -2.805***
Y1773 -3.386*** -3.735*** -3.741*** -3.311*** -3.210*** -3.200*** -3.074***
Constant -2.420*** -3.115*** -3.095*** -3.531*** -4.213*** -4.223*** -4.294***
R-squared 0.104 0.296 0.297 0.542 0.564 0.565 0.566
N 9078 9078 9078 9078 9078 9078 9078
F statistic 48.121 148.702 129.223 134.253 217.507 204.4 197.634
NOTES: NWH = Huguenots from non-wine producing regions. WH = Huguenots from wine-producing regions. Base category: non-Huguenots and the year 1700. Wheat reaped is measured in muiden, Vines in number of thousands. Converted to household per capita levels. Estimates are weighted by household size and significance levels are based on the use of robust standard errors.. *** denotes significance at the 1% significance level, ** at 5% and * at 10%.
25

Table 4: Dependent Variable: log (Wine per household member produced) (in leaguers), full Huguenot sample, OLS
(1) (2) (3) (4) (5) (6) (7)
WH 1.509*** 1.430*** 1.286*** 0.998*** 1.003*** 1.029*** 1.140***
Slaves 0.172*** 0.156*** 0.046*** 0.052*** 0.049*** 0.029
Slaves*WH 0.025 -0.047** -0.053** -0.050** -0.034
Knechts 2.148** 1.784 -0.541 -0.518 -0.357 2.651***
Knechts*WH 0.785 2.490 2.559 2.292 -0.977
Vines 0.236*** 0.237*** 0.235*** 0.257***
Vines*WH -0.066* -0.068** -0.066** -0.088
Cattle -0.001 -0.001 -0.001 -0.003
Wheat reaped 0.011** 0.012** 0.013** 0.013*
Horses 0.002 0.000 0.004 0.045
Stellenbosch 1.076*** 0.982*** 0.923*** 0.852*
Drakenstein 1.264*** 1.158*** 1.036*** 0.962***
Swellendam 0.294 0.240 0.101 0.158
Married to NWH 0.426*** 0.412** 0.33
Married to WH 0.380** 0.419*** 0.285
Born abroad 1.019*** 0.788***
Coertzen -0.148 -0.158
Non-numeracy 0.003
Y1702 -1.341** -1.303** -1.315** -1.077*** -1.065*** -1.059** -1.170**
Y 1705 -1.468*** -1.432*** -1.440*** -0.024 -0.01 -0.005 -0.1
Y 1709 -1.529*** -1.713*** -1.714*** -1.815*** -1.819*** -1.809*** -1.903***
Y 1712 -2.277*** -2.714*** -2.711*** -2.712*** -2.713*** -2.637*** -2.846***
Y 1719 -1.967*** -2.619*** -2.611*** -1.772*** -1.784*** -1.554*** -1.574***
Y 1723 -1.911*** -2.524*** -2.526*** -1.528*** -1.539*** -1.159*** -1.123***
Y 1731 -2.151*** -3.158*** -3.154*** -1.903*** -1.924*** -1.366*** -1.373***
Y 1738 -3.059*** -4.422*** -4.408*** -2.924*** -2.930*** -2.290*** -2.341***
Y 1741 -3.060*** -4.271*** -4.255*** -2.773*** -2.789*** -2.107*** -2.241***
Y 1752 -3.047*** -3.744*** -3.739*** -2.978*** -2.993*** -2.245*** -2.497***
Y 1757 -3.390*** -4.133*** -4.128*** -3.070*** -3.086*** -2.333*** -2.565***
Y 1762 -2.910*** -3.872*** -3.871*** -3.243*** -3.262*** -2.515*** -2.826***
Y 1773 -3.573*** -4.407*** -4.405*** -3.601*** -3.612*** -2.858*** -3.160***
Constant -1.977*** -2.119*** -2.038*** -4.397*** -4.634*** -5.270*** -5.376***
R-squared 0.092 0.212 0.213 0.602 0.604 0.611 0.596
N 2230 2230 2230 2230 2230 2230 1675
F statistic 16.349 26.165 23.828 95.992 90.772 91.677 70.06
NOTES: WH = Huguenots from wine-producing regions. Base category: Non-Wine Huguenots and the year 1700. Wheat reaped is measured in muiden, Vines in number of thousands. Converted to household per capita levels. Estimates are weighted by household size and significance levels are based on the use of robust standard errors.. *** denotes significance at the 1% significance level, ** at 5% and * at 10%.
26
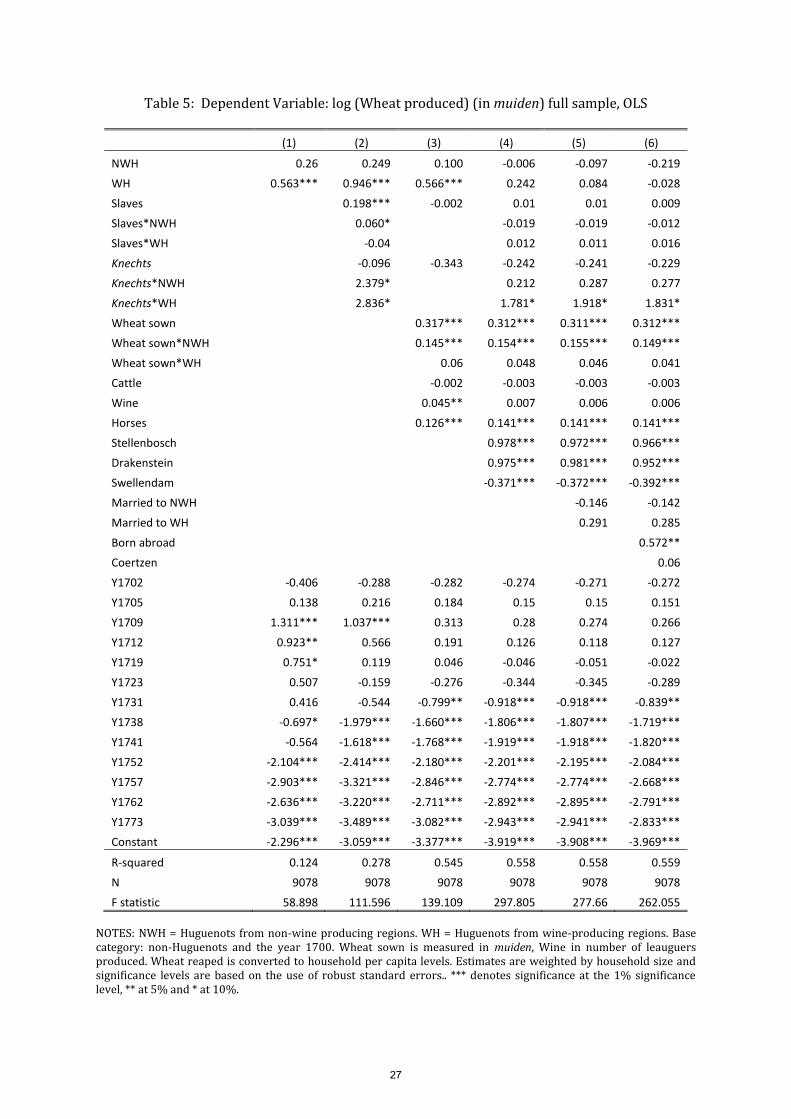
Table 5: Dependent Variable: log (Wheat produced) (in muiden) full sample, OLS
(1) (2) (3) (4) (5) (6)
NWH 0.26 0.249 0.100 -0.006 -0.097 -0.219
WH 0.563*** 0.946*** 0.566*** 0.242 0.084 -0.028
Slaves 0.198*** -0.002 0.01 0.01 0.009
Slaves*NWH 0.060* -0.019 -0.019 -0.012
Slaves*WH -0.04 0.012 0.011 0.016
Knechts -0.096 -0.343 -0.242 -0.241 -0.229
Knechts*NWH 2.379* 0.212 0.287 0.277
Knechts*WH 2.836* 1.781* 1.918* 1.831*
Wheat sown 0.317*** 0.312*** 0.311*** 0.312***
Wheat sown*NWH 0.145*** 0.154*** 0.155*** 0.149***
Wheat sown*WH 0.06 0.048 0.046 0.041
Cattle -0.002 -0.003 -0.003 -0.003
Wine 0.045** 0.007 0.006 0.006
Horses 0.126*** 0.141*** 0.141*** 0.141***
Stellenbosch 0.978*** 0.972*** 0.966***
Drakenstein 0.975*** 0.981*** 0.952***
Swellendam -0.371*** -0.372*** -0.392***
Married to NWH -0.146 -0.142
Married to WH 0.291 0.285
Born abroad 0.572**
Coertzen 0.06
Y1702 -0.406 -0.288 -0.282 -0.274 -0.271 -0.272
Y1705 0.138 0.216 0.184 0.15 0.15 0.151
Y1709 1.311*** 1.037*** 0.313 0.28 0.274 0.266
Y1712 0.923** 0.566 0.191 0.126 0.118 0.127
Y1719 0.751* 0.119 0.046 -0.046 -0.051 -0.022
Y1723 0.507 -0.159 -0.276 -0.344 -0.345 -0.289
Y1731 0.416 -0.544 -0.799** -0.918*** -0.918*** -0.839**
Y1738 -0.697* -1.979*** -1.660*** -1.806*** -1.807*** -1.719***
Y1741 -0.564 -1.618*** -1.768*** -1.919*** -1.918*** -1.820***
Y1752 -2.104*** -2.414*** -2.180*** -2.201*** -2.195*** -2.084***
Y1757 -2.903*** -3.321*** -2.846*** -2.774*** -2.774*** -2.668***
Y1762 -2.636*** -3.220*** -2.711*** -2.892*** -2.895*** -2.791***
Y1773 -3.039*** -3.489*** -3.082*** -2.943*** -2.941*** -2.833***
Constant -2.296*** -3.059*** -3.377*** -3.919*** -3.908*** -3.969***
R-squared 0.124 0.278 0.545 0.558 0.558 0.559
N 9078 9078 9078 9078 9078 9078
F statistic 58.898 111.596 139.109 297.805 277.66 262.055
NOTES: NWH = Huguenots from non-wine producing regions. WH = Huguenots from wine-producing regions. Base category: non-Huguenots and the year 1700. Wheat sown is measured in muiden, Wine in number of leauguers produced. Wheat reaped is converted to household per capita levels. Estimates are weighted by household size and significance levels are based on the use of robust standard errors.. *** denotes significance at the 1% significance level, ** at 5% and * at 10%.
27

Figure 1: Provincial origin of French Huguenots
Figure 2: Mean household per capita output of wine, 1700-1773
28

Figure 3: Approximate location of 37 Huguenot families in the Drakenstein/Franschhoek area
Source: Digital imprint, Map division: South African Library, Cape Town, 2008.
29

Figure 4: Cumulative density function, wine production, 1773
0.2
.4.6
.81
P(X
<x)
0 8 16 24 32 40
NH NWH WH
30