johannes gutenberg-university mainz fb 03: faculty of law, … · 2018-12-06 · johannes...
TRANSCRIPT
Johannes Gutenberg-University Mainz
Faculty of Law, Management and Economics
Chair of Statistics and Econometrics
Prof. Dr. Reyn van Ewijk
Johannes Gutenberg-University Mainz
FB 03: Faculty of Law, Management and Economics
Chair of Statistics and Econometrics
Prof. Dr. Reyn van Ewijk
Summer Semester 2018
PISA 2015:
The Effect of ICT Availability at Home
on Students’ Achievement Scores in Science
Submitted on: 06.08.2018
Supervisor: Marc Diederichs
Marius Orthey
Semesters in Major: 6
Major: Bachelor of Science in Economics
Table of Contents
German Summary .................................................................................................................................
List of Abbreviations .............................................................................................................................
List of Symbols ......................................................................................................................................
List of Figures ........................................................................................................................................
List of Tables .........................................................................................................................................
1. Introduction .................................................................................................................................... 1
2. Theoretical Background .................................................................................................................. 3
2.1 Overview of Current Research on the Educational Effect of Home Computers ..................... 3
2.2 Key Insight: The Research of Robert W. Fairlie and Jonathan Robinson (2013) ..................... 5
3. Methods .......................................................................................................................................... 8
3.1 PISA : The Stud ’s Basi Idea a d the Pa ti ula ities of its Data ..................................... 8
3.2 The Empirical Model .............................................................................................................. 10
3.3 The Ordinary Least Squares Assumptions ............................................................................. 12
4. Results ........................................................................................................................................... 15
4.1 Main Results: The Effect of ICT Availability at Ho e o Stude ts’ PISA S o es ................... 15
4.2 Additio al Results: Hete oge eous Effe ts Stude t’s Ge de ......................................... 17
5. Discussion...................................................................................................................................... 18
5.1 An Economic Interpretation of the Educational Effect of ICT Availability at Home .............. 18
5.2 Classification of the Obtained Results into the Context of Current Research ...................... 20
5.3 Potential Limitations of the Estimation and the Validity of the Study .................................. 21
6. Conclusion ..................................................................................................................................... 22
7. Appendix ....................................................................................................................................... 24
7.1 Figures ................................................................................................................................... 24
7.2 Tables .................................................................................................................................... 24
7.3 STATA Do-File ........................................................................................................................ 27
7.4 STATA Log-File ....................................................................................................................... 30
8. References..................................................................................................................................... 51
| August 2018
German Summary
Der technologische Fortschritt hat im Laufe der letzten Jahre zu einer entscheidenden Verbesserung
des Zugangs zu Informations- und Kommunikationstechnologien geführt (U.S. Census Bureau, 2017).
Diese Entwicklung spiegelt sich auch in zahlreichen Bildungseinrichtungen wider, die sich durch den
zunehmenden Einsatz digitaler Geräte im Schulunterricht positive Effekte auf die Leistungsfähigkeit
der Schüler erhoffen. Nichtsdestotrotz gibt es immer noch eine erhebliche digitale Kluft hinsichtlich
der Verfügbarkeit moderner Technologien entlang verschiedener Länder und Bevölkerungsgruppen
(Bulman & Fairlie, 2016).
Im Hinblick auf mögliche Leistungsunterschiede zwischen Schülern aufgrund eines mangelnden
Zugangs zu digitalen Geräten, untersucht die vorliegende empirische Arbeit daher, ob die private
Verfügbarkeit von Informations- und Kommunikationstechnologien einen signifikanten Effekt auf die
schulische Leistungsfähigkeit ausübt.
Dem aktuellen Forschungsstand nach zu urteilen, lässt sich diese Frage nicht eindeutig beantworten.
Während Heimcomputern im Rahmen von nicht-experimentellen Studien eher große und signifikant
positive Bildungseffekte beigemessen werden, liefern experimentelle Studien wesentlich kleinere und
oftmals statistisch insignifikante Ergebnisse. Diese Unterschiede sind sehr wahrscheinlich auf
Stichprobenverzerrung und diverse ausgelassene Variablen zurückzuführen (Bulman & Fairlie, 2016).
Die in dieser Arbeit durchgeführte empirische Studie knüpft an aktuelle Forschungen an und
untersucht potentielle globale Bildungseffekte durch den privaten Zugang zu digitalen Geräten. Dazu
werden die Testergebnisse von Schülern aus 42 Ländern im Fach Naturwissenschaften der PISA Studie
aus dem Jahr 2015 herangezogen. Während eine einfache lineare Regression auf einen signifikant
positiven Zusammenhang hindeutet, liefert die ökonometrische Hauptspezifikation mit mehreren
Kontrollvektoren und Länder-Dummy-Variablen einen statistisch signifikant negativen Effekt. Folglich
scheint die private Verfügbarkeit von digitalen Geräten eher in einer Ablenkung der Schüler zu
resultieren. Die erhebliche Änderung des Schätzers ist hauptsächlich darauf zurückzuführen, dass der
jeweilige Regressionskoeffizient in der Hauptspezifikation weniger stark verzerrt ist und nicht mehr
den positiven Bildungseffekt des sozioökonomischen- und kulturellen Status der Familie approximiert.
Diese Ergebnisse deuten gemeinsam mit dem zum Teil widersprüchlichen Forschungsstand darauf hin,
dass der Zugang zu Informations- und Kommunikationstechnologien vermutlich keinen stark positiven
Einfluss auf die schulische Leistungsfähigkeit bewirkt. Allerdings sind die Resultate der durchgeführten
nicht-experimentellen Studie weiterhin der Gefahr von Verzerrungen ausgesetzt, wodurch
Rückschlüsse auf kausale Zusammenhänge mit Vorsicht zu bewerten sind (Fuchs & Woessmann, 2004).
| August 2018
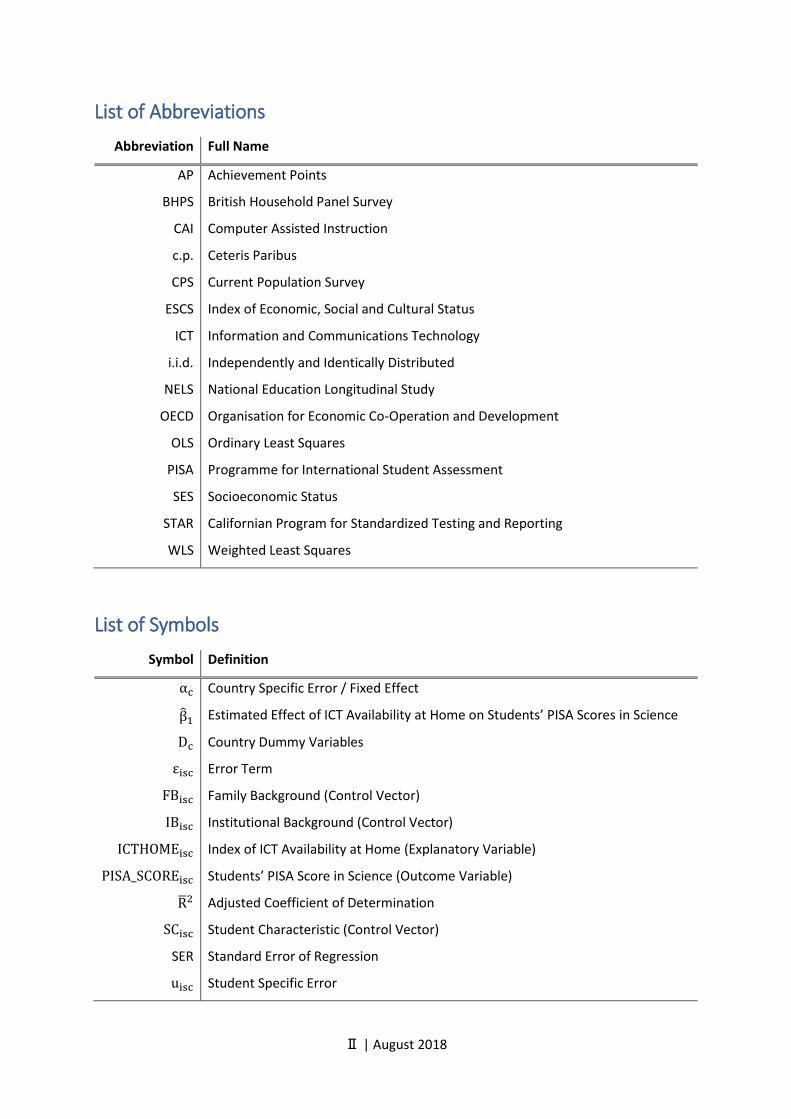
List of Abbreviations
Abbreviation Full Name
AP Achievement Points
BHPS British Household Panel Survey
CAI Computer Assisted Instruction
c.p. Ceteris Paribus
CPS Current Population Survey
ESCS Index of Economic, Social and Cultural Status
ICT Information and Communications Technology
i.i.d. Independently and Identically Distributed
NELS National Education Longitudinal Study
OECD Organisation for Economic Co-Operation and Development
OLS Ordinary Least Squares
PISA Programme for International Student Assessment
SES Socioeconomic Status
STAR Californian Program for Standardized Testing and Reporting
WLS Weighted Least Squares
List of Symbols
Symbol Definition
c Country Specific Error / Fixed Effect ̂ Estimated Effect of ICT A aila ilit at Ho e o Stude ts’ PISA S o es in Science Dc Country Dummy Variables εisc Error Term FBisc Family Background (Control Vector) IBisc Institutional Background (Control Vector) ICTHOMEisc Index of ICT Availability at Home (Explanatory Variable) PISA_SCOREisc Stude ts’ PISA S o e i S ie e Out o e Va ia le R̅ Adjusted Coefficient of Determination SCisc Student Characteristic (Control Vector)
SER Standard Error of Regression uisc Student Specific Error
| August 2018
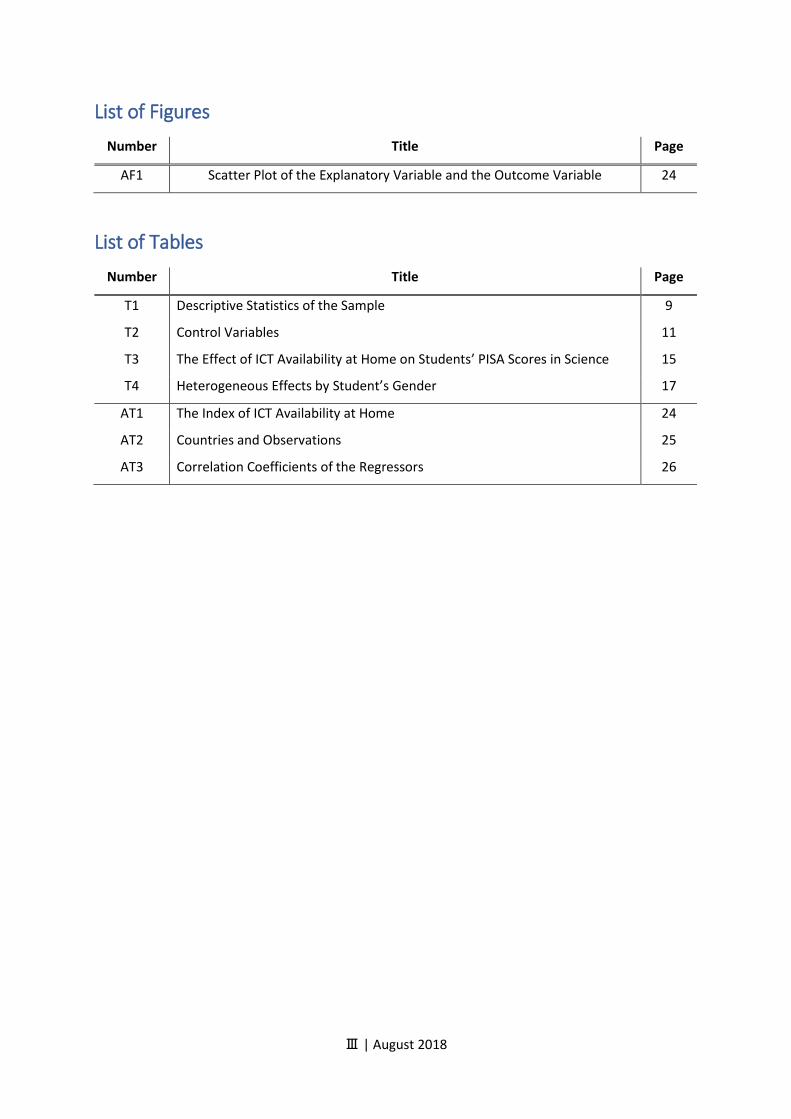
List of Figures
Number Title Page
AF1 Scatter Plot of the Explanatory Variable and the Outcome Variable 24
List of Tables
Number Title Page
T1 Descriptive Statistics of the Sample 9
T2 Control Variables 11
T3 The Effect of ICT Availability at Home on Students’ PISA Scores in Science 15
T4 Heterogeneous Effects by Stude t’s Gender 17
AT1 The Index of ICT Availability at Home 24
AT2 Countries and Observations 25
AT3 Correlation Coefficients of the Regressors 26
1 | August 2018
1. Introduction
Education and technology have always been omnipresent in economic and political discussions.
In these days, both fields might get even more important due to certain trends in our society. On the
one hand, people’s level of education is improving substantially over time, and thus it represents a
decisive key to employment on the labor market (Statistisches Bundesamt, 2017; Eurostat, 2018).
On the other hand, the te h ologi al p og ess has i p o ed people’s a ess to o pute s and the
Internet significantly over time. This creates various new opportunities, especially for the education
system (U.S. Census Bureau, 2017).
These trends have strengthened the idea of connecting both topics by using Information and
Communications Technology (ICT) as well as Computer Assisted Instruction (CAI) for educational
purposes. In general, literature distinguishes between the use of technology in classrooms and at
home. Consequently, either public institutions or private households are responsible for the
investment in technology and the control of its fields of application (Bulman & Fairlie, 2016).
The Federal Communications Commission (2018) revealed that the U.S. government increased the cap
for E-rate to $3.9 billion in the year 2015, a national funding program which offers several discounts
to schools and libraries enabling them to provide their students with ICT and CAI. Furthermore, U.S
private households with children have high rates of access to technology. 95 % of households report
having a computer and 85 % claim to have access to the Internet (U.S. Census Bureau, 2017).
Nevertheless, Bulman and Fairlie (2016) point out that the availability of ICT is unequally distributed
across countries, income levels, and ethnicities - commonly known as the digital divide. There are still
9 million U.S. schoolchildren without Internet access at home, most of them living in low-income and
minority households. Moreover, there is a huge gap between developing and developed countries with
regards to the availability of technology in general.
According to these huge investments and access rates, one could get the impression that technology
has a positive effect on educational outcomes. However, a negative effect is also conceivable as money
and time allocated to the educational use of technology might crowd out more effective educational
input factors (Bulman & Fairlie, 2016). Overall, the basic research question is whether ICT availability
has a causal effect on students’ achievements. Due to the digital divide with its large disparities in
terms of home access to technology, this paper puts the emphasis on the educational effect of ICT at
home. In this context, current literature mainly focuses on the impact of home computers.
Attewell and Battle (1999), Fuchs and Woessmann (2004) as well as Schmitt and Wadsworth (2006)
provide findings that are based on non-experimental approaches. They rather report large and
significant effects of home computers on various educational outcomes, both positive and negative.
2 | August 2018
In contrast to that, Fairlie and London (2012) as well as Fairlie and Robinson (2013) conducted
experimental studies and obtained different results. They conclude that home computers lead to small
effects or even null effects.
Based on this ambiguous state of research, this thesis is designed to contribute to a better
understanding of toda ’s edu atio al alue of technology. For this purpose, it includes an empirical
analysis that refers to the latest 2015 data from the Programme for International Student Assessment
(PISA). In detail, it examines the effect of ICT availability at home on stude ts’ a hie e e t s o es in
science. If it turns out that there is a significant positive relationship, the digital divide may contribute
to global educational inequality, and thus economists as well as politicians are requested to intervene.
Particularly with respect to the positive correlation between educational inequality and inequality in
incomes, it is crucial that students face the same opportunities to avoid an increasing gap between the
poor and the rich in the future Bul a & Fai lie, ; Rod íguez‐Pose & Tselios, 9 .
In the following, section 2 represents the theoretical part of this paper and provides an extensive
overview of current research. In particular, it gives a key insight into the randomized controlled trial of
Fairlie and Robinson (2013). Section 3 introduces the practical part of the thesis and illustrates the
framework of the empirical analysis. It describes the particularities of PISA data, explains the applied
methods of the econometric model, and discusses the underlying Ordinary Least Squares (OLS)
assumptions. Section 4 and 5 present, evaluate, and critically reflect on the obtained results, also with
respect to potential limitations of the study. Finally, the last section points out how far the current
state of research is able to give an appropriate answer to the research question. It summarizes the
main arguments, draws a conclusion for politicians as well as economists, and provides an outlook.
3 | August 2018
2. Theoretical Background
2.1 Overview of Current Research on the Educational Effect of Home Computers
Even though the field of technology has many different facets, research often focuses on the
educational effect of computer technology (Bulman & Fairlie, 2016). According to current literature,
there are positive as well as negative aspects about its educational value. Bulman and Fairlie (2016)
provide an overview: On the one hand, home computers might help to write assignments, increase
flexibility, and train students’ computer skills. On the other hand, they are criticized for potential
displacement effects when they are rather used for entertainment than for education. Consequently,
the net effect of home computers depends on the impact of several channels.
In general, there are two different empirical approaches to examine the effect of home computers on
educational outcomes. In early stages, scientists conducted non-experimental studies and focused on
developed countries. Nowadays, however, there is more literature about experimental studies with an
emphasis on developing countries (Bulman & Fairlie, 2016). The crucial difference between both
approaches is whether the allocation of home computers is endogenous or exogeneous.
In non-experimental studies, the participants self-select into access to technology. In this case, the
allocation of treatment is endogenous because the decision about the acquisition of a computer is
entirely taken by the students or rather their parents. Consequently, computer ownership depends on
certain background information, such as the family income (Fairlie & Robinson, 2013). It is quite
possible that at least some of these characteristics also affect students’ educational outcomes. For that
reason, the endogeneity of treatment increases the probability that the explanatory variable correlates
with the error term. This intensifies concerns that the estimated educational effect of home computers
is biased, which makes conclusions about causality more difficult. Fairlie and Robinson (2013) point
out solutions for this problem and suggest controlling for background characteristics on student and
family level, using instrumental variables, or implementing a fixed effects or random effects model.
In contrast to that, experimental studies address these problems in a different way. In this type of
study, students cannot self-select into access to technology since they are randomly assigned to a
treatment and a control group. Whereas the former is provided with home computers, the latter stays
unaffected and does not receive any home computers. In this case, the allocation of treatment is
exogenous as the assignment to any of the groups is beyond the decision of the participants. For that
reason, computer ownership should be independent of any background characteristics. Accordingly,
experimental studies are less vulnerable to selection bias and omitted variable bias, which makes
conclusions about causality easier (Bulman & Fairlie, 2016; Stock & Watson, 2007).
4 | August 2018
Non-experimental studies are often using data from population surveys and tend to find rather large
impacts of home computers on students’ achievements (Bulman & Fairlie, 2016). Attewell and Battle
(1999) observed educational outcomes of eighth-graders in the National Education Longitudinal Study
(NELS) of 1988. They included controls for family income and for other background information.
According to their findings, home computers have a positive effect on U.S. students’ grades and test
scores in math and reading, with larger benefits for male and white students as well as for those with
a high socioeconomic status (SES). Schmitt and Wadsworth (2006) also report significant positive
results for students aged between 16 and 18 years. Referring to the British Household Panel Survey
(BHPS) between 1991 and 2001, they conclude that prior computer ownership is associated with a
higher probability of passing exams during secondary education. These results are robust to proxies
for household wealth and other unobserved characteristics. However, Fuchs and Woessmann (2004)
estimate a significant negative effect of home computers on students’ test scores in math and reading
by using data from the first PISA study in the year 2000. They included background controls for
students, families as well as schools and implemented country fixed effects. Without taking family and
school characteristics into consideration, they examined a large positive correlation at first.
This change in the direction of the effect illustrates the impact of omitted variables and shows the
importance of appropriate controls.
Bulman and Fairlie (2016) express some thoughts about heterogeneous effects of home computers
across demographic groups and countries. On the one hand, they argue that the impact on educational
outcomes can be different for minority students since this subgroup is expected to be less familiar with
the use of computers and is likely to receive less parental support in case of any technical issues.
On the other hand, they mention that boys and girls may use computers for different purposes.
Consequently, the effect on educational outcomes might be heterogeneous across genders.
Nevertheless, the authors report that the evidence on heterogeneity is mixed and inconsistent across
studies, and thus they conclude that there is no straight answer to that question. Furthermore, they
state that scientists tend to find smaller effects of home computers in developing countries. However,
they indicate that it is hard to distinguish between differences that arise from the applied econometric
methods and actual differences in the effect between developed and developing countries.
More recent studies are based on the concept of an experimental approach. In contrast to
non-experimental specifications, these studies report rather small or even null effects of home
computers on students’ achievements (Bulman & Fairlie, 2016). Fairlie and London (2012) conducted
the first randomized controlled experiment on that field of research. The scientists observed a
community college in Northern California and conclude that home computers have a significant
positive effect on some educational outcomes. Moreover, computer technology seems to contribute
5 | August 2018
to students’ flexibility as the impact tends to be larger for students living farther away from the
campus. Nevertheless, the authors admit that the estimated effects are rather small, especially with
regards to the findings of previous non-experimental studies. For that reason, they conducted a further
analysis based on respective data from the Current Population Survey (CPS). In comparison to their
experimental results, they obtained much larger estimates. This inconsistency raises concerns that
non-experimental studies overestimate the impact of home computers, a problem that occurs due to
the endogeneity issue of treatment and may result from selection bias and omitted variable bias.
For instance, if mainly more educationally motivated families select into computer ownership, the
estimated effect of home computers on students’ achievements will be upward biased since it also
measures the impact of unobserved motivation (Fairlie & London, 2012; Bulman & Fairlie, 2016).
These concerns are strengthened by the research of Fairlie and Robinson (2013), who observed the
effect of home computers on various educational outcomes among schoolchildren.
2.2 Key Insight: The Research of Robert W. Fairlie and Jonathan Robinson (2013)
Fairlie and Robinson (2013) examined the educational effect of home computers and conducted a
randomized controlled trial, which represents the largest-ever field experiment in this area of research.
They focused on schoolchildren across 15 schools in California and collected data of 1,123 students
from class 6 to class 10. None of the participants had a computer at baseline, but 559 students - the
treatment group - were randomly provided with free home computers. The authors mention that they
did not establish any rules about what students were allowed to do with the computers, which is
crucial with regards to the impact of any potential displacement effects. Furthermore, they faced
measurement error and attrition bias by obtaining school-provided administrative data. Altogether,
Fairlie and Robinson (2013) emphasize that they focused on creating a framework that reduces the
challenge of detecting any effects at all.
In contrast to non-experimental studies, where the allocation of home computers is endogenous,
experimental approaches have the advantage that students can be rather compared with one another
because treatment is randomly and exogenously distributed. Consequently, the explanatory variable
does not depend on determinants such as parental income, and thus the estimated effect of home
computers on students’ achievements is less exposed to selection bias and omitted variable bias
(Bulman & Fairlie, 2016). However, exogeneity and independence of treatment require that the
treatment group is not systematically different to the control group (Stock & Watson, 2007). For that
reason, the scientists compared several characteristics between both groups and verified the
randomization of treatment. There is no statistically significant difference in terms of demographics,
pretreatment educational performance, and various background characteristics. The only exception to
6 | August 2018
that is that treated students are more likely to have rules for watching TV, even though this difference
is very small. Thus, there are no alarming signs that the randomization of treatment is violated.
Nevertheless, Fairlie and Robinson (2013) include several control variables to eliminate further doubts
about omitted factors that may correlate with the explanatory variable. They consider students’ age,
gender, ethnicity, grade, and certain background characteristics. In addition, they also take group
correlated errors into account by using clustered standard errors. Overall, there are no serious threats
to the internal validity of the study. According to that, the empirical specification can be assessed as
an appropriate approach to provide further evidence on the causal effect of home computers on
students’ achievements (Stock & Watson, 2007).
The paper of Fairlie and Robinson (2013) examines the treatment effect with several linear regressions.
In general, the large sample of the experiment produces small standard errors and precise estimates.
First, the authors report large positive significant effects on computer ownership and usage. In
comparison to the control group average of 4.2 hours per week, treated students spent about 6.7
hours per week on the computer. Even though this difference of 2.5 hours per week is relatively large,
there is no evidence that home computers crowd out the use of computers at school or at other
locations as there is no significant difference between the treatment and the control group in this
context. Furthermore, the study also provides some information about the reasons for computer
usage. In comparison to the control group, treated students spent more time on the computer for
completing schoolwork but also for playing video games and browsing social media websites.
Consequently, these educational as well as non-educational fields of application may support and harm
the academic value of technology at the same time. For that reason, it is possible that single positive
and negative effects will compensate each other (Fairlie & Robinson, 2013).
This thought is also reflected in the results of educational outcomes. According to the findings, there
is no significant effect of home computers on students’ grades, neither if all subjects are observed at
once, nor if the analysis is restricted to a single academic subject like math, reading, social studies, or
science. Moreover, there is also no evidence that home computers affect passing or failing a class.
Fairlie and Robinson (2013) included quantile regressions along the posttreatment grade distribution
to test if the average null effect is hiding any offsetting effects. However, this is not the case as the
estimated quantile treatment effects are insignificant throughout the whole distribution of grades.
Concerning the Californian Program for Standardized Testing and Reporting (STAR), there is also no
measurable effect of home computers on students’ test scores in English-language arts and math.
Again, there is no evidence for differential treatment effects throughout the distribution of test scores.
Overall, the authors conclude that home computers do not have a significant impact on students’
grades and test scores.
7 | August 2018
These results on students’ academic performance can be complemented by some findings that are
rather indirectly associated to educational outcomes. According to the estimates of the study, there is
no significant difference in terms of homework effort and time between the treatment and the control
group. Consequently, home computers do not seem to crowd out time spent on schoolwork. One
explanation for the absence of any displacement effects may be that students used the computers for
educational as well as non-educational purposes. Furthermore, the availability of home computers
does also not lead to a significant improvement of students’ computer skills. Altogether, these findings
for intermediate educational outcomes are consistent with the presented results of students’
academic performance.
Finally, the authors included some interaction terms to test for heterogeneity in treatment effects.
These examinations contribute to the question if the average null impact of home computers is hiding
any offsetting effects of positive and negative treatment effects. They observed the impact of
pretreatment achievement, parental supervision, propensity to use computers for non-educational
purposes, and demographic characteristics such as gender, race, and grade in school. However, they
find no changes in treatment effects that have a significant impact on students’ grades and test scores.
Overall, Fairlie and Robinson (2013) report that the availability of home computers for U.S.
schoolchildren is unlikely to affect educational outcomes considerably. Their causal explanation for the
measured null impact is that the computers were used for schoolwork as well as for entertainment,
and thus both effects might balance out. Furthermore, they mention that schools in developed
countries, such as those in the United States, record high rates of access to technology in general.
Accordingly, students living in these countries are often familiar with the use of computers. For that
reason, the negative impact of home computers through displacement effects may be restricted in this
case. Even though this interpretation fits into the context of current research, the authors express
concerns about the external validity of their study. They admit that the effect of home computers on
students’ achievements can vary across different populations. On the one hand, the results can depend
on the stage of development of a country. Malamud and Pop-Eleches (2011) observed schoolchildren
in Romania and report large negative impacts on students’ grades and time spent on homework.
According to Fairlie and Robinson (2013), this inconsistency can result from the fact that home
computers might be a distraction for students in developed countries since computer technology is
less widely distributed there. On the other hand, the results can also depend on stude ts’ educational
stage. In contrast to Californian schoolchildren, Californian college students seem to be positively
affected by home computers, as Fairlie and London (2012) show. According to these considerations,
there are serious threats to the external validity of the study, and therefore a generalization to other
populations and settings is problematic (Stock & Watson, 2007).
8 | August 2018
In conclusion, section 2 illustrates that many studies differ in terms of methods and contents.
The basic requirement to draw any causal conclusion about the educational effect of home computers
is the internal validity of a study, which is described as the key challenge and depends on the applied
econometric methods in non-experimental and experimental approaches (Fairlie & Robinson, 2013).
Additionally, the presented empirical findings seem to depend on the observed population and setting
as well, which is a central problem for the external validity of a study (Stock & Watson, 2007).
Overall, these differences limit the comparability between studies and lead into an ambiguous current
state of research with various and inconsistent findings. Consequently, further research is
indispensable to get a better understanding of the true educational value of technology.
3. Methods
The following observational study aims to extend the current state of research and provides new
evidence on the educational value of technology. The empirical analysis is based on cross-sectional
data from PISA 2015 and examines the effect of ICT availability at home on students’ achievement
scores in science. Before the econometric model is presented and discussed in detail, the following
section provides fundamental pieces of information about the PISA database at first.
3.1 PISA 5: The Study’s Basic Idea and the Particularities of its Data
The Programme for International Student Assessment, familiarly known as PISA, was founded by
the Organisation for Economic Co-Operation and Development (OECD) in the year 2000.
The study is conducted every three years and assesses the academic performance of 15-year-old
students from all over the world in the main subjects of science, reading, and math (OECD, 2017).
One of the greatest attributes of PISA is the standardization of the assessment, which allows an
international comparison between the performance of school systems. Even though PISA cannot draw
any causal conclusions between education policy and academic achievements, it provides promising
insights into different schools, institutions, and education systems. On the one hand, the study reveals
similarities and differences in the educational structures between high-performing and
low-performing countries. On the other hand, it can show disturbing trends in the development of
students’ academic performance across countries and demographic groups. Policy makers can use all
of this information to identify the strengths and weaknesses of different education systems, which
might be beneficial for the implementation of effective policy interventions in the future (OECD, 2018).
The latest assessment of PISA in 2015 put the emphasis on science and involved about
540,000 participating students from 35 OECD countries and 37 partner countries (OECD, 2017).
First, the participants completed a two-hour computer-based test. In addition, students and schools
9 | August 2018
were provided with PISA background questionnaires that obtained individual information about the
students and their families, the learning environment, and the school systems. Some countries have
also implemented further questionnaires, including a survey about students’ familiarity with ICT
(OECD, 2018). Altogether, PISA does not only report on academic performance but also provides
extensive background information about students, families, and schools. For that reason, it represents
a suitable database for the empirical analysis of the educational value of technology.
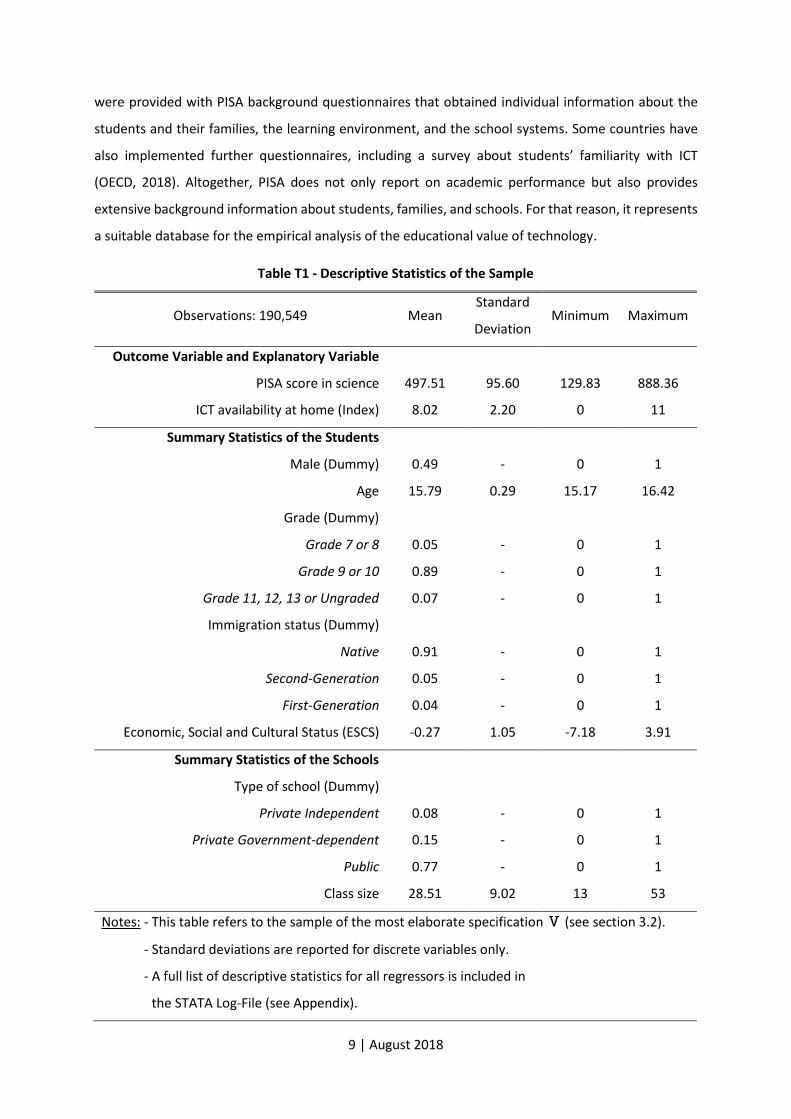
Table T1 - Descriptive Statistics of the Sample
Observations: 190,549 Mean Standard
Deviation Minimum Maximum
Outcome Variable and Explanatory Variable
PISA score in science 497.51 95.60 129.83 888.36
ICT availability at home (Index) 8.02 2.20 0 11
Summary Statistics of the Students
Male (Dummy) 0.49 - 0 1
Age 15.79 0.29 15.17 16.42
Grade (Dummy)
Grade 7 or 8 0.05 - 0 1
Grade 9 or 10 0.89 - 0 1
Grade 11, 12, 13 or Ungraded 0.07 - 0 1
Immigration status (Dummy)
Native 0.91 - 0 1
Second-Generation 0.05 - 0 1
First-Generation 0.04 - 0 1
Economic, Social and Cultural Status (ESCS) -0.27 1.05 -7.18 3.91
Summary Statistics of the Schools
Type of school (Dummy)
Private Independent 0.08 - 0 1
Private Government-dependent 0.15 - 0 1
Public 0.77 - 0 1
Class size 28.51 9.02 13 53
Notes: - This table refers to the sample of the most elaborate specification (see section 3.2).
Notes: - Standard deviations are reported for discrete variables only.
Notes: - A full list of descriptive statistics for all regressors is included in
Notes: - the STATA Log-File (see Appendix).
10 | August 2018
Table T1 presents descriptive statistics of the sample that is used for the empirical analysis.
On average, 91 % of students have no migration background and roughly 77 % attend public schools.
The sample mean of -0.27 implies that the economic, social and cultural status (ESCS) is on average
slightly lower in comparison to an average OECD student, who would have an index value of 0
(OECD, 2017). Note that section 3.3 gives further information about the components of ESCS.
In general, the participants report high levels of ICT availability at home. The respective index is based
on a question of the ICT survey that listed a total number of 11 digital devices. Students were supposed
to select those that are available for them to use at home. The mean value shows that students have
on average access to 8 out of 11 devices. Appendix Table AT1 provides a full list of all considered digital
devices including the rates of availability at home. According to the PISA score in science, students
reach on average 497.51 achievement points (AP), whereas the standard deviation equals 95.60 AP.
In contrast to the complete database of the PISA study, the sample in this paper comprises a smaller
number of observations, which is related to the problem of missing values. First, some students,
parents, or schools have not filled out their survey completely. Furthermore, optional questionnaires,
including the ICT survey, were not distributed in each participating country (OECD, 2018). Instead of
applying data imputation, the analysis is restricted to those students who have no missing values on
variables that are included in the empirical model. Moreover, countries which report only a few
remaining observations were also not considered in the estimation. Appendix Table AT2 provides
further information about that and lists the included countries and their number of participants.
However, Fuchs and Woessmann (2004) appeal against dropping observations because it has the
disadvantage of losing information about the explanatory variable and reduces the sample size.
In addition, it would lead to selection bias if the reason for dropping out of the sample is part of the
error term and correlates with the explanatory variable (Stock & Watson, 2007). Consequently, the
usage of a restricted sample increases the importance of appropriate background control variables.
3.2 The Empirical Model
Bulman and Fairlie (2016) criticize that many studies restrict the educational effect of technology to
computers. According to the technological progress and toda ’s variety of digital devices such as
smartphones and tablet computers, this limitation may be out of date. For that reason, the analysis in
this thesis puts the emphasis on the availability of ICT at home in general. PISA_SCOREisc = + ICTHOMEisc + SCisc + FBisc + IBisc + γc− Dc− + εisc The empirical model considers 190,549 students i aged between 15 and 16 years across different
schools s in a total of 42 countries c. Based on an OLS-regression, it explains students’ PISA scores in
science (outcome variable) with the index of ICT availability at home (explanatory variable).

11 | August 2018
In contrast to studies that are limited to certain regions, this specification considers a large number of
countries. Consequently, the empirical model follows the approach of Fuchs and Woessmann (2004)
and is designed to draw conclusions about the global mean effect of technology on the academic
performance of students. This international orientation of the specification is associated with
advantages and disadvantages. On the one hand, the approach can provide evidence on the general
direction and magnitude of the effect. According to the inconsistent findings of previous literature, this
may contribute to a better basic understanding of the educational value of technology. On the other
hand, a general mean effect implies that the impact is assumed to be the same for all countries, all
schools, and all students (Fuchs & Woessmann, 2004). Even though there is no clear evidence on
heterogenous effects, it is possible that the impact is different across certain countries or groups
(Bulman & Fairlie, 2016). Consequently, conclusions about the global mean effect might be limited.
There is a key challenge that occurs with the usage of PISA data, especially with regards to the internal
validity of the empirical model. Since the analysis is based on the concept of a non-experimental study,
the explanatory variable is endogenously determined by the participants. For that reason, there are
serious concerns about selection bias and omitted variable bias, which are addressed with the inclusion
of different control vectors and country fixed effects (Bulman & Fairlie, 2016).
Table T2 presents a full list of the included control variables. The most elaborate specification
considers 3 variables for student characteristic SCisc, 3 variables for family background FBisc,
5 variables for institutional background IBisc, and 41 country dummy variables Dc for fixed effects.
In this context, the empirical model is similar to the approach of Fuchs and Woessmann (2004).
Table T2 - Control Variables
Student Characteristic SC Family Background FB Institutional Background IB
Gender (ST)
Age (ST)
Grade (ST)
Immigration status (ST)
Economic, Social
and Cultural Status (ST)
Stude t’s oti atio
in science (ST) *
Type of school (SC)
Class size (SC)
Shortage of educational staff (SC) *
Proportion of science teachers
fully certified (SC)
Science-specific resources (SC)
Notes: * These variables were scaled with the IRT scaling model of PISA (OECD, 2017).
Source: ST - PISA Student Questionnaire SC - PISA School Questionnaire
The next subsection provides justification for the structure of the presented empirical model.
It explains the inclusion of the control variables and discusses each OLS-Assumption in detail.
12 | August 2018
3.3 The Ordinary Least Squares Assumptions
The key challenge for the model is to isolate the true educational effect of ICT availability at home.
However, the empirical specification can only make conclusions about causality possible if the applied
econometric methods meet the requirements of the OLS-Assumptions (Fairlie & Robinson, 2013).
In general, the usage of observational data from PISA is associated with the endogeneity problem of
the explanatory variable. Due to self-selection of students into ICT ownership, the assignment to
treatment is non-random. This is a serious threat to OLS-Assumption 1 as it raises concerns of
selection bias and omitted variable bias due to a correlation between the explanatory variable and the
error term (Bulman & Fairlie, 2016). Accordingly, it is crucial to identify omitted determinants of PISA
outcomes that also affect ICT ownership at the same time. In this context, the empirical specification
applies two econometric methods to provide a solution for the violation of OLS-Assumption 1:
1.) control variables and 2.) group fixed effects.
First, the control vector SC includes the basic variables of stude t’s gender, age, and grade.
For instance, it is conceivable that boys and girls achieve different PISA scores in science because male
students may have a more positive attitude towards scientific topics (Weinburgh, 1995). In addition,
the availability of ICT at home is expected to be gender-specific as well because boys often show a
higher interest in computer technology (Volman et al., 2005). Moreover, stude t’s age can also be a
relevant factor to control for. On the one hand, an extra year of life probably increases cognitive skills
and abilities, which positively affect the academic performance of students. On the other hand, older
students might face less parental rules in terms of ICT usage, which could result in a larger number of
available digital devices at home. Furthermore, it is assumed that PISA participants in higher grades
show an improved test performance since they are likely to benefit from additional years of schooling.
At the same time, these students might also have better access to ICT at home due to a potential
greater need for school-related Internet research in higher grades.
Next, the control vector FB adds family background information. This vector is expected to be crucial
as 15-year-old PISA participants are still under parental supervision. Therefore, students’ parents play
a decisive role in terms of the buying decision of ICT. Fairlie and Robinson (2013) point out that it is
indispensable to understand the motives that only some households invest in technology. They
suppose that budget constraints are one of the main reasons for the lack of investments in ICT.
Consequently, family wealth and its determinants, such as parental education and parental
occupation, correlate with the explanatory variable. In addition, Fuchs and Woessmann (2004) argue
that these factors also determine PISA achievements because they affect the educational resources of
students’ learning environment.
13 | August 2018
For that reason, the empirical model includes the PISA index of economic, social and cultural status
(ESCS). This is a powerful control variable because it considers not only the education and occupation
of parents but also household possessions as a proxy for family wealth (OECD, 2017). Moreover,
the specification controls for the immigration status of families as well. In this context, it is conceivable
that different cultures shape people’s attitude towards education and modern technology.
Consequently, native students might fundamentally differ to immigrants in several characteristics that
determine their academic performance and access to digital devices at home. Furthermore,
Bul a a d Fai lie aise o e s that fa ilies’ edu atio al oti atio might not only correlate
with stude ts’ PISA achievements but also affect the decision on investments in technology.
For instance, it is plausible that motivated and ambitious students convince their parents to purchase
a computer for educational purposes. Accordingly, the empirical model addresses this potential source
of bias and includes a o t ol a ia le that easu es stude t’s oti atio i s ie e.
Overall, it is expected that the inclusion of controls for the family background reduces the estimated
educational effect of ICT significantly. In the absence of this vector, the estimation is supposed to be
upward biased because the coefficient of ICT availability at home probably measures the expected
positive effects of a high ESCS on top.
Finally, the control vector IB complements with information about the institutional background. This
set of controls intends to describe and characterize the participating schools and refers to the thoughts
of Fuchs and Woessmann (2004), who suspect that certain students might systematically select into
certain schools. As the institutional background is likely to affect the academic performance in PISA,
this phenomenon would imply a correlation between the explanatory variable and the error term.
In principle, the model controls for different school types and distinguishes between private and public
institutions. Furthermore, it considers class size and information about shortage of educational staff
that both approximate for school wealth. Last, the proportion of science teachers fully certified and
information about science-specific resources provide an insight into the quality of instruction.
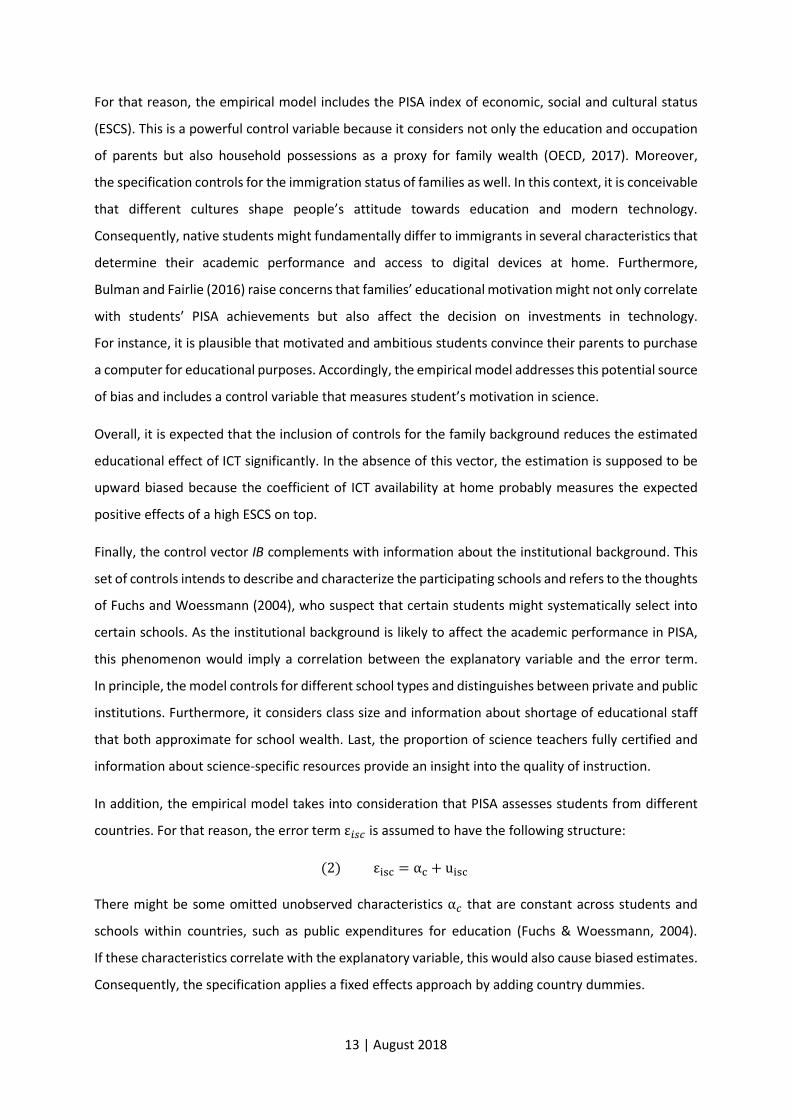
In addition, the empirical model takes into consideration that PISA assesses students from different
countries. For that reason, the error term ε𝑖𝑠𝑐 is assumed to have the following structure: εisc = c + uisc There might be some omitted unobserved characteristics 𝑐 that are constant across students and
schools within countries, such as public expenditures for education (Fuchs & Woessmann, 2004).
If these characteristics correlate with the explanatory variable, this would also cause biased estimates.
Consequently, the specification applies a fixed effects approach by adding country dummies.

14 | August 2018
Concerning OLS-Assumption 2, the sampling of PISA requires the usage of clustered standard errors.
PISA scores of students within the same school are not independently and identically distributed (i.i.d.)
since the participants share various unobserved school characteristics, for example the same teachers.
Accordingly, students’ error terms are expected to be correlated within but not across schools and the
hypothesis testing is based on clustered standard errors at school level.
OLS-Assumption 3 requires that large outliers of the explanatory variable and the outcome variable
are unlikely. The index of ICT availability at home as well as stude ts’ PISA scores have a finite range
and finite kurtosis by definition (Stock & Watson, 2007). This implies that large outliers can only appear
due to measurement errors. However, Appendix Figure AF1 shows that there is no evidence for that.
Finally, OLS-Assumption 4 excludes perfect multicollinearity of the regressors. As the structure of the
included variables has been studied carefully, it can be ruled out that one regressor is a perfect linear
combination of other regressors. Nevertheless, imperfect multicollinearity should also be avoided
because it leads to imprecise estimates with large standard errors (Stock & Watson, 2007).
Appendix Table AT3 illustrates that the correlation between the regressors is mainly at a low level.
Thus, there are no serious threats to multicollinearity.
In conclusion, section 3 demonstrates that the applied econometric methods face the challenges
of observational PISA data. The basic problem of the non-experimental approach is that the
explanatory variable, the index of ICT availability at home, is endogenously determined by the
participants. The endogeneity of treatment leads to serious concerns about biased estimates as ICT
availability correlates with certain characteristics. The fact that students attend different schools in
various countries additionally extends the number of relevant factors. Accordingly, the empirical
model includes several background control variables and applies country fixed effects.
Even though the OLS-Assumptions are considered carefully, it cannot be ensured that there are no
further relevant omitted variables. For that reason, the estimator ̂ is not necessarily unbiased,
consistent, and asymptotically normally distributed around the true value.
15 | August 2018
4. Results
This section presents the obtained results on the educational effect of ICT availability at home.
The first subsection puts the emphasis on the estimated coefficient across different specifications.
It illustrates how the successive inclusion of control vectors changes the direction and magnitude of
the estimate. The second subsection provides some evidence on heterogeneity and points out whether
ICT availability at home has a different educational effect across the population of boys and girls.
4.1 Main Results: The Effect of ICT Availability at Home on Students’ PISA Scores
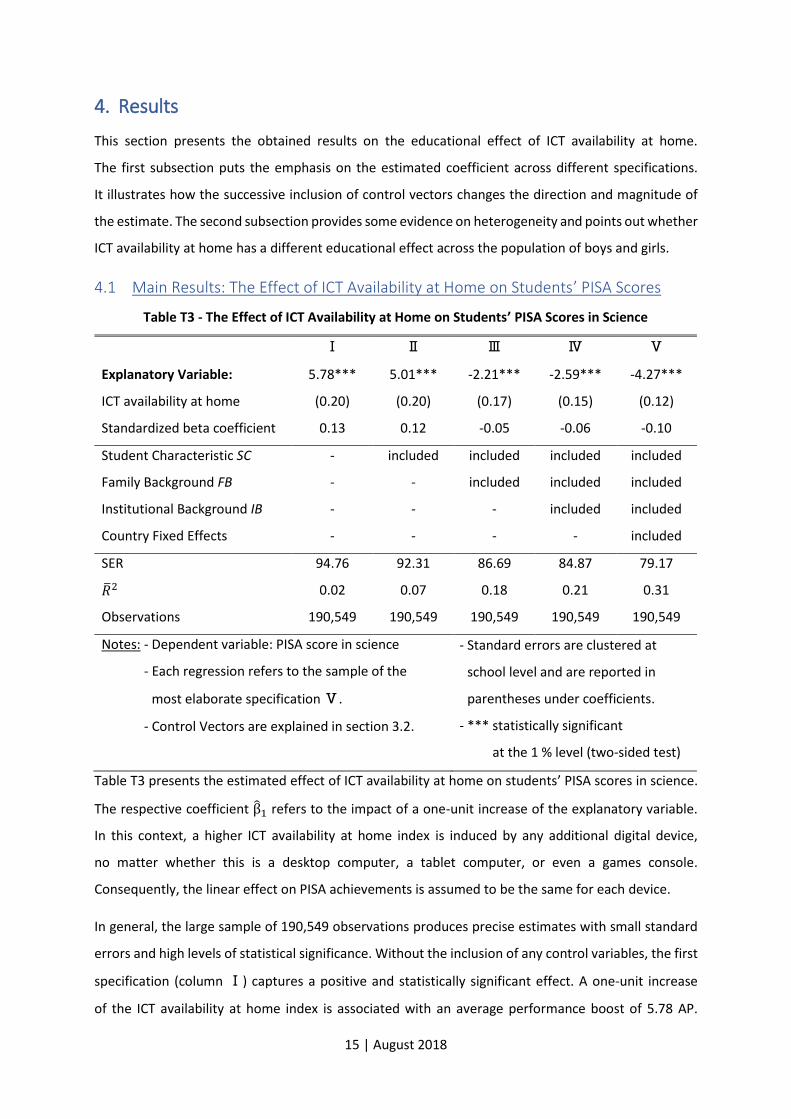
Table T3 - The Effect of ICT Availability at Home on Students’ PISA Scores in Science
Explanatory Variable:
ICT availability at home
5.78***
(0.20)
5.01***
(0.20)
-2.21***
(0.17)
-2.59***
(0.15)
-4.27***
(0.12)
Standardized beta coefficient 0.13 0.12 -0.05 -0.06 -0.10
Student Characteristic SC - included included included included
Family Background FB - - included included included
Institutional Background IB - - - included included
Country Fixed Effects - - - - included
SER 94.76 92.31 86.69 84.87 79.17 �̅� 0.02 0.07 0.18 0.21 0.31
Observations 190,549 190,549 190,549 190,549 190,549
Notes: - Dependent variable: PISA score in science
Notes: - Each regression refers to the sample of the
Notes: - most elaborate specification .
Notes: - Control Vectors are explained in section 3.2.
- Standard errors are clustered at
- school level and are reported in
- parentheses under coefficients.
- *** statistically significant
- *** at the 1 % level (two-sided test)
Table T3 presents the estimated effect of ICT availability at home on students’ PISA scores in science.
The respective coefficient ̂ refers to the impact of a one-unit increase of the explanatory variable.
In this context, a higher ICT availability at home index is induced by any additional digital device,
no matter whether this is a desktop computer, a tablet computer, or even a games console.
Consequently, the linear effect on PISA achievements is assumed to be the same for each device.
In general, the large sample of 190,549 observations produces precise estimates with small standard
errors and high levels of statistical significance. Without the inclusion of any control variables, the first
specification (column ) captures a positive and statistically significant effect. A one-unit increase
of the ICT availability at home index is associated with an average performance boost of 5.78 AP.
16 | August 2018
This implies that students with more electronic devices are expected to have higher PISA scores in
science. Taking into consideration that average students have access to approximately 8 digital
devices, they are expected to perform about 46.38 AP better than students without any ICT at home.
In comparison, the average performance difference between ninth-graders (unconditional mean of
485.05 AP) and tenth-graders (unconditional mean of 511.51 AP) is much lower and equals about
26.45 AP only (see Appendix - STATA Log-File).
The second specification (column ) introduces the control vector for student characteristic and
includes the basic controls for gender, age, and grade. This leads to a slightly smaller but still positive
and statistically significant educational effect of ICT availability at home (5.01 AP). In contrast to this
minor change, the control vector for family background (column ), including information about the
economic, social and cultural status, affects the estimation substantially. This specification does not
only reduce the coefficient ̂ by about 7.22 AP but also changes the direction of the effect from a
positive to a negative sign. Each additional digital device that is available for students to use at home
is related to an average decline in PISA scores by 2.21 AP ceteris paribus (c.p.). The integration of the
control vector for the institutional background (column ) supports this result and further decreases
the estimated effect down to -2.59 AP. The final and most elaborate specification (column ) adds
country fixed effects to the analysis. As in the regressions before, the effect is still statistically
significant at the 1 % level. The estimated coefficient implies that a one-unit increase of the ICT
availability at home index is associated with a lower PISA performance of 4.27 AP on average c.p.
Accordingly, students with an average endowment of 8 digital devices are expected to perform about
34.27 AP worse than students without any ICT at home c.p. In this case, the performance difference is
again larger than a whole grade difference.
Regarding the goodness of fit, the inclusion of control vectors increases the adjusted coefficient of
determination (�̅� and decreases the standard error of regression (SER). Whereas the first
specification with one regressor only explains roughly 2 % of the variance of PISA scores, the regressors
in the most elaborate specification can almost explain one third of the total variation. Nevertheless,
the fifth specification indicates that the SER is only about 16.43 AP smaller than the standard deviation
of the dependent variable.
Overall, the comparison between different specifications shows that the estimated effect of ICT
availability at home on students’ PISA scores in science changes in a consistent pattern. The successive
inclusion of control vectors turns an initial significant positive effect of 5.78 AP (specification ) into
a significant negative effect of -4.27 AP (specification ).
17 | August 2018
4.2 Additional Results: Heterogeneous Effects by Student’s Gender
Section 3.2 has already pointed out that the empirical model assumes a global educational mean effect
of ICT availability at home. However, it is conceivable that the estimated impact is not constant and
hides heterogeneous effects across countries, schools, and students. For that reason, this subsection
raises the awareness of this potential limitation and conducts an exemplary heterogeneity check.
According to the research of Weinburgh (1995) and Volman et al. (2005), boys and girls have different
attitudes towards the subject of science and show different interests in digital devices. For that reason,
the educational effect of technology may be gender-specific as well.
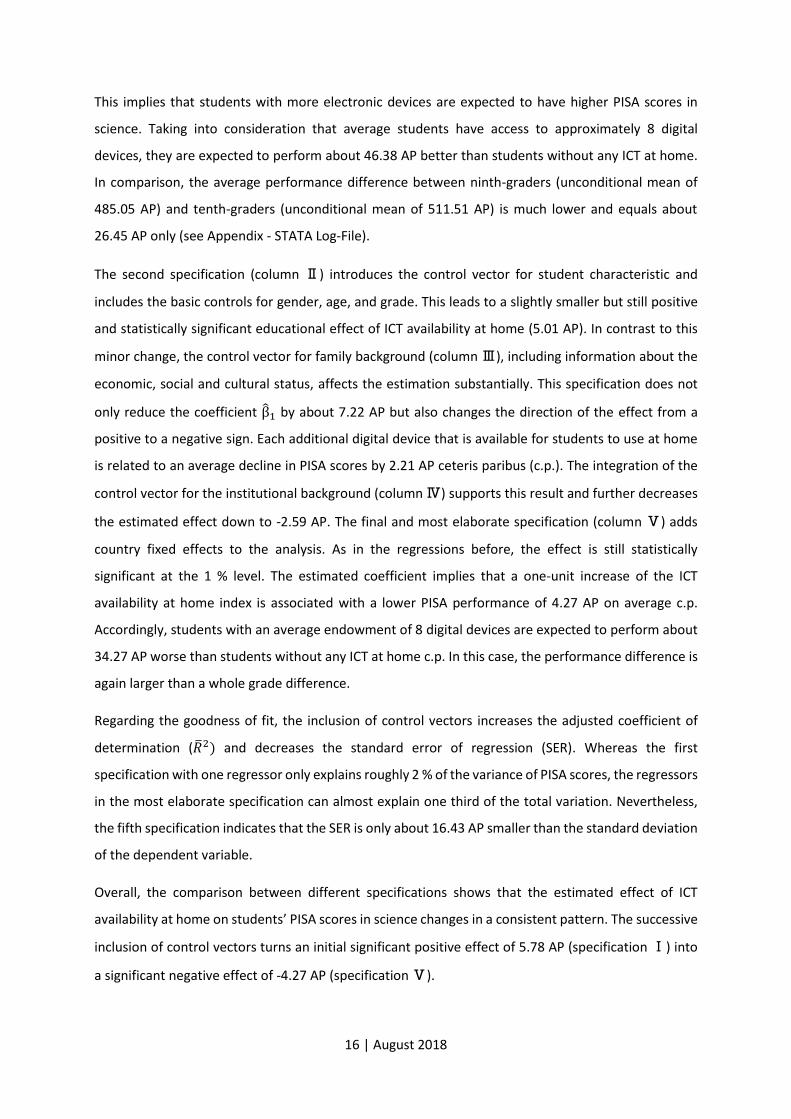
Table T4 – Heterogeneous Effects by Student’s Gender
Explanatory Variable:
ICT availability at home
Control Dummy Variable:
Male
-3.09***
(0.15)
29.48***
(1.52)
Interaction Term:
ICT availability at home x male
-2.33***
(0.18)
Educational effect of ICT availability at home for girls (Male = 0) -3.09***
(0.15)
Educational effect of ICT availability at home for boys (Male = 1) -5.42***
(0.16)
F-Test
Coefficient of ICT availability at home = 0
Coefficient of ICT availability at home x male = 0
644.18***
Observations 190,549
Notes: - Dependent variable: PISA score in science
Notes: - This regression includes the controls of the
Notes: - most elaborate specification .
- Standard errors are clustered at
- school level and are reported in
- parentheses under coefficients.
- *** statistically significant
- *** at the 1 % level (two-sided test)
Table T4 presents gender differences in the impact of ICT availability at home on students’ PISA scores
in science. The regression allows heterogeneous effects by the inclusion of an interaction term
between the explanatory variable and the o t ol du a ia le fo stude t’s ge de . I ge e al, all
reported estimates are statistically significant at the 1 % level.
18 | August 2018
For girls, the estimated coefficient implies that a one-unit increase of the ICT availability at home index
is associated with an average performance decrease of 3.09 AP c.p. Thus, the expected performance
difference between girls with an average endowment of 8 digital devices and girls without any ICT at
home equals about -24.78 AP c.p. For boys, a one-unit increase of the explanatory variable is related
to an average performance decrease of 5.42 AP c.p. In this case, the expected performance difference
between boys with an average endowment of 8 digital devices and boys without any ICT at home is
much larger and equals about -43.47 AP c.p. Moreover, the interaction term indicates that boys, in
comparison to girls, suffer an expected additional performance loss of 2.33 AP for each added digital
device c.p. Accordingly, an average endowment of 8 devices enlarges the additional gender-specific
effect of ICT availability at home to -18.69 AP c.p. This corresponds to more than half of the PISA
achievement gap between ninth-graders and tenth-graders.
The presented figures show that the educational effect of ICT availability at home is not constant across
the population of boys and girls. Male students face a significant larger performance loss in PISA scores
than female students. However, the main specification in section 4.1 does not reveal that and hides
these heterogeneous effects behind a mean coefficient that lies in between both gender-specific
coefficients.
5. Discussion
The following section focuses on the evaluation, discussion, and classification of the presented results.
It includes an economic interpretation of the estimated educational effect of ICT availability at home
and classifies the empirical findings into the context of current research. Finally, it reveals potential
limitations of the estimation and assesses the internal and external validity of the study.
5.1 An Economic Interpretation of the Educational Effect of ICT Availability at Home
Without the consideration of any control variables, specification captures a positive relationship
between the availability of ICT at home and students’ PISA achievements (̂ = 5.78). However, this
estimation is very likely to be biased because there are many omitted variables that correlate with the
explanatory variable and the outcome variable. According to the adjusted coefficient of determination,
there are plenty of other relevant factors left that determine students’ PISA scores ( �̅� = 0.02).
Specification adds the control vector for student characteristic and reduces the estimated
coefficient (̂ = 5.01). This suggests that specification is slightly upward biased and overestimates
the educational effect of ICT availability at home. Accordingly, the controls fo stude t’s ge de , age,
and grade are supposed to be weakly positively correlated with the ICT index and PISA scores.
In this context, Appendix Table AT3 can confirm small positive correlations for gender and age.
19 | August 2018
Specification includes control variables for the family background. As expected, this vector has a
huge influence on the regression coefficient and reverses the sign of the estimated effect (̂ = -2.21).
This large change results from the inclusion of the PISA index of economic, social and cultural status.
Appendix Table AT3 shows that ESCS is moderately positively correlated with the ICT availability index
(correlation of 0.45) as well as with stude ts’ PISA scores (correlation of 0.38). Accordingly,
well-educated and wealthy families tend to provide their students with more digital devices since they
face less budget constraints for investments in technology (Fairlie & Robinson, 2013). Moreover, these
families may also provide a better learning environment for their students through high quality
educational resources, such as parental home instruction and large stocks of textbooks, which would
explain the positive effect on academic achievements (Fuchs & Woessmann, 2004). Consequently, the
exclusion of the family background control vector in specification and leads to strongly upward
biased estimates. In both regressions, the educational effect of ICT availability at home includes the
large positive impact of fa ilies’ economic, social and cultural status o stude ts’ achievements. For
that reason, specification removes a crucial source of bias and represents a much better approach.
This is also reflected in a larger share of explained variation in students’ PISA scores (�̅� = 0.18).
The inclusion of the control vector for the institutional background in specification supports the
downward trend and further reduces the estimated coefficient (̂ = -2.59). This provides some
evidence on the suspected systematic selection of certain students into certain schools
(Fuchs & Woessmann, 2004). As a matter of fact, PISA participants with higher ICT availabilities at
home are more likely to attend schools with positive characteristics, such as small classes, well-trained
teachers, and extensive educational resources for instruction (see Appendix Table AT3).
The most elaborate specification adds country fixed effects and enlarges the negative estimated
educational impact of ICT availability at home (̂ = -4.27). This is an indication of constant unobserved
characteristics across students and schools within countries that are positively correlated with the
outcome variable and the explanatory variable. For instance, some countries might spend more money
o edu atio to i ease the ualit of stude ts’ lea i g e i o e t a d to improve their academic
performance (Fuchs & Woessmann, 2004). At the same time, these countries are expected to have a
high development status that allows a widely distributed access to ICT at low cost. The large increase
of �̅� to 0.31 suggests that this app oa h e plai s stude ts’ PISA achievements the best.
The final estimate associates a one-unit increase of the ICT availability at home index with a decline in
stude ts’ PISA performance by 4.27 AP on average c.p. Even though this effect is statistically significant
at the 1 % level, it is rather insignificant from an economic point of view. An increase of the explanatory
variable by one standard deviation reduces the outcome variable by 0.10 standard deviations only.
20 | August 2018
However, a comparison between PISA participants with access to the sample mean of 8 digital devices
and PISA participants without any access to ICT at home shows a relatively large impact of -34.27 AP
on average c.p. According to the expected performance difference of about 26.45 AP between
ninth-graders and tenth-graders, the magnitude of this aggregated effect is more than 1.25 times the
size of the achievement gap between both grades.
According to Bulman and Fairlie (2016), negative relationships et ee ICT a d stude ts’ a hie e e t
imply that displacement and distraction effects of technology exceed any potential educational
benefits. In this context, there might be the tendency among the observed PISA participants to use the
available digital devices rather for entertaining than for educational purposes. However, it requires
further information about stude ts’ usage behavior of ICT to support this interpretation. Moreover,
the heterogeneity check for gender differences provides some evidence that male students face a
significant additional performance loss for each electronic device (-2.33 AP). This suggests that boys
might work with ICT more often, especially in terms of any non-educational fields of application.
The research of Volman et al. (2005) supports this explanation, indicating that male students show a
higher frequency of home computer usage and a higher propensity for playing video games.
5.2 Classification of the Obtained Results into the Context of Current Research
The obtained results represent an extension of the current state of research on the educational value
of technology. In contrast to the studies of the introduced literature, the empirical analysis in this thesis
does not focus on home computers only but considers the availability of ICT at home in general.
Nevertheless, note that this difference might limit the comparability of the findings.
Attewell and Battle (1999) as well as Schmitt and Wadsworth (2006) indicate that home computers
have a positive effect o stude ts’ g ades, test s o es, and pass rates. In contrast to that, the obtained
results in this paper illustrate a negative educational relationship between ICT availability at home and
stude ts’ PISA s o es in science. According to the revealed gender differences, Attewell and Battle
(1999) also agree that technology is assumed to have a stronger influence on the academic
performance of male students.
Fuchs and Woessmann (2004) capture a significant egati e effe t of ho e o pute s o stude ts’
PISA scores in math and reading, which is in line with the obtained pattern of results in this thesis.
Without the inclusion of any control variables, the scientists also find a significant positive relationship
in the first place. Since both studies refer to observational data from PISA, they are comparable in
terms of the applied econometric methods as well as the studied population and setting.
Consequently, the revealed similarity to the results of Fuchs and Woessmann (2004) can provide weak
evidence for the external validity of the observational study conducted in this paper.
21 | August 2018
Even though this thesis agrees with other non-experimental studies and suggests that technology
might has a significant educational effect, the presented results are also inconsistent with the
experimental approaches of Fairlie and London (2012) as well as Fairlie and Robinson (2013), who find
rather small or null effects of home computers on several educational outcomes. These inconsistencies
with experimental evidence raise concerns that the obtained results in this paper may be overstated.
5.3 Potential Limitations of the Estimation and the Validity of the Study
The empirical specification assumes that the estimated educational effect of ICT availability at home
is the same across countries, schools, and students. Consequently, conclusions can be drawn about
global mean effects only. However, the presented heterogeneity check in section 4.2 provides some
evidence that the estimation is at least not constant across the population of boys and girls.
Even though Bulman and Fairlie (2016) summarize that current literature does not provide clear
evidence on heterogeneity, there are concerns of further heterogeneous effects. Nevertheless,
additional research is needed on that matter to verify the limitations of an international approach.
Moreover, the applied OLS-regression is based on a sample that includes 42 countries with unequal
numbers of observations (see Appendix Table AT2). This disproportion may result in the problem that
some countries have a greater influence on the estimation because they contribute more students to
the sample than others. For that reason, statements about global mean effects may be further limited.
A Weighted Least Squares (WLS) regression, which is used in the approach of Fuchs and Woessmann
(2004), allows country weighting and could be a solution for this potential limitation.
The index of ICT availability at home considers a large variety of different devices and serves to provide
information about the educational effect of technology on a general level (see Appendix Table AT1).
However, the estimated regression coefficient captures only the mean impact of each additional digital
device. For instance, a one-unit increase of the index can be induced by a computer or a games console
but also by a USB stick or a printer. Accordingly, the empirical model assumes that all devices have the
same effect o stude ts’ PISA s o es. This is a strong assumption and likely to be violated as, for
example, computers allow a more extensive educational use than games consoles.
For that reason, the results fail to explain which digital de i es te d to affe t stude ts’ PISA s o es
rather positively or negatively. In addition, note that the estimation does also not distinguish between
the mere availability of ICT and the actual frequency of ICT usage, which is supposed to affect the
findings as well.
The main limitation refers to the problem of endogeneity in non-experimental approaches.
Even though the most elaborate specification controls for various background characteristics and
applies country fixed effects, the values of �̅� and SER indicate a remaining large share of unexplained
22 | August 2018
variation in PISA scores accompanied by a relatively large spread around the regression line. This raises
concerns of further omitted variables that may correlate with the explanatory variable. For instance,
it is conceivable that ot o l stude ts’ ut also pa e ts’ edu atio al oti atio has an effect on PISA
achievements. If parental enthusiasm also determines investments in ICT, the estimated coefficient is
biased and loses all its desirable properties.
According to these different limitations, the presented results should be interpreted with caution.
On the one hand, the possibility of remaining omitted variables and biased estimates causes serious
threats to the internal validity of the study. Thus, even the best specification does not necessarily
allow causal conclusions between ICT availability at ho e a d stude ts’ PISA a hie e e ts
(Fuchs & Woessmann, 2004). On the other hand, there are also justified concerns regarding the
external validity of the study. As the introduced ambiguous state of research shows, the empirical
findings seem to depend substantially on the studied population and setting. Consequently, the
generalizability of the obtained results is expected to be very limited.
6. Conclusion
Altogether, this paper is designed to improve the general understanding of toda ’s edu atio al alue
of technology and examines the effect of ICT availability at home o stude ts’ a hie e e ts.
According to the ambiguous current state of research, there is no consistent answer to this issue.
Non-experimental studies tend to find rather large and statistically significant effects.
Attewell and Battle (1999) as well as Schmitt and Wadsworth (2006) report positive impacts of home
computers on students’ g ades, test s o es, and pass rates. In contrast, Fuchs and Woessmann (2004)
estimate a signifi a t egati e elatio ship et ee ho e o pute s a d stude ts’ PISA scores.
Experimental studies capture rather small and statistically insignificant effects, suggesting that
non-experimental findings may be biased and overstated (Bulman & Fairlie, 2016). These concerns are
supported by Fairlie and Robinson (2013), who conducted a randomized controlled trial and provided
Californian schoolchildren with free home computers. The scientists report null impacts on various
educational outcomes and argue that positive as well as negative effects might compensate each other
due to stude ts’ balanced usage behavior of computers for educational and entertaining purposes.
The observational study in this thesis represents an international approach and provides new evidence
on the global educational value of technology. The sample refers to the latest 2015 data from the
Programme for International Student Assessment (PISA) and comprises a total number of 190,549
students from 42 different countries. In contrast to the introduced literature, the empirical analysis
does ot fo us o ho e o pute s o l ut o side s stude ts’ a aila ilit of ICT at ho e i ge e al.
23 | August 2018
Without taking any control variables into account, a positive and statistically significant relationship
between each additional digital de i e a d stude ts’ PISA s o es in science is estimated. However, the
inclusion of background controls and the implementation of country fixed effects lead to significant
negative educational effects of ICT availability at home, indicating that electronic devices seem to be
a distraction for students. The substantial change of the estimation can be mainly attributed to the
consideration of fa ilies’ e o o i , so ial a d ultu al status. Accordingly, the initial reported positive
estimates are upward biased and proxy for the education and occupation of parents as well as for
family wealth. Nevertheless, this non-experimental evidence is exposed to the risk of selection bias
and omitted variable bias through the endogeneity of treatment, and thus it does not allow reliable
conclusions about causality (Bulman & Fairlie, 2016; Fuchs & Woessmann, 2004).
Overall, the presented results, the ambiguous state of research, and the null estimates of randomized
controlled trials seriously call into question that the mere availability of ICT at home is a positive
determinant in stude ts’ educational production function. Consequently, policy interventions that
address the problem of the digital divide, such as funding programs for the provision of computers for
education, may be inappropriate to reduce global educational inequality. Moreover, they can
potentially crowd out more effective government expenditures on education, for example public
investments in the quantity and quality of teachers (Bulman & Fairlie, 2016).
In conclusion, the current state of research cannot give a clear answer to the research question
hethe ICT a aila ilit at ho e has a ausal effe t o stude ts’ a hie e e ts. He e, there is a need
for further, indispensable research. In this context, Fairlie and Robinson (2013) suggest that studies
should not only focus on measurable academic outcomes but also consider potential benefits of
technology that are indirectly related to stude ts’ achievements, such as better access to information
about colleges, internships, or jobs. Moreover, Bulman and Fairlie (2016) point out that people’s a ess
to technology is no longer restricted to desktop computers but is characterized by a variety of different
digital devices, such as notebooks, smartphones, and tablet computers. For that reason, future
research needs to adapt to the rapid technological progress and consider the full range of potential
positive and negative effects of new technologies on stude ts’ a hie e e ts.
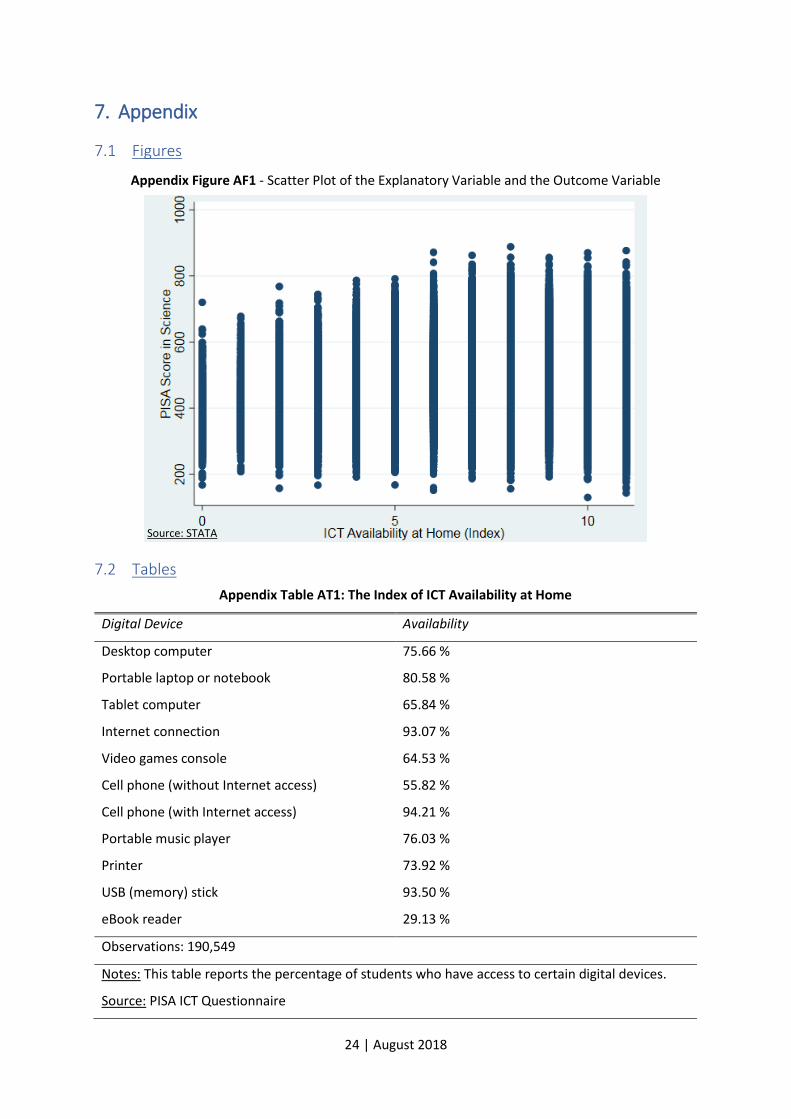
24 | August 2018
7. Appendix
7.1 Figures
7.2 Tables
Appendix Table AT1: The Index of ICT Availability at Home
Digital Device Availability
Desktop computer 75.66 %
Portable laptop or notebook 80.58 %
Tablet computer 65.84 %
Internet connection 93.07 %
Video games console 64.53 %
Cell phone (without Internet access) 55.82 %
Cell phone (with Internet access) 94.21 %
Portable music player 76.03 %
Printer 73.92 %
USB (memory) stick 93.50 %
eBook reader 29.13 %
Observations: 190,549
Notes: This table reports the percentage of students who have access to certain digital devices.
Source: PISA ICT Questionnaire
Appendix Figure AF1 - Scatter Plot of the Explanatory Variable and the Outcome Variable
Source: STATA
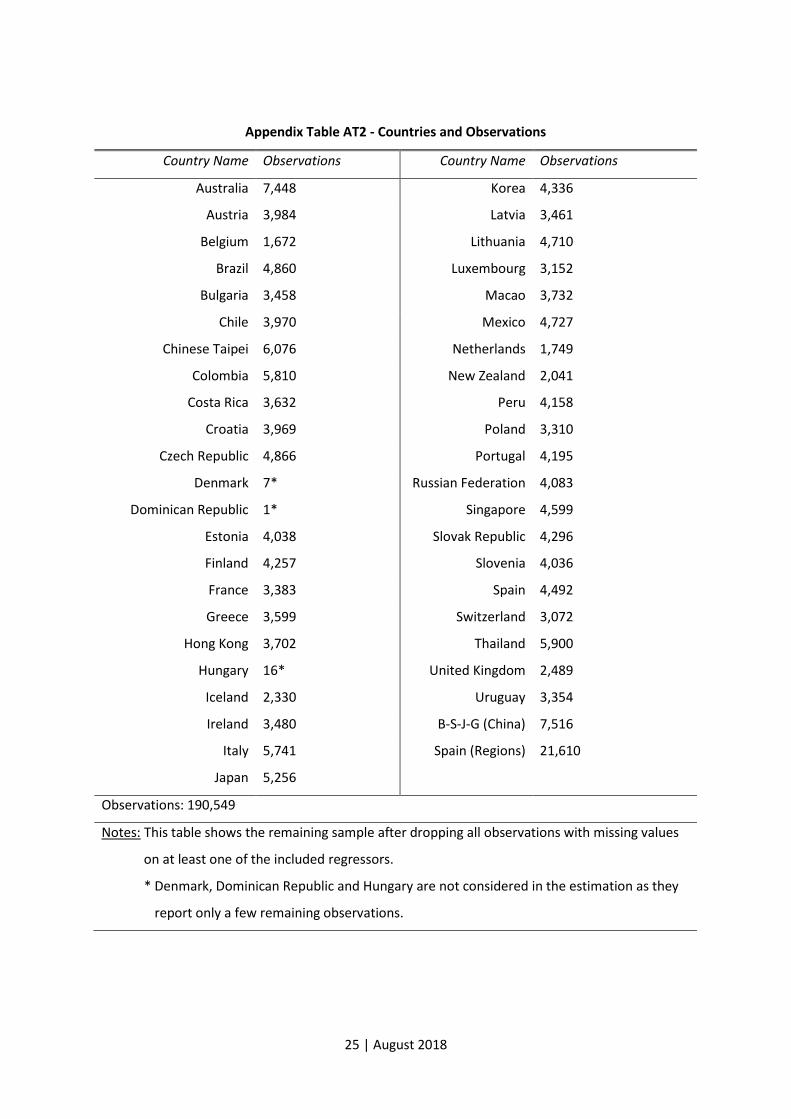
25 | August 2018
Appendix Table AT2 - Countries and Observations
Country Name Observations Country Name Observations
Australia 7,448 Korea 4,336
Austria 3,984 Latvia 3,461
Belgium 1,672 Lithuania 4,710
Brazil 4,860 Luxembourg 3,152
Bulgaria 3,458 Macao 3,732
Chile 3,970 Mexico 4,727
Chinese Taipei 6,076 Netherlands 1,749
Colombia 5,810 New Zealand 2,041
Costa Rica 3,632 Peru 4,158
Croatia 3,969 Poland 3,310
Czech Republic 4,866 Portugal 4,195
Denmark 7* Russian Federation 4,083
Dominican Republic 1* Singapore 4,599
Estonia 4,038 Slovak Republic 4,296
Finland 4,257 Slovenia 4,036
France 3,383 Spain 4,492
Greece 3,599 Switzerland 3,072
Hong Kong 3,702 Thailand 5,900
Hungary 16* United Kingdom 2,489
Iceland 2,330 Uruguay 3,354
Ireland 3,480 B-S-J-G (China) 7,516
Italy 5,741 Spain (Regions) 21,610
Japan 5,256
Observations: 190,549
Notes: This table shows the remaining sample after dropping all observations with missing values
Notes: on at least one of the included regressors.
Notes: * Denmark, Dominican Republic and Hungary are not considered in the estimation as they
Notes: * report only a few remaining observations.
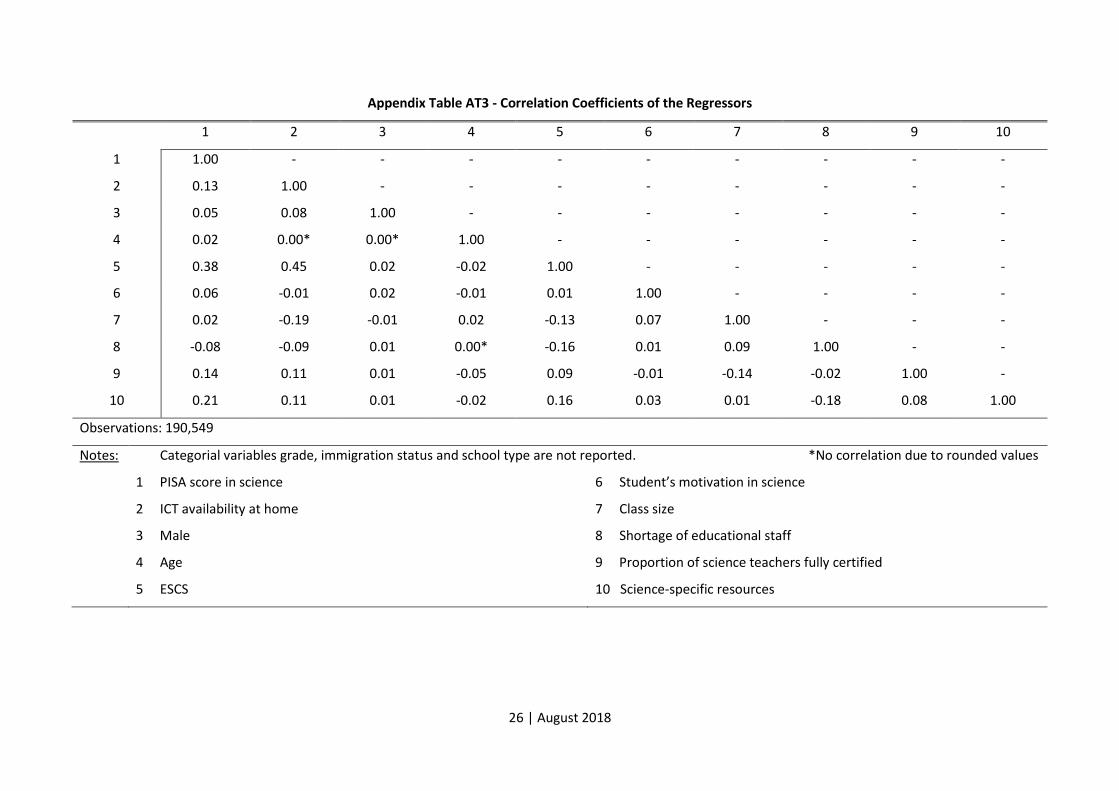
26 | August 2018
Appendix Table AT3 - Correlation Coefficients of the Regressors
1 2 3 4 5 6 7 8 9 10
1 1.00 - - - - - - - - -
2 0.13 1.00 - - - - - - - -
3 0.05 0.08 1.00 - - - - - - -
4 0.02 0.00* 0.00* 1.00 - - - - - -
5 0.38 0.45 0.02 -0.02 1.00 - - - - -
6 0.06 -0.01 0.02 -0.01 0.01 1.00 - - - -
7 0.02 -0.19 -0.01 0.02 -0.13 0.07 1.00 - - -
8 -0.08 -0.09 0.01 0.00* -0.16 0.01 0.09 1.00 - -
9 0.14 0.11 0.01 -0.05 0.09 -0.01 -0.14 -0.02 1.00 -
10 0.21 0.11 0.01 -0.02 0.16 0.03 0.01 -0.18 0.08 1.00
Observations: 190,549
Notes: 1 Categorial variables grade, immigration status and school type are not reported. *No correlation due to rounded values
1 PISA score in science Stude t’s oti atio i s ie e
2 ICT availability at home 7 Class size
3 Male 8 Shortage of educational staff
4 Age 9 Proportion of science teachers fully certified
5 ESCS 10 Science-specific resources
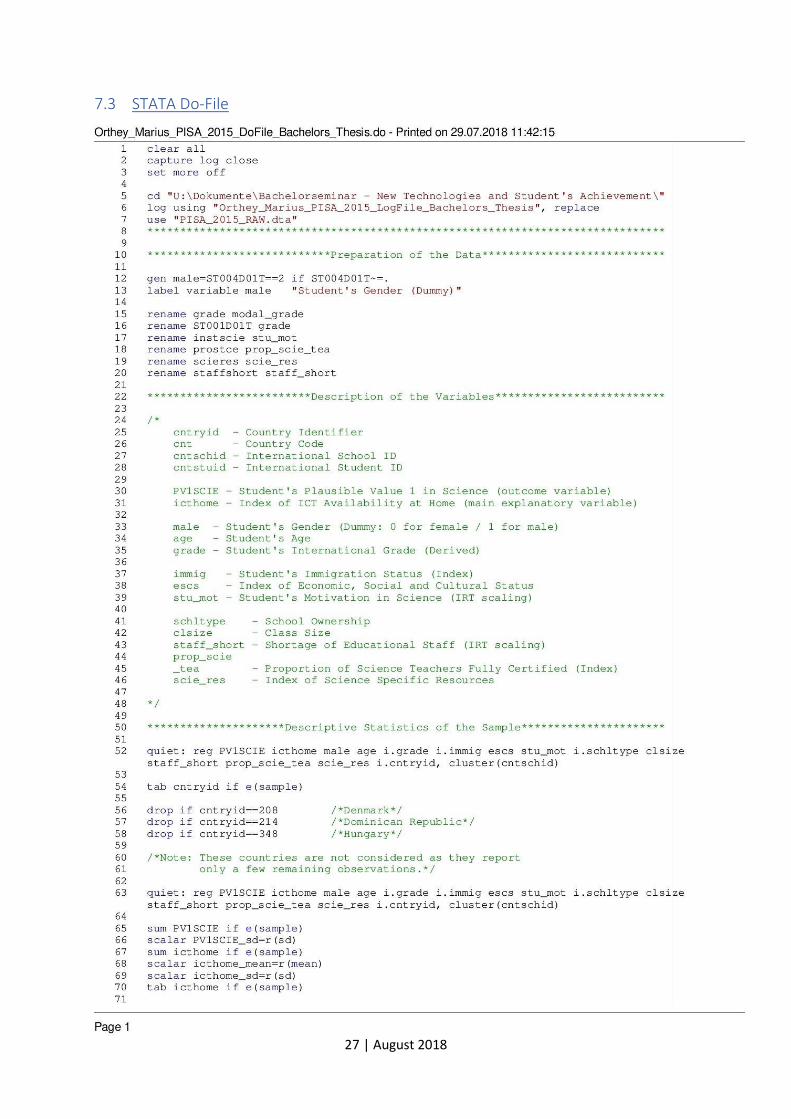
27 | August 2018
7.3 STATA Do-File
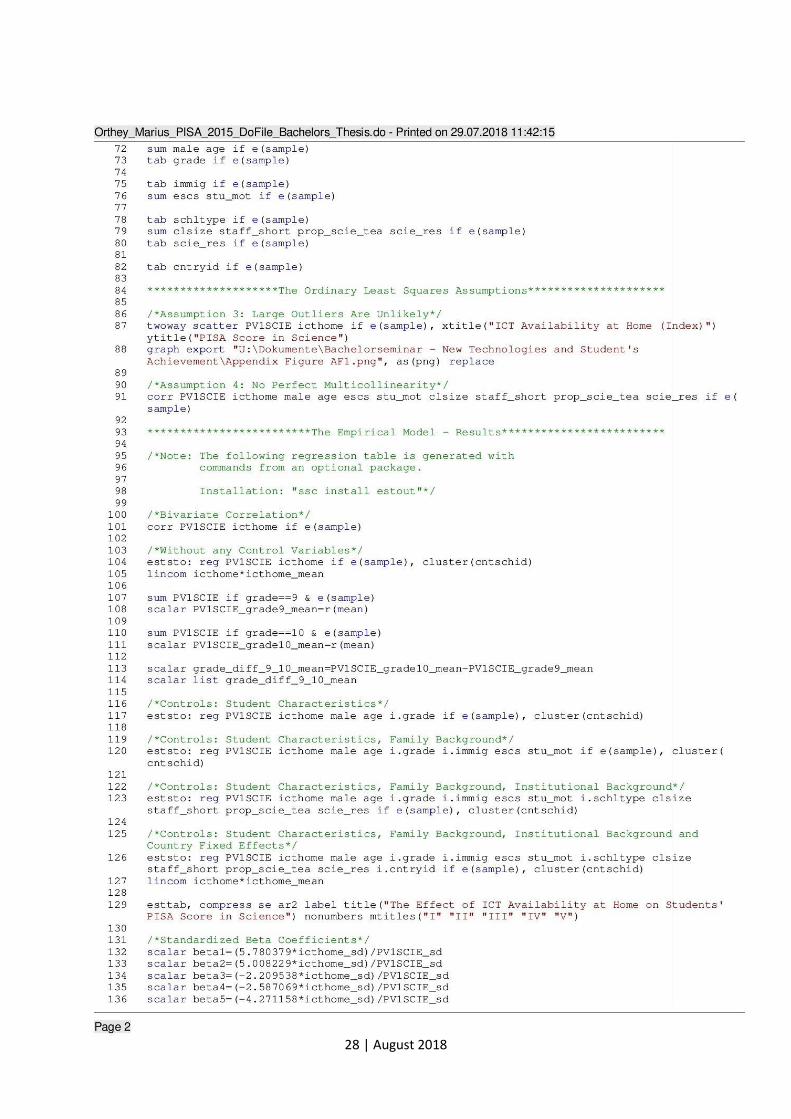
28 | August 2018
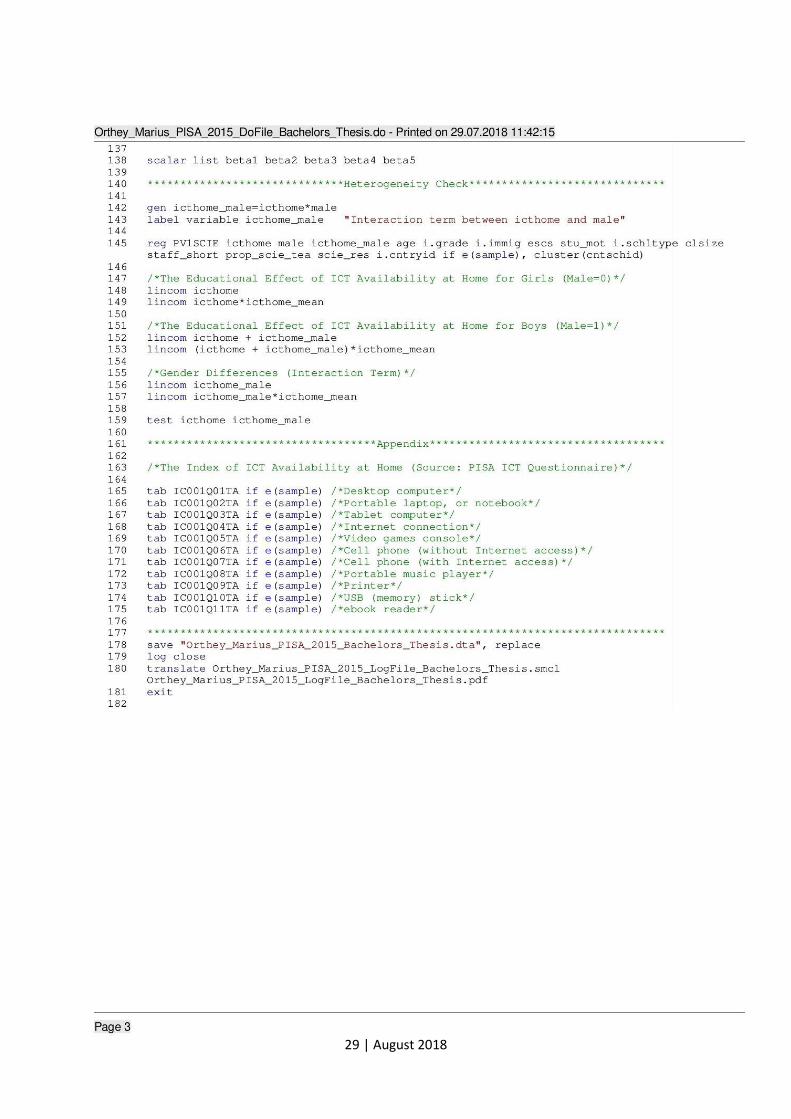
29 | August 2018
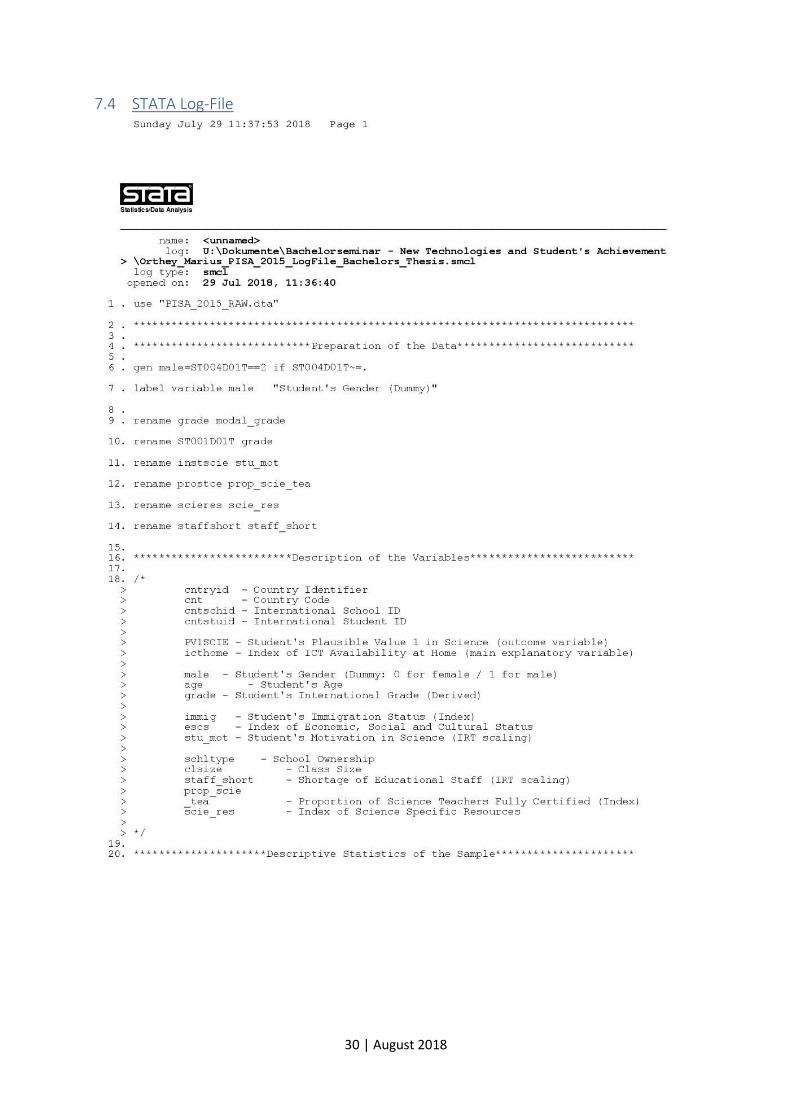
30 | August 2018
7.4 STATA Log-File
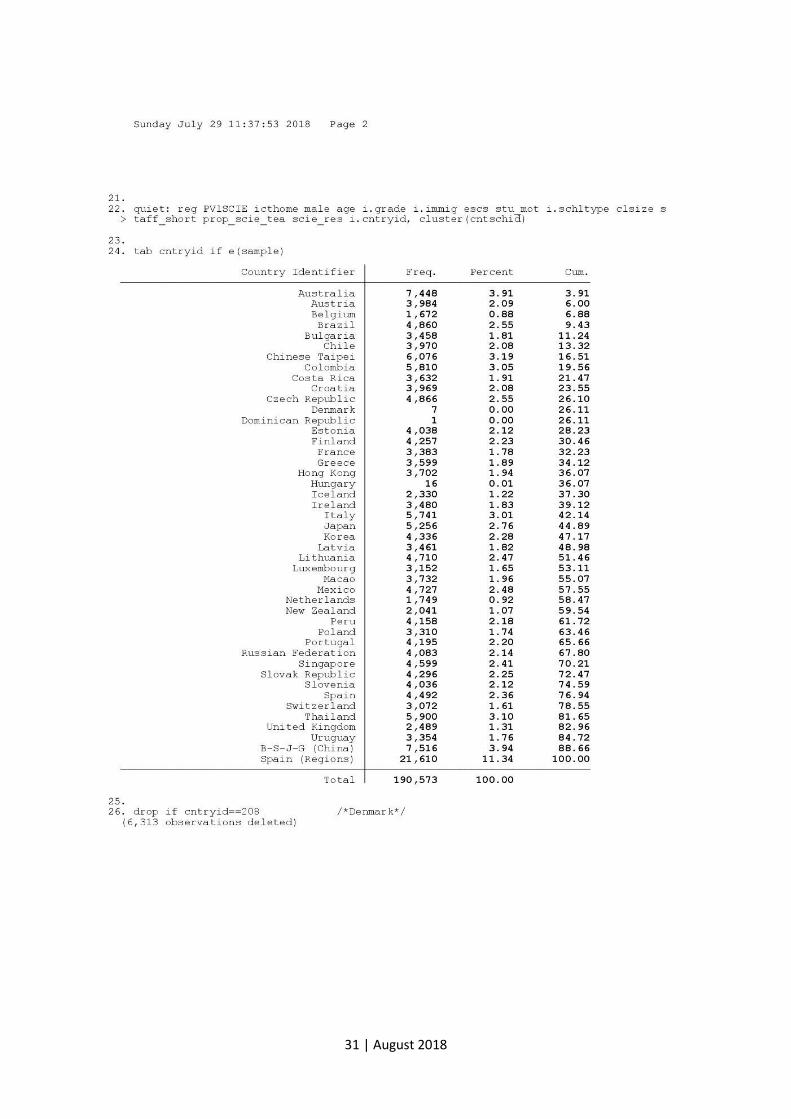
31 | August 2018
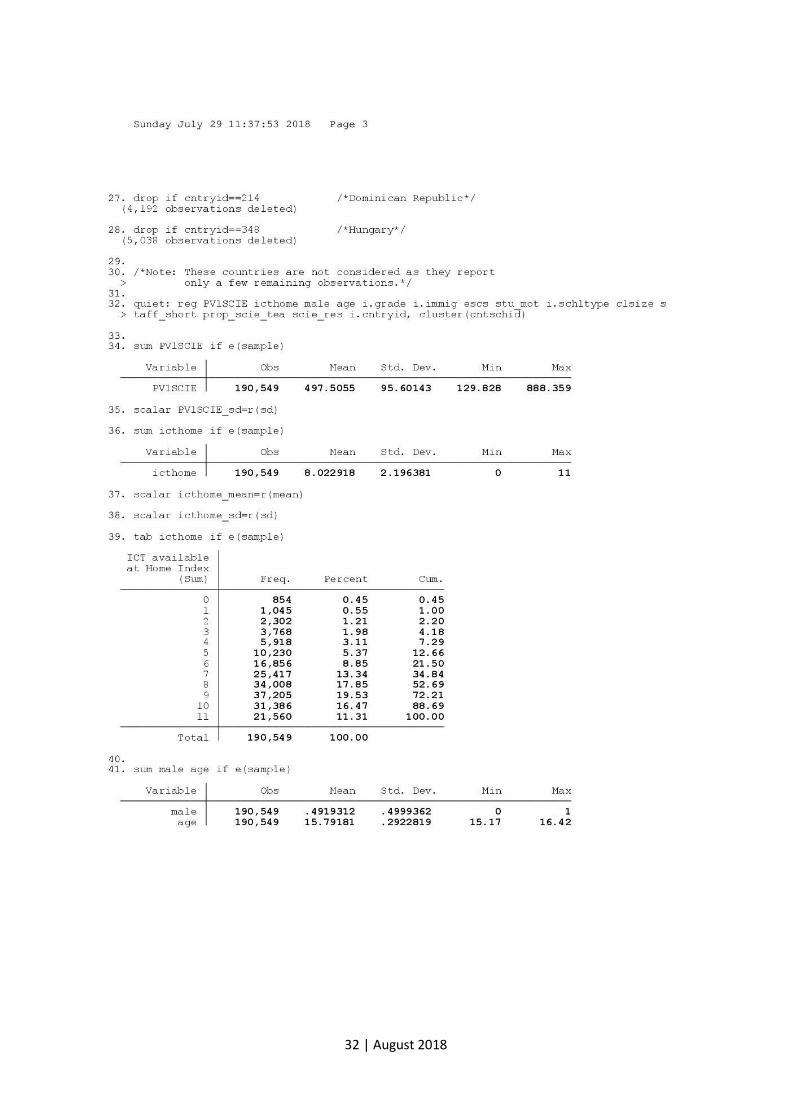
32 | August 2018
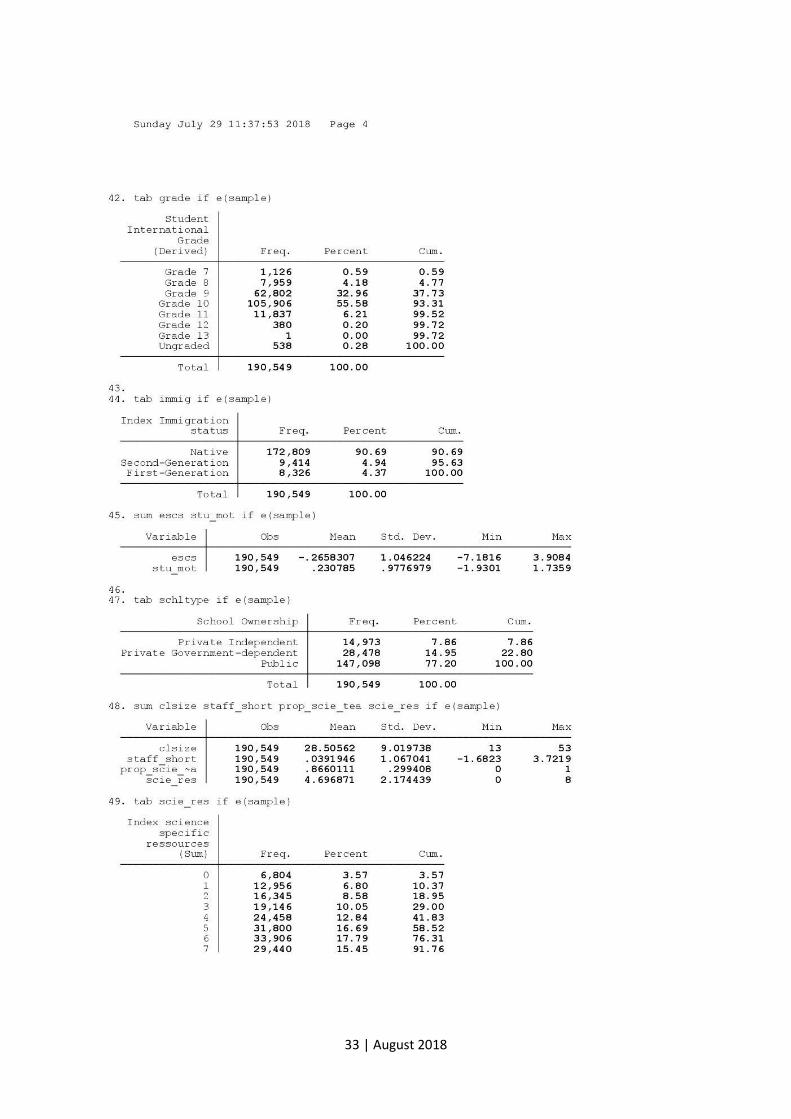
33 | August 2018
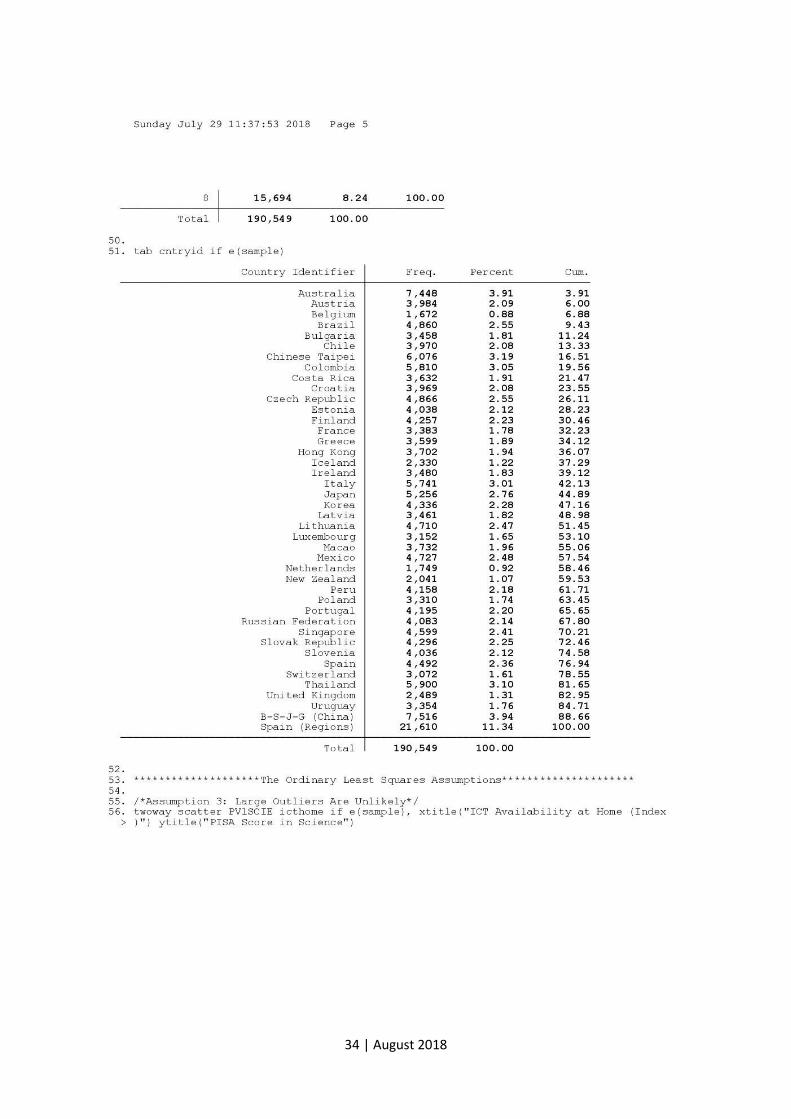
34 | August 2018
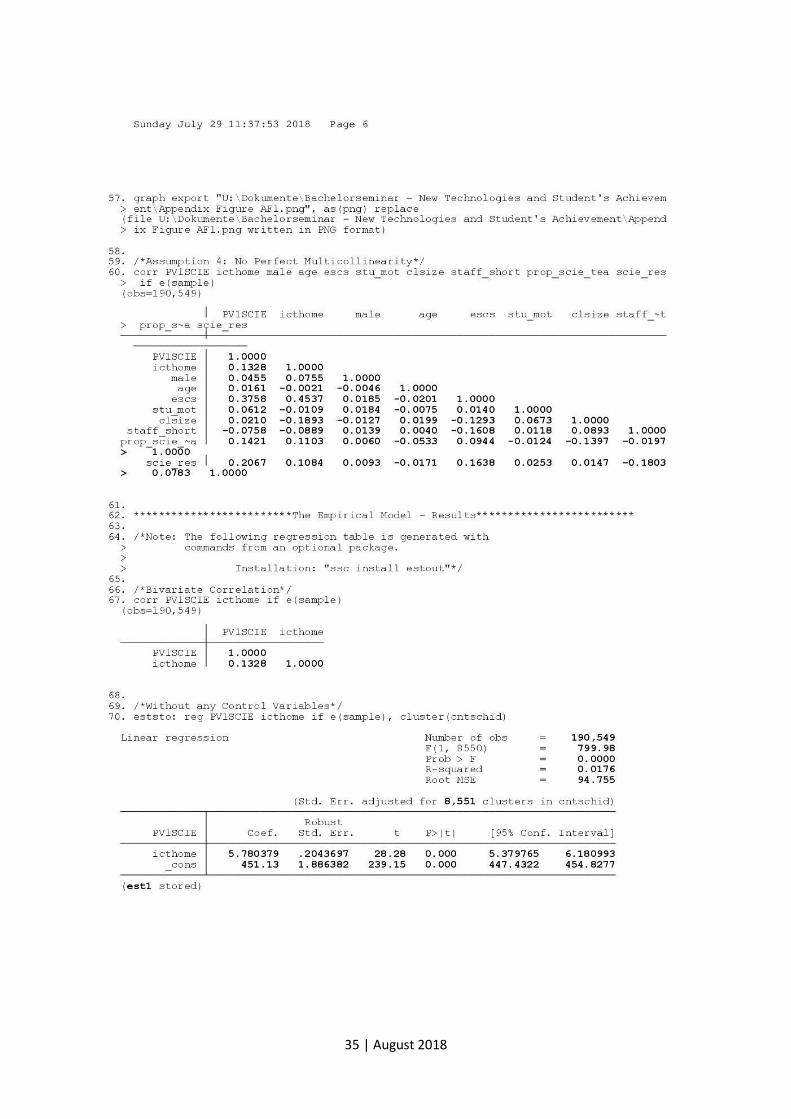
35 | August 2018
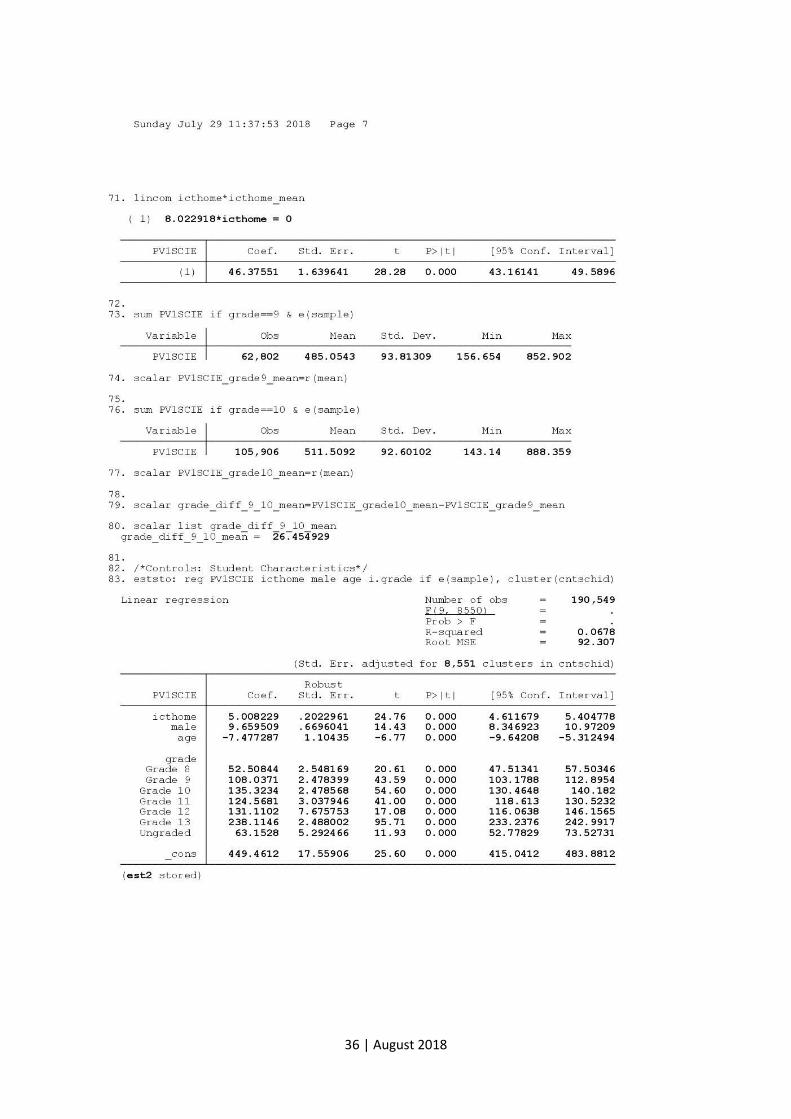
36 | August 2018
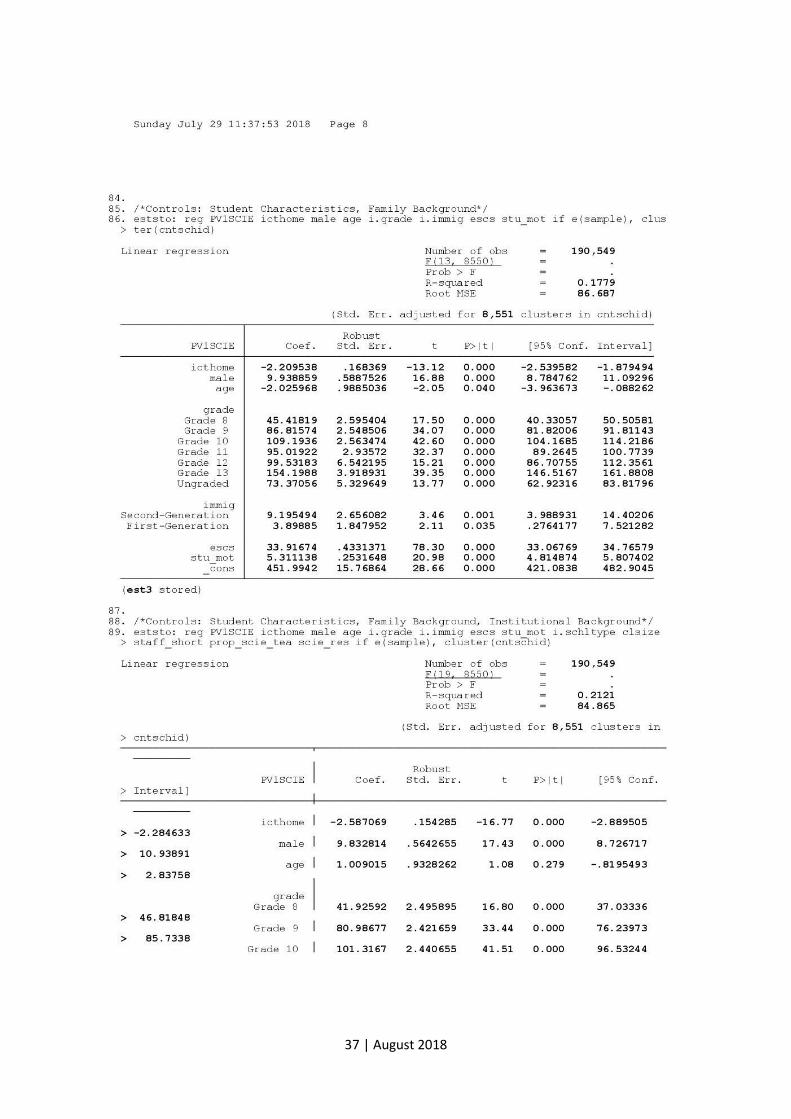
37 | August 2018
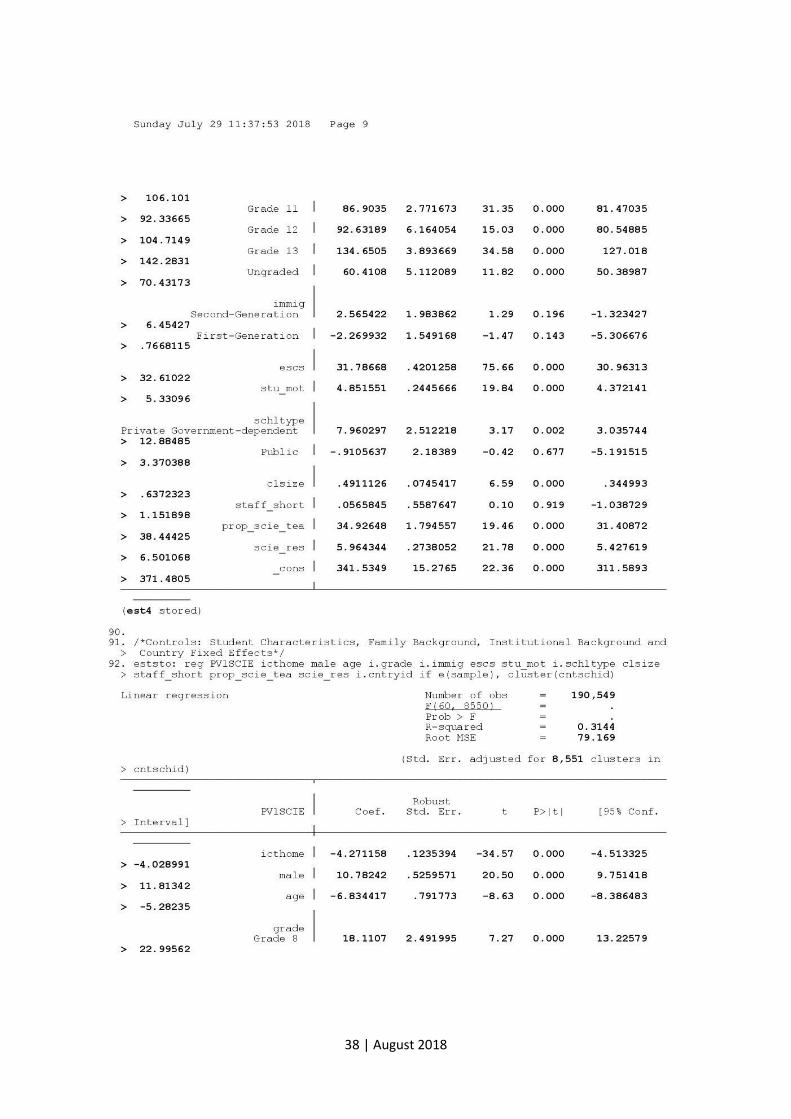
38 | August 2018
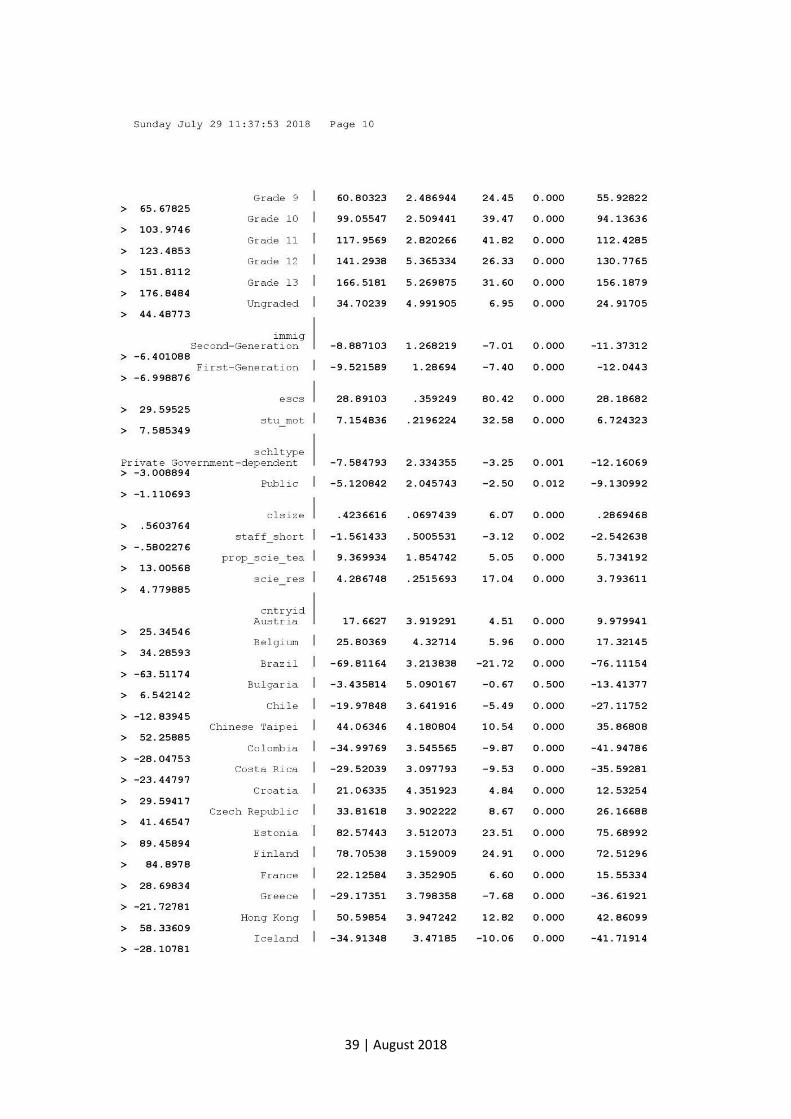
39 | August 2018
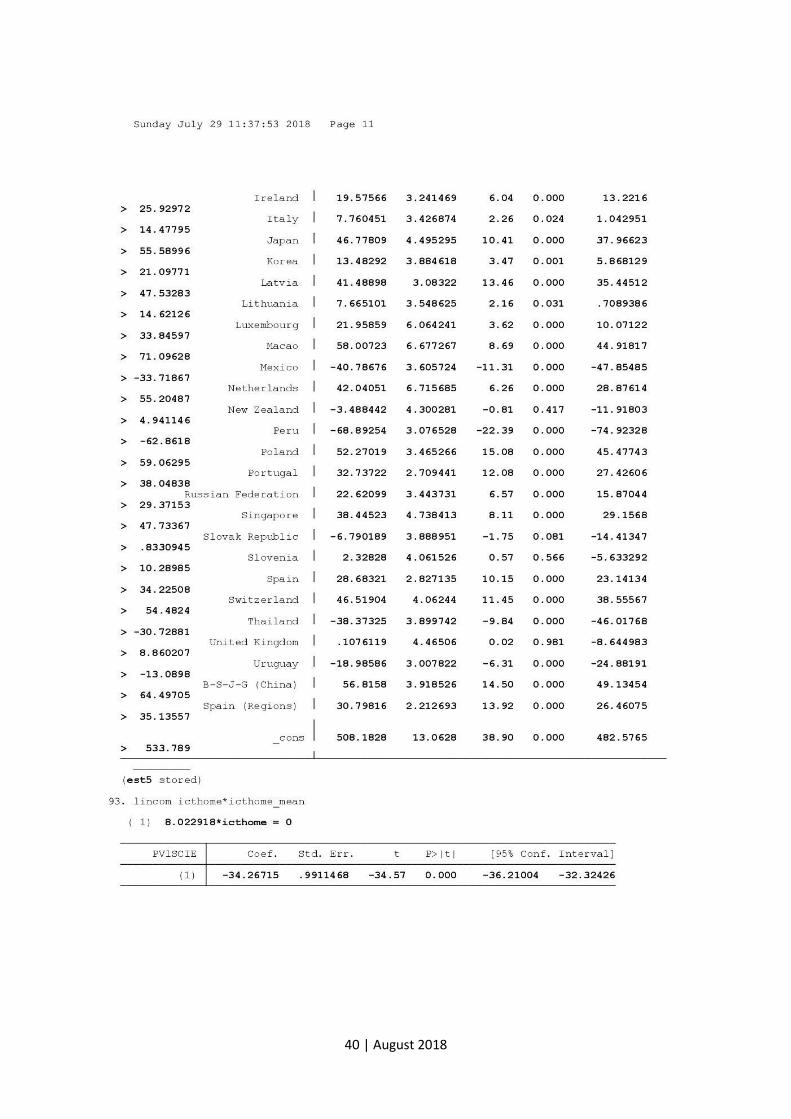
40 | August 2018
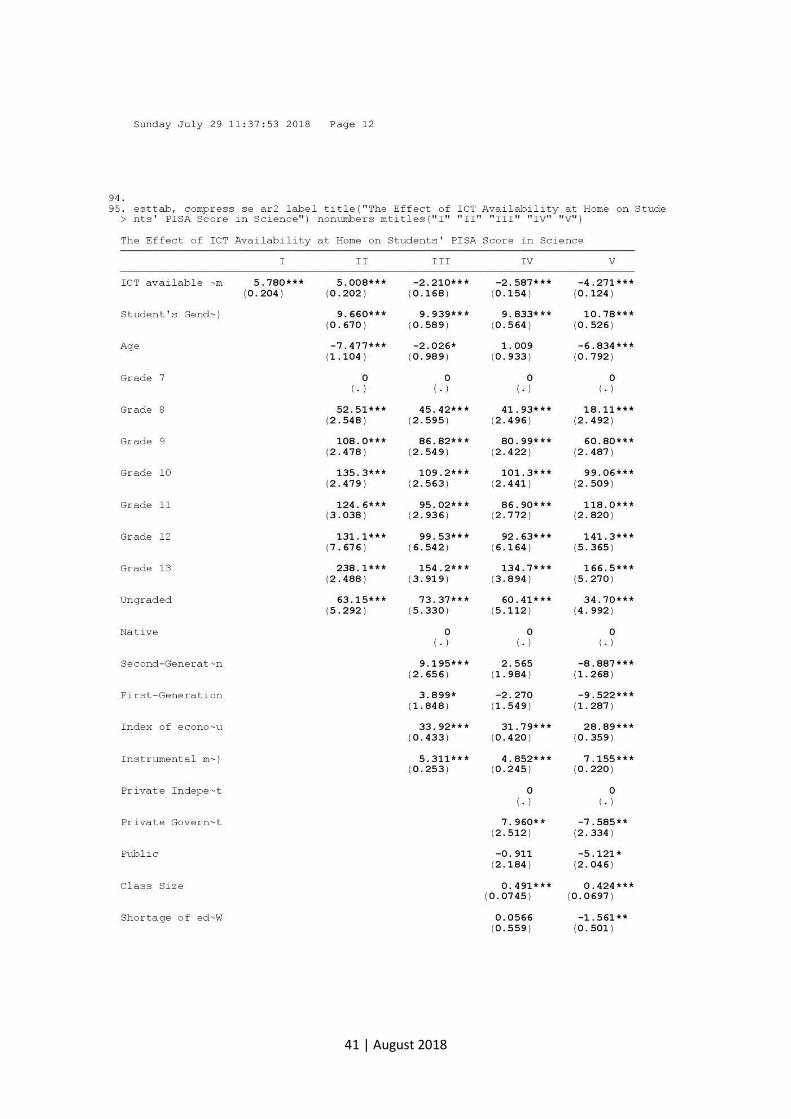
41 | August 2018
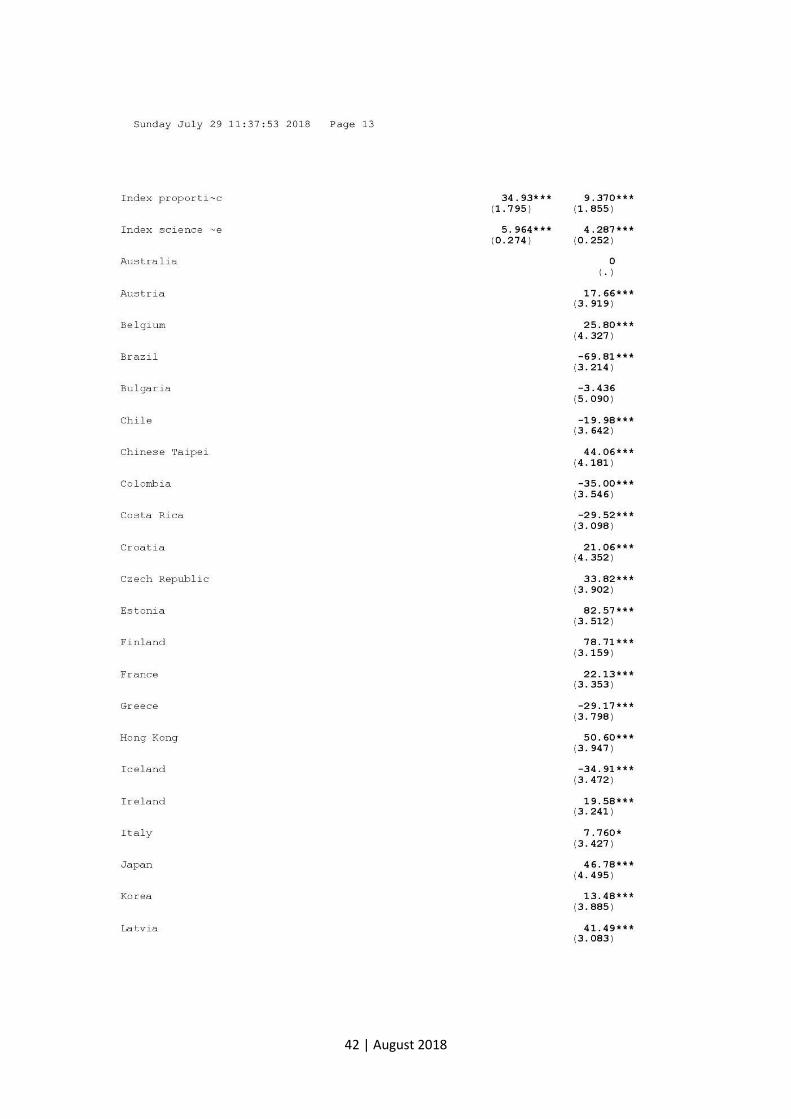
42 | August 2018
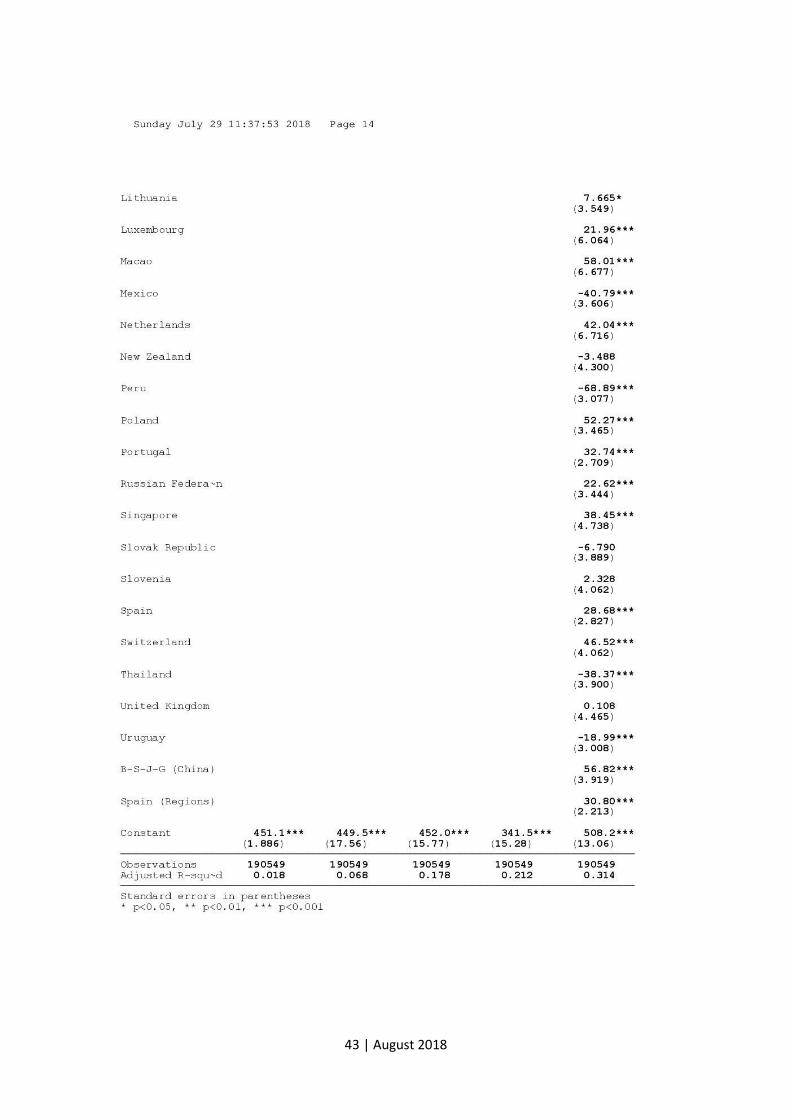
43 | August 2018
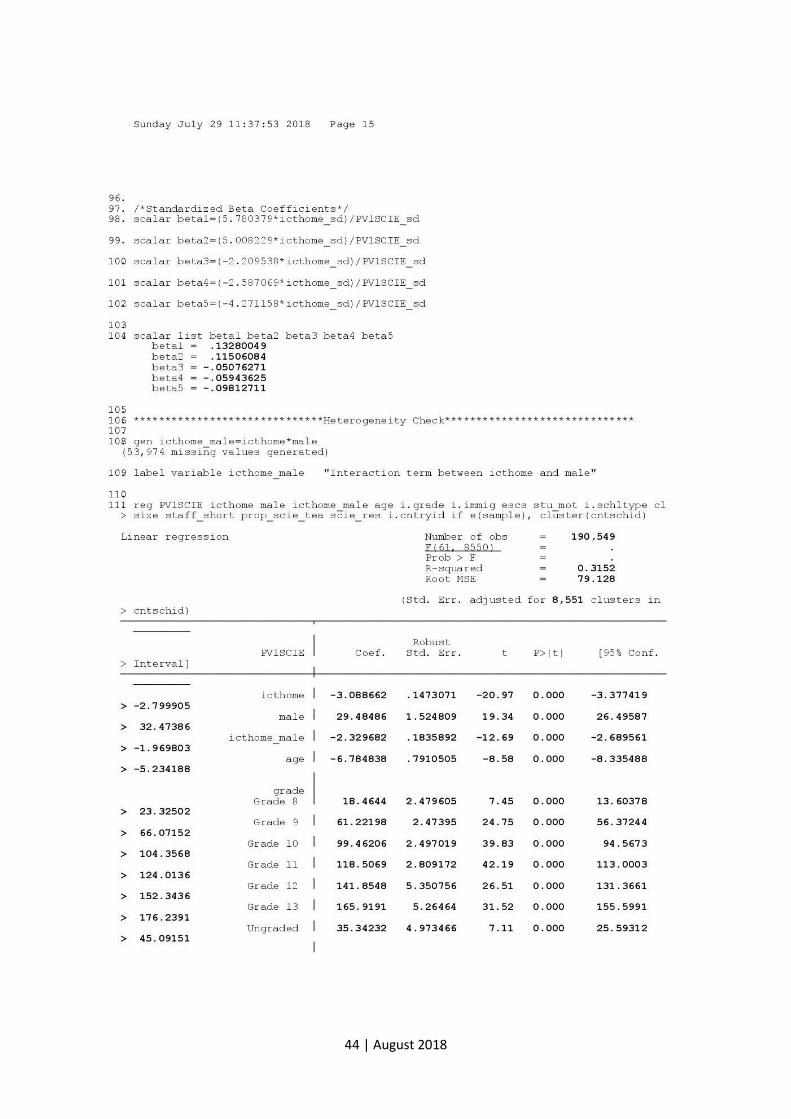
44 | August 2018
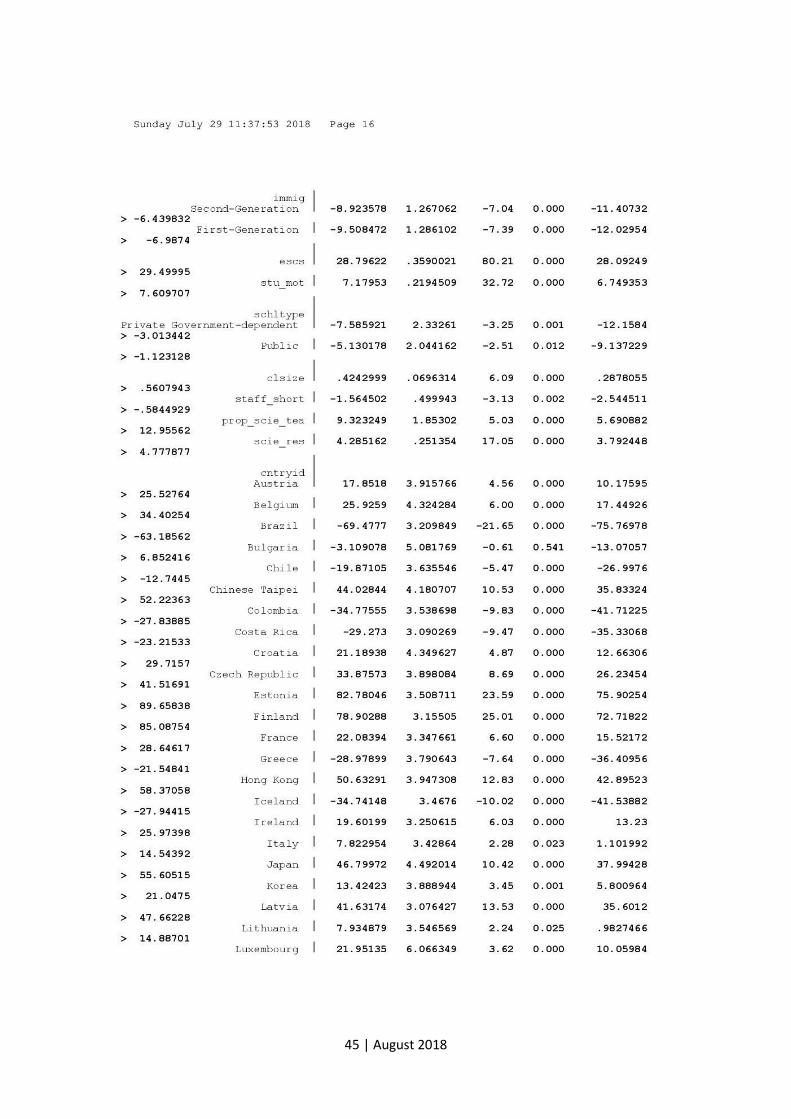
45 | August 2018
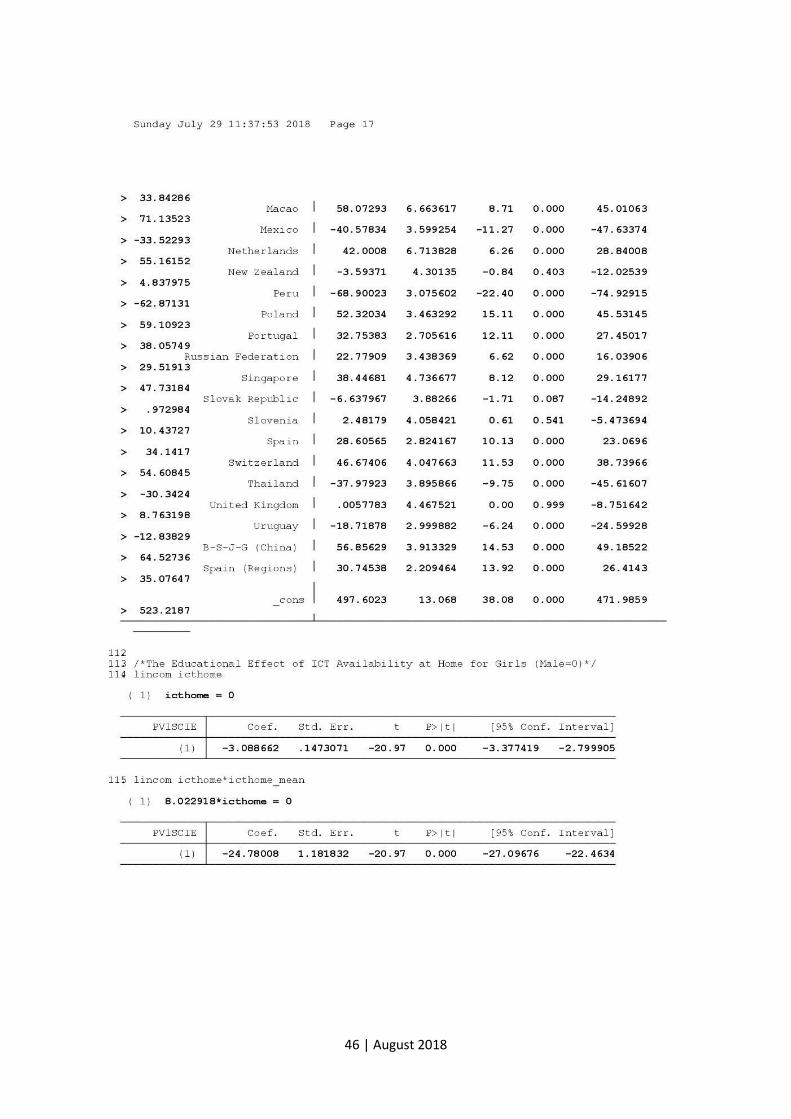
46 | August 2018
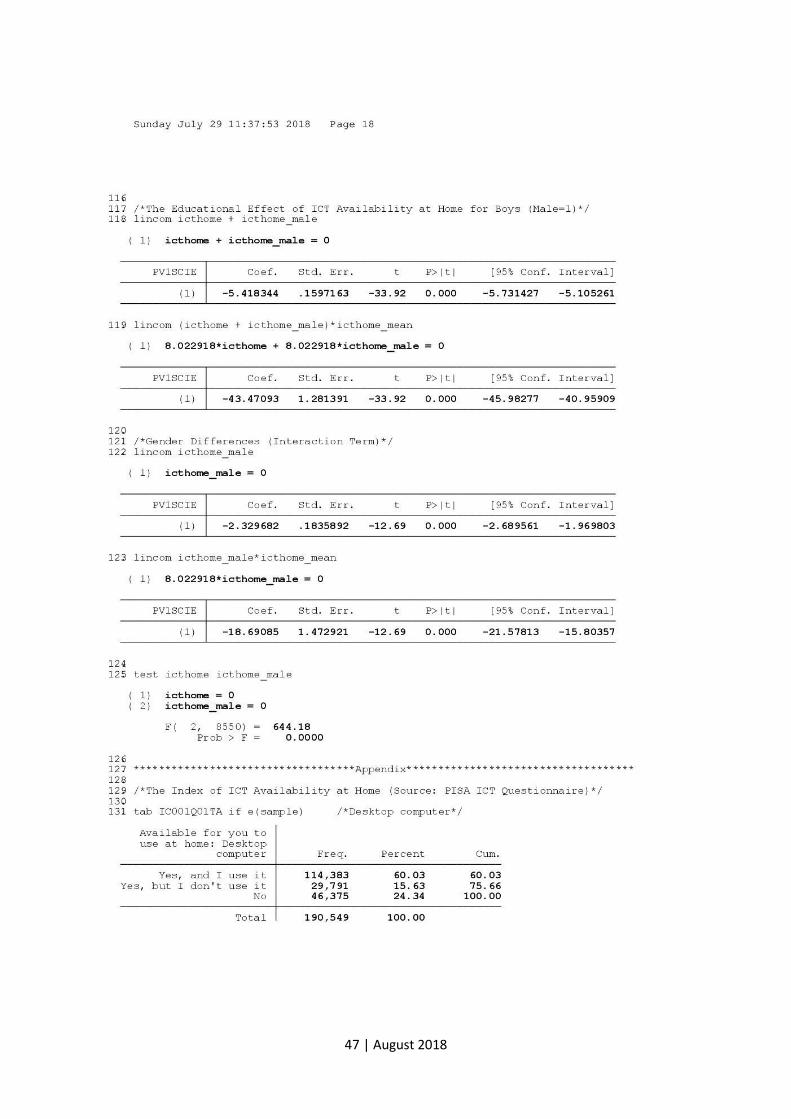
47 | August 2018
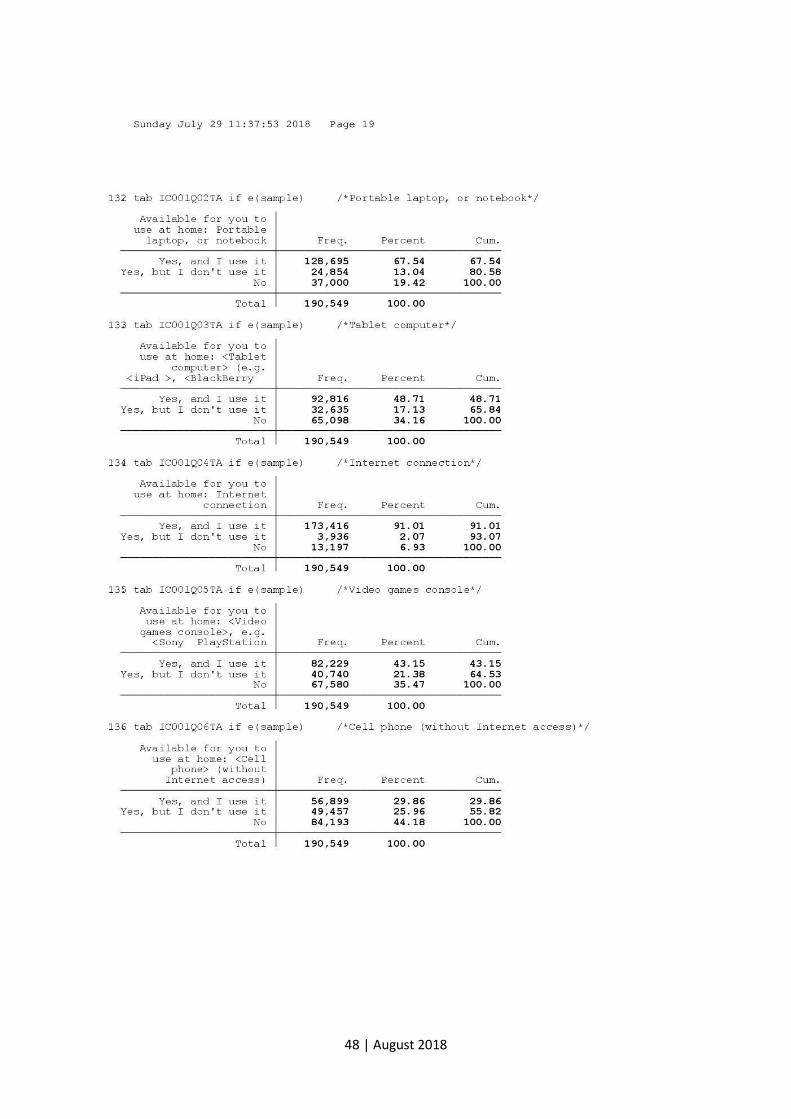
48 | August 2018
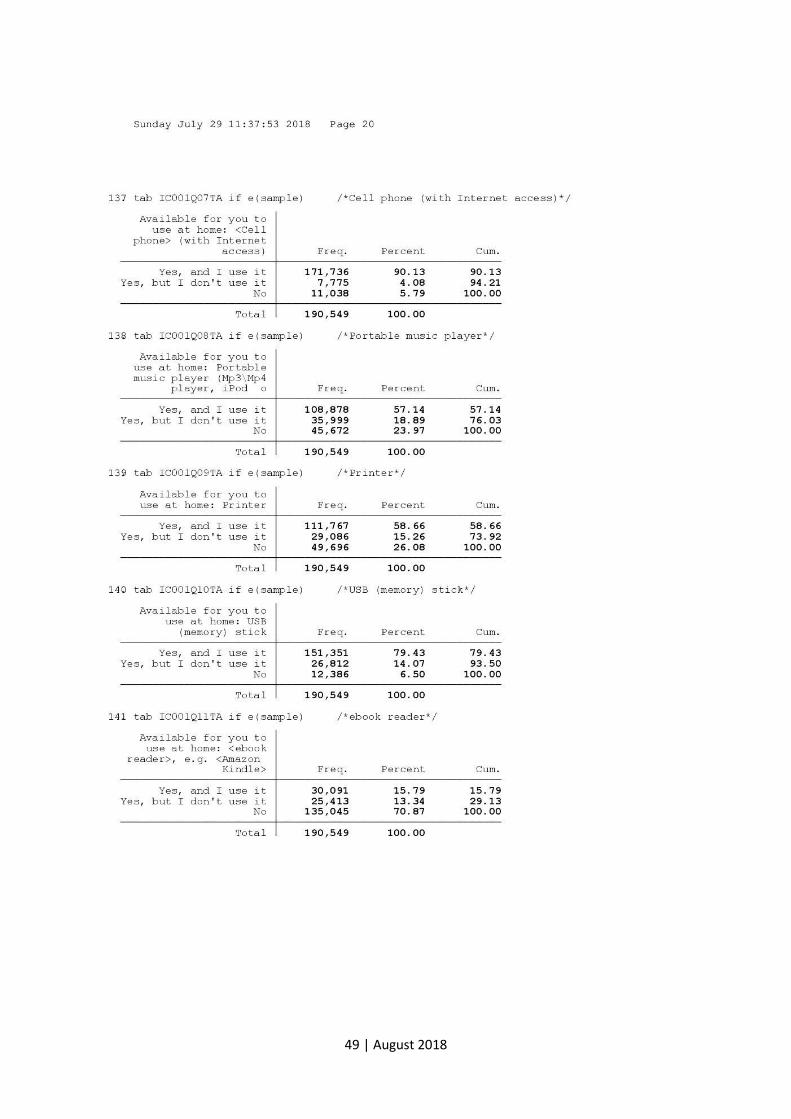
49 | August 2018
50 | August 2018
51 | August 2018
8. References
Attewell, P. & Battle, J. (1999). Home Computers and School Performance. The Information Society,
15(1), 1-10.
Bulman, G. & Fairlie, R. W. (2016). Technology and Education: Computers, Software, and the Internet.
NBER Working Paper No. 22237, Cambridge, MA: National Bureau of Economic Research.
Eurostat (2018). Arbeitslosigkeit nach Geschlecht, Alter und Bildungsabschluss - Jahresdurchschnitte.
http://appsso.eurostat.ec.europa.eu/nui/show.do?dataset=une_educ_a&lang=de
last retrieved on 16.05.2018.
Fairlie, R. W. & London, R. A. (2012). The Effects of Home Computers on Educational Outcomes:
Evidence from a Field Experiment with Community College Students. The Economic Journal,
122(561), 727-753.
Fairlie, R. W. & Robinson, J. (2013). Experimental Evidence on the Effects of Home Computers on
Academic Achievement among Schoolchildren. American Economic Journal: Applied
Economics, 5(3), 211-240.
Federal Communications Commission (2018). E-rate: Universal Service Program for Schools and
Libraries. https://www.fcc.gov/consumers/guides/universal-service-program-schools-and-
libraries-e-rate last retrieved on 10.05.2018.
Fuchs, T. & Woessmann, L. (2004). Computers and student learning: bivariate and multivariate
evidence on the availability and use of computers at home and at school. CESifo Working
Paper No. 1321, Munich, Center for Economic Studies and Ifo Institute.
Malamud, O. & Pop-Eleches, C. (2011). Home Computer Use and the Development of Human Capital.
The Quarterly Journal of Economics, 126(2), 987-1027.
OECD (2017). PISA 2015 Technical Report. http://www.oecd.org/pisa/sitedocument/PISA-2015-
technical-report-final.pdf last retrieved on 03.07.2018.
OECD (2018). PISA 2015 Results in Focus. http://www.oecd.org/pisa/pisa-2015-results-in-focus.pdf
last retrieved on 30.06.2018.
Rod íguez‐Pose, A. & Tselios, V. (2009). Education and Income Inequality in the Regions of the
European Union. Journal of Regional Science, 49(3), 411-437.
Schmitt, J. & Wadsworth, J. (2006). Is there an impact of household computer ownership on
children's educational attainment in Britain? Economics of Education Review, 25(6), 659-673.
52 | August 2018
Statistisches Bundesamt (2017). Statistisches Jahrbuch 2017. Deutschland und Internationales.
https://www.destatis.de/DE/Publikationen/StatistischesJahrbuch/StatistischesJahrbuch2017.
pdf?__blob=publicationFile last retrieved on 10.05.2018.
Stock, J. H. & Watson, M. W. (2007). Introduction to econometrics, Second Edition,
Boston: Pearson/Addison Wesley.
U.S. Census Bureau (2017). American Community Survey Reports. Computer and Internet Use in the
United States: 2015. https://www.census.gov/content/dam/Census/library/publications/
2017/acs/acs-37.pdf last retrieved on 10.05.2018.
Volman, M., van Eck, E., Heemskerk, I. & Kuiper, E. (2005). New technologies, new differences.
Gender and ethnic differences in pupils' use of ICT in primary and secondary education.
Computers & Education, 45(1), 35-55.
Weinburgh, M. (1995). Gender differences in student attitudes toward science: A meta-analysis of
the literature from 1970 to 1991. Journal of Research in Science Teaching, 32(4), 387-398.

06.08.2018
Eidesstattliche Erklärung
Ich versichere, dass ich die Arbeit selbstständig und ohne Benutzung anderer als der angegebenen
Hilfsmittel angefertigt habe. Alle Stellen, die wörtlich oder sinngemäß aus Veröffentlichungen oder
anderen Quellen (auch Internet) entnommen sind, habe ich als solche eindeutig kenntlich gemacht.
Von der Ordnung zur Sicherung guter wissenschaftlicher Praxis in Forschung und Lehre und zum
Verfahren zum Umgang mit wissenschaftlichem Fehlverhalten habe ich Kenntnis genommen. Die
Arbeit ist noch nicht veröffentlicht und noch nicht als Studienleistung zur Anerkennung oder
Bewertung vorgelegt worden. Mir ist bekannt, dass Verstöße gegen diese Anforderungen zur
Be e tu g de A eit it de Note „Ni ht aus ei he d“ füh e so ie die Ni hte teilu g des
angestrebten Leistungsnachweises zur Folge haben.
_______________ ________________________
Datum Unterschrift