john c. gomez hhs public access *,‡ hong dang†,‡ jessica r
TRANSCRIPT

Nrf2 modulates host defense during S. pneumoniae pneumonia in mice
John C. Gomez*,‡, Hong Dang†,‡, Jessica R. Martin*,‡, and Claire M. Doerschuk*,‡,§
*Center for Airways Disease, University of North Carolina at Chapel Hill, Chapel Hill, NC, USA
†Cystic Fibrosis/Pulmonary Research and Treatment Center, University of North Carolina at Chapel Hill, Chapel Hill, NC, USA
‡Marsico Lung Institute, University of North Carolina at Chapel Hill, Chapel Hill, NC, USA
§Department of Medicine, University of North Carolina at Chapel Hill, Chapel Hill, NC, USA
Abstract
Nrf2 regulates the transcriptional response to oxidative stress. These studies tested the role of Nrf2
during S. pneumoniae pneumonia and identified Nrf2-dependent genes and pathways in lung
tissue and in recruited neutrophils. Nrf2 null and WT mice were studied at 6 and 24 h following
instillation of S. pneumoniae or PBS. At 6 h, fewer neutrophils were recruited and the number of
bacterial remaining in the lungs tended to be less (p=0.06) in the Nrf2 null compared to WT mice.
In uninfected lungs, 53 genes were already differentially expressed in Nrf2 null compared to WT
mouse lungs and gene sets involved in phagocytosis, Fc receptor function, complement and
immunoglobulin regulation are enhanced in PBS-treated Nrf2 null gene profiles compared to those
of WT mice. These results suggest that initial host defense is enhanced in Nrf2 null mice, resulting
in less recruitment of neutrophils. At 24 h, neutrophil recruitment was greater. The percentages of
early apoptotic and late apoptotic/necrotic neutrophils were similar. At increasing inoculum
numbers, mortality strikingly increased from 15% to 31% and 100% in Nrf2 null mice, whereas all
WT mice survived, and Nrf2 null mice had a defect in clearance, particularly at the intermediate
dose. The mortality was due to enhanced lung injury and greater systemic response. Gene profiling
identified differentially regulated genes and pathways in neutrophils and lung tissue, including
those involved in redox stress response, metabolism, inflammation, immunoregulatory pathways
and tissue repair, providing insight into the mechanisms for the greater tissue damage and
increased neutrophil accumulation.
Introduction
The transcription factor Nrf2 (nuclear factor erythroid-derived 2-like 2, Nfe2l2) is a critical
regulator of the cellular response to oxidative stress. At baseline, Nrf2 is kept in the
cytoplasm by its inhibitor Keap1 and very rapidly targeted for proteasomal degradation, with
a half-life of about 15 minutes (1). Upon exposure to oxidative stress, Nrf2 translocates to
the nucleus, where it binds to antioxidant response elements (AREs) in the promoter region
Address correspondence to: Claire M. Doerschuk, M.D., 7205 Marsico Hall, CB #7248, University of North Carolina, Chapel Hill, NC 27599-7248, Phone: 919 966-1782, [email protected].
HHS Public AccessAuthor manuscriptJ Immunol. Author manuscript; available in PMC 2017 October 01.
Published in final edited form as:J Immunol. 2016 October 1; 197(7): 2864–2879. doi:10.4049/jimmunol.1600043.
Author M
anuscriptA
uthor Manuscript
Author M
anuscriptA
uthor Manuscript

of target genes to activate transcription of detoxifying and antioxidant enzymes and other
cytoprotective pathways (2). Nrf2 activation thus restores intracellular redox balance,
preventing oxidative damage to the cell. Nrf2 has garnered wide attention as a potential
therapeutic target in diseases in which oxidative stress contributes to pathogenesis, such as
cancer, multiple sclerosis and COPD (2).
Nrf2 plays a critical protective role in the lungs, which are continually exposed to oxidative
stress due to inhaled oxidants. Numerous studies using Nrf2 deficient mice have
demonstrated the role of Nrf2 in mouse models of lung carcinogenesis, viral infections,
allergy and asthma, pulmonary fibrosis, COPD, and acute lung injury (3). Previous work has
also shown that Nrf2 may play an important role in inflammation and the innate immune
response to bacterial pathogens in the lungs. In response to LPS instillation into the lungs,
Nrf2 deficient mice showed increased neutrophil recruitment, greater TNF levels and
increased NF-κB activation compared with WT mice (4, 5). Deficiency of Nrf2 leads to
increased lung injury associated with defects in mitochondrial biogenesis and mitophagy in
alveolar type 2 cells, as well as greater expression of the genes encoding the inflammatory
cytokines IL-1, TNF and CCL2 (MCP-1) and lower expression of the anti-inflammatory
cytokine IL-10 compared with WT mice during Staphylococcus aureus-induced pneumonia
and sepsis (6, 7). Activating Nrf2 improved bacterial clearance from the lungs in mice
exposed to cigarette smoke, and sulforaphane treatment of alveolar macrophages from
COPD patients improved their ability to phagocytose bacteria, at least in part through Nrf2
activation (8). Nrf2 null mice showed increased inflammation, injury and bacterial load
during pulmonary infection with P. aeruginosa after hyperoxia (9). Our initial studies
demonstrated that neutrophils express Nrf2 (10), but its functional significance in regulating
gene transcription within these cells has not been evaluated.
These studies tested the hypothesis that Nrf2 regulates lung host defense during bacterial
pneumonia induced by S. pneumoniae, the most common cause of community-acquired
pneumonia. Host defense and the inflammatory response were examined in Nrf2 null
(Nfe2l2−/−) and WT mice given either PBS (uninfected) or S. pneumoniae for 6 or 24 hours.
Gene profiling was performed in both the whole lung tissue and the lung neutrophils isolated
from the PBS- or S. pneumoniae-treated lungs. We determined the role of Nrf2 in
neutrophils recruited to the lungs and identified pathways and potential mechanisms through
which Nrf2 modulates the inflammatory response and subsequent resolution and tissue
repair.
Materials and methods
Mice
Adult C57BL/6 (WT) mice were purchased from Jackson Laboratory (Bar Harbor, ME).
Mice deficient in Nrf2 (Nfe2l2−/−) were kindly provided by Dr. Masayuki Yamamoto at
Tohoku University (11), and a colony was developed. Mice were bred and housed side by
side in ventilated racks within a specific pathogen-free facility. Age- and gender-matched
mice were used at 6-12 weeks of age. All animal studies were performed in compliance with
the U.S. Department of Health and Human Services Guide for the Care and Use of
Gomez et al. Page 2
J Immunol. Author manuscript; available in PMC 2017 October 01.
Author M
anuscriptA
uthor Manuscript
Author M
anuscriptA
uthor Manuscript

Laboratory Animals. Animal studies were reviewed and approved by our Institutional
Animal Care and Use Committee.
Bacterial pneumonia
Streptococcus pneumoniae (S. pneumoniae; serotype 19, ATCC 49619) was purchased from
American Type Culture Collection (Manassas, VA). S. pneumoniae was grown at 37°C with
5% CO2 on trypticase soy agar containing 5% defibrinated sheep blood. Suspensions of S. pneumoniae were prepared in PBS, and bacterial dose was estimated based on the
absorbance of the bacterial suspension at 600 nm. Pneumonia was induced by intratracheal
instillation of the prepared bacterial suspension into the left lung (2.3 μl of the bacterial
suspension per g mouse body weight). The number of bacterial CFU instilled was quantified
by plating serial dilutions of the bacterial suspension on agar plates, as in the lungs and
spleens (please see below).
Lung morphometry
At 6 or 24 hours after instillation of S. pneumoniae, Nrf2 null and WT mice were euthanized
by isoflurane overdose. The lungs were removed and fixed by intratracheal instillation of 4%
paraformaldehyde at a constant pressure of 22 cm H2O. Lung sections through the
pneumonic left lung were embedded in paraffin, sectioned at 4-5 μm, and stained with
hematoxylin and eosin. In randomly selected fields, the number of neutrophils was counted
in 500 alveoli per mouse, and the number of neutrophils per 100 alveoli was calculated and
compared between genotypes.
Isolation of single lung cells
Mice were euthanized by isoflurane overdose 6 or 24 hours after bacterial instillation. The
lung vasculature was flushed by perfusing with 10 ml of PBS via the right ventricle, and the
lungs and heart were removed. Dispase II (Roche Applied Science, Indianapolis, IN) was
instilled into the lungs through the trachea, and the trachea was ligated with silk suture. The
samples were incubated for 30 minutes at 37 °C. The lungs were excised, minced with
scissors and enzymatically digested with 0.1% collagenase-dispase (Roche Applied Science)
and 0.01% deoxyribonuclease I (Sigma-Aldrich, St. Louis, MO) at 37°C for 10 min. The
cells were passed through a 100 μm mesh to remove clumps. The cell suspension was
resuspended in red blood cell lysis solution (Sigma-Aldrich), washed several times with PBS
and passed through a 40 μm mesh. The total number of cells in each sample was determined
using a hemocytometer.
Bronchoalveolar lavage (BAL)
BAL was performed by instilling 0.9 mL of ice-cold PBS containing 2 mM EDTA per 22 g
body weight into the lungs via an intratracheal catheter and carefully aspirating the fluid.
The lavage was repeated 5 times with fresh buffer and the fluid samples were pooled. Cells
in the BAL fluid were counted using a hemocytometer, and differential counts were
determined by examining cytospins stained with Hema3 (Fisher Scientific, Kalamazoo, MI).
Gomez et al. Page 3
J Immunol. Author manuscript; available in PMC 2017 October 01.
Author M
anuscriptA
uthor Manuscript
Author M
anuscriptA
uthor Manuscript

Quantifying bacterial numbers in lung, spleen and BAL fluid
After BAL, lungs were perfused with 10 mL of sterile PBS through the right ventricle and
the lungs and heart were dissected aseptically. Lung tissue after lavage and spleens were
homogenized in sterile PBS. Bacterial suspensions, tissue homogenates, and BALF samples
were serially diluted with sterile PBS and were plated on Trypticase Soy Agar plates
supplemented with 5% sheep blood (BD Diagnostic Systems, Sparks, MD). Bacterial
colonies were counted on culture plates after incubation overnight at 37°C and 5% CO2.
Bacterial clearance was calculated as the ratio of CFUs recovered to that instilled for the
BALF, the remaining lung digest and the total combined clearance. Unless specified
otherwise, the range of CFUs instilled was 0.57-1.7 × 10⁸ CFU/mL instillate.
In bacterial clearance studies where mice received intermediate or high doses of S. pneumoniae, surviving mice were euthanized after 18 hours. Blood was obtained through the
inferior vena cava and lungs and spleens were dissected aseptically. Lungs and spleens were
homogenized in sterile PBS. Aliquots of blood and lung and spleen homogenates were
plated on agar plates and CFUs counted as described above. The number of CFUs per mL of
instillate was 0.57-1.7 × 10⁸ (low dose), 5.4 × 10⁸ (intermediate dose) and 2.5 × 10⁹ (high
dose). The volume of instillate given was adjusted for body weight (2.3 μl/g body weight),
and the number of CFU given per mouse is calculated for each experiment.
Screening assays for oxidative stress and antioxidant capacity
Measurement of Thiobarbituric Acid Reactive Substances (TBARS) and antioxidant
capacity were performed using assay kits from Cayman Chemical (Ann Arbor, MI), and
assays were performed according to the manufacturer’s instructions. Briefly, pneumonic
lungs were homogenized in PBS, and the homogenates were centrifuged at 1,600 x g for 10
minutes at 4°C. An aliquot of the resulting supernatant was obtained for measurement of
antioxidant capacity. An equal volume of RIPA buffer was then added to the remaining
homogenate, the sample was spun and TBARS were measured in the supernatant. All
samples were stored at -80°C prior to performing the assays.
Quantifying DAMPS and other markers of alveolar injury in the BAL fluid
At 6 or 24 h after instillation of S. pneumoniae (5.8-15 × 106 CFUs/mouse) in Nrf2 null and
WT mice, the pulmonary vasculature was flushed with PBS, and a single BAL was
performed by instilling 0.9 ml PBS containing 2 mM EDTA per 22 g mouse body weight
into the lungs through the trachea. BAL fluid was spun at 300 x g at 4°C for 5 minutes, and
the cell-free supernatant was collected and stored at -80°C until use. Thawed samples were
spun at 15,000 x g for 2 minutes at 4°C, and the supernatant was collected and aliquoted for
use in subsequent assays. Total protein was measured using the Bicinchoninic Acid Protein
Assay according to the manufacturer’s instructions (Sigma-Aldrich or Thermo Fisher
Scientific, Waltham, MA). The levels of 23 cytokines/chemokines were measured using a
multiplex assay on the Bio-Plex MAGPIX platform (Bio-Rad, Hercules, CA, USA). The
levels of soluble RAGE, S100A8 and S100A9 were measured using a custom multiplex
magnetic bead-based assay (R&D Systems, Minneapolis, MN) on the Luminex platform
(Luminex, Austin, TX). Soluble ICAM-1 (sICAM-1, CD54) was measured using an ELISA
Gomez et al. Page 4
J Immunol. Author manuscript; available in PMC 2017 October 01.
Author M
anuscriptA
uthor Manuscript
Author M
anuscriptA
uthor Manuscript

(R&D Systems). Extracellular double-stranded DNA was measured using Quant-iT
PicoGreen dsDNA Assay Kit (Life Technologies, Grand Island, NY).
Immunostaining and flow cytometry
Isolated lung cells were incubated with FITC-conjugated antibody to the neutrophil-specific
marker Ly6G (clone 1A8, BD Pharmingen, San Diego, CA, USA) or the appropriate isotype
control at 4°C in the dark. Cells were washed with staining buffer to remove unbound
antibody. Labeling with Alexa Fluor 647-conjugated Annexin V and 7-AAD were
performed according to the manufacturer’s instructions (BioLegend, San Diego, CA).
Stained samples were analyzed using a CyAn ADP flow cytometer (Dako/Beckman-Coulter,
Brea, CA, USA). Flow cytometry data were analyzed using FCS Express software (De Novo
Software, Los Angeles, CA, USA).
Isolation of neutrophils from mouse lungs
Neutrophils were isolated from single cell suspensions using MACS beads (Miltenyi,
Auburn, CA) according to the manufacturer’s instructions. Briefly, single cell suspensions
were prepared from dissected mouse lungs as described above. The cells were washed with
PBS containing 2 mM EDTA and 0.5% bovine serum albumin, and incubated with biotin-
anti-Ly6G and magnetic beads coated with anti-biotin. The samples were passed through a
column in a magnetic field, and cells bound to beads were collected for further analysis.
Cells were kept at 4-8°C during staining and magnetic bead isolation.
RNA isolation
Total RNA was isolated using miRNeasy kits from Qiagen (Valencia, CA, USA).
mRNA profiling and data analysis
Expression of mRNA transcripts in whole lungs or isolated lung neutrophils (n=4 in each
group) was profiled using Affymetrix Mouse Gene 2.1 ST arrays (Santa Clara, CA, USA).
Microarray quality was assessed by whole array statistics as recommended by Affymetrix
using the Expression Console software. Microarray data were preprocessed by RMA
(Robust Multiarray Average) background correction, GC content and sequence correction,
quantile normalization, and median polish summarization, and expression levels compared
using ANOVA on log2 intensities to identify transcripts that were differentially expressed
between genotype and treatment groups. Differentially expressed (DE) mRNAs were filtered
at Benjamini-Hochberg FDR < 0.05, and fold change > 2, and expression patterns of DE
transcripts were visualized using hierarchical clustering. Expression analyses were
performed using Partek Genomics Suite (Partek Inc., St. Louis. MO, USA). Gene Set
Enrichment Analysis (GSEA) was performed according to the method described (12, 13). In
addition to gene sets derived from Gene Ontology (GO) biological processes, GSEA for
Nrf2 regulated genes was performed using lists of Nrf2 regulated genes from the literature
(14, 15).
Pulse oximetry and clinical signs of disease severity
Gomez et al. Page 5
J Immunol. Author manuscript; available in PMC 2017 October 01.
Author M
anuscriptA
uthor Manuscript
Author M
anuscriptA
uthor Manuscript

Heart rate, respiratory rate and percent arterial oxygen saturation were measured using a
MouseOx Plus pulse oximeter and physiological monitor fitted with a collar clip sensor
(Starr Life Sciences, Oakmont, PA) according to the manufacturer’s instructions. Values for
each parameter were averaged for at least 5 valid readings. Clinical signs of disease were
evaluated by two observers. Two different clinical scoring systems were used (16, 17). First,
disease scores were graded as follows: 0= no abnormal clinical signs, 1= ruffled fur but
lively, 2 = ruffled fur and moving slowly or immobile, 3=ruffled fur, hunched posture, eyes
not fully open, 4 = moribund, and 5=dead (16). Second, severity of illness was expressed as
the sum of scores in several categories (including level of activity, appearance, behavior and
respiration), with scores in each category ranging 0 to 5 from no signs of illness to most
severe (17). Mouse genotype was masked during clinical evaluation.
Statistics
Groups were compared using t tests, ANOVA or Fisher exact probability test, as appropriate.
Non-normally distributed data were compared using the non-parametric Wilcoxon-Mann-
Whitney U test or Kruskal-Wallis test. Differences between groups were considered
significant when p<0.05. The data are described as the mean + standard error of the mean
(SEM) unless otherwise indicated, and the number of animals in each group is provided. The
coefficient of variation (variance) was calculated as the mean/standard deviation. Statistical
analyses were performed using JMP (SAS, Cary, NC).
Accession code
Microarray data have been deposited into the Gene Expression Omnibus (http://
www.ncbi.nlm.nih.gov/geo/) under series GSE83615.
Results
Recruitment of neutrophils and neutrophil apoptosis
Thea recruitment of neutrophils into the airways and airspaces of the lungs was evaluated by
counting neutrophils in the BALF at 6 and 24 hours after instillation of S. pneumoniae, and
the total number of neutrophils in the lungs was measured using lung digests at 24 h.
Neutrophil migration into the broncho-alveolar space was less during very acute (6 h)
pneumonias in Nrf2 null compared to WT mice (Figure 1A). Morphometry using histologic
sections also showed significantly fewer neutrophils in the Nrf2 null than the WT mice at 6
h (Figure 1B), although the difference was less than in the BAL fluid (37% fewer
neutrophils when quantified morphometrically compared to 74% fewer in BALF) and the
variance in neutrophils/100 alveoli was greater in the Nrf2 null than WT mice (30% vs.
23%).
However, by 24 h of infection, the number of lavageable neutrophils was similar in both
genotypes (Figure 1A). Morphometric quantification of neutrophils within the alveoli also
showed no significant difference at 24 h (Figure 1B, p = 0.13), but the variance was greater
in the Nrf2 null compared to WT mice (27% vs. 19%). The total number of cells in the
pneumonic lung digests at 24 h was greater in the Nrf2 null mice than in the WT mice and
Gomez et al. Page 6
J Immunol. Author manuscript; available in PMC 2017 October 01.
Author M
anuscriptA
uthor Manuscript
Author M
anuscriptA
uthor Manuscript

this increase was due to neutrophils (Figure 1C-D). This correlated with qualitatively more
neutrophils within the alveolar-capillary wall observed morphologically.
At 24 h of infection, about 50% of lung neutrophils (Ly6G+) show early apoptotic changes
(Annexin V+, 7-AAD−), whereas only about 20% of the other lung cells (Ly6G−) display
these changes (Figure 1E). There was no difference between genotypes in the percentage of
lung neutrophils showing evidence of early apoptosis (Annexin V+, 7-AAD−) or in the
percentage demonstrating changes of late apoptosis or necrosis (Annexin V+, 7-AAD+,
Figure 1E). The number of apoptotic neutrophils tended to be higher in the Nrf2 null mice
compared with WT mice, reflecting the greater number of neutrophils in the lungs of Nrf2
null mice (27 ± 5.3 × 10⁶ vs. 14 ± 1.6 × 10⁶, p=0.07). There was no significant difference in
apoptotic or necrotic cells in non-neutrophil lung cells (Ly6G− cells, Figure 1E).
Total circulating leukocytes tended to be higher in Nrf2 null animals at 6 h and 24 h after
instillation of S. pneumoniae (Figure 2A), although this tendency did not reach statistical
significance. Importantly, circulating neutrophil counts in the two genotypes were not
different at either time after instillation of organisms (Figure 2B) Circulating lymphocytes
counts were slightly greater in Nrf2 null mice compared with WT mice at 24 h S. pneumoniae pneumonia (Figure 2C).
Lung injury, bacterial clearance from the lungs and bacterial dissemination
Lung injury, as assessed by the total protein present in the BALF, was not different between
genotypes at either time point (Figure 3A).
There was no significant difference in the body weights of the Nrf2 null and WT mice (21.3
+ 0.68 g, 22.5 + 0.96 g, respectively), and thus no difference in the number of S. pneumoniae instilled into the lungs (mean dose 5.7 ± 0.30 × 10⁶ per mouse, range 2.0-8.9 ×
106 CFU). The total number of bacterial CFUs recovered in the lungs of WT mice at 6 h was
48 ± 16 × 106, which was 7.6 times more than the number instilled (black bars in Figure 3B-
C). The lungs of Nrf2 null mice contained only 17.1 ± 3.4 × 10⁶, which was not quite
statistically significant compared to WT (p=0.06) and was 3.2 times the number instilled
(white bars in Figure 3B-C). Between 6 and 24 h, nearly all the bacteria were cleared from
both the WT and Nrf2 null lungs, but significantly fewer remained in the Nrf2 null than the
WT mice at 24 h (Figure 3D-E). This difference is mostly likely due to the trend toward
more killing and less initial proliferation in the early hours. There was no significant
difference in bacteremia when comparing the two genotypes at 6 h or 24 h, as measured by
the number of mice with spleens containing S. pneumoniae (Figure 3F).
Mortality, physiological and clinical assessments and bacterial clearance in mice given greater inocula of S. pneumoniae
Mortality depended on the inoculum size (Figure 4). At the inoculum used for the studies
presented in Figures 1-3 (dose 5.3 ± 0.49 × 10⁶ CFU per mouse, range 2.0-8.4 × 10⁶ CFU),
11 of 13 Nrf2 null mice and 18 of 18 WT mice survived at 24 h (15% compared to 0%
mortality, respectively, p=0.17 Freeman-Halton Fisher exact probability test). Over a 25-fold
increase in dose, there was a significant difference in mortality between genotypes. The
survival of Nrf2 null mice decreased as the inoculum size increased, whereas there was no
Gomez et al. Page 7
J Immunol. Author manuscript; available in PMC 2017 October 01.
Author M
anuscriptA
uthor Manuscript
Author M
anuscriptA
uthor Manuscript

change in survival of WT mice (Figure 4). At the highest dose, the survival of Nrf2 null mice
was 0% but was 100% in WT mice. Thus, the mortality depends on the number of infecting
S. pneumoniae only in Nrf2 null mice at the dose range used; the Nrf2 null mice are more
sensitive and show a dose-dependent increase in mortality not observed in WT mice.
At the middle dose (2.56 ± 0.17 × 10⁷ CFU), pulse oximetry showed a significant decrease
in arterial oxygen saturation in both genotypes at 24 h compared to 6 h after giving S. pneumoniae (Figure 5A). The decrease in % arterial oxygen saturation was similar in the
WT and Nrf2 null mice (−5.9%). There was no difference between genotypes in breath rate
or heart rate measured at the same time points (figure 5B and C). However, the change in the
heart rates observed between 6 h and 24 h did show significant differences between
genotypes. The mean change in heart beats per minute was +53.5 in the Nrf2 null and −71.5
in the WT mice (p<0.05, paired t test across genotypes or simple repeated measures).
Because the Nrf2 null mice also showed more ruffled fur and lethargy than WT mice,
clinical scoring systems were used to rigorously assess clinical features in WT and Nrf2 null
mice at 6 h and 24 h after instillation of S. pneumoniae. In the WT mice, the disease scores
and severity of illness were significantly lower at 24 h compared with 6 h (Figure 5D-E),
indicating improvement over this time period. In contrast, in the Nrf2 null mice, the disease
scores and severity of illness were significantly higher at 24 h compared with 6 h (Figure
5D-E), indicating a lack of resolution. The observed difference in clinical scores at the 6 h
and 24 h time points was statistically significant between genotypes (p<0.05, paired t test
across genotypes or simple repeated measures analysis). The percent change in body weight
was greater in the WT mice than in the Nrf2 null mice (Figure 5F). Taken together with the
increase in heart rate and the worse clinical scores, this difference in net change in body
weight suggests that hypotension, anasarca and potentially sepsis are occurring in the Nrf2
null mice.
At the middle and high doses of S. pneumoniae, the lungs of Nrf2 null mice were very red
and did not collapse, and the pleural space contained abundant fluid (up to 250 μl). In
contrast, the WT lungs were dark, and the pleural space contained a small amount of fluid.
Histology showed abscess formation, destruction of alveolar walls, and massive edema
formation in Nrf2 null mice that was not observed in WT mice, whose lungs contained a
neutrophilic infiltrate without abscess formation.
Due to the increased mortality in mutant mice at 24 h (Figure 4), bacterial clearance from
the lungs and bacterial dissemination were studied at 18 h after an intermediate or high dose
of S. pneumoniae. In mice given an intermediate dose of bacteria (2.28 ± 0.04 ×10⁷ CFU per
mouse, approximately 4.3 times higher than the low dose shown above), all the mice
survived at 18 h, and the ratio of recovered to instilled bacteria was 7-fold higher in the Nrf2
null mice compared to WT (Figure 6). In mice given an even higher dose (11.0 ± 0.18 × 10⁷
CFU per mouse, approximately 4.8 times higher than the intermediate dose and 21 times
higher than the low dose), 1 out of 5 WT mice and 3 out of 6 of the Nrf2 null mice died
before 18 hours had elapsed after instillation. In the mice that survived, the ratio of
recovered to instilled CFUs tended to be higher in the Nrf2 null mice compared to WT mice
but this difference was not statistically significant (Figure 6). All mice given the
Gomez et al. Page 8
J Immunol. Author manuscript; available in PMC 2017 October 01.
Author M
anuscriptA
uthor Manuscript
Author M
anuscriptA
uthor Manuscript

intermediate and high inocula had positive spleen cultures. Blood cultures were positive in
all mice except 2 of the 6 WT mice given the intermediate dose.
Oxidative stress and antioxidant capacity
Markers for oxidative stress and for total antioxidant capacity were assayed in the lungs of
WT and Nrf2 null mice given PBS or 2 different doses of S. pneumoniae (4.60 ± 0.09 ×10⁶
CFU per mouse or 2.34 ± 0.06 ×10⁷ CFU per mouse). In both genotypes, the pneumonic
lung weight was greater in mice given the high inoculum of S. pneumoniae compared with
that in mice given PBS or low dose S. pneumoniae, consistent with increased injury (Figure
7A). Oxidative stress was assessed using the TBARS assay, a commonly used screening
assay for lipid peroxidation (malondialdehyde). The levels of TBARS were less in mice
given high dose S. pneumoniae compared to PBS at 24 h, and there was no difference
between genotypes (Figure 7B). The decrease in TBARS between PBS and high inoculum
SP is consistent with a diluting effect of massive edema and abundant cell recruitment.
Antioxidant capacity was not significantly different between genotypes (Figure 7C). Thus,
tissue-level differences in the levels of oxidative stress are not likely to account for the
increased susceptibility observed in Nrf2 null mice during very acute pneumonia.
Expression of DAMPS, cytokines and chemokines
Based on this difference in mortality and histopathology between genotypes, the expression
of DAMPs, cytokines and chemokines was measured to test the hypothesis that these
markers of injury are increased in Nrf2 null mice. The lungs of mice given either a low or
high inoculum of S. pneumoniae (or PBS) were lavaged after either 6 or 24 h, and DAMPs,
cytokines and chemokines were measured (Tables I-IV). At 6 h, cytokines and chemokines
increased after either inoculum of S. pneumoniae, but there were no differences between
genotypes (Table I). dsDNA, sICAM-1, RAGE, S100A8, and S100A9, which are molecules
that can act as DAMPS, also increased, particularly after the higher inoculum. S100A8 and
S100A9 were significantly different between genotypes; curiously, the WT mice expressed
higher levels than the Nrf2 null mice (Table II). Although AREs in the murine promoter
regions of the S100A8 and S100A9 genes have not been reported, the human S100A9 gene
promoter contains two putative antioxidant response elements (18), suggesting that
expression of these murine proteins may be low due to the absence of Nrf2. At 24 h,
interestingly, the levels of TNF, KC and IL-12 (p70) were greater in the Nrf2 null compared
to WT mice given 6.2-6.9 × 10⁶ CFU S. pneumoniae per mouse (Table III). DAMPs were
increased in the presence of S. pneumoniae, but showed no differences between genotypes
(Table IV). Thus, Nrf2 null mice have increased mortality at higher inocula, lower levels of
two DAMPs (S100A8 and S100A9) at 6 h and greater expression of TNF, KC and IL-12
(p70) at 24 h.
Lung and neutrophil transcriptomes: mRNA profiles
Gene profiling of both lungs and neutrophils isolated from lungs was performed in Nrf2 null
and WT mice 24 h after instillation of S. pneumoniae (2.7-3.3 × 10⁶ CFU/mouse) or an
equivalent volume of PBS. Two approaches were taken to identify DE genes (DEGs): 1)
genes that were changed between genotypes given the same instillation (S. pneumoniae or
Gomez et al. Page 9
J Immunol. Author manuscript; available in PMC 2017 October 01.
Author M
anuscriptA
uthor Manuscript
Author M
anuscriptA
uthor Manuscript

PBS) or 2) genes that were changed by S. pneumoniae compared to PBS in each genotype,
and then the changed genes were compared between Nrf2 null and WT tissues.
Approach 1: Comparison of genotypes with S. pneumoniae and with no pneumonia (PBS)
Nrf2 null mice were made by targeting exon 5 of the Nfe2l2 gene, leading to deletion of the
280 C-terminal amino acid residues of the wild type Nrf2 protein and expression of a
chimeric protein containing Lacz (11). Expression of Nfe2l2 in lung neutrophils was much
less in Nrf2 null mice compared with WT (221-fold less in mice given PBS and 231-fold
less in mice given S. pneumoniae), as measured by probesets covering exon 5 of the wild
type Nfe2l2 gene. In the whole lung, expression of Nfe2l2 was also less in Nrf2 null mice
compared with WT (94-fold less in mice given PBS and 42-fold less in mice given S. pneumoniae).
Principal component analysis showed that the top 3 principal components accounted for
48.6% and 55.7% of the variance in samples from the lung and neutrophils, respectively
(Figure 8). Analyses of gene expression showed that there were 77 DEGs in lung tissue and
25 DEGs in neutrophils (Supplemental Table I). Of these 102 DEGs, there were 93 distinct
genes whose expression was changed between the genotypes following either S. pneumoniae or PBS or in both (Figures 9 and 10). Thus, these 93 DEGs constitute the Nrf2-regulated
genes in the lungs and neutrophils. Unsupervised hierarchical clustering using the combined
DEGs showed that the samples clustered into their respective groups (Figure 9), first by
tissue (lungs compared to neutrophils, second by treatment (S. pneumoniae compared to
PBS) and finally by genotype. It is also interesting to note that DEGs specifically selected
between Nrf2 null and WT mice were able to separate S. pneumoniae- and PBS-treated lung
or neutrophil samples, indicating a number of DEGs also respond to S. pneumoniae (Figure
9).
Comparisons across genotypes and treatment groups generated lists of the DEGs in lungs or
neutrophils from WT and Nrf2 null mice given S. pneumoniae or PBS (Figure 10 and Table
V). The expression of 9 genes was at least 2-fold less in Nrf2 null neutrophils and lungs
compared with WT samples given PBS and/or S. pneumoniae, including the known Nrf2
targets Nqo1, Srxn1, Gsta3 and Ces1g, as well as 4 predicted genes for which little is
known: Gm17046, Gm21075, Gm2163, and Gm3893, and a putative pseudogene
LOC100041536 (Table VI). The relative expression levels of all DE genes in whole lung
tissue and lung neutrophils are compiled in Supplemental Table I.
Concordant and/or more subtle changes in the expression of known Nrf2 targets were
detected using GSEA against custom gene sets consisting of known Nrf2 regulated genes.
GSEA can detect consistent small shifts of genes belonging to a functional group (set). Gene
sets consisting of known Nrf2 targets were significantly enriched in lung tissue and
neutrophils from WT mice, both uninfected (PBS treatment) and during S. pneumoniae pneumonia (Table VII).
To identify dysregulated pathways in lungs and neutrophils that may contribute to the
increased sensitivity of Nrf2 null mice during S. pneumoniae pneumonia, GSEA was
performed using many predefined gene sets involved in various pathways and biological
Gomez et al. Page 10
J Immunol. Author manuscript; available in PMC 2017 October 01.
Author M
anuscriptA
uthor Manuscript
Author M
anuscriptA
uthor Manuscript
processes derived from the public Gene Ontology (GO) database. These analyses showed
dysregulation of many processes in Nrf2 null lungs and neutrophils. The top gene sets for
lungs and neutrophils are shown in Tables VIII and IX. In lung tissues, the top processes that
are enriched in WT compared to Nrf2 null mice include three broad categories of
detoxification and antioxidant pathways, immune cell signaling, and olfactory processes
(Table VIII). The genes that accounted for this enrichment (and are defective in Nrf2 null
lungs) are provided in Supplemental Table II. Gene sets that are enriched in the neutrophils
of WT compared to Nrf2 null mice include six major categories, which are shown in Table
IX. The genes in our neutrophil profiles that account for this enrichment are also provided.
Interestingly, in addition, at least two GO processes describing pathways of extracellular
matrix structure and organization are enriched in WT compared to Nrf2 null neutrophils.
These genes include 7 collagen genes, one serine protease inhibitor (Serpinh1) known to
regulate collagen breakdown, 3 ADAMTS superfamily members that serve as
metalloproteinases acting on matrix proteins, and 56 other genes important in matrix
biology.
Comparison of gene expression in mice given PBS for 24 h revealed interesting differences
between genotypes that may help to understand the tendency toward more rapid clearance
and recruitment of fewer neutrophils at 6 hr after infection. Genes were identified that were
changed in Nrf2 null compared to WT lungs, numbering 53 when fold change is >2 or
numbering 112 when fold change is >1.5. Most interesting and helpful are the GSEA results
demonstrating that 4 GOs focused on phagocytosis (GO:0006910, GO:0038096, GO:
0002433, GO:0006911), 2 GOs describing Fc receptor pathways (GO:0002431, GO:
0038095), 1 GO describing classical activation of complement (GO:0006958), and 5
describing immunoglobulin regulation (GO:0001796, GO:0019731, GO:0019814, GO:
0042571, GO:0034987) were enriched in the Nrf2 null mice given PBS. The 22 genes that
accounted for the core enrichment in these 12 GOs are Ighg2b, Ighv1-83, Ighg2c, Ighv1-61,
Ighv1-62-3, Ighv1-73, Tulp1, Treml4, Aif1, Spon2, Adm, Ang4, Ltf, Tac1, Pgc, Spink5,
Fgb, Camp, Pla2g1b, C1s2, Mbl2 and Susd4. The GSEA results suggest immune
dysregulation occurred in the Nrf2 null mice at baseline, which may contribute to the initial
apparent enhanced host defense in Nrf2 null mice.
Approach 2: Genes changed in response to S. pneumoniae in Nrf2 null compared to WT mice
The number of transcripts that were changed more than 2-fold during S. pneumoniae pneumonia was determined by comparing S. pneumoniae-treated lungs with PBS controls of
the same genotype. S. pneumoniae induced a robust transcriptional response in lungs and
even more so in neutrophils from WT and Nrf2 null mice (Figure 11, Table X). These data
show that a greater percentage of changed genes were uniquely altered in the Nrf2 null
neutrophils compared to the lung tissue (44% versus 19%). Of these uniquely changed
genes, more were downregulated in the neutrophils than in the lung tissue (73% versus
42%). In whole lung tissue, the bacteria induced changes in expression of 1633 and 1686
mRNAs in WT and Nrf2 null mice, respectively (Figure 11). Even more mRNAs were found
to be changed by S. pneumoniae in lung neutrophils: 2563 and 4173 mRNAs in WT and
Nrf2 null samples, respectively. Of these changed genes, 603 were induced by S.
Gomez et al. Page 11
J Immunol. Author manuscript; available in PMC 2017 October 01.
Author M
anuscriptA
uthor Manuscript
Author M
anuscriptA
uthor Manuscript

pneumoniae in both genotypes in whole lung tissue and neutrophils (Figure 11). Notably, in
both whole lung tissue and neutrophils, there were hundreds of genes that were induced by
S. pneumoniae at least 2-fold in one genotype but not in the other (Table X). Adding the
criterion that the fold change must be more than 2.0 between genotypes led to identification
of fewer genes being different between Nrf2 null and WT mice (gene numbers are
summarized in Table XI and individual genes are listed in Supplemental Table III). A
number of these genes are known Nrf2 targets that were also identified as DEGs using
Approach 1 (for example, Ces1g), but many changed genes were novel genes about which
little is known. Interestingly, the upregulation of a number of proinflammatory genes was 2-
fold greater in Nrf2 null lungs compared with WT: Ccl4, Cxcl10, Il-6, and Saa3 (Supplemental Table III). Changes induced by S. pneumoniae in the expression of genes for
cytokines, chemokines and other inflammatory mediators are compared in Supplemental
Table IV.
Discussion
Nrf2 is a critical transcription factor that modules cytoprotective events induced by oxidative
stress and other stimuli (2). Its gene targets impact on many cellular functions (2, 14, 15,
19), many of which are important in numerous aspects of host defense and repair of lung
injury. Our studies examined the effect of Nrf2 deficiency on multiple parameters of host
defense in response to S. pneumoniae, the most common bacterial cause of community-
acquired pneumonia (20, 21). Nrf2 is a transcription factor, and its activation and function
are most accurately measured by its gene products. Identification of differentially expressed
genes (DEGs) may be helpful in understanding the mechanistic basis of the observed
phenotype. Therefore, extensive phenotyping and gene profiling of both lungs and
neutrophils isolated from lungs was performed in Nrf2 null and WT mice 24 h after
instillation of S. pneumoniae or PBS.
The phenotypes of Nrf2 null and WT mice were studied at two time points following
instillation of S. pneumoniae or PBS. At the early time point of 6 h after instillation of S. pneumoniae (mean dose 5.7 ± 0.30 × 10⁶ CFUs per mouse), the number of bacteria in the
lungs tended to be less (p=0.06), and fewer neutrophils were recruited in the Nrf2 null
compared to WT mice. Lung permeability, as measured by the concentration of protein in
the BALF, was similar in the two genotypes. Expression of chemokines and cytokines in
BALF was also similar, and lower levels of two DAMPs (S100A8 and S100A9) suggest that
tissue injury was less. These data show that the same number of bacteria was more rapidly
killed without recruiting as many neutrophils in Nrf2 null mice compared to WT mice.
These results suggest that the alveolar macrophages and airway epithelial cells of Nrf2 null
lungs may clear bacteria better than WT mice, perhaps due to accentuated defense
mechanisms already compensating for the deficiency in Nrf2, resulting in a slower and less
vibrant recruitment of neutrophils. The mRNA profiling shows that the comparison
describing the greatest number of differences was actually the uninfected control lungs (Nrf2
null compared to WT lungs after instillation of PBS), where 53 genes were differentially
expressed (Figure 10). Of these 53, 49 were less and 4 were more abundantly expressed in
the Nrf2 null mice. Furthermore, 30 of the 53 were altered in the uninfected lung and not
during S. pneumoniae pneumonia (Table V, Figure 10). Importantly, GSEA showed that
Gomez et al. Page 12
J Immunol. Author manuscript; available in PMC 2017 October 01.
Author M
anuscriptA
uthor Manuscript
Author M
anuscriptA
uthor Manuscript

gene sets involved in phagocytosis, Fc receptor function, complement and immunoglobulin
regulation are enhanced in PBS-treated Nrf2 gene profiles compared to those of WT mice,
and that 22 genes accounted for this core enrichment. It is possible that alterations in these
genes may allow more rapid clearance by altering the balance between a destructive
behavior in destroying bacteria and a reparative behavior in preventing lung injury.
Alternatively, it is possible that Nrf2 neutrophils may be less responsive to the same stimulus
and thus slower to migrate into the lungs, although that seems unlikely and does not account
for the lower number of bacteria in the lungs at 6 h.
At 24 h in the mice with pneumonia induced by 5-6×10⁶ CFUs per mouse, the number of
lavageable neutrophils was similar, the number of morphometrically determined alveolar
neutrophils was similar though more variable and tending toward greater, and the total
number of lung neutrophils was greater in the Nrf2 null than WT mice, despite similar
clearance of bacteria. Lung histology revealed the presence of more neutrophils within the
alveolo-capillary septae in the Nrf2 null mice, suggesting that the greater number of
neutrophils seen in the lung digests is due to this population. The percentages of early
apoptotic and late apoptotic/necrotic neutrophils were similar, suggesting that the rate of
neutrophil death was not altered by deficiency of Nrf2. The greater numbers of neutrophils
in the presence of similar numbers of bacteria may result from more tissue damage inducing
more neutrophil recruitment at this time point, due to the absence of upregulation of Nrf2-
dependent cytoprotective gene targets.
There was a striking difference in mortality between genotypes at higher inocula of S. pneumoniae. At 5.3 ± 0.49 × 10⁶ CFUs per mouse, the mortality of Nrf2 null mice was 15%,
at 3.2+0.7 × 10⁷ CFUs per mouse, mortality increased to 31%, and at 1.3 ± 0.02 × 10⁸ CFUs
per mouse, mortality was 100%. All three inocula resulted in no mortality of WT mice. In
Nrf2 mice, this mortality was associated with abscess formation, destruction of alveolar
walls, and massive edema formation, which did not occur in WT mice. The levels of TNF,
KC and IL-12 (p70) were greater in the Nrf2 null compared to WT mice. Thus, Nrf2 null
mice are more sensitive and show a dose-dependent increase in mortality not observed in
WT mice. This observation, combined with the observations that important pro-
inflammatory mediators are increased and more neutrophils are present in the lung digests of
Nrf2 null mice even at a low inoculum size, suggests that more lung damage is induced in
Nrf2 null than WT mice, inducing a greater neutrophilic response. Furthermore, Nrf2 null
mice may be more susceptible to sepsis. The blood and spleen cultures were positive at the
intermediate and high inocula, indicating that bacteremia had occurred, and the clinical
scores and the cardiovascular physiologic measures suggest that there was a greater systemic
response in the Nrf2 null mice.
Our observations can be compared with studies of other lung infections. In mouse models of
lung inflammation and injury, Nrf2 deficiency leads to greater inflammation associated with
increased expression of cytokines and other pro-inflammatory genes, NF-κB activation and
TNF production, whereas activation of Nrf2 can enhance bacterial clearance and innate
immune cell function (4, 5, 7-9, 22). These data suggest that enhancing Nrf2 activation may
be beneficial in treatment of lung infections. However, studies in cancer and other diseases
suggest that Nrf2 is a doubled edged sword (23, 24). Nrf2-mediated antioxidant and
Gomez et al. Page 13
J Immunol. Author manuscript; available in PMC 2017 October 01.
Author M
anuscriptA
uthor Manuscript
Author M
anuscriptA
uthor Manuscript

cytoprotective mechanisms are required for normal cells to survive carcinogenic agents as
well as environmental and infectious insults, but cancer cells can hijack antioxidant
mechanisms to survive and proliferate.
The major source of oxidants in neutrophils is the phagocyte NADPH oxidase. NADPH
oxidase generates oxidants in granules or at the plasma membrane, and whether these
oxidants induce activation of Nrf2 through dissociation of Keap1 in the cytoplasm and
translocation of Nrf2 into the nucleus has not been directly demonstrated, to our knowledge.
NADPH oxidase deficient mice show a partial defect in the protein levels of Nqo1, an Nrf2
target gene, both at baseline and in response to acid injury in the lung (25). In contrast, Nqo1 mRNA is similar between WT and NADPH oxidase deficient cells and significantly less in
Nrf2 null and Nrf2 null/NADPH oxidase null peritoneal macrophages (5). Studies in the
literature suggest that interactions and feedback between oxidants, NADPH oxidase and
Nrf2 regulate the inflammatory response during pulmonary infection (5, 26). For example,
NADPH oxidase deficiency improved survival of Nrf2 deficient mice in mouse models of
sepsis, in part by repressing TLR4 signaling (5).
The literature describes a number of Nrf2-regulated targets, and these likely depend upon the
cell type and the circumstances of the particular study (15, 19, 27). A goal of our study was
to define a set of genes that are regulated either directly or indirectly by Nrf2 in lung tissue,
with all cells taken together, and in lung neutrophils (Supplemental Table I). Our results
show that both the uninfected lung tissue and the neutrophils isolated from PBS control
lungs, which are mostly intracapillary neutrophils, express Nrf2 target genes, some of which
are common and others unique to the tissue origin. The pneumonic lungs also express Nrf2
target genes, some of which are unique to the tissue or to the infection. These genes likely
reflect the cumulative responses of many cell types, as well as the influx of cells not present
in uninfected lungs (primarily neutrophils but some monocytes/macrophages and perhaps
even lymphocytes at 24 h). Neutrophils from pneumonic lungs express genes unique to this
cell type and to the infection. Many of these Nrf2-regulated genes contain AREs and are
thus likely to be directly regulated by Nrf2 binding to promoter regions, and these genes are
often described as Nrf2 target genes. However, many have not been characterized to have
AREs in their promoter regions and are likely regulated indirectly by Nrf2. For example,
changes in the antioxidant status of the lungs may activate Nrf2-independent mechanisms of
antioxidant signaling. However, these compensatory defense mechanisms are clearly not
sufficient for cytoprotection and may in fact contribute to the increased mortality observed in
Nrf2 null mice during high-dose bacterial pneumonia.
The enriched GO processes often suggest differences in metabolic processes and pathways
important in tissue development. These observations are particularly interesting in light of
the fact that lung repair often recapitulates developmental processes (28, 29). The lung
mRNA profiling also shows that processes and pathways important in T cell biology are
altered. Perhaps most interesting is the observation that GO processes identified in
neutrophils from pneumonic lungs include highly significant evidence of pathways of altered
extracellular matrix and structure. This observation, along with the observation that
developmental processes also important in lung repair may be defective, may underlie the
observation of the dose-dependent increase in mortality and the greater lung destruction at
Gomez et al. Page 14
J Immunol. Author manuscript; available in PMC 2017 October 01.
Author M
anuscriptA
uthor Manuscript
Author M
anuscriptA
uthor Manuscript

higher inoculum sizes. Hence, the phenotype observed in Nrf2 deficiency signifies a
complex interrelationship between oxidative stress, inflammation, the immune response, and
tissue injury and repair.
In summary, early in pneumonia, clearance of S. pneumoniae is greater and neutrophil
recruitment is less in Nrf2 null mice. Later, bacterial clearance is similar and the
accumulation of lung neutrophils is greater, mostly likely due to neutrophils responding to
more tissue damage at this later time, due to the absence of upregulation of Nrf2-dependent
cytoprotective gene targets. Mortality increases as the number of instilled bacteria increases
only in the Nrf2 null mice, and we provide evidence that this may be due to both more lung
injury and systemic inflammatory responses. Gene profiling of both lung neutrophils and
whole lung tissue identifies Nrf2-regulated genes following both PBS instillation and S. pneumoniae pneumonia. Differentially regulated genes and pathways in neutrophils and in
whole lung tissue included not only those involved in the response to redox stress (as
expected), but also genes and pathways involved in inflammation, immunoregulatory
pathways and tissue repair, providing insight into the mechanisms for the greater tissue
damage and increased neutrophil accumulation. To our knowledge this study is the first to
survey the role of Nrf2 in regulating neutrophil gene expression during acute bacterial
pneumonia and one of the few to address the role of Nrf2 in acute infections in vivo, thus
providing new insight into the mechanisms for the greater tissue damage and increased
neutrophil accumulation.
Supplementary Material
Refer to Web version on PubMed Central for supplementary material.
Acknowledgments
The authors thank Dr. W. June Brickey for interesting and helpful discussions, Michael J. Vernon, Director of the Functional Genomics Core and Kimberlie Burns, Director of the Marsico Lung Institute Histology Core.
Supported by: HL 048160, HL 052466, HL 114388, T32 HL007106, UH2HL 123645 and P30 CA016086 to the UNC Lineberger Comprehensive Cancer Center
The UNC Flow Cytometry Core Facility is supported in part by P30 CA016086 Cancer Center Core Support Grant to the UNC Lineberger Comprehensive Cancer Center.
References
1. Nguyen T, Sherratt PJ, Huang HC, Yang CS, Pickett CB. Increased protein stability as a mechanism that enhances Nrf2-mediated transcriptional activation of the antioxidant response element. Degradation of Nrf2 by the 26 S proteasome. J. Biol. Chem. 2003; 278:4536–4541. [PubMed: 12446695]
2. Ma Q. Role of nrf2 in oxidative stress and toxicity. Annu. Rev. Pharmacol. Toxicol. 2013; 53:401–426. [PubMed: 23294312]
3. Cho HY, Kleeberger SR. Association of Nrf2 with airway pathogenesis: lessons learned from genetic mouse models. Arch. Toxicol. 2015; 89:1931–1957. [PubMed: 26194645]
4. Thimmulappa RK, Lee H, Rangasamy T, Reddy SP, Yamamoto M, Kensler TW, Biswal S. Nrf2 is a critical regulator of the innate immune response and survival during experimental sepsis. J. Clin. Invest. 2006; 116:984–995. [PubMed: 16585964]
Gomez et al. Page 15
J Immunol. Author manuscript; available in PMC 2017 October 01.
Author M
anuscriptA
uthor Manuscript
Author M
anuscriptA
uthor Manuscript

5. Kong X, Thimmulappa R, Kombairaju P, Biswal S. NADPH oxidase-dependent reactive oxygen species mediate amplified TLR4 signaling and sepsis-induced mortality in Nrf2-deficient mice. J. Immunol. 2010; 185:569–577. [PubMed: 20511556]
6. Athale J, Ulrich A, Chou Macgarvey N, Bartz RR, Welty-Wolf KE, Suliman HB, Piantadosi CA. Nrf2 promotes alveolar mitochondrial biogenesis and resolution of lung injury in Staphylococcus aureus pneumonia in mice. Free radical biology & medicine. 2012; 53:1584–1594. [PubMed: 22940620]
7. Chang AL, Ulrich A, Suliman HB, Piantadosi CA. Redox regulation of mitophagy in the lung during murine Staphylococcus aureus sepsis. Free radical biology & medicine. 2015; 78:179–189. [PubMed: 25450328]
8. Harvey CJ, Thimmulappa RK, Sethi S, Kong X, Yarmus L, Brown RH, Feller-Kopman D, Wise R, Biswal S. Targeting Nrf2 signaling improves bacterial clearance by alveolar macrophages in patients with COPD and in a mouse model. Sci Transl Med. 2011; 3:78ra32.
9. Reddy NM, Suryanarayana V, Kalvakolanu DV, Yamamoto M, Kensler TW, Hassoun PM, Kleeberger SR, Reddy SP. Innate immunity against bacterial infection following hyperoxia exposure is impaired in NRF2-deficient mice. J. Immunol. 2009; 183:4601–4608. [PubMed: 19734219]
10. Yamada M, Gomez JC, Chugh PE, Lowell CA, Dinauer MC, Dittmer DP, Doerschuk CM. Interferon-{gamma} Production by Neutrophils during Bacterial Pneumonia in Mice. Am. J. Respir. Crit. Care Med. 2011; 183:1391–1401. [PubMed: 21169470]
11. Itoh K, Chiba T, Takahashi S, Ishii T, Igarashi K, Katoh Y, Oyake T, Hayashi N, Satoh K, Hatayama I, Yamamoto M, Nabeshima Y. An Nrf2/small Maf heterodimer mediates the induction of phase II detoxifying enzyme genes through antioxidant response elements. Biochem. Biophys. Res. Commun. 1997; 236:313–322. [PubMed: 9240432]
12. Subramanian A, Tamayo P, Mootha VK, Mukherjee S, Ebert BL, Gillette MA, Paulovich A, Pomeroy SL, Golub TR, Lander ES, Mesirov JP. Gene set enrichment analysis: a knowledge-based approach for interpreting genome-wide expression profiles. Proceedings of the National Academy of Sciences of the United States of America. 2005; 102:15545–15550. [PubMed: 16199517]
13. Mootha VK, Lindgren CM, Eriksson KF, Subramanian A, Sihag S, Lehar J, Puigserver P, Carlsson E, Ridderstrale M, Laurila E, Houstis N, Daly MJ, Patterson N, Mesirov JP, Golub TR, Tamayo P, Spiegelman B, Lander ES, Hirschhorn JN, Altshuler D, Groop LC. PGC-1alpha-responsive genes involved in oxidative phosphorylation are coordinately downregulated in human diabetes. Nat. Genet. 2003; 34:267–273. [PubMed: 12808457]
14. Cho HY, Kleeberger SR. Nrf2 protects against airway disorders. Toxicol. Appl. Pharmacol. 2010; 244:43–56. [PubMed: 19646463]
15. Malhotra D, Portales-Casamar E, Singh A, Srivastava S, Arenillas D, Happel C, Shyr C, Wakabayashi N, Kensler TW, Wasserman WW, Biswal S. Global mapping of binding sites for Nrf2 identifies novel targets in cell survival response through ChIP-Seq profiling and network analysis. Nucleic Acids Res. 2010; 38:5718–5734. [PubMed: 20460467]
16. van Faassen H, KuoLee R, Harris G, Zhao X, Conlan JW, Chen W. Neutrophils play an important role in host resistance to respiratory infection with Acinetobacter baumannii in mice. Infect. Immun. 2007; 75:5597–5608. [PubMed: 17908807]
17. Huet O, Ramsey D, Miljavec S, Jenney A, Aubron C, Aprico A, Stefanovic N, Balkau B, Head GA, de Haan JB, Chin-Dusting JP. Ensuring animal welfare while meeting scientific aims using a murine pneumonia model of septic shock. Shock. 2013; 39:488–494. [PubMed: 23603767]
18. Sumi D, Shimizu Y, Himeno S. Involvement of Nrf2 activation in the upregulation of S100A9 by exposure to inorganic arsenite. Int. J. Mol. Med. 2013; 31:259–264. [PubMed: 23165982]
19. Chorley BN, Campbell MR, Wang X, Karaca M, Sambandan D, Bangura F, Xue P, Pi J, Kleeberger SR, Bell DA. Identification of novel NRF2-regulated genes by ChIP-Seq: influence on retinoid X receptor alpha. Nucleic Acids Res. 2012; 40:7416–7429. [PubMed: 22581777]
20. Bartlett JG. Diagnostic tests for agents of community-acquired pneumonia. Clin. Infect. Dis. 2011; 52(Suppl 4):S296–304. [PubMed: 21460288]
21. Jain S, Self WH, Wunderink RG, Team CES. Community-Acquired Pneumonia Requiring Hospitalization. The New England journal of medicine. 2015; 373:2382. [PubMed: 26650159]
Gomez et al. Page 16
J Immunol. Author manuscript; available in PMC 2017 October 01.
Author M
anuscriptA
uthor Manuscript
Author M
anuscriptA
uthor Manuscript

22. Kong X, Thimmulappa R, Craciun F, Harvey C, Singh A, Kombairaju P, Reddy SP, Remick D, Biswal S. Enhancing Nrf2 pathway by disruption of Keap1 in myeloid leukocytes protects against sepsis. Am. J. Respir. Crit. Care Med. 2011; 184:928–938. [PubMed: 21799073]
23. Hayes JD, McMahon M. The double-edged sword of Nrf2: subversion of redox homeostasis during the evolution of cancer. Mol. Cell. 2006; 21:732–734. [PubMed: 16543142]
24. Sporn MB, Liby KT. NRF2 and cancer: the good, the bad and the importance of context. Nat. Rev. Cancer. 2012; 12:564–571. [PubMed: 22810811]
25. Davidson BA, Vethanayagam RR, Grimm MJ, Mullan BA, Raghavendran K, Blackwell TS, Freeman ML, Ayyasamy V, Singh KK, Sporn MB, Itagaki K, Hauser CJ, Knight PR, Segal BH. NADPH oxidase and Nrf2 regulate gastric aspiration-induced inflammation and acute lung injury. J. Immunol. 2013; 190:1714–1724. [PubMed: 23296708]
26. Segal BH, Han W, Bushey JJ, Joo M, Bhatti Z, Feminella J, Dennis CG, Vethanayagam RR, Yull FE, Capitano M, Wallace PK, Minderman H, Christman JW, Sporn MB, Chan J, Vinh DC, Holland SM, Romani LR, Gaffen SL, Freeman ML, Blackwell TS. NADPH oxidase limits innate immune responses in the lungs in mice. PloS one. 2010; 5:e9631. [PubMed: 20300512]
27. Thimmulappa RK, Mai KH, Srisuma S, Kensler TW, Yamamoto M, Biswal S. Identification of Nrf2-regulated genes induced by the chemopreventive agent sulforaphane by oligonucleotide microarray. Cancer Res. 2002; 62:5196–5203. [PubMed: 12234984]
28. Warburton D, Tefft D, Mailleux A, Bellusci S, Thiery JP, Zhao J, Buckley S, Shi W, Driscoll B. Do lung remodeling, repair, and regeneration recapitulate respiratory ontogeny? Am. J. Respir. Crit. Care Med. 2001; 164:S59–62. [PubMed: 11734468]
29. Whitsett JA, Haitchi HM, Maeda Y. Intersections between pulmonary development and disease. Am. J. Respir. Crit. Care Med. 2011; 184:401–406. [PubMed: 21642246]
Gomez et al. Page 17
J Immunol. Author manuscript; available in PMC 2017 October 01.
Author M
anuscriptA
uthor Manuscript
Author M
anuscriptA
uthor Manuscript

Figure 1. Neutrophil recruitment in WT and Nrf2 null mice at 6 and 24 hours after inoculation of S. pneumoniae and the proportion of neutrophils and other lung cells that are apoptotic. The
number of neutrophils recruited to the pneumonic lung was determined using three
approaches. The number of lavageable neutrophils was less in Nrf2 null mice at the very
early time point, but caught up and was similar by 24 hours, n=10 (A). Neutrophil
recruitment into air spaces of the distal lung was assessed by morphometry, n=5 (B).
Enzymatic digestion of the pneumonic lung was used to determine the total number of cells
(C) and neutrophils (D) in the pneumonic lung 24 h after instillation, n=6. There was no
significant difference between genotypes in the percentage of neutrophils (Ly6G+) or other
cells in the pneumonic lung (Ly6G−) showing no apoptosis (Annexin V−, 7-AAD−), early
apoptosis (Annexin V+, 7-AAD−) or late apoptosis/necrosis (Annexin V+, 7-AAD+), n=6
(E). Cell fragments and debris were gated out based on side- and forward-scatter, and intact
cells were used in the analysis. Of the intact cells, neutrophils were identified by staining
with Ly6G. Data are combined from at least 2 experiments and expressed as the mean ±
SEM. BALF, bronchoalveolar lavage fluid; SP, S. pneumoniae.
Gomez et al. Page 18
J Immunol. Author manuscript; available in PMC 2017 October 01.
Author M
anuscriptA
uthor Manuscript
Author M
anuscriptA
uthor Manuscript

Figure 2. Leukocyte counts in WT and Nrf2 null mice during pneumonia. Circulating leukocyte (A),
neutrophil (B) and lymphocyte (C) counts at 6 and 24 h after instillation of S. pneumoniae.
Data are expressed as the mean ± SEM (n=4-7). SP: S. pneumoniae.
Gomez et al. Page 19
J Immunol. Author manuscript; available in PMC 2017 October 01.
Author M
anuscriptA
uthor Manuscript
Author M
anuscriptA
uthor Manuscript

Figure 3. Protein in the BAL fluid, bacterial clearance in the lung and bacteria in the spleen at 6 h and
24 h after giving SP (mean dose 5.7 ± 0.30 × 10⁶ CFU per mouse, range 2.0-8.9 × 10⁶
CFU). Lung injury was assessed by measuring total protein in BAL fluid (A). The number
and ratio of recovered to instilled bacteria at 6 h (B and C) and 24 h (D and E) in the
pneumonic lung was determined by colony counting on agar plates. Systemic bacterial
dissemination was determined by the presence of culturable bacteria in the spleen (F). Data
are expressed as the mean ± SEM, n=10 from at least 2 experiments. SP: S. pneumoniae.
Gomez et al. Page 20
J Immunol. Author manuscript; available in PMC 2017 October 01.
Author M
anuscriptA
uthor Manuscript
Author M
anuscriptA
uthor Manuscript

Figure 4. Survival of WT and Nrf2 null mice at 24 h after instillation of S. pneumoniae. Survival of
Nrf2 null mice depended on inoculum size and was 0% at the highest dose, whereas all WT
mice survived regardless of the dose, n=6-22 from 3 separate studies.
Gomez et al. Page 21
J Immunol. Author manuscript; available in PMC 2017 October 01.
Author M
anuscriptA
uthor Manuscript
Author M
anuscriptA
uthor Manuscript
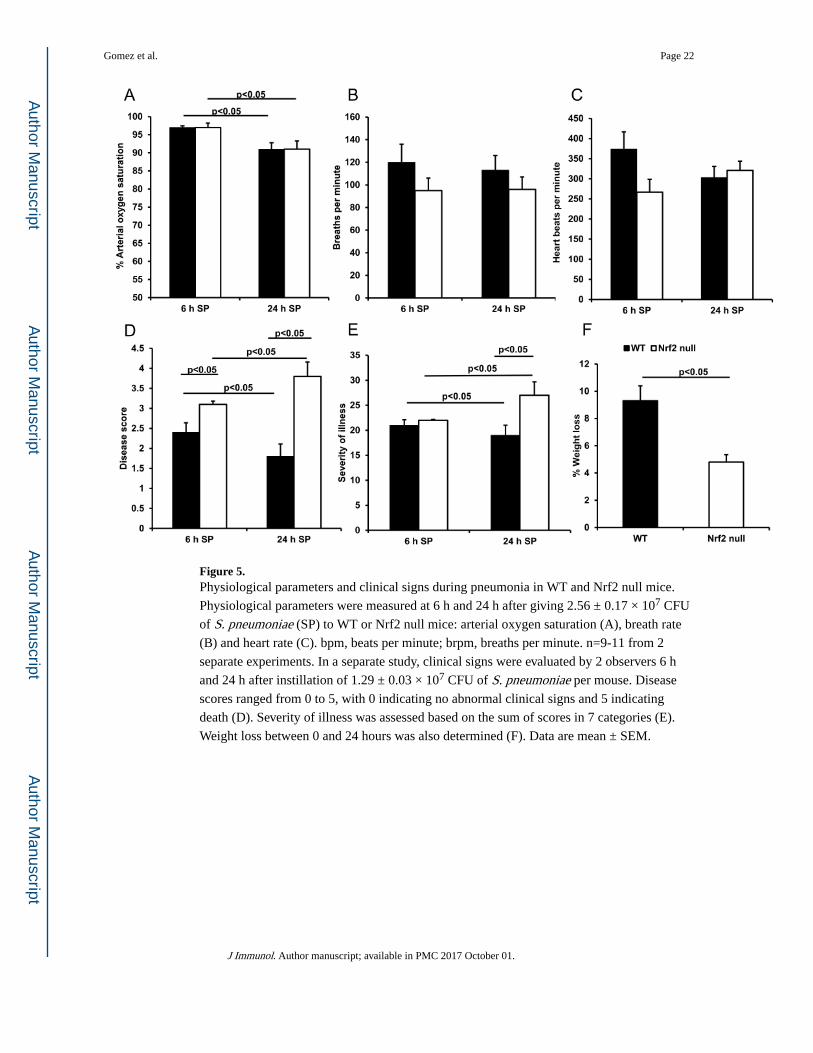
Figure 5. Physiological parameters and clinical signs during pneumonia in WT and Nrf2 null mice.
Physiological parameters were measured at 6 h and 24 h after giving 2.56 ± 0.17 × 10⁷ CFU
of S. pneumoniae (SP) to WT or Nrf2 null mice: arterial oxygen saturation (A), breath rate
(B) and heart rate (C). bpm, beats per minute; brpm, breaths per minute. n=9-11 from 2
separate experiments. In a separate study, clinical signs were evaluated by 2 observers 6 h
and 24 h after instillation of 1.29 ± 0.03 × 10⁷ CFU of S. pneumoniae per mouse. Disease
scores ranged from 0 to 5, with 0 indicating no abnormal clinical signs and 5 indicating
death (D). Severity of illness was assessed based on the sum of scores in 7 categories (E).
Weight loss between 0 and 24 hours was also determined (F). Data are mean ± SEM.
Gomez et al. Page 22
J Immunol. Author manuscript; available in PMC 2017 October 01.
Author M
anuscriptA
uthor Manuscript
Author M
anuscriptA
uthor Manuscript
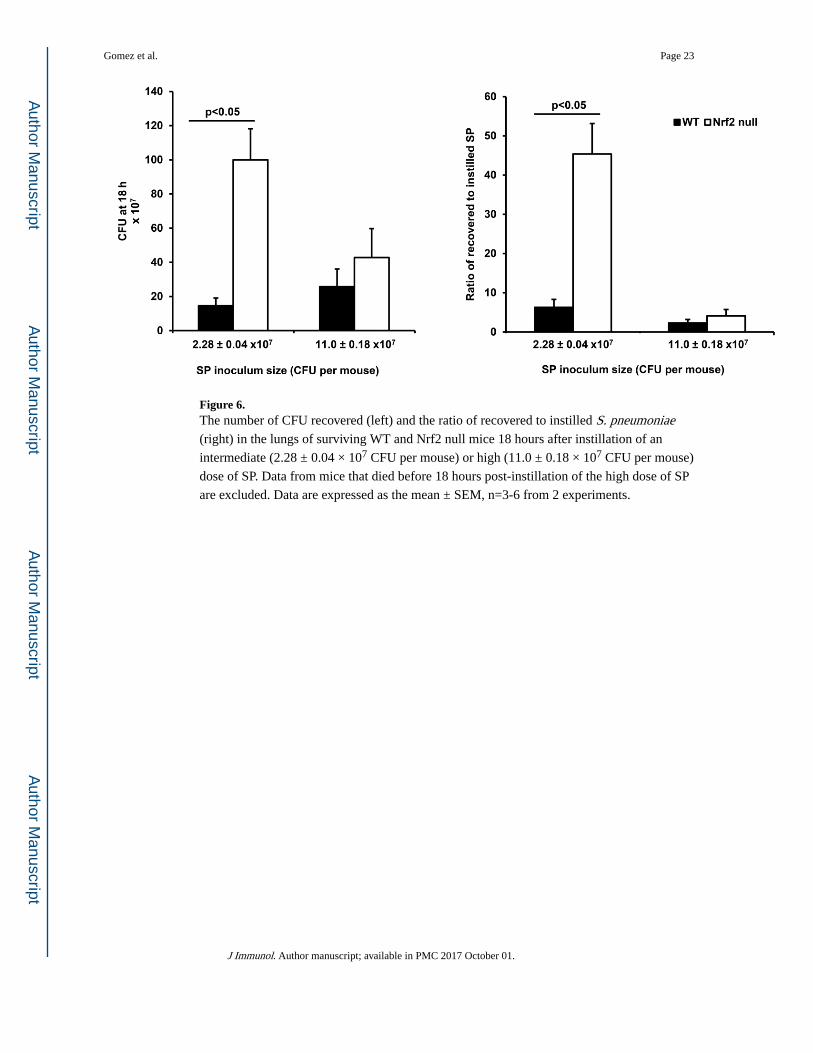
Figure 6. The number of CFU recovered (left) and the ratio of recovered to instilled S. pneumoniae (right) in the lungs of surviving WT and Nrf2 null mice 18 hours after instillation of an
intermediate (2.28 ± 0.04 × 10⁷ CFU per mouse) or high (11.0 ± 0.18 × 10⁷ CFU per mouse)
dose of SP. Data from mice that died before 18 hours post-instillation of the high dose of SP
are excluded. Data are expressed as the mean ± SEM, n=3-6 from 2 experiments.
Gomez et al. Page 23
J Immunol. Author manuscript; available in PMC 2017 October 01.
Author M
anuscriptA
uthor Manuscript
Author M
anuscriptA
uthor Manuscript

Figure 7. Oxidative stress and antioxidant capacity in lung tissue in WT and Nrf2 null mice. The
weight of the pneumonic lung is significantly greater in mice given a high dose of S. pneumoniae (2.34 ± 0.06 ×10⁷ CFU per mouse) compared with that in mice given either
PBS or a lower dose of S. pneumoniae (4.60 ± 0.09 ×10⁶ CFU per mouse) (A).
Thiobarbituric Acid Reactive Substances (TBARS) were measured in the pneumonic lungs
of WT and Nrf2 null mice as a marker of oxidative stress, expressed in μM TBARS (B).
Antioxidant capacity was also assessed and expressed as mM Trolox equivalents (C). Data
are expressed as the mean ± SEM. n=5-7 from 3 experiments. SP, S. pneumoniae.
Gomez et al. Page 24
J Immunol. Author manuscript; available in PMC 2017 October 01.
Author M
anuscriptA
uthor Manuscript
Author M
anuscriptA
uthor Manuscript

Figure 8. Principal component analysis (PCA) of mRNA expression data showing the contribution of
the top 3 principal components to the variance in whole lung tissue (left panel, accounting
for 48.6% of the variance) and lung neutrophils (right panel, accounting for 55.7% of the
variance) from WT mice (squares) and Nrf2 null mice (triangles) that received PBS (red) or
S. pneumoniae (blue). Each symbol represents a mouse (n=4 in each group).
Gomez et al. Page 25
J Immunol. Author manuscript; available in PMC 2017 October 01.
Author M
anuscriptA
uthor Manuscript
Author M
anuscriptA
uthor Manuscript

Figure 9. Unsupervised hierarchical clustering of 93 differentially expressed genes (DEGs) between
genotypes given either S. pneumoniae (SP) or PBS. The dendrograms show the results of
hierarchical clustering across samples (right) or across DEGs (top). The heat map depicts the
normalized intensity values for 93 DE mRNAs (bright blue for lower expression levels and
bright red for high expression levels). Each row represents a lung neutrophil or whole lung
tissue sample from a mouse given PBS or S. pneumoniae (as labeled) and each column
represents a DE mRNA. As described in the text, differentially expressed mRNA transcripts
between genotypes and treatment groups were identified by filtering at Benjamini-Hochberg
FDR < 0.05 and fold change > 2.
Gomez et al. Page 26
J Immunol. Author manuscript; available in PMC 2017 October 01.
Author M
anuscriptA
uthor Manuscript
Author M
anuscriptA
uthor Manuscript

Figure 10. Venn diagram showing the numbers of shared and unique DEGs (Benjamini-Hochberg FDR
< 0.05, and fold change > 2) in lungs or neutrophils when comparing WT with Nrf2 null
mice given S. pneumoniae or PBS. Numbers in parentheses indicate the total number of
DEGs for each indicated comparison. Neu, neutrophils.
Gomez et al. Page 27
J Immunol. Author manuscript; available in PMC 2017 October 01.
Author M
anuscriptA
uthor Manuscript
Author M
anuscriptA
uthor Manuscript

Figure 11. Venn diagram showing the numbers of shared and unique genes whose expression levels
significantly changed in response to S. pneumoniae in either lung neutrophils or whole lung
tissue from WT or Nrf2 null mice. mRNA expression levels were compared between PBS-
and S. pneumoniae-treated samples from each genotype to identify genes whose expression
levels significantly changed during S. pneumoniae pneumonia (Benjamini-Hochberg FDR <
0.05, and fold change > 2). The lists of S. pneumoniae-responsive genes were then compared
across sample types and genotypes to identify genes that are potentially regulated by Nrf2 in
the host response to S. pneumoniae. The total numbers of genes changed during pneumonia
are included in parentheses. Neu, neutrophils.
Gomez et al. Page 28
J Immunol. Author manuscript; available in PMC 2017 October 01.
Author M
anuscriptA
uthor Manuscript
Author M
anuscriptA
uthor Manuscript

Author M
anuscriptA
uthor Manuscript
Author M
anuscriptA
uthor Manuscript
Gomez et al. Page 29
Table I
Cytokines measured in BAL fluid at 6 h after instillation of PBS or S. pneumoniae (SP) in WT or Nrf2 null
mice
Analyte(pg/mL)
WT Nrf2 null
PBS (n=7)
S.pneumoniae2.36 ± 0.048× 10⁶ CFUper mouse
(n=5)
S.pneumoniae5.82 ± 0.43 ×10⁷ CFU per
mouse(n=8)
PBS (n=7)
S.pneumoniae2.16 ± 0.036× 10⁶ CFUper mouse
(n=5)
S.pneumoniae5.14 ± 0.31 ×10⁷ CFU per
mouse(n=11)
IL-1a <LLOQ 7.5 ± 0.77a 21 ± 1.5 *0.39
(n=1),<LLOQ(n=6)
9.7 ± 1.6 * 18 ± 2.0 *
IL-1b1.8 ± 0.76
(n=3),<LLOQ (n=4)
42 ± 4.2 126 ± 14 *3.8 ± 0.85
(n=5),<LLOQ(n=2)
37 ± 7.9 100 ± 14 *
IL-2 0.43 ± 0.03 1.9 ± 0.69 * 2.3 ± 0.16 * 0.61 ± 0.08 1.6 ± 0.24 2.0 ± 0.19 *
IL-3 0.51± 0.03 2.4 ± 0.91 * 3.0 ± 0.18 * 0.63 ± 0.06 1.6 ± 0.25 3.0 ± 0.21 *
IL-4 1.1 ± 0.03 3.9 ± 0.16 * 4.8 ± 0.24 * 1.1 ± 0.02 3.5 ± 0.57 * 4.6 ± 0.38 *
IL-5 1.1 ± 0.04 3.1 ± 0.72 * 7.2 ± 0.94 * 1.2 ± 0.22 2.8 ± 0.62 * 9.5 ± 0.80 *
IL-6 49 ± 44 275 ± 46 * 4159 ± 574 * 2.4 ± 0.97 185 ± 76 * 4189 ± 493 *
IL-100.09 ± 0.00(n=3),<LLO
Q (n=4)8.3 ± 1.5 * 12 ± 0.55 *
0.68 ± 0.25(n=3),<LLOQ
(n=4)6.9 ± 1.5 * 12 ± 0.84 *
IL-12(p40) 13 ± 0.93 83 ± 25 * 46 ± 4.8 25 ± 5.7 82 ± 21 * 65 ± 8.4
IL-12(p70) 4.0 ± 1.8 50 ± 21 * 59 ± 2.0 * 1.9 ± 0.28 25 ± 6.1 63 ± 2.9 *
IL-13 ND 43 ± 12 * 47 ± 1.9 *7.0 ± 3.4
(n=3),<LLOQ(n=4)
33 ± 5.7 * 46 ± 2.9 *
IL-17A 1.7 ± 0.06 4.4 ± 1.1 15 ± 2.5 * 1.8 ± 0.19 3.3 ± 0.44 21 ± 2.4 *
Eotaxin212 ± 103
(n=2),<LLOQ (n=5)
754 ± 124 * 1060 ± 50 *468 ± 49
(n=5),<LLOQ(n=2)
767 ± 122* 1072 ± 51 *
G-CSF 11 ± 5.8 119 ± 13 4296 ± 269 * 8.6 ± 3.1 127 ± 22 3401 ± 461 *
GM-CSF ND26 ± 2.8
(n=4)<LLOQ(n=1)
247 ± 79 * ND26 ± 9.2
(n=2)<LLOQ(n=3)
167 ± 50
IFN-γ ND 9.2 ± 7.6 7.3 ± 0.54 ND 2.6 ± 1.3 6.9 ± 1.0
KC 9.2 ± 4.5 646 ± 63 3676 ± 394 * 4.6 ± 0.98 595 ± 144 3219 ± 312 *
MCP-1 12 ± 1.5 68 ± 9.4 834 ± 194 * 13 ± 2.2 62 ± 11 1022 ± 156 *
MIP-1α ND 3168 ± 255 * 1735 ± 338 ND 3026 ± 962 * 1524 ± 376
MIP-1β 0.69 ± 0.09 147 ± 25 21 ± 5.0 1.3 ± 0.42 247 ± 95 * 93 ± 50
RANTES0.12 ± 0.03(n=6),<LLO
Q (n=1)6.7 ± 1.4 * 6.9 ± 1.0 * 0.20 ± 0.09 5.6 ± 2.4 * 6.1 ± 0.65 *
TNF 2.5 ± 0.16 5228 ± 626 * 3109 ± 518 * 2.7 ± 0.2 4952 ± 1283* 4200 ± 756 *
J Immunol. Author manuscript; available in PMC 2017 October 01.

Author M
anuscriptA
uthor Manuscript
Author M
anuscriptA
uthor Manuscript
Gomez et al. Page 30
Values are mean ± SEM. <LLOQ , samples with values below the lower limit of quantitation for the assay. These values are not included in the calculation of the mean and SEM. For multiple comparisons using ANOVA and Tukey-Kramer HSD post hoc test, samples with values below the lower limit of quantitation (<LLOQ) are imputed a value equal to one-half of the lowest extrapolated value for that analyte. The number of samples in each group (n) is shown in the column subheadings unless otherwise indicated in the individual cells.
*, significantly different compared with PBS control of the same genotype (p≤0.05, ANOVA and Tukey-Kramer HSD post hoc test).
J Immunol. Author manuscript; available in PMC 2017 October 01.

Author M
anuscriptA
uthor Manuscript
Author M
anuscriptA
uthor Manuscript
Gomez et al. Page 31
Table II
Markers of injury and DAMPs measured in BAL fluid at 6 hours after instillation of PBS or S. pneumoniae (SP) in WT or Nrf2 null mice
Analyte
WT Nrf2 null
PBS (n=7)
S.pneumoniae2.36 ± 0.048× 10⁶ CFUper mouse
(n=5)
S.pneumoniae5.82 ± 0.43 ×10⁷ CFU per
mouse(n=8)
PBS (n=7)
S.pneumoniae2.16 ± 0.036× 10⁶ CFUper mouse
(n=5)
S.pneumoniae5.14 ± 0.31 ×10⁷ CFU per
mouse(n=11)
Protein(μg/mL) 110 ± 7.9 165 ± 14 3296 ± 436 * 121 ± 11 178 ± 38 3552 ± 363 *
dsDNA(ng/mL) 12 ± 2.1 25 ± 6.0 92 ± 13 * 13 ± 3.1 22 ±4.2 66 ± 6.3 *
sICAM-1(ng/mL) 101 ± 10 144 ± 9.1 184 ± 11 * 122 ± 12 162 ± 9.5 182 ± 7.8 *
S100A8(pg/mL) 1109 ± 243 5571 ± 1257
41,812 ±
4870* 5215 ± 2107 10,171 ±2969
26150 ± 2530*,†
RAGE(pg/mL) 310 ± 30 664 ± 285 5305 ± 938 * 396 ± 23 589 ± 82 5753 ± 623 *
S100A9(pg/mL) 2102 ±392 6316 ± 1001
48,738 ±
5690 *5404 ± 1605 9732 ± 1761
32,117 ±
3370 *,†
Values are mean ± SEM. The number of samples in each group (n) is shown in the column subheadings.
*, significantly different compared with PBS control of the same genotype;
†, significantly different compared with WT mice that received the same treatment (p≤0.05, ANOVA and Tukey-Kramer HSD post hoc test).
J Immunol. Author manuscript; available in PMC 2017 October 01.

Author M
anuscriptA
uthor Manuscript
Author M
anuscriptA
uthor Manuscript
Gomez et al. Page 32
Table III
Cytokines in BAL fluid at 24 h after instillation of PBS or S. pneumoniae (SP) in WT or Nrf2 null mice
Analyte(pg/mL)
WT Nrf2 null
PBS (n=4)
S.pneumoniae6.88 ± 0.13 ×10⁶ CFU permouse (n=5)
S.pneumoniae1.38 ± 0.038× 10⁷ CFUper mouse
(n=5)
PBS (n=4)
S.pneumoniae6.25 ± 0.22 ×10⁶ CFU permouse (n=5)
S.pneumoniae1.13 ± 0.022× 10⁷ CFUper mouse
(n=5)
IL-1a 2.5 ± 0.55 113 ± 19 * 127 ± 28 * 4.0 ± 2.6 127 ± 20 * 151 ± 22 *
IL-1b 9.4 ± 0.55 123 ± 16 159 ± 27 * 15 ± 9.0 151 ± 21 238 ± 61 *
IL-2 2.5 ± 0.42 3.9 ± 0.20 3.2 ± 0.22 1.5 ± 0.41 6.0 ± 2.1 3.9 ± 0.36
IL-3 1.9 ± 0.18 3.6 ± 0.30 3.9 ± 0.43 2.1 ± 0.52 4.5 ± 0.56 * 5.1 ± 0.81 *
IL-4 2.1 ± 0.01 6.2 ± 0.45 7.7 ± 0.65 2.4 ± 0.47 8.0 ± 0.87 12 ± 3.1 *
IL-5 1.9 ± 0.16 7.8 ± 0.78 * 9.3 ± 1.2 * 2.1 ± 0.74 8.1 ± 0.85 * 12 ± 2.3 *
IL-6 1.5 ± 0.34 420 ± 59 444 ± 39 8.3 ± 7.4 599 ± 61 * 697 ± 203 *
IL-10 3.9 ± 0.27 19 ± 1.4 24 ± 2.8 4.0 ± 1.6 22 ± 2.2 45 ± 19 *
IL-12(p40) 22 ± 3.5 561 ± 55 * 596 ± 153 * 27 ± 6.3 884 ± 55 * 722 ± 169 *
IL-12(p70) 8.3 ± 2.6 122 ± 8.7 * 126 ± 29 *
16 ± 11(n=3)<LLOQ
(n=1)214 ± 12 *,† 179 ± 32 *
IL-13 41 ± 3.0 58 ± 3.0 63 ± 3.1 32 ± 4.4 67 ± 6.5 * 76 ± 9.7 *
IL-17A 5.5 ± 0.39 202 ± 30 134 ± 32 6.0 ± 2.0 274 ± 87 * 259 ± 53 *
Eotaxin 1388 ± 206 1883 ± 77 1814 ± 129 1464 ± 128 1823 ± 96 1813 ± 105
G-CSF 54 ± 5.7 4652 ± 695 4609 ± 553 249 ± 199 5207 ± 1125*
6486 ± 1985*
GM-CSF 34 ± 1.5 94 ± 17 57 ± 3.4 36 ± 6.6 170 ± 47 * 71 ± 10
IFN-γ 15 ± 1.5 91 ± 20 553 ± 209 10 ± 2.8 90 ± 29 603 ± 218
KC 15 ± 3.4 160 ± 14 232 ± 27 * 33 ± 25 344 ± 38 *, † 277 ± 60 *
MCP-1 51 ± 3.0 1148 ± 146 1626 ± 470 * 56 ± 17 1578 ± 351 * 2587 ± 393 *
MIP-1α 12 ± 1.4 772 ± 141 1590 ± 214 75 ± 71 2210 ± 2657051 ± 4950(n=4), >UL
(n=1)
MIP-1β 2.7 ± 0.29 180 ± 17 213 ± 38 12 ± 9.9 371 ± 43 1237 ± 766
RANTES 0.95 ± 0.15 493 ± 86 956 ± 22811 ± 9.3
(n=3)<LLOQ(n=1)
683 ± 83 1827 ± 539 *
TNF 6.0 ± 0.57 4823 ± 1243* 3342 ± 420 21 ± 17 8878 ± 1186
*, † 3794 ± 411 *
Values are mean ± SEM. The number of samples in each group (n) is shown in the column subheadings unless otherwise indicated in the individual cells. <LLOQ, below the lower limit of quantitation; >UL, exceeds upper limit of quantitation.
*, significantly different compared with PBS control of the same genotype;
†, significantly different compared with WT that received the same treatment (p≤0.05, ANOVA and Tukey-Kramer HSD post hoc test).
J Immunol. Author manuscript; available in PMC 2017 October 01.

Author M
anuscriptA
uthor Manuscript
Author M
anuscriptA
uthor Manuscript
Gomez et al. Page 33
Table IV
Markers of injury and DAMPs measured in BAL fluid at 24 hours after instillation of PBS or S. pneumoniae (SP) in WT or Nrf2 null mice
Analyte
WT Nrf2 null
PBS (n=4)
SP6.88 ±
0.13 × 10⁶
CFU permouse(n=5)
SP1.38 ±
0.038 × 10⁷
CFU permouse(n=5)
PBS (n=4)
SP6.25 ±
0.22 × 10⁶
CFU permouse(n=5)
SP1.13 ±
0.022 × 10⁷
CFU permouse(n=5)
Protein(μg/ml) 77 ± 2.5 128 ± 4.2 165 ±6.9 81 ± 15 134 ± 7.1 179 ± 36 *
dsDNA(ng/ml) 43 ± 9.5 573 ± 17 * 581 ± 63 * 115 ± 57 598 ± 17 * 512 ± 43 *
sICAM-1(ng/ml) 147 ± 8.5 246 ± 16 * 248 ± 33 * 130 ± 6.0 311 ± 18 * 269 ± 24 *
S100A8(net FL) 9.8 ± 6.8
6490 ± 535
(n=3) *6264 ±
1677 *1615 ±1607
6554 ± 318*
7472 ± 754*
RAGE(net FL) 22 ± 1.2 114 ± 18
(n=3) 235 ± 57 18 ± 2.6 1194 ±1061 418 ± 215
S100A9(net FL) 552 ± 260
8575 ± 333
(n=3) *8678 ± 214
*2621 ±2228 8330 ± 97 *
8599 ± 185*
Values are mean ± SEM. The number of samples in each group (n) is shown in the column subheadings unless otherwise indicated in the individual cells. Net FL, net fluorescence.
*, significantly different compared with PBS control of the same genotype (p≤0.05, ANOVA and Tukey-Kramer HSD post hoc test).
J Immunol. Author manuscript; available in PMC 2017 October 01.

Author M
anuscriptA
uthor Manuscript
Author M
anuscriptA
uthor Manuscript
Gomez et al. Page 34
Table V
Differentially expressed genes (DEGs) in whole lung tissue and lung neutrophils from WT and Nrf2 null mice
given PBS or S. pneumoniae
Tissue DEG group DEG
Whole lungtissue
DEGs in both PBS andS. pneumoniae-treatedsamples (23)
Acox2, Adh7, Akr1b8, Aldh3a1, Aox1, Cbr3,Cyp4f39, Gm21075, Gm21158, Gm2163, Gm3776,Gm3893, Gm8074, Gsta1, H60c, Igh-VJ558,LOC100041536, LOC100861727, LOC100862324,LOC102640144, Nqo1, Slc7a11, Srxn1
DEGs in S.pneumoniae-treatedsamples only (24)
Aldh1l2, Ccl27a, Gm15247, Gm17046, Gm21320,Ighg2b, Ighg2c, Ighv1-76, Ighv1-83, Igh-V3660, Igj,Igkv1-117, Igkv8-30, LOC435333, Mup1, Mup10,Mup13, Mup16, Mup2, Mup7, Mup8, Tcrg-V6,Trgj1, U90926
DEGs in PBS-treatedsamples only (30)
Abcc4, Acsm1, Angptl4, Arntl, B4galnt2, Bdkrb1,Cd177, Ces1g, Clec4e, Cyp2a5, Eid3,G530011O06Rik, Gclc, Gm10639, Gm19950,Gsta3, Gsta4, Hmox1, Il1f9, Ly6g6c, Mthfd1l,Npas2, Osgin1, Procr, Ptgs2, Sectm1b, Slc6a15,Tigit, Tsku, Txnrd1
Lungneutrophils
DEGs in both PBS andS. pneumoniae-treatedsamples(3)
Gm2163, Gm3893, LOC100041536
DEGs in S.pneumoniae-treatedsamples only (20)
2210417A02Rik, Fap, Gclm, Gm13657, Gm17046,Gm21075, Gsta3, Heatr9, Ikbkg, LOC102631757,LOC102640720, Nqo1, Olfr1394, Olfr1395, Pf4,Rnf128, Slc22a1, Slc22a4, Srxn1, Tma16
DEGs in PBS-treatedsamples only (1) Ces1g
Whole lungtissue and
neutrophils
DEGs in PBS and S.pneumoniae-treatedsamples (3)
Gm2163, Gm3893, LOC100041536
DEGs in S.pneumoniae-treatedsamples only (1)
Gm17046
DEGs in PBS-treatedsamples only (1) Ces1g
Gene expression levels were compared between genotypes in mice given S. pneumoniae and in those given PBS as described in the text (Approach 1). Underlined genes are expressed at least 2 fold greater in Nrf2 null samples compared with WT; the rest are expressed 2 fold or greater in WT compared with Nrf2 null. The numbers in parentheses indicate the number of DEGs in each category.
J Immunol. Author manuscript; available in PMC 2017 October 01.

Author M
anuscriptA
uthor Manuscript
Author M
anuscriptA
uthor Manuscript
Gomez et al. Page 35
Table VI
DEGs in whole lung tissue and lung neutrophils from WT and Nrf2 null mice given PBS and/or S. pneumoniae
GeneSymbol Description Fold change in Nrf2 null compared to WT
Lung Tissue Neutrophils
SP PBS SP PBS
Ces1g carboxylesterase 1G (NM021456) −1.6 −12.8* −1.0 −8.3*
Gm17046 predicted gene 17046(ENSMUST00000168078) −2.3* −1.9 −2.9* −1.2
Gm21075 predicted gene, 21075(XR_390710) −8.9* −7.9* −4.1* −4.5
Gm2163 predicted gene 2163(XR_390501) −6.0* −5.0* −2.8* −3.5*
Gm3893 predicted gene 3893(NR_033506) −8.9* −7.4* −4.0* −5.0*
Gsta3 glutathione S-transferase,alpha 3 (NM_001077353) −3.0 −3.1* −4.6* −1.3
LOC100041536
protein FAM205A-like (XR390020) −6.1* −5.0* −2.6* −3.6*
Nqo1 NAD(P)H dehydrogenase,quinone 1 (NM 008706) −4.9* −4.5* −11.1* −3.8
Srxn1 sulfiredoxin 1 homolog (S.cerevisiae) (NM 029688) −2.9* −3.2* −4.5* −2.3
Differentially expressed genes (DEGs) in bold type are significantly differentially expressed in both lung tissue and lung neutrophils given either PBS or SP.
*, significantly differentially expressed in Nrf2 null compared to WT (fold change > 2 and FDR<0.05).
J Immunol. Author manuscript; available in PMC 2017 October 01.

Author M
anuscriptA
uthor Manuscript
Author M
anuscriptA
uthor Manuscript
Gomez et al. Page 36
Table VII
Known Nrf2 target genes that are significantly enriched in WT compared to Nrf2 null lung tissue and
neutrophils
Tissue Treatment Enriched genes
Increased inWT comparedto Nrf2 nulllung tissue
PBS
Adamts1, Aldh1a1, Aldh3a1, Alox12, Aox1, Atf3, Cbr3,Clec4d, Cyp1b1, Cyr61, Dnaja1, Dnajb1, Egr1, Egr2, Esd,F3, Fos, Ftl1, Gadd45g, Gclm, Gjb3, Gsr, Gss, Gsto1, Hk2,Hmox1, Hspa1a, Hspa1b, Hsph1, Il6, Marco, Nqo1, Nr4a1,Nr4a2, Pgd, Pparg, Prdx1, Serpina1e, Slc2a1, Tbxas1,Txnrd1, Ubc,Ugt1a1, Wisp1
S.pneumoniae
Aldh3a1, Aox1, Cbr3, Esd, Gclm, Gjb3, Gpx2, Gss, Gsto1,Marco, Nqo1, Pparg, Txnrd1, Ugt1a1
Increased inWT comparedto Nrf2 nullneutrophils
PBS
Acta2, Adamts1, Aldh3a1, Aox1, Atf3, Cbr3, Cyr61, Dnaja1,Dnajb1, Esd, Gadd45g, Gclm, Gss, Hmox1, Hspa1a,Hspa1b, Il6, Marco, Nqo1, Nr4a2, Serpina1d, Serpina1e,Tbxas1, Txnrd1, Ubc, Ugdh
S.pneumoniae
Acta2, Adamts1, Adh5, Akr1b10, Aldh1a1, Aldh3a1,Aldh7a1, Aldh9a1, Aox1, Aqp1, Cat, Cbr3, Col13a1, Col1a1,Col6a2, Cyp1b1, Cyp2d22, Cyp2s1, Cyr61, Eln, Emcn, Esd,Gclm, Glrx3, Gpx3, Gss, Gsto1, Gstt1, H6pd, Idh2, Il6,Marco, Mdh1, Nox4, Nqo1, Pgd, Prdx1, Prdx3, Prkca,Psmb5, Ptpn14, Slc29a1, Sod3, Tgfb2, Txndc5, Txnrd1,Wisp1
GSEA showed that gene sets consisting of known Nrf2 targets are significantly enriched in WT lung tissue and neutrophils compared to Nrf2 null samples following PBS and during S. pneumoniae pneumonia(FDR<0.03). Genes that contributed to this core enrichment are listed in the table under “Enriched genes”. The genes that were included in the GSEA were identified as Nrf2 target genes by ChIP-Seq and gene expression profiling (15, 19).
J Immunol. Author manuscript; available in PMC 2017 October 01.

Author M
anuscriptA
uthor Manuscript
Author M
anuscriptA
uthor Manuscript
Gomez et al. Page 37
Table VIII
Biological pathways and processes that are significantly enriched in WT compared to Nrf2 null lungs during
S. pneumoniae pneumonia
Gene Set ID Description Number ofgenes
Enrichmen
tScore
NormalizedEnrichmen
tScore
FDR
Detoxification and antioxidant pathways
REACTOME7099083 Glutathione conjugation 27 −0.82 −2.38 0.00
KEGG MMU00480 Glutathione metabolism 51 −0.71 −2.35 0.00
GO0004364 Glutathione transferase activity 28 −0.76 −2.29 0.00
REACTOME7098590 Phase II conjugation 69 −0.64 −2.25 0.00
GO0016765 Transferase activity, transferring alkyl or aryl(other than methyl) groups 55 −0.67 −2.24 0.00
KEGG MMU00982 Drug metabolism - cytochrome P450 54 −0.67 −2.23 0.00
KEGG MMU00980 Metabolism of xenobiotics by cytochromeP450 52 −0.68 −2.27 0.00
BIOCYCMOUSE_PWY-4061
glutathione-mediated detoxification 22 −0.78 −2.16 0.00
KEGG MMU05204 Chemical carcinogenesis 76 −0.59 −2.14 0.00
WIKIPATHWAYSWP1245 Keap1-Nrf2 13 −0.83 −2.02 0.02
GO0016903 Oxidoreductase activity, acting on thealdehyde or oxo group of donors 50 −0.62 −2.06 0.03
GO0006749 Glutathione metabolic process 46 −0.66 −2.15 0.05
WIKIPATHWAYSWP164 Glutathione metabolism 17 −0.74 −1.93 0.06
REACTOME7099084 Sulfur amino acid metabolism 20 −0.72 −1.92 0.06
GO1900750 Oligopeptide binding 15 −0.77 −1.98 0.07
Immune cell signaling
REACTOME7099241 Generation of second messenger molecules 22 −0.75 −2.10 0.00
GO0042101 T cell receptor complex 13 −0.83 −2.05 0.04
GO0001772 Immunological synapse 31 −0.66 −1.98 0.06
KEGG MMU05340 Primary immunodeficiency 35 −0.61 −1.89 0.09
Olfactory processes
KEGG_MMU04740 Olfactory transduction 1057 −0.41 −1.98 0.03
GO0004984 Olfactory receptor activity 1083 −0.42 −2.01 0.06
GO0005549 Odorant binding 453 −0.44 −1.99 0.06
J Immunol. Author manuscript; available in PMC 2017 October 01.

Author M
anuscriptA
uthor Manuscript
Author M
anuscriptA
uthor Manuscript
Gomez et al. Page 38
GSEA was used to identify gene sets that show statistically significant, concordant differences in expression between WT and Nrf2 null lungs during S. pneumoniae pneumonia (FDR < 0.1). . The table lists the biological pathways or processes showing enrichment in WT compared to Nrf2 null lungs during pneumonia, sorted by functional categories. The genes that contributed to core enrichment are listed in Supplemental Table II.
J Immunol. Author manuscript; available in PMC 2017 October 01.

Author M
anuscriptA
uthor Manuscript
Author M
anuscriptA
uthor Manuscript
Gomez et al. Page 39
Table IX
The top 25 biological pathways and processes that are highly enriched in WT compared to Nrf2 null
neutrophils during S. pneumoniae pneumonia
Category Gene sets that are enriched in WT compared toNrf2 null neutrophils during SP pneumonia
Genes in commonthat contributed to
core enrichment
Angiogenesis and vasculardevelopment
GO:0001568 (Blood vessel development)GO:0001944 (vasculature development)GO:0048514 (blood vessel morphogenesis)GO:0001525 (angiogenesis)GO:0060976 (coronary vasculature development)GO:0072359 (circulatory system development)GO:0072358 (cardiovascular system development)
Fgfr2, Gata4, Fgf1,Vegfb, Pdgfrb, Ace,Rxra, Gata6, Nrp1,Fgf2, Fgfr1, Robo1,Shh, Angpt1
Noncoding RNA processes
GO:0034470 (ncRNA processing)GO:0042254 (ribosome biogenesis)GO:0034660 (ncRNA metabolic process)GO:0006399 (tRNA metabolic process)GO:0016072 (rRNA metabolic process)GO:0006364 (rRNA processing)
Exosc3, Fdxacb1,Exosc8, Pop5,Exosc9, Exosc7,Exosc2, Fbl
Glutathione (sulphur) metabolism GO:0006790 (sulfur compound metabolic process)GO:0006749 (glutathione metabolic process)
Gstt1, Gstm7,Oplah, Ggt1, Idh1,Gstz1, Glo1, Gstk1,Gstp1, Gstm5,Txnrd3, Gstp2,Gsto1, Gclc, Gss,Gpx3, Cth, Gstm1,Gstm4, Gsta1,Gclm
Extracellular matrixstructure and organization
GO:0030198 (extracellular matrix organization)GO:0043062 (extracellular structure organization)
Nid1, Apbb2, Egfl6,Sulf1, Vtn, Dpp4,Prdx4, Aplp1,Foxf1, Dag1,Smoc2, Adamtsl4,Ddr1, Hspg2, Tnxb,Hpse2, Ptk2,Emilin1, Creb3l1,Fscn1, Has1,Apbb1, Pxdn,Csgalnact1,Col4a1, Lamb2,Serpinh1, Col18a1,Fgfr4, Ctgf, Ecm2,Reck, Lamc1,Mfap5, Thsd4,Foxf2, Col1a1,Olfml2a, Spock2,Eln, Myh11, Mfap4,Abi3bp, Col5a1,Wt1, Ndnf, Dpt,Ramp2, Cyr61,Col3a1, Fbln5,Tgfb2, Col5a2, Lox,Sfrp2, Cyp1b1,Ddr2, Adamts2,Gpm6b, Flrt2,Adamtsl2, Npnt,Col1a2, Itga8,Pdgfra, Egflam,Sema5a
Epithelial development
GO:0030324 (lung development)GO:0030323 (respiratory tube development)GO:0060541 (respiratory system development)GO:0002009 (morphogenesis of an epithelium)GO:0001655 (urogenital system development)
Fgfr2, Fgf1, Dlg5,Foxa1, Eya1,Wnt7b, Lama5,Wnt5a, Gli2, Foxf1,Bmp4, Spry1, Tnc,Fgf2, Igf1, Fgfr1,Gpc3, Gli3, Shh,Aldh1a2, Tcf21
J Immunol. Author manuscript; available in PMC 2017 October 01.

Author M
anuscriptA
uthor Manuscript
Author M
anuscriptA
uthor Manuscript
Gomez et al. Page 40
Category Gene sets that are enriched in WT compared toNrf2 null neutrophils during SP pneumonia
Genes in commonthat contributed to
core enrichment
Cell migration andmovement
GO:0051270 (regulation of cellular componentmovement)GO:0090287 (regulation of cellular response togrowth factor stimulus)GO:0030334 (regulation of cell migration)
Mmrn2, Wnt5a,Sfrp1, Itga3, Nbl1,Vegfc, Cxcl13,Bmp4, Nkx2-1,Fgf2, Tek, Tgfbr3,Fgf18, Cyr61,Sfrp2, Slit2, Bmper,Ccbe1, Angpt1
Gene sets were obtained from publicly available databases and GSEA was used to identify the top 25 significantly enriched gene sets (FDR<
1.97×10⁻⁵), which were subsequently sorted into related functional categories, and the genes in common that contributed to core enrichment were identified. Genes are ranked by increasing difference between mean expression levels in WT and Nrf2 deficient neutrophils, scaled by the standard deviation.
J Immunol. Author manuscript; available in PMC 2017 October 01.

Author M
anuscriptA
uthor Manuscript
Author M
anuscriptA
uthor Manuscript
Gomez et al. Page 41
Table X
Number of genes that are changed 2 fold or more during S. pneumoniae pneumonia
Tissue Gene change Number of genes
Up* Down* Total**
Lung
Common 888 (68%) 424 (32%) 1312 (65%)
Unique to WT 124 (39%) 197 (61%) 321(16%)
Unique to Nrf2 null 218 (58%) 156 (42%) 374 (19%)
Neutrophils
Common 1127 (52%) 1042 (48%) 2169 (47%)
Unique to WT 195 (49%) 199 (51%) 394 (9%)
Unique to Nrf2 null 543 (27%) 1461 (73%) 2004 (44%)
The number of genes that are up or down regulated more than 2-fold during S. pneumoniae pneumonia compared with PBS controls of the same genotype is shown. Genes are filtered at Benjamini-Hochberg FDR<0.05.
*, number and (percentage) of total DE genes.
**, number and (percentage) of genes that are either common or unique to one genotype.
J Immunol. Author manuscript; available in PMC 2017 October 01.

Author M
anuscriptA
uthor Manuscript
Author M
anuscriptA
uthor Manuscript
Gomez et al. Page 42
Table XI
Number of changed genes that show 2-fold or greater differences in fold changes between genotypes
Tissue Gene change Number of genes
Up* Down* Total**
Lung
Common 13 6 19
Unique to WT 19 8 27
Unique to Nrf2 null 14 3 17
Neutrophils
Common 65 91 156
Unique to WT 28 12 40
Unique to Nrf2 null 46 203 249
The number of significantly changed transcripts during S. pneumoniae pneumonia for which the ratio of fold change between genotypes is greater than 2 is shown (FDR<0.05).
*, total number of changed genes.
**, number of genes that are either common or unique to one genotype.
J Immunol. Author manuscript; available in PMC 2017 October 01.