john husing, ph.d. economics & politics, inc. & chief economist, ieep
DESCRIPTION
Inland Empire Economy. John Husing, Ph.D. Economics & Politics, Inc. & Chief Economist, IEEP. Three Step Growth Process Based On Interaction Of:. Population Preferences Dirt Prices. Why Southern California Population Grows. People Prefer To Live Near The Coast. - PowerPoint PPT PresentationTRANSCRIPT

John Husing, Ph.D. Economics & Politics, Inc.
&Chief Economist, IEEP
Inland Empire Economy
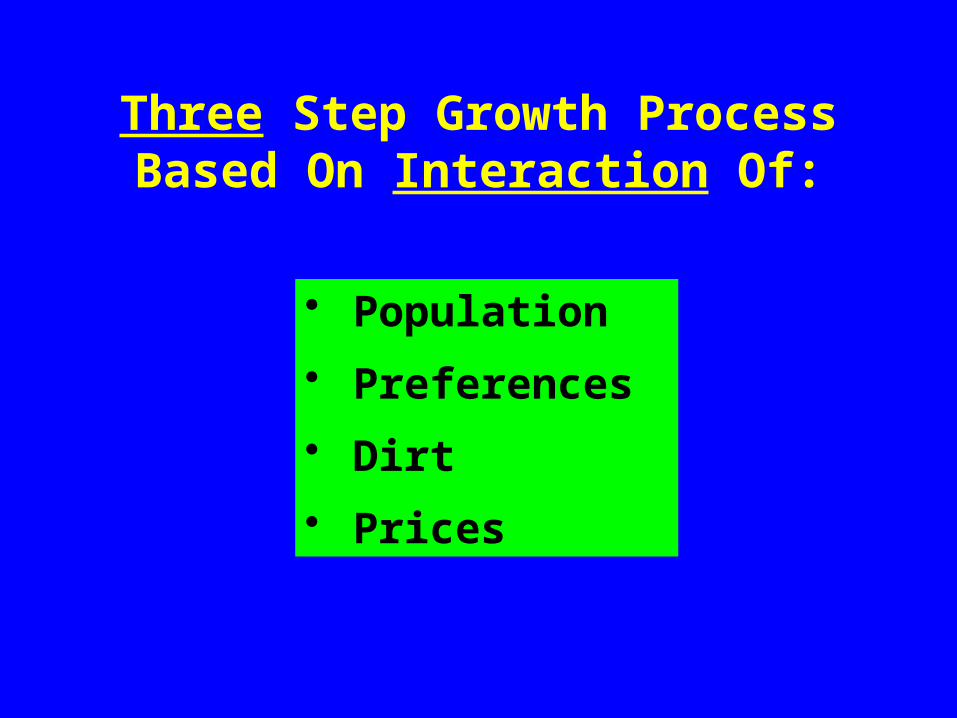
Three Step Growth ProcessBased On Interaction Of:
• Population• Preferences• Dirt• Prices

Why Southern California Population Grows

People Prefer To Live Near The Coast

As a homeowner, would you prefer to move closer to work if it involved a townhouse or condo?
(I-15 & Sr-91 Commuters, 2008)
72.3% No
As a renter, would you prefer to move closer to work if it involved a townhouse or condo? (I-15 & Sr-91 Commuters, 2008)
87.5% NoAnswer stable over 5 years

Lack of Land or Inadequate Zoning Drives Up Coastal Prices Forcing Home Buyers & Renters to Move Inland
$24,000
$189,000 $215,000
$371,000
$239,000 $263,000
$428,000 $454,000
$610,000
San Bernardino Co.Riverside Co. Los Angeles Co. San Diego Co. Orange Co.
Median All Home PriceSan Bernardino County Price Advantage
Source: Dataquick
Exhibit 20.-Home Prices, So. California MarketsMedian Priced New & Existing Home, 2nd Quarter 2013
$191,000$165,000
$247,000

Don’t Build Them & They’ll Come Anyway!
I-210 Delayed For 1980-2007 YearsSan Bernardino County went 900,000 to 2,000,000 people
BUILD FREEWAYS & THEY’LL COME
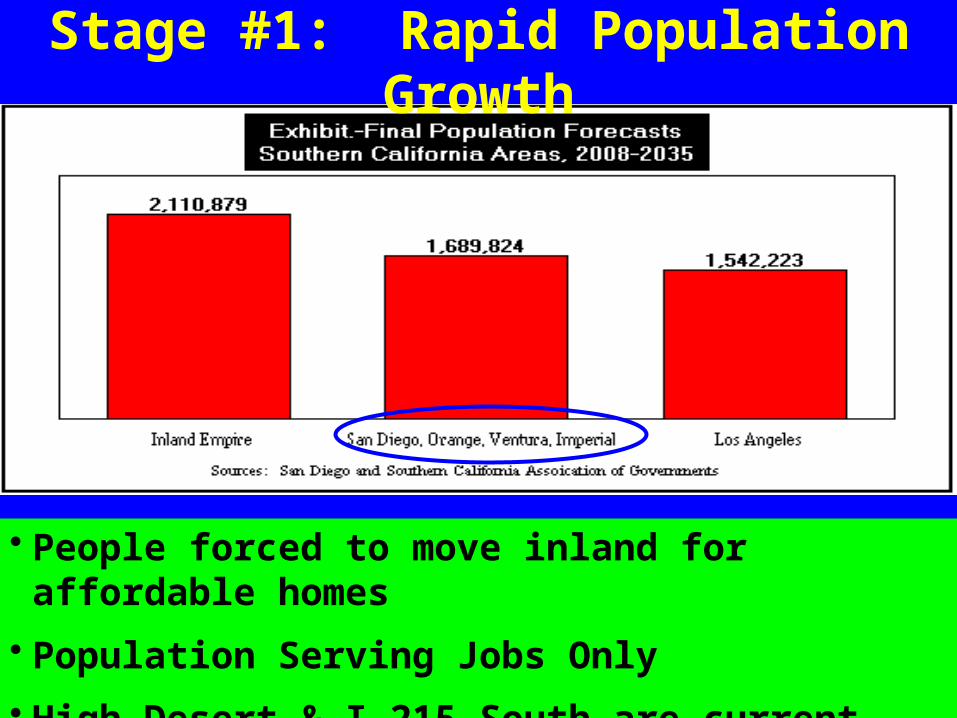
• People forced to move inland for affordable homes• Population Serving Jobs Only• High Desert & I-215 South are current examples
Stage #1: Rapid Population Growth

Commuting
1,650,384 Total Jobs
1,156,313 Inside IE494,071 Commute Outside County154,845 Between IE Counties339,226 Outside IE
20.6% Commute Outside the IE
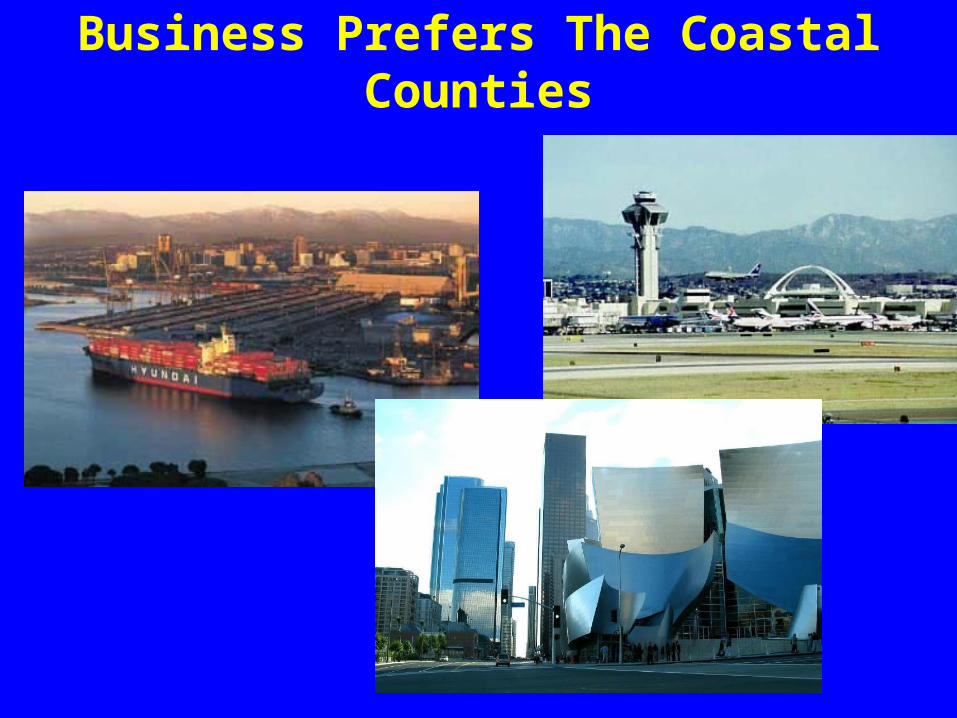
Business Prefers The Coastal Counties

Not Enough Land … Industrial Prices Much Lower In Outlying Areas
84.2%
107.2%
156.6%
$0.26$0.33
$0.48
$0.30$0.38
$0.56$0.63
$0.78
Inland Empire Los Angeles Co. Orange Co. San Diego (non-R&D)
Price Per Sq. Ft.Price with 20% Cubic Factor
Difference.
% Difference
nnn=net of taxes, insurance, common area feesSource: CB Richard Ellis
Exhibit 13.-Industrial Space Costs DifferencesSouthern California, Sub-Markets, March 2013

Blue Collar Jobs Important To Outlying Areas
37.9%
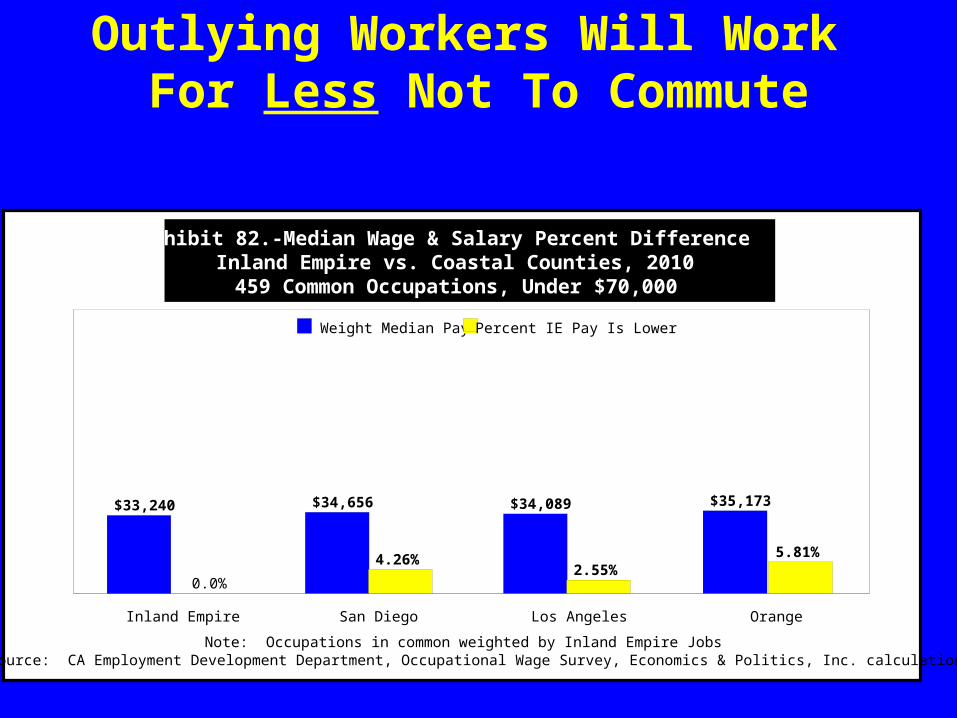
Outlying Workers Will Work For Less Not To Commute
0.0%
4.26%2.55%
5.81%
$33,240 $34,656 $34,089 $35,173
Inland Empire San Diego Los Angeles Orange
Weight Median Pay Percent IE Pay Is Lower
Note: Occupations in common weighted by Inland Empire JobsSource: CA Employment Development Department, Occupational Wage Survey, Economics & Politics, Inc. calculations
Exhibit 82.-Median Wage & Salary Percent DifferenceInland Empire vs. Coastal Counties, 2010459 Common Occupations, Under $70,000

Stage 2: Rapid Industrial Growth

Jobs:Housing Balance lmproves
IE Western Edge is today’s best example

Step #3 Higher-End Migration
Upscale Housing

Skilled Workers Migrate InlandFor Better Homes

Condo Living Becomes More Prevalent
32.4%29.0%
25.1%21.9%
8.7%
4.5%
San Diego Orange Ventura Los Angeles Riverside San Bernardino
Source: DataQuick
Exhibit 13.-Condo Sales Share of Home SalesSouthern California Markets, 2008

Higher-End Workers Added

Outlying Workers Will Work For Less Not To Commute
0.0%
7.70% 9.17% 9.22%
$86,806$93,489 $94,768 $94,806
Inland Empire San Diego Los Angeles Orange
Weight Median Pay Percent IE Pay Is Lower
Note: Occupations in common weighted by Inland Empire JobsSource: CA Employment Development Department, Occupational Wage Survey, Economics & Politics, Inc. calculations
Exhibit 98.-Median Wage & Salary Percent DifferenceInland Empire vs. Coastal Counties, 2010138 Common Occupations, $70,000 & Up

Stage 3.- High-End Companies Ultimately Follow Workers

Jobs:Housing Balance Achieved
Southern California Avg. 1.20 Jobs per Occupied Dwelling

Primary Tier
Secondary Tier
Economic Development … Increase The Economic Base!

Current Economic Status & Issues

After Losing 8.74 Million Jobs …U.S. Job Creation Is Crawling Back
Without Loss of-682,000 Government Jobs7,495,000 Growth or 85.8%
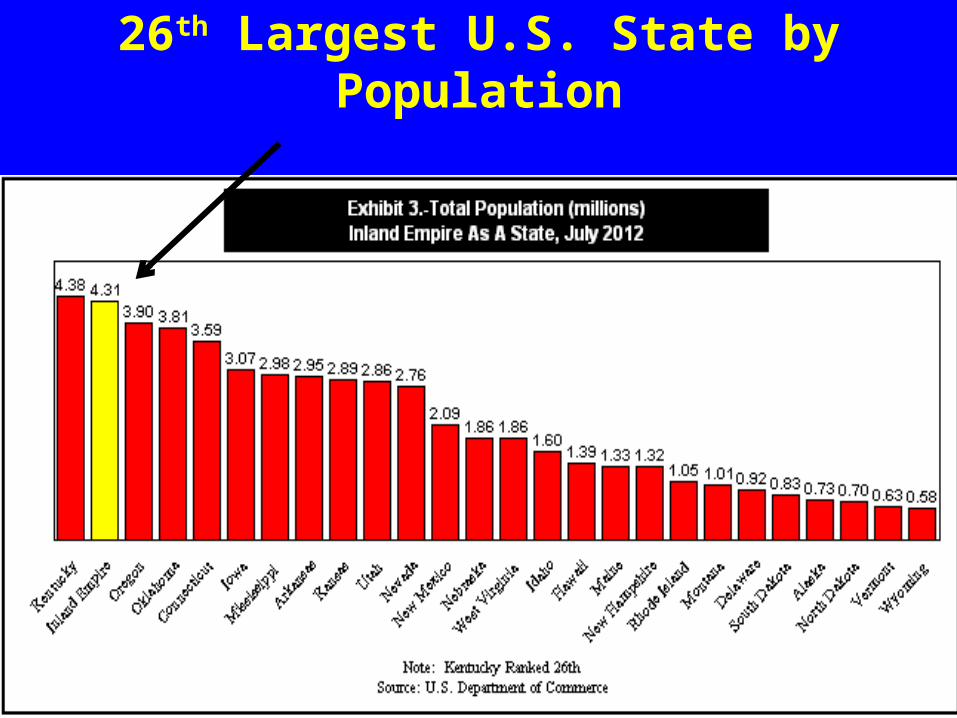
26th Largest U.S. State by Population

Ethnic Composition
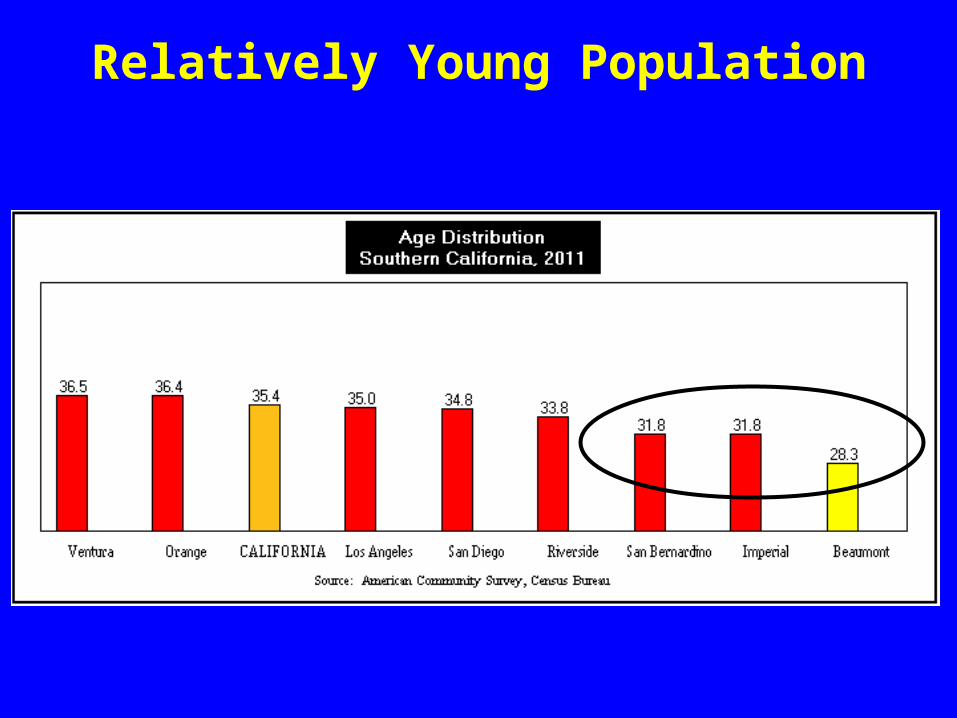
Relatively Young Population
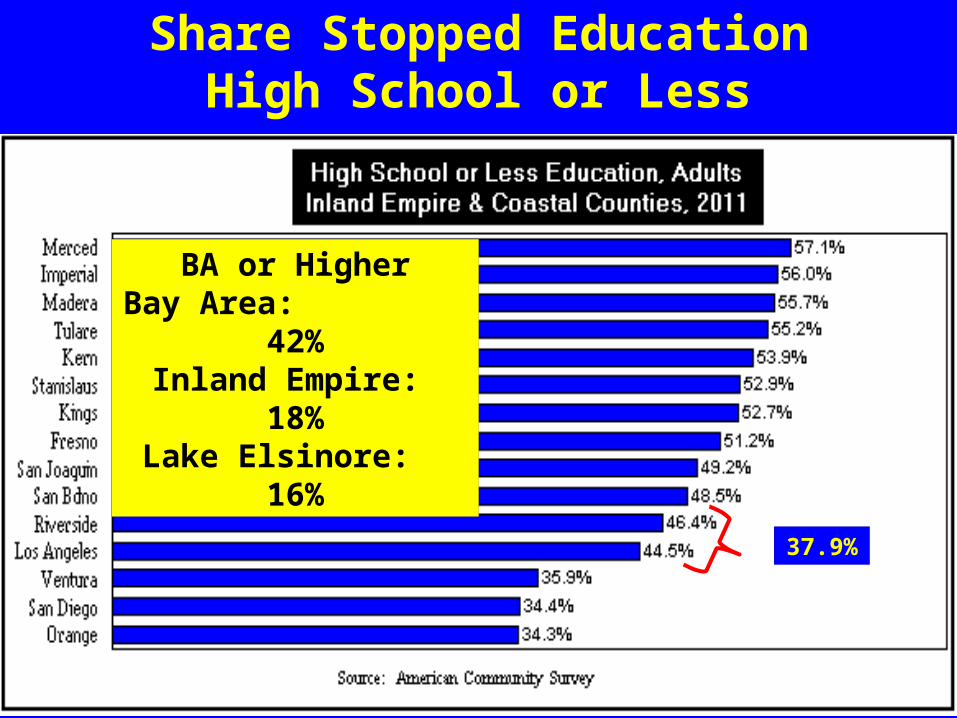
Share Stopped EducationHigh School or Less
BA or HigherBay Area: 42%Inland Empire: 18%Lake Elsinore: 16%
37.9%

Why Not High End Jobs?
Labor Force Education Dictates Type of Growth Possible

Stagnant Incomes for 23 Years
+7%
-8%
Lake Elsinore $61,250

Job Growth vs. Other CA Areas

30,0
50
41,0
25
37,6
42
36,5
33
36,7
75
41,4
83
46,0
08
6,34
2
9,75
8
4,57
5
16,9
17
28,9
25
23,0
83 38,3
25
40,6
92 56,4
67
49,8
50
40,5
67
33,2
92
35,4
67 59,2
75
61,5
33
44,6
92
2,50
8
1984
1985
1986
1987
1988
1989
1990
1991
1992
1993
1994
1995
1996
1997
1998
1999
2000
2001
2002
2003
2004
2005
2006
2007
2008
2009
2010
2011
2012
2013
e
Sources: CA Employment Development Department, Economics & Politics, Inc.
Exhibit 3.-Wage & Salary Job ChangeInland Empire, Annual Average, 1984-2013
Continuous Job Growth For Decades,But . . .
(46,
208)
(84,
892)
(17,
325)
4,63
3 23,0
25
-146,400-11.4%

Unemployment Falling, But High
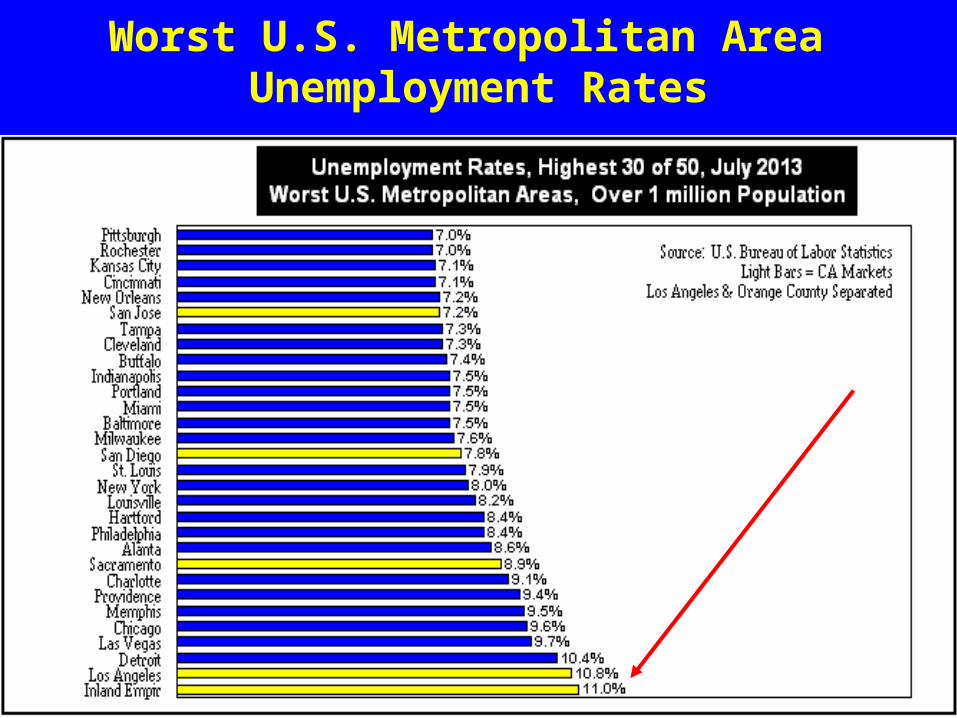
Worst U.S. Metropolitan Area Unemployment Rates

Share of Underwater Homes Plunging

Poverty
Exhibit 2.-Share & Number of Inland Residents Below Poverty LevelCensus Bureau
Year People In Poverty Share of Population in Poverty Population
1990 306,417 11.8% 2,588,7932000 477,496 14.7% 3,255,5262011 774,874 18.0% 4,293,892
Changes +152.9% +6.2% +65.9%
Lake Elsinore14.5%

Water Issue
1. Delta Smelt2. 20 Years Water Supply To Build3. Santa Ana Sucker4. Replacement Water Cost: $1,862,000,0005. If Water Can’t Be Found … Can’t Build Large Projects

CA’s Regulatory Environment
CEO’s: California is the Worst State for Business

Status of Sectors Capable of Driving Recovery
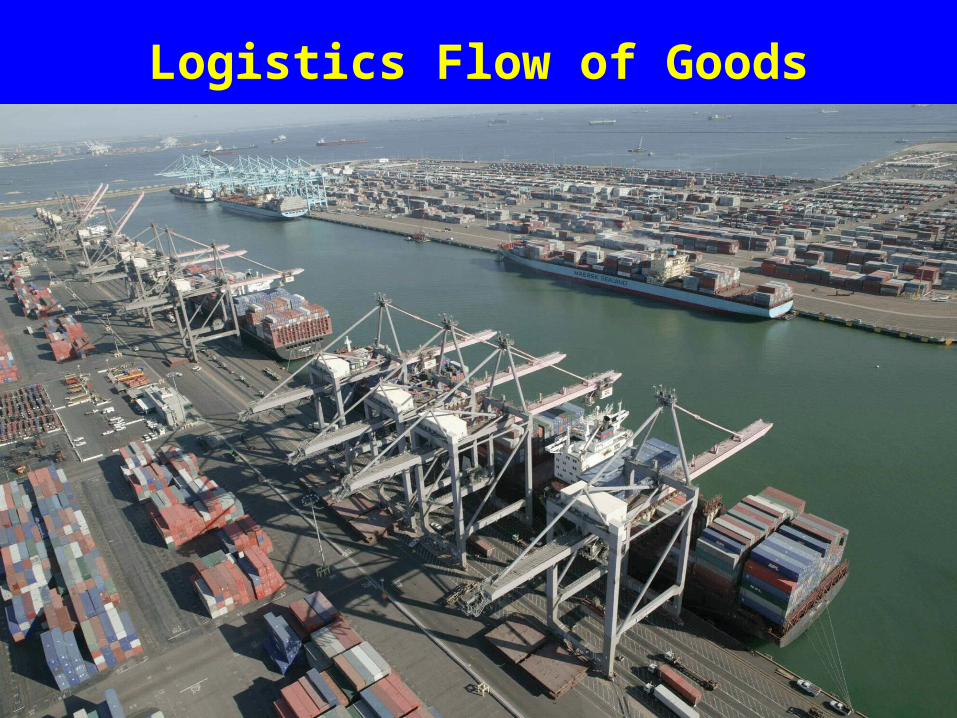
Logistics Flow of Goods

Truck To Inland Empire
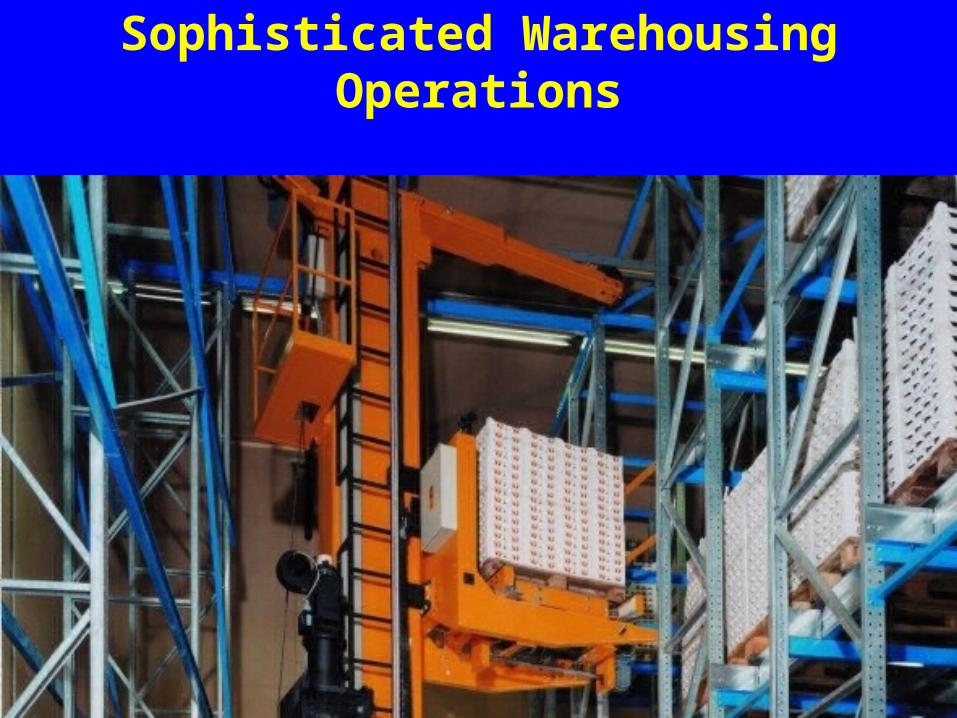
Sophisticated Warehousing Operations

Port Container Volumes
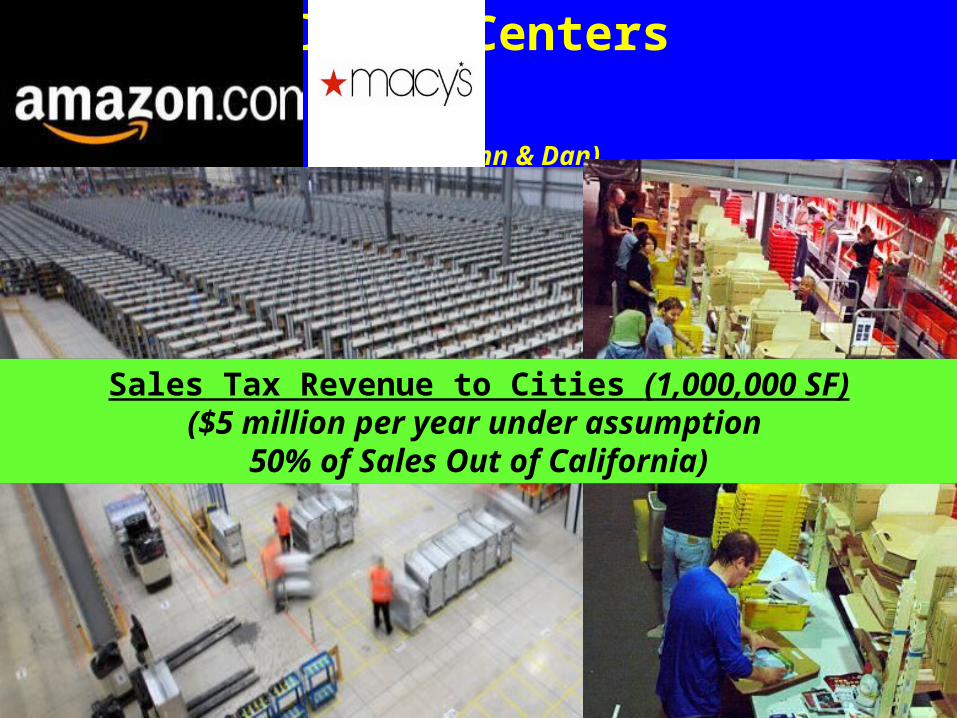
Fulfillment Centers (John & Dan)
Sales Tax Revenue to Cities (1,000,000 SF)($5 million per year under assumption
50% of Sales Out of California)

17 Firms Looking For Space (John & Fran)1,500,0001,000,0001,000,000
800,000 to 1,000,000700,000 to 1,000,000500,000 to 800,000700,000 to 900,000
850,000700,000700,000
700,000 to 800,000600,000
600,000 to 700,000500,000450,000
300,000 to 400,000350,000
Source: Jones LaSalle
Size JobsE-Commerce: 6,150,000 to 6,450,000 SF 5,467 to 5,733 JobsConventional: 5,800,000 to 6,800,000 SF 1,850 to 2,092 JobsTotal Potential: 11,950,000 to 13,250,000 SF 7,282 to 7,826 Jobs
Average Square Feet Per Job Combined = 1,641 to 1,693

Industrial Vacancy Rate Recovering Everywhere!
Inland Empire 2.7% 12.8% 5.8%San Diego 7.0% 12.0% 9.9%Orange Co. 5.4% 6.5% 3.2%L.A. Co. 2.1% 3.2% 2.0%
2005/2006 2009Q3 2013Q2
IE Gross Absorption Back at 12.5million Sq. Ft.But Still Under Its Long Term Average

Inland Empire Logistics Jobs
28% of All Inland Jobs … Jan-July 2012-2013

Health Care

Health Care Jobs: Continuous Growth
700 500 900

Determinants of Public Health
Robert Woods Johnson-University of Wisconsin•40% Socio-Economic•30% Health Behaviors•20% Access to Health Care•10% Environmental Factors

Public Health Determinants
San Bernardino County 46th
Riverside County 36th No Health Insurance 23%People Per Physician: SB Co. 1,868 40th
People Per Physician: Riv Co. 2,514 47th
Health Care Issue

Manufacturing: Could Be A Major Growth Source

Manufacturing Orders Declining
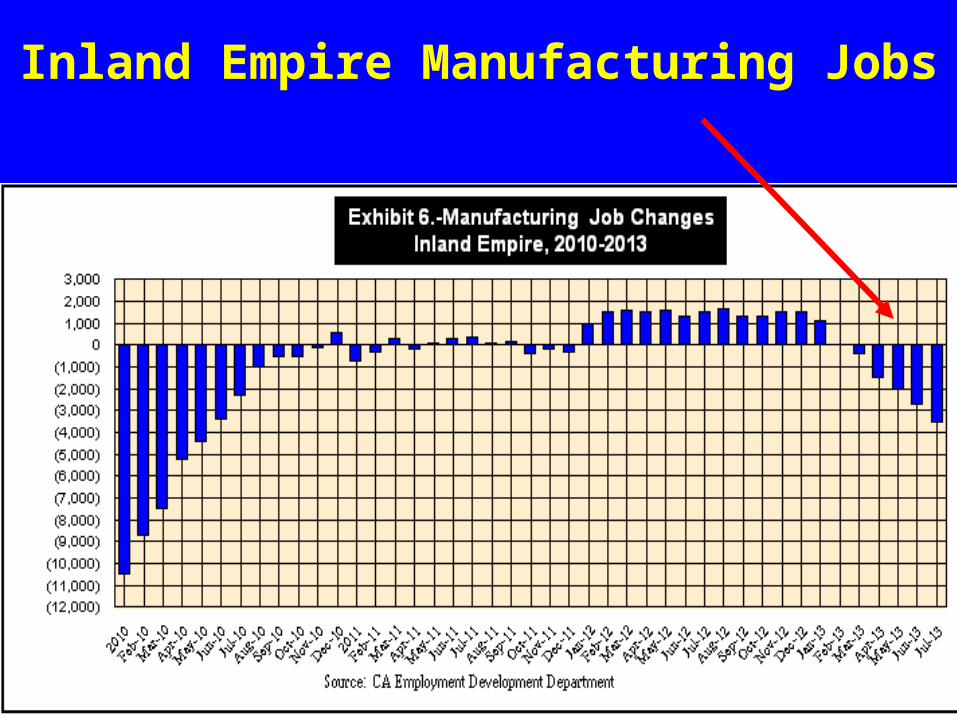
Inland Empire Manufacturing Jobs

U.S. v. California Manufacturing Jobs

Regulatory Environment Aimed At “Dirty” Blue Collar Sectors

Air Becoming CleanerExhibit 6.-PM 2.5 Days over National Standard vs.
Total Square Feet of Net Industrial Absorption Since Highest PM2.5 level
Monitoring Sites Mira Loma-Van Buren
Riverside-Magnolia
Riverside-Rubidoux
Fontana-Arrow Highway
Ontario-1408 Francis Street
San Bernardino-4th Street
2001 120.2 58.2 79.5 80.8
2002 88.4 92.6 73.7 67.4 88.9
2003 69.7 78.1 54.3 62.2 55.2
2004 * 47.8 57.3 * * *
2005 * * 39.7 22.9 25.3 9.3
2006 46.2 31.3 * 27.2 * *
2007 43.4 * * * * *
2008 * 12.4 15.0 19.3 19.4 9.5
2009 19.0 6.0 15.1 6.2 9.0 6.2
2010 8.0 6.3 4.0 6.6 3.2 5.9
2011 13.0 7.1 5.0 7.1 6.8 *
2012 7.0 * 7.0 10.6 0.0 0.0Change From
Highest -39.2 -81.3 -113.2 -63.1 -79.5 -88.9
Change -84.8% -92.0% -94.2% -85.6% -100.0% -100.0%Net Absorptiont Since Highest 86,378,254 183,911,357 229,967,544 183,911,357 229,967,544 183,911,357

Median Pay By Sector Groups

Results: A Policy Cause Crisis
• California Uncompetitive for Manufacturing & Other Blue Collar Work
• Reduced Access To Middle Class Jobs For Marginally Educated Who Are A Huge Share of Workers
• Disproportionately Impact Hispanic & African American Families
• Health & Social Justice Issue Being Created
• Increasing the Income Disparity in the State
Construction: Finally Some Hope

Construction Share of Lost Jobs
56.1%
118,800
66,300
Total Job Decline 2006-2012Construction Job DeclineConstruction Share of Lost Jobs
Source: CA Employment Development Department
Construction Share Of Lost JobsInland Empire, Dec. 2006-2012

Share of Underwater Homes Plunging

Home Prices Finally Rising
46.4%
26.5%
48.2% less for Existing home

Lake Elsinore Price Trends
+37.4%

Lake Elsinore Price Advantage

Inland Empire’s In-migration From Coastal Counties Has Not Yet Recovered
-15,538
Not Bringing Skills, Wealth, Income & Spending

Investor Pre-Market Home Buying
2007 July 2007 2008 July 2008 2009 July 2009 2010 July 2010 2011 July 2011 2012 July 2012 20130%5%
10%
15%
20%
25%
30%35%
40%
45%
50%
55%
60%
0%5%
10%
15%
20%
25%
30%35%
40%
45%
50%
55%
60%
Source: Foreclosureradar.com
Exhibit 12.-Direct Investor Purchase of Foreclosure SalesInland Empire, 2007-2013
57.8%
Families Can’t CompeteRealtors Have Less Business

How Much Higher Is The Likelihood of Calls for Police Service?
Single Family Rental v. Owner Occupied

How This Ends: A Housing Shortage
106,2309.35 per
new person
During 2008 thru 2012California Population Grew by 993,624
Looming Shortage

Permits: Finally Some Optimism

Construction: Data Weird

High-End & Office Based Jobs

Office Market: Some Recovery

Office Vacancy Rates Improving But Still Very High
19.2%

High End Occupations & Office Operations Gaining Strength

California Grabbing Money From Local Government … School Funding Cut
Jerry Brown’s Hand

Federal Job Cuts
SequesterBudget FightDebt Ceiling
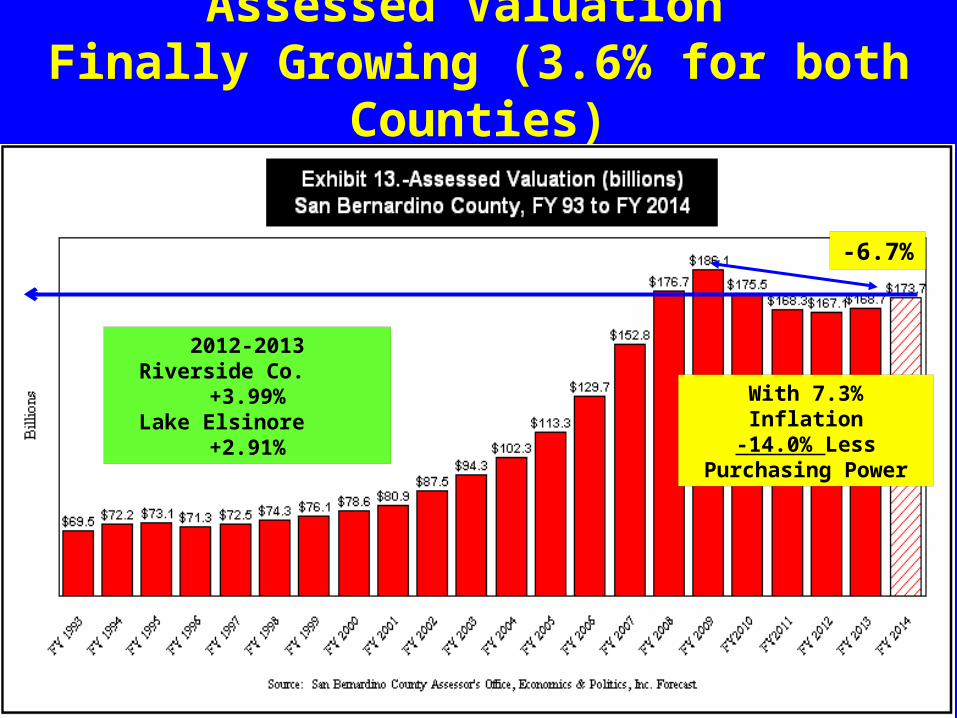
Assessed Valuation Finally Growing (3.6% for both Counties)
-6.7%
With 7.3% Inflation-14.0% Less
Purchasing Power
2012-2013Riverside Co. +3.99%Lake Elsinore +2.91%

Retail Sales Returning
-$3.9 Billion-6.3%
With 12.5% Inflation-16.7% Less
Purchasing Power

Lake Elsinore Retail Trade: Rising!
Inland Empire2006-2012
-$3.9 Billion-6.3%

Retail, Consumer Service, Hotel, Amusement Jobs Growing
Growth OccurringBut Restrained

Public Sector A Drag!

Where Will IE Be In Its Job History?