johnson controls enterprise management (jem) · johnson controls enterprise management (jem)...
TRANSCRIPT
1 Johnson Controls Enterprise Management (JEM) Product Bulletin
Johnson Controls Enterprise Management (JEM)
Product Bulletin LIT-12012497
Software Release 2.1 Issued October 2019
Overview Johnson Controls Enterprise Management (JEM) is a comprehensive, analytical, cloud-based, and cloud-agnostic, optimization tool that pro-actively analyses building energy and equipment data to identify issues, faults, and opportunities for improved performance and operational savings. Using parent-child meter/equipment space relationships, JEM provides for enterprise building performance comparisons, and lifecycle management.
Powerful analytics root out energy and equipment-related problems 24x7. These analytics run in the background and find energy and equipment anomalies. Actionable information is provided to the customer through the Fault Detection and Diagnostic (FDD) feature.
JEM works with Metasys® Building Automation and 3rd Party Building Automation Systems (BAS) that support BACnet IP communications to provide a holistic view and insights at every space, with respect to equipment operation starting from the portfolio down to sub-spaces within the building. Coupled with the JEM Data Collector, it has the flexibility to integrate directly with meters using BACnet IP and is easy to configure. JEM can assist in obtaining ISO 50001 Certification faster.
• JEM is an integral part in the development of an energy management plan and other factors affecting energy performance that can be monitored and influenced by the organization.
• Provides measurement, documentation, and reporting of energy use and consumption.
• Automates energy and system monitoring and verification (there is no need to go to the facility and write down energy metrics on paper or take photos).
• Performs mandatory energy reviews automatically, which is required by ISO 50001.
• Ability to set baselines, recalculate them,
and compare them with historical data to track energy savings progress.
• JEM is the easiest way to share progress with the energy team and organization using automated reporting tools.
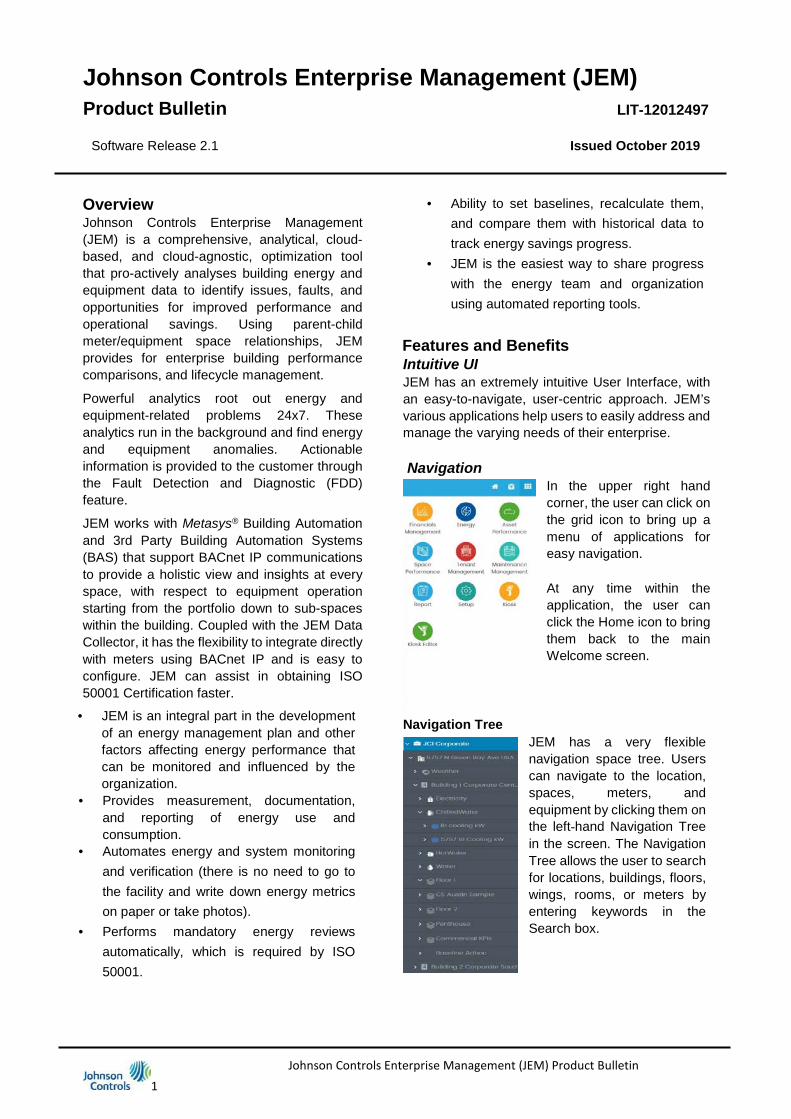
Features and Benefits Intuitive UI JEM has an extremely intuitive User Interface, with an easy-to-navigate, user-centric approach. JEM’s various applications help users to easily address and manage the varying needs of their enterprise. Navigation
In the upper right hand corner, the user can click on the grid icon to bring up a menu of applications for easy navigation. At any time within the application, the user can click the Home icon to bring them back to the main Welcome screen.
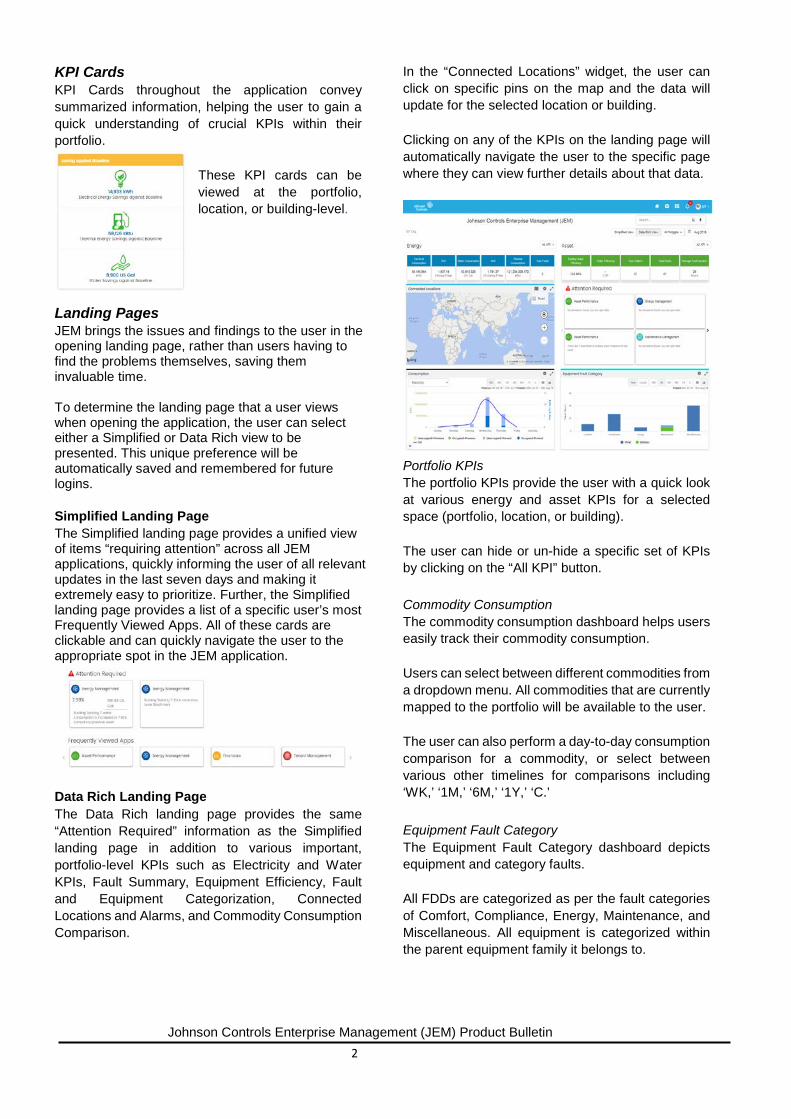
Navigation Tree JEM has a very flexible navigation space tree. Users can navigate to the location, spaces, meters, and equipment by clicking them on the left-hand Navigation Tree in the screen. The Navigation Tree allows the user to search for locations, buildings, floors, wings, rooms, or meters by entering keywords in the Search box.
Johnson Controls Enterprise Management (JEM) Product Bulletin 2
KPI Cards KPI Cards throughout the application convey summarized information, helping the user to gain a quick understanding of crucial KPIs within their portfolio.
These KPI cards can be viewed at the portfolio, location, or building-level.
Landing Pages JEM brings the issues and findings to the user in the opening landing page, rather than users having to find the problems themselves, saving them invaluable time. To determine the landing page that a user views when opening the application, the user can select either a Simplified or Data Rich view to be presented. This unique preference will be automatically saved and remembered for future logins. Simplified Landing Page The Simplified landing page provides a unified view of items “requiring attention” across all JEM applications, quickly informing the user of all relevant updates in the last seven days and making it extremely easy to prioritize. Further, the Simplified landing page provides a list of a specific user’s most Frequently Viewed Apps. All of these cards are clickable and can quickly navigate the user to the appropriate spot in the JEM application.
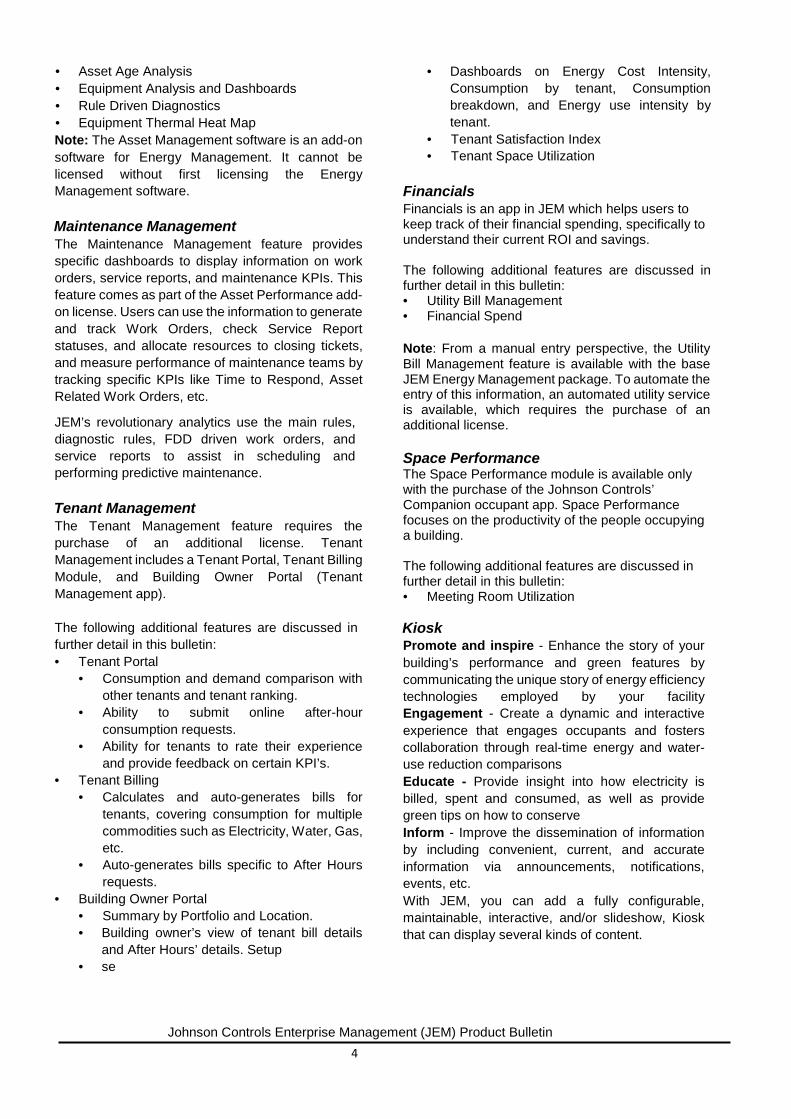
Data Rich Landing Page The Data Rich landing page provides the same “Attention Required” information as the Simplified landing page in addition to various important, portfolio-level KPIs such as Electricity and Water KPIs, Fault Summary, Equipment Efficiency, Fault and Equipment Categorization, Connected Locations and Alarms, and Commodity Consumption Comparison.
In the “Connected Locations” widget, the user can click on specific pins on the map and the data will update for the selected location or building. Clicking on any of the KPIs on the landing page will automatically navigate the user to the specific page where they can view further details about that data.
Portfolio KPIs The portfolio KPIs provide the user with a quick look at various energy and asset KPIs for a selected space (portfolio, location, or building). The user can hide or un-hide a specific set of KPIs by clicking on the “All KPI” button. Commodity Consumption The commodity consumption dashboard helps users easily track their commodity consumption. Users can select between different commodities from a dropdown menu. All commodities that are currently mapped to the portfolio will be available to the user. The user can also perform a day-to-day consumption comparison for a commodity, or select between various other timelines for comparisons including ‘WK,’ ‘1M,’ ‘6M,’ ‘1Y,’ ‘C.’ Equipment Fault Category The Equipment Fault Category dashboard depicts equipment and category faults. All FDDs are categorized as per the fault categories of Comfort, Compliance, Energy, Maintenance, and Miscellaneous. All equipment is categorized within the parent equipment family it belongs to.

Johnson Controls Enterprise Management (JEM) Product Bulletin 3
Hovering over any of the categories will show the user how many faults there are on each piece of equipment within that category. The user can utilize the toggle button at the top of the chart to switch between Time and Count. The user can also toggle between preferred timelines. Energy Management Energy Management software automatically collects, analyses, and displays information for all configured physical meters (Online/Offline meters) and Virtual meters located in a facilities operation. The information for energy demand and consumption can be aggregated and displayed using various out-of-the-box dashboards. Custom dashboards can also be configured to a user’s needs. Easy-to-understand summary reports can be generated from the dashboard data, utilizing the built-in automated reporting tool. The following additional features are discussed in further detail in this bulletin: • Map Selection • Energy Density Dashboards • Weather Normalization • Energy Tracker with Baseline • Energy Summary of Commodities • Energy Fault Detection and Diagnostics (FDD) • Building Benchmarking
• Building EUI Comparison • Internal Benchmarking • Building WUI Comparison • EUI vs Consumption
• Custom Dashboards: dashboards that can be configured to display data for space or meters. • Line, Area, Column, Stacked Column,
Stacked Column Aggregation, Bar, Stacked Bar charts; user can map different points with the same unit of measure, or up to four different units of measure, in the same chart.
• Pie Charts; can be used to view the contribution of consumptions from four buildings, in percentage, for that location. Each building is shown in a percentage, providing an easy view as to which building is contributing the most in consumption.
• Heat Map; can be used for easy detection of “hot spots” that lead to high Consumption/ Demand during parts of the day, allowing for quicker corrective actions for when the hot spots occur.
• Combination Charts such as Column-Line, Column-Area, Stacked Column Aggregation- Line, and Stacked Column Stacked-Area;
can be used to visualize multiple sets of data in various graphical formats.
• Consumption and Demand Comparisons • Energy Profiling
• Consumption Profiling • Demand Profiling
• Solar Meter Dashboards • Data Cleansing and Normalization • User Defined Baseline • Energy Summary Reports with Auto Scheduling • Energy Impact Report monetizing faults
throughout the platform
Used alone, or coupled with the Asset Performance software add-on, it provides a system that allows easy enterprise performance comparisons and life-cycle management, providing detailed visibility into site operations.
Asset Performance
The Asset Performance software add-on of JEM provides the connectivity to monitor, troubleshoot, and maintain configured equipment points located in a customer’s facility to ensure that high capex assets are safe, reliable, and efficient over their operating life. Rule-driven fault detection, notification, and diagnostics are displayed in a time series format with total duration of existence, allowing equipment managers to easily pinpoint and fix equipment problems.
All data is displayed in easy-to-read dashboards and provides for developing custom equipment KPIs.
The following additional features are discussed in further detail in this bulletin: • Map Selection • Plant Room Equipment KPIs • Airside (AHU, RT, VAV, Fan Coil, etc.) KPIs • Waterside (Chiller, Boiler, etc.) KPIs • Equipment Efficiency KPIs • Equipment Fault Detection and Diagnostics
(FDD) • Fault Notification • Fault Dashboards • FDD Export • System Faults • Fault Backdated Reprocessing
• Standard Global Rule Library/Rule Driven Diagnostics
• Custom Equipment Rules Editor • Graphics and Point Binding
• Chilled Water Plant Graphics • Air Schematic Graphics
• Command and Control • Case Based Learning
Johnson Controls Enterprise Management (JEM) Product Bulletin 4
• Asset Age Analysis • Equipment Analysis and Dashboards • Rule Driven Diagnostics • Equipment Thermal Heat Map Note: The Asset Management software is an add-on software for Energy Management. It cannot be licensed without first licensing the Energy Management software. Maintenance Management The Maintenance Management feature provides specific dashboards to display information on work orders, service reports, and maintenance KPIs. This feature comes as part of the Asset Performance add-on license. Users can use the information to generate and track Work Orders, check Service Report statuses, and allocate resources to closing tickets, and measure performance of maintenance teams by tracking specific KPIs like Time to Respond, Asset Related Work Orders, etc.
JEM’s revolutionary analytics use the main rules, diagnostic rules, FDD driven work orders, and service reports to assist in scheduling and performing predictive maintenance. Tenant Management The Tenant Management feature requires the purchase of an additional license. Tenant Management includes a Tenant Portal, Tenant Billing Module, and Building Owner Portal (Tenant Management app). The following additional features are discussed in further detail in this bulletin: • Tenant Portal
• Consumption and demand comparison with other tenants and tenant ranking.
• Ability to submit online after-hour consumption requests.
• Ability for tenants to rate their experience and provide feedback on certain KPI’s.
• Tenant Billing • Calculates and auto-generates bills for
tenants, covering consumption for multiple commodities such as Electricity, Water, Gas, etc.
• Auto-generates bills specific to After Hours requests.
• Building Owner Portal • Summary by Portfolio and Location. • Building owner’s view of tenant bill details
and After Hours’ details. Setup • se
• Dashboards on Energy Cost Intensity, Consumption by tenant, Consumption breakdown, and Energy use intensity by tenant.
• Tenant Satisfaction Index • Tenant Space Utilization
Financials Financials is an app in JEM which helps users to keep track of their financial spending, specifically to understand their current ROI and savings. The following additional features are discussed in further detail in this bulletin: • Utility Bill Management • Financial Spend Note: From a manual entry perspective, the Utility Bill Management feature is available with the base JEM Energy Management package. To automate the entry of this information, an automated utility service is available, which requires the purchase of an additional license. Space Performance The Space Performance module is available only with the purchase of the Johnson Controls’ Companion occupant app. Space Performance focuses on the productivity of the people occupying a building. The following additional features are discussed in further detail in this bulletin: • Meeting Room Utilization
Kiosk Promote and inspire - Enhance the story of your building’s performance and green features by communicating the unique story of energy efficiency technologies employed by your facility Engagement - Create a dynamic and interactive experience that engages occupants and fosters collaboration through real-time energy and water-use reduction comparisons Educate - Provide insight into how electricity is billed, spent and consumed, as well as provide green tips on how to conserve Inform - Improve the dissemination of information by including convenient, current, and accurate information via announcements, notifications, events, etc. With JEM, you can add a fully configurable, maintainable, interactive, and/or slideshow, Kiosk that can display several kinds of content.

Johnson Controls Enterprise Management (JEM) Product Bulletin 5
System Architecture The JEM system is comprised of various hardware and software components working closely together to provide monitoring over a site’s meters, HVAC, and other building systems. Data Collector The Johnson Controls Enterprise Management Data Collector is an industrial PC that provides connectivity to meters and building automation systems to extract data for the JEM application. This gateway uses Internet of Things (IOT) capabilities to collect and push data to the cloud.
The JEM Data Collector is protected by Microsoft Security Essentials (Windows Defender). Click on the link below to read the test reports on Microsoft Security Essentials: https://www.av-test.org/en/antivirus/homewindows/windows-7/february-2017/microsoftsecurity-essentials-4.10-170547 Communication Protocols JEM works with Metasys® Building Automation and other Building Automation Systems (BAS) that support BACnet IP communications. It also has the flexibility to integrate directly with meters using BACnet IP.
Refer to Johnson Controls JEM Enterprise Management Data Collector Product Bulletin (LIT-12012343) for further information. Secure JEM uses industry-standard system security and encoding protocols to protect against unauthorized access to data and control systems, including the following security features:
• All JEM components (UI, API) shall use HTTPS, HTTP Strict Transport Security, and SSL Certificates to prevent unauthorized access to secure, encrypted communication.
• Supported services such as JEM Gateway (Data Collector) shall use self-signed certificates installed on supported products with the option of configuring trusted certificates.
• JEM application shall enable different users to hold various roles with respective, configurable rights, and data will be available based on these specific roles.
• JEM’s Enterprise Identity Management System (EIMS) has a new login workflow to ensure the authentication process is secure through issuing temporary authorization codes in exchange for a
secret access code when needed. Since the access token is never visible to the user, this is the most secure way to pass the token back to the application, reducing the risk of the token leaking, and the risk of an attacker intercepting the authorization code.
• JEM also offers additional password security features which ensure unauthorized users cannot access the application: o JEM offers multifactor authentication. If a
user forgets a password, the user has to validate a one-time password sent via email to enable password recovery.
o JEM enforces a password expiry policy, requiring the user to change their password every 60 days.
o JEM application does not allow users to use any of their past 10 passwords when resetting their password.
o JEM application locks out a password after multiple retries.
o User ID and passwords are typed on two different screens.
Scalable JEM system architecture is scalable to the energy needs of a user’s facility and equipment monitoring requirements. Components can be added as needed to:
• Control buildings and systems of varying complexity, size and scope;
• Integrate with third-party BAS systems to unify operations with JEM;
• Integrate earlier generations of components to modernize and unify the operation;
• Software is modular to grow with the user’s functionality and site monitoring needs.
Johnson Controls Enterprise Management (JEM) Product Bulletin 6
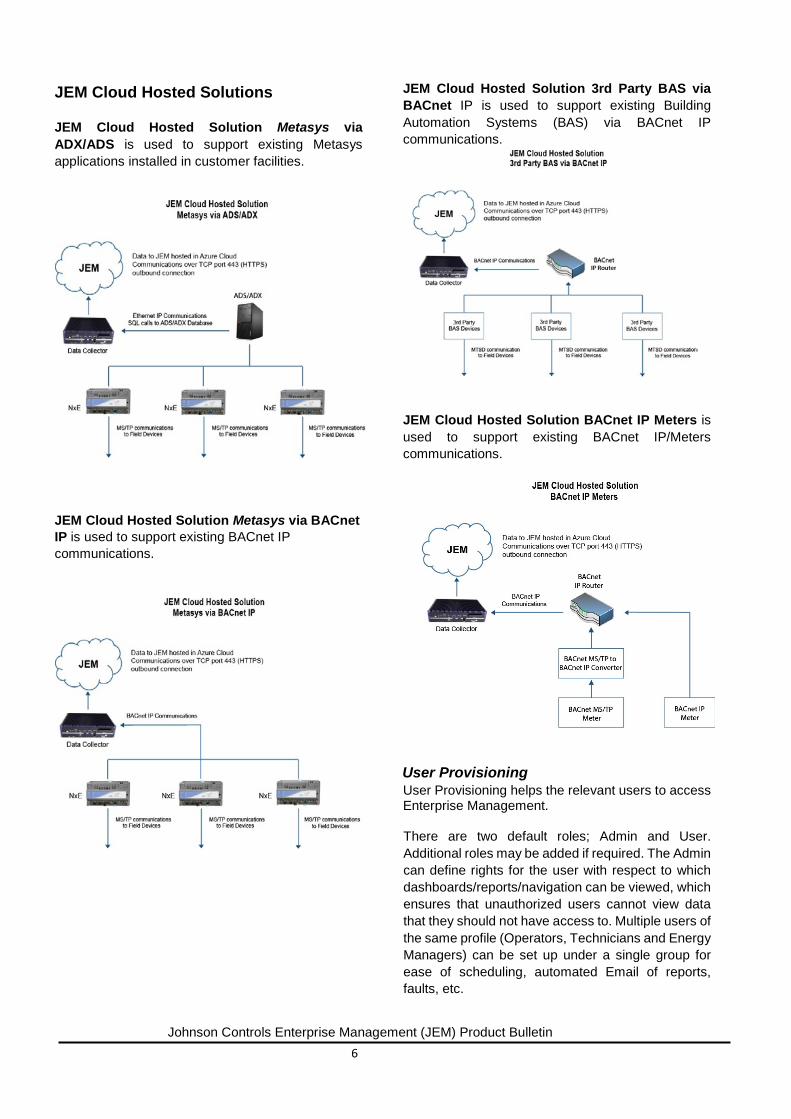
JEM Cloud Hosted Solutions
JEM Cloud Hosted Solution Metasys via ADX/ADS is used to support existing Metasys applications installed in customer facilities.
JEM Cloud Hosted Solution Metasys via BACnet IP is used to support existing BACnet IP communications.
JEM Cloud Hosted Solution 3rd Party BAS via BACnet IP is used to support existing Building Automation Systems (BAS) via BACnet IP communications.
JEM Cloud Hosted Solution BACnet IP Meters is used to support existing BACnet IP/Meters communications.
User Provisioning User Provisioning helps the relevant users to access Enterprise Management. There are two default roles; Admin and User. Additional roles may be added if required. The Admin can define rights for the user with respect to which dashboards/reports/navigation can be viewed, which ensures that unauthorized users cannot view data that they should not have access to. Multiple users of the same profile (Operators, Technicians and Energy Managers) can be set up under a single group for ease of scheduling, automated Email of reports, faults, etc.
Johnson Controls Enterprise Management (JEM) Product Bulletin 7
Configuration Through the use of easy-to-follow drop down menus; Energy Management and Asset Performance allows the user to configure the software to the needs and requirements of their portfolios.
Data Sources The data sources tab allows the data to be fetched from different communication protocols:
• Metasys – SQL Driver for ADX
• BACnet – BACnet IP
Once the data source is configured, the system allows the user to discover devices/points, fetch historic data for selected points (Metasys Historian SQL driver only), set point attributes, and sync with the platform. Spaces The Space Tree feature allows the user to create a space hierarchy reflecting actual physical locations within the portfolio, including the following: • Portfolio • Location (including weather information) • Building
Space re-ordering allows the admin to setup the space hierarchy to reflect how the user wishes to view the spaces.
Below the Building level, the user has the flexibility to add spaces (e.g. floor, wing and rooms). Each one can be named as per customers’ requirements to provide ultimate flexibility.
The accurate creation of the space tree is critical to the functioning of the JEM system. Setting up the tree to exactly mirror the physical portfolio allows the energy analysis to be accurate and precise. Meters/Equipment The user can add in Meters or Equipment points, including the following: • Add/Edit the attributes of data source points • Historical Fetch and Sync • Create meters/sub meters and map the points
Online and virtual meters are represented by unique icons that help a user to distinguish different types of meters. Meters can include commodities such as electricity, natural gas, water, steam, etc.
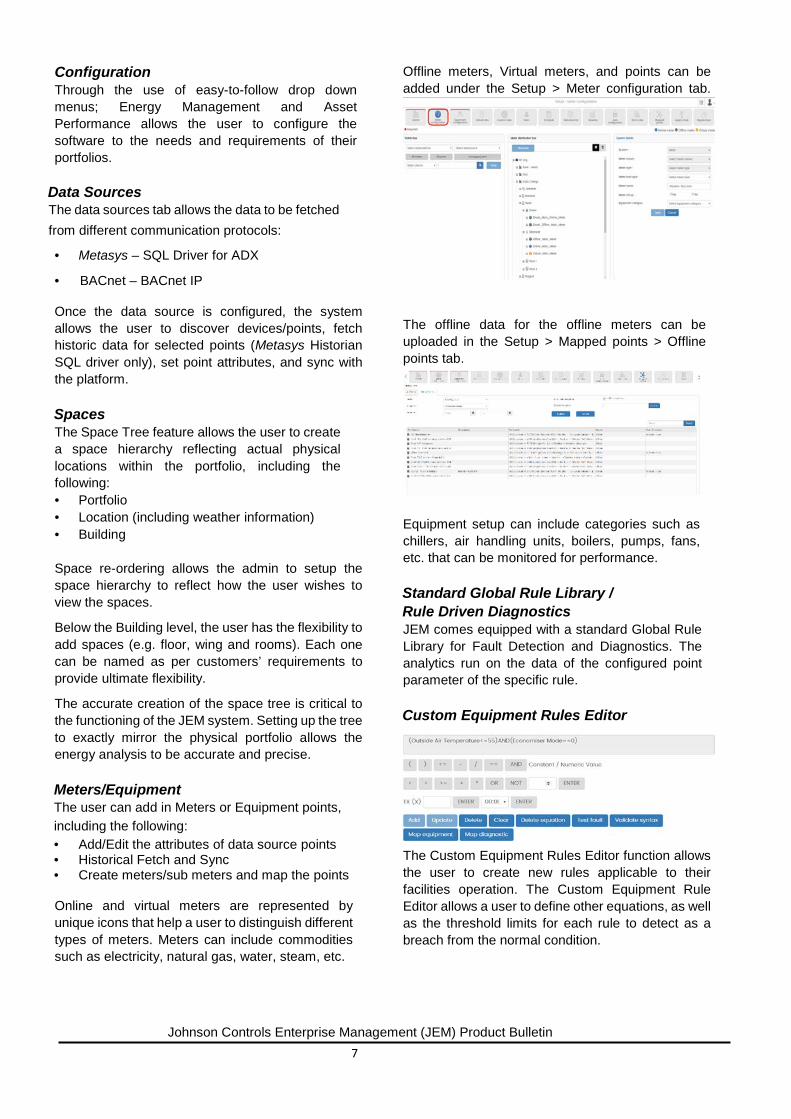
Offline meters, Virtual meters, and points can be added under the Setup > Meter configuration tab.
The offline data for the offline meters can be uploaded in the Setup > Mapped points > Offline points tab.
Equipment setup can include categories such as chillers, air handling units, boilers, pumps, fans, etc. that can be monitored for performance. Standard Global Rule Library / Rule Driven Diagnostics JEM comes equipped with a standard Global Rule Library for Fault Detection and Diagnostics. The analytics run on the data of the configured point parameter of the specific rule. Custom Equipment Rules Editor
The Custom Equipment Rules Editor function allows the user to create new rules applicable to their facilities operation. The Custom Equipment Rule Editor allows a user to define other equations, as well as the threshold limits for each rule to detect as a breach from the normal condition.

Johnson Controls Enterprise Management (JEM) Product Bulletin 8
When logged in as a Super Admin user, s/he can access the Custom Equipment Rules Editor, which provides the templates and information required to create new rules to supplement the Global Fault Library.
Fault Creation The user can create faults in the Setup tab. To select from JEM’s global rules, the user can go to Setup > Global rules tab. In each of the subsequent tabs, the user can create energy faults, thresholds, and equipment faults based on the global rules JEM provides.
Alternatively, the user can create custom faults in to Setup > Custom rules tab. Here, the user can start from a template and create rules, thresholds, diagnostics and more, within each of the subsequent tabs, with the option of creating system-wide faults as well. In both the Sub Rules and System Fault Rules tabs, the user has access to a Fault Inline Editor. Fault equations are easily editable through a physical keyboard, enhancing the user experience while writing rules. Special characters are available to call out attributes, constants, sub rules, and specifications in the rule equations. Additional statistical functions such as minimum, maximum, average, standard deviation, and square root are also available for creating FDD rules. The user is able to write a fault containing multiple data points.
Baselines The Baseline feature is a reference tool allowing comparison of actual energy use to a predefined baseline for all energy parameters for a space or meter. It allows the user to compare energy performance before and after a change has been made to the site or system.
Baselines can be created for:
• Location Energy Performance (KPIs) • Custom Dashboards • Plant Room Dashboard
From the Baseline tab, users can upload baseline details through a spread sheet or use the baseline templates provided to amend the information to configure their own baselines. Baselines can be created on a monthly or daily basis. Schedules The Schedule function allows a user to configure the workday, non-workday, and holidays.
The impact of a Schedule can be viewed in Load Profile (above) and Consumption / Demand KPI (below).
Johnson Controls Enterprise Management (JEM) Product Bulletin 9
Overview of Energy Management Features Map Selection Users can select the desired location/building and navigate using Maps at the Portfolio and Location levels. The user can select Google or Bing maps.
If a user hovers over a location, a pin icon will display Electrical consumption and EUI details of the location. The user can easily navigate to a selected location using the Map.
Energy Density Dashboards JEM dashboards allow the user to comprehend energy data intuitively. The information displayed identifies inefficiencies in building operation to help reduce energy costs.
The dashboards are user-friendly. The data on the dashboards is organized for customers to easily navigate through their portfolio and quickly prioritize which facilities need attention. All data from dashboards can be exported and used for further reference and analysis or appended with a report. JEM has built-in default reporting templates which captures essential data at a periodic basis and makes it easy to distribute these reports to the stakeholders. The reports and dashboards are also useful to track and report regulatory reporting and emissions.
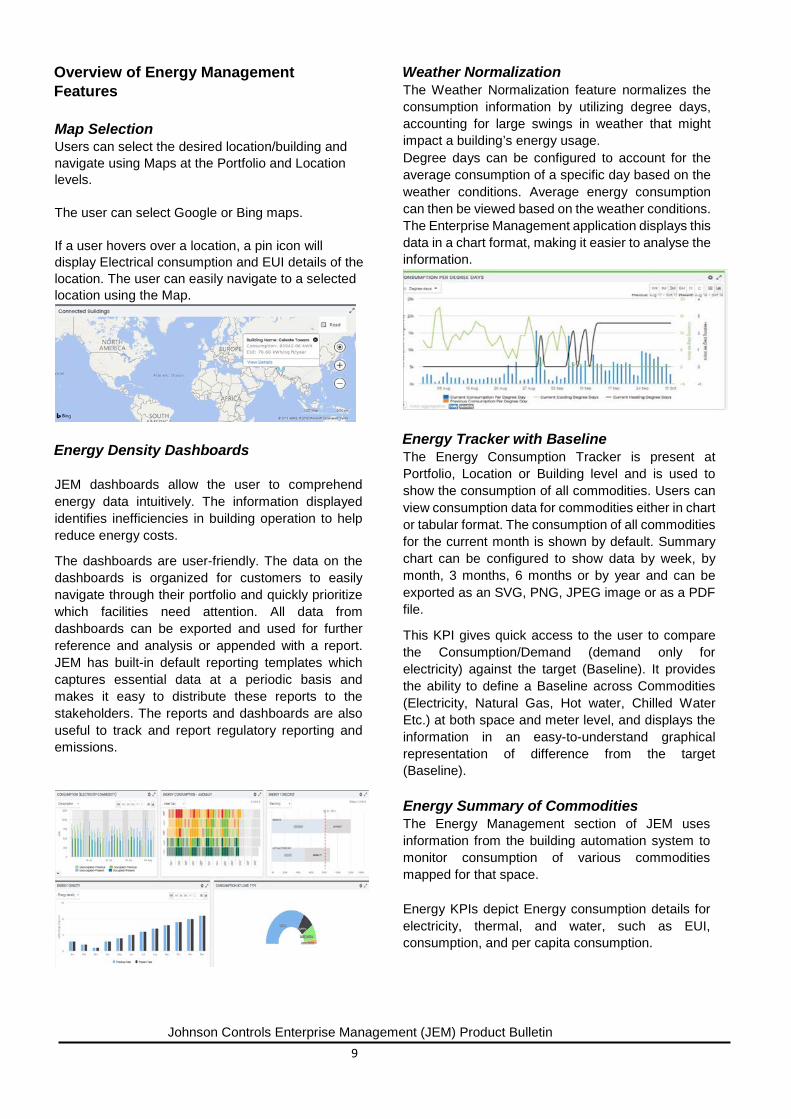
Weather Normalization The Weather Normalization feature normalizes the consumption information by utilizing degree days, accounting for large swings in weather that might impact a building’s energy usage. Degree days can be configured to account for the average consumption of a specific day based on the weather conditions. Average energy consumption can then be viewed based on the weather conditions. The Enterprise Management application displays this data in a chart format, making it easier to analyse the information.
Energy Tracker with Baseline The Energy Consumption Tracker is present at Portfolio, Location or Building level and is used to show the consumption of all commodities. Users can view consumption data for commodities either in chart or tabular format. The consumption of all commodities for the current month is shown by default. Summary chart can be configured to show data by week, by month, 3 months, 6 months or by year and can be exported as an SVG, PNG, JPEG image or as a PDF file.
This KPI gives quick access to the user to compare the Consumption/Demand (demand only for electricity) against the target (Baseline). It provides the ability to define a Baseline across Commodities (Electricity, Natural Gas, Hot water, Chilled Water Etc.) at both space and meter level, and displays the information in an easy-to-understand graphical representation of difference from the target (Baseline). Energy Summary of Commodities The Energy Management section of JEM uses information from the building automation system to monitor consumption of various commodities mapped for that space. Energy KPIs depict Energy consumption details for electricity, thermal, and water, such as EUI, consumption, and per capita consumption.
Johnson Controls Enterprise Management (JEM) Product Bulletin 10
KPI Cards help users to briefly monitor the spaces and the user can visualize the KPI Cards at Portfolio, Location, and Building levels. Users can also view the Energy Savings against the baseline for each of the commodities, as well as the Carbon footprint corresponding with the current level of consumption.
KPI Cards also help the user to easily view commodity consumption changes with respect to the baseline from the previous year and which locations/buildings have contributed to an increase or decrease in EUI. Energy Fault Detection and Diagnostics (FDD) JEM Energy FDD contains options to monitor Energy, for either High Unoccupied consumption, or Weekend consumption. Users can view fault data at varying levels, such as by floor, wing, room, or meter.
Energy Forecast JEM proactively predicts future energy usage by employing pattern analysis, allowing users to quickly and seamlessly understand the return on efficiency investments. It provides the data required by customers to develop and execute smart strategies to improve operational efficiency and maximize savings.
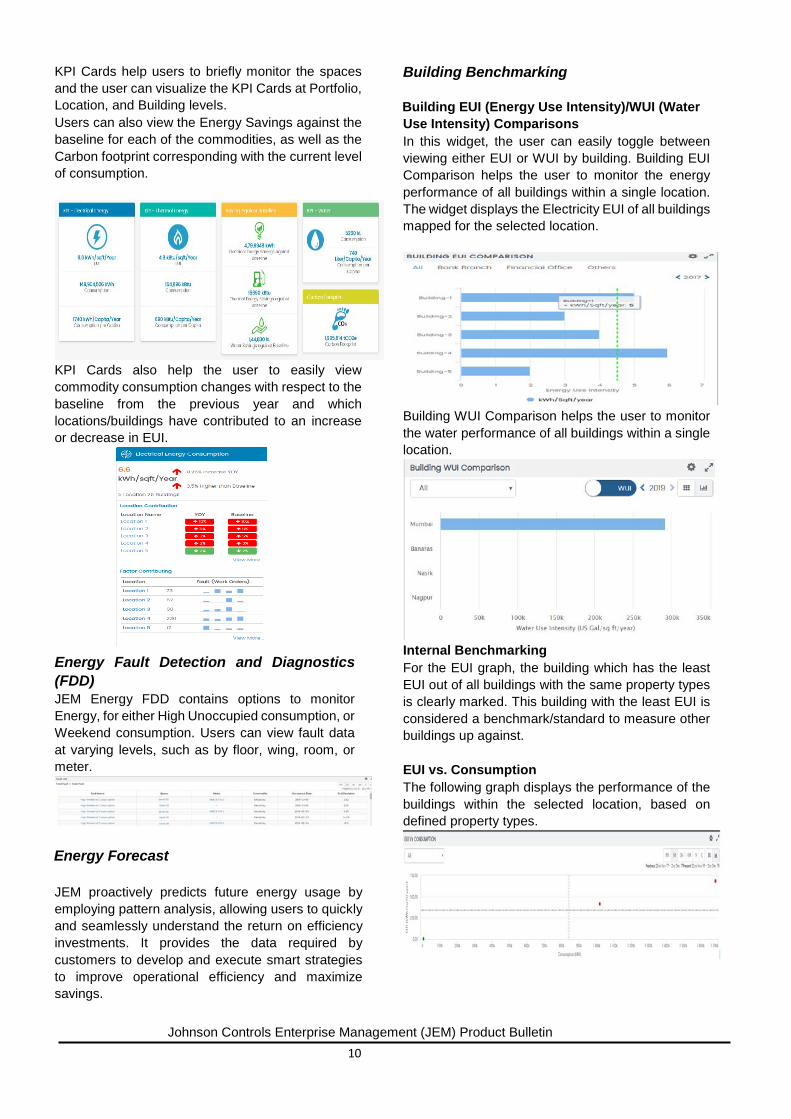
Building Benchmarking Building EUI (Energy Use Intensity)/WUI (Water Use Intensity) Comparisons In this widget, the user can easily toggle between viewing either EUI or WUI by building. Building EUI Comparison helps the user to monitor the energy performance of all buildings within a single location. The widget displays the Electricity EUI of all buildings mapped for the selected location.
Building WUI Comparison helps the user to monitor the water performance of all buildings within a single location.
Internal Benchmarking For the EUI graph, the building which has the least EUI out of all buildings with the same property types is clearly marked. This building with the least EUI is considered a benchmark/standard to measure other buildings up against. EUI vs. Consumption The following graph displays the performance of the buildings within the selected location, based on defined property types.
Johnson Controls Enterprise Management (JEM) Product Bulletin 11
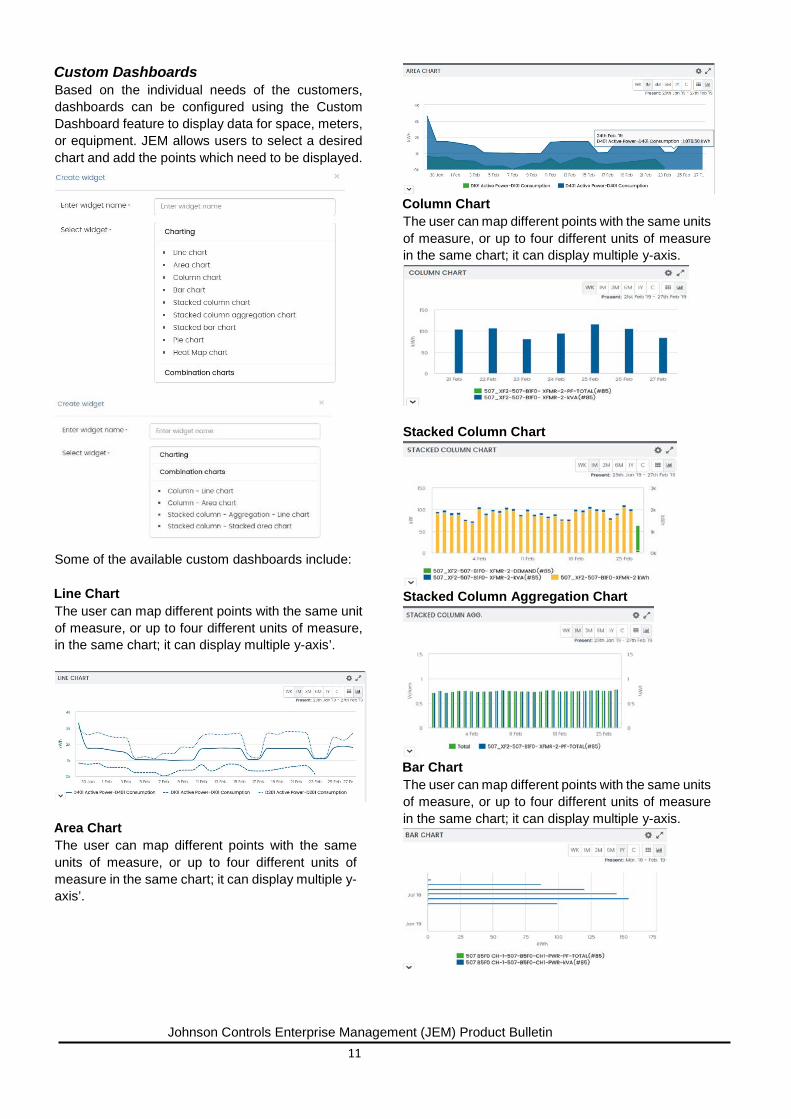
Custom Dashboards Based on the individual needs of the customers, dashboards can be configured using the Custom Dashboard feature to display data for space, meters, or equipment. JEM allows users to select a desired chart and add the points which need to be displayed.
Some of the available custom dashboards include: Line Chart The user can map different points with the same unit of measure, or up to four different units of measure, in the same chart; it can display multiple y-axis’.
Area Chart The user can map different points with the same units of measure, or up to four different units of measure in the same chart; it can display multiple y-axis’.
Column Chart The user can map different points with the same units of measure, or up to four different units of measure in the same chart; it can display multiple y-axis.
Stacked Column Chart
Stacked Column Aggregation Chart
Bar Chart The user can map different points with the same units of measure, or up to four different units of measure in the same chart; it can display multiple y-axis.
Johnson Controls Enterprise Management (JEM) Product Bulletin 12
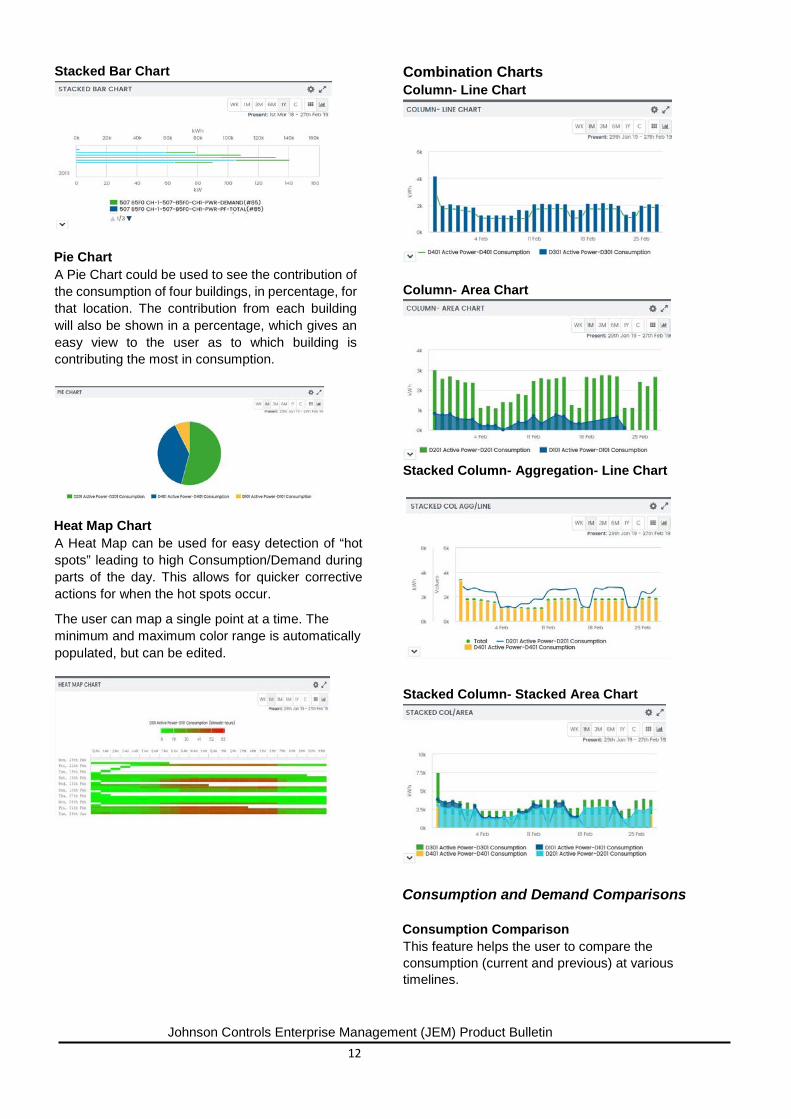
Stacked Bar Chart
Pie Chart A Pie Chart could be used to see the contribution of the consumption of four buildings, in percentage, for that location. The contribution from each building will also be shown in a percentage, which gives an easy view to the user as to which building is contributing the most in consumption.
Heat Map Chart A Heat Map can be used for easy detection of “hot spots” leading to high Consumption/Demand during parts of the day. This allows for quicker corrective actions for when the hot spots occur.
The user can map a single point at a time. The minimum and maximum color range is automatically populated, but can be edited.
Combination Charts Column- Line Chart
Column- Area Chart
Stacked Column- Aggregation- Line Chart
Stacked Column- Stacked Area Chart
Consumption and Demand Comparisons
Consumption Comparison This feature helps the user to compare the consumption (current and previous) at various timelines.
Johnson Controls Enterprise Management (JEM) Product Bulletin 13
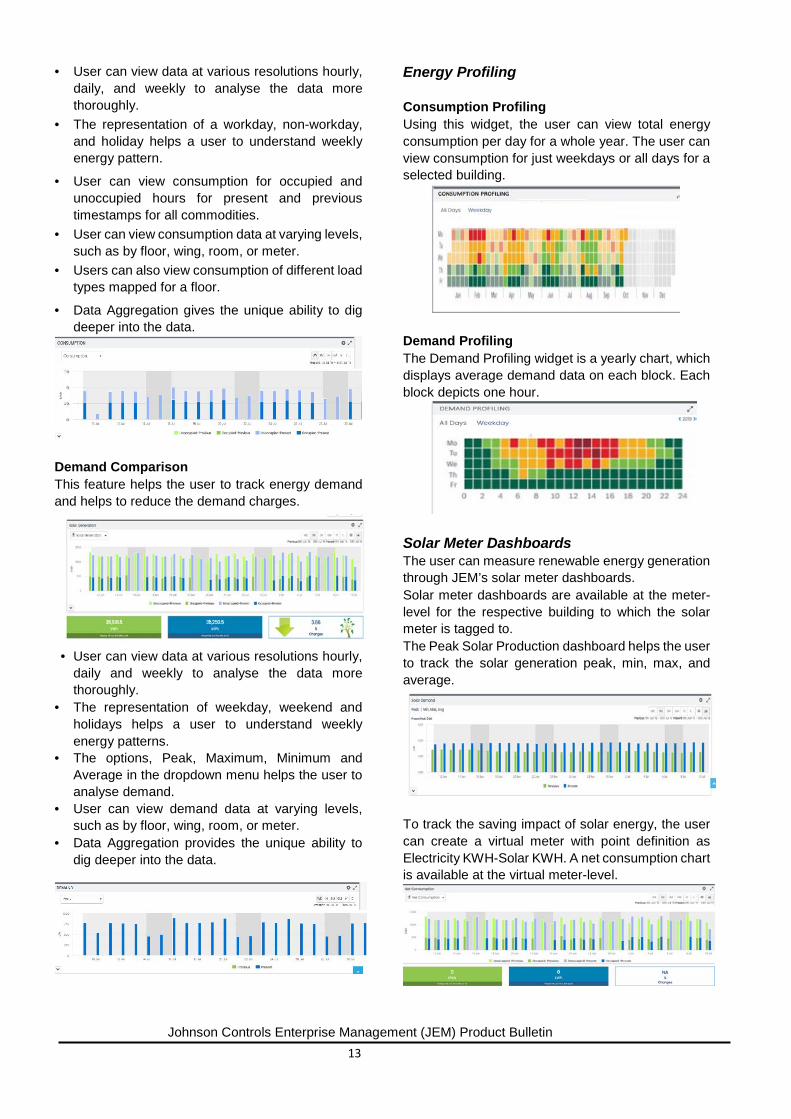
• User can view data at various resolutions hourly, daily, and weekly to analyse the data more thoroughly.
• The representation of a workday, non-workday, and holiday helps a user to understand weekly energy pattern.
• User can view consumption for occupied and unoccupied hours for present and previous timestamps for all commodities.
• User can view consumption data at varying levels, such as by floor, wing, room, or meter.
• Users can also view consumption of different load types mapped for a floor.
• Data Aggregation gives the unique ability to dig deeper into the data.
Demand Comparison This feature helps the user to track energy demand and helps to reduce the demand charges.
• User can view data at various resolutions hourly, daily and weekly to analyse the data more thoroughly.
• The representation of weekday, weekend and holidays helps a user to understand weekly energy patterns.
• The options, Peak, Maximum, Minimum and Average in the dropdown menu helps the user to analyse demand.
• User can view demand data at varying levels, such as by floor, wing, room, or meter.
• Data Aggregation provides the unique ability to dig deeper into the data.
Energy Profiling
Consumption Profiling Using this widget, the user can view total energy consumption per day for a whole year. The user can view consumption for just weekdays or all days for a selected building.
Demand Profiling The Demand Profiling widget is a yearly chart, which displays average demand data on each block. Each block depicts one hour.
Solar Meter Dashboards The user can measure renewable energy generation through JEM’s solar meter dashboards. Solar meter dashboards are available at the meter-level for the respective building to which the solar meter is tagged to. The Peak Solar Production dashboard helps the user to track the solar generation peak, min, max, and average.
To track the saving impact of solar energy, the user can create a virtual meter with point definition as Electricity KWH-Solar KWH. A net consumption chart is available at the virtual meter-level.
Johnson Controls Enterprise Management (JEM) Product Bulletin 14
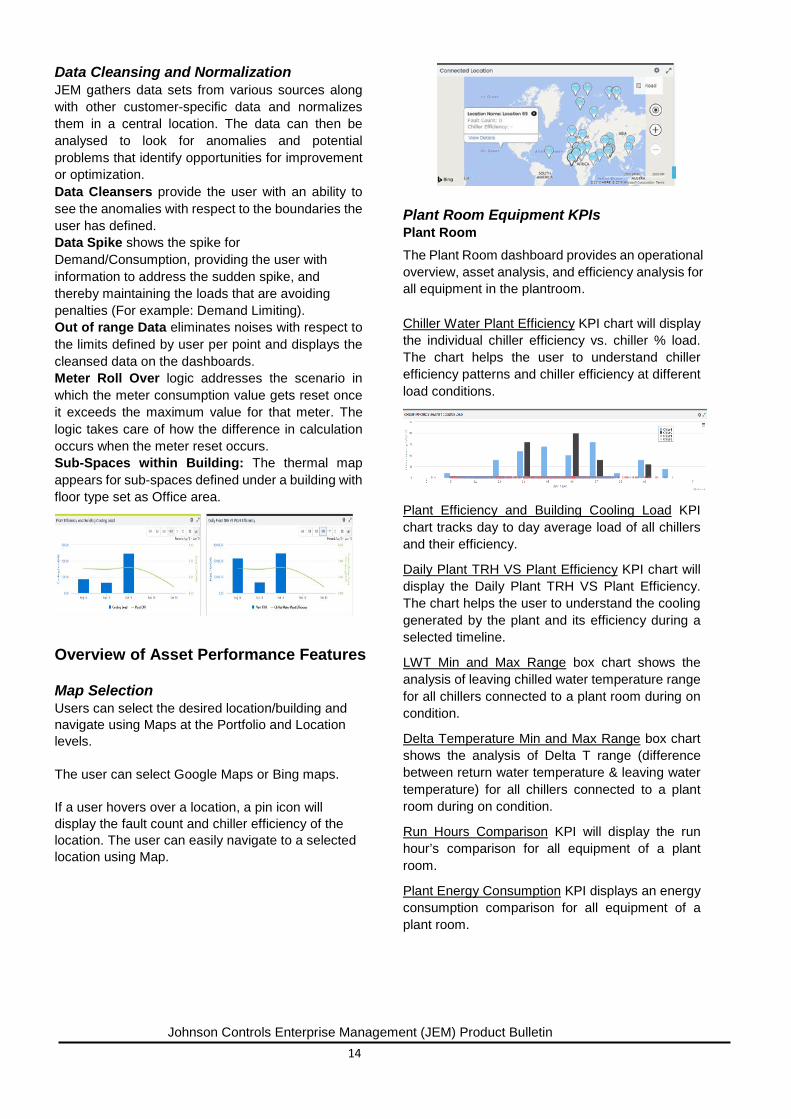
Data Cleansing and Normalization JEM gathers data sets from various sources along with other customer-specific data and normalizes them in a central location. The data can then be analysed to look for anomalies and potential problems that identify opportunities for improvement or optimization. Data Cleansers provide the user with an ability to see the anomalies with respect to the boundaries the user has defined. Data Spike shows the spike for Demand/Consumption, providing the user with information to address the sudden spike, and thereby maintaining the loads that are avoiding penalties (For example: Demand Limiting). Out of range Data eliminates noises with respect to the limits defined by user per point and displays the cleansed data on the dashboards. Meter Roll Over logic addresses the scenario in which the meter consumption value gets reset once it exceeds the maximum value for that meter. The logic takes care of how the difference in calculation occurs when the meter reset occurs. Sub-Spaces within Building: The thermal map appears for sub-spaces defined under a building with floor type set as Office area.
Overview of Asset Performance Features
Map Selection Users can select the desired location/building and navigate using Maps at the Portfolio and Location levels. The user can select Google Maps or Bing maps.
If a user hovers over a location, a pin icon will display the fault count and chiller efficiency of the location. The user can easily navigate to a selected location using Map.
Plant Room Equipment KPIs Plant Room The Plant Room dashboard provides an operational overview, asset analysis, and efficiency analysis for all equipment in the plantroom. Chiller Water Plant Efficiency KPI chart will display the individual chiller efficiency vs. chiller % load. The chart helps the user to understand chiller efficiency patterns and chiller efficiency at different load conditions.
Plant Efficiency and Building Cooling Load KPI chart tracks day to day average load of all chillers and their efficiency.
Daily Plant TRH VS Plant Efficiency KPI chart will display the Daily Plant TRH VS Plant Efficiency. The chart helps the user to understand the cooling generated by the plant and its efficiency during a selected timeline.
LWT Min and Max Range box chart shows the analysis of leaving chilled water temperature range for all chillers connected to a plant room during on condition.
Delta Temperature Min and Max Range box chart shows the analysis of Delta T range (difference between return water temperature & leaving water temperature) for all chillers connected to a plant room during on condition.
Run Hours Comparison KPI will display the run hour’s comparison for all equipment of a plant room.
Plant Energy Consumption KPI displays an energy consumption comparison for all equipment of a plant room.

Johnson Controls Enterprise Management (JEM) Product Bulletin 15
Chiller Consumption Baseline KPI will correlate energy with Chiller system. It will display the energy consumption against a reference energy consumption baseline for a set interval of time. Users can also view the deviation from the baseline condition in percentage and kilowatt hours.
Chiller Supply Temperature and Chiller Active Power KPI will display a chart of the energy demand of a chiller and the chiller supply temperature.
Cooling Tower Leaving Temperature and Active Power KPI will display the temperature of the water leaving the cooling tower versus the demand for power for the cooling tower. Building Cooling Load & OAT KPI displays the total cooling load against outside air temperature for the selected time resolution, which helps to understand how the building load varies with changing ambient temperature.
Chilled Water Plant Fault Category Analysis allows the user to view faults for all chilled water plant equipment categorized as per priority and Category. The user can easily navigate to respective equipment for a more detailed analysis.
Airside (AHU, RTU, VAV, Fan Coil, etc.) KPIs Equipment specific (AHU, Relief Air fans, Exhaust Fans, Supply Fans, Packaged unit, FCU, Active Chilled beam) Equipment Operation Dashboard displays the various modes of operation for a particular equipment in a time series format for the selected time resolution.
Equipment Fault Dashboard enlists the faults encountered in a particular equipment in a time series format for the selected time resolution.
Equipment Trend Dashboard displays trends of important parameters related to the equipment operation for the selected time resolution. The parameters will change based on the equipment selected from the equipment tree.
Waterside (Chiller, Boiler, etc.) KPIs Equipment Specific – Chiller Chiller Fault KPI displays the faults encountered in the Chiller, in a time series format, for the selected time resolution.
Chiller COP KPI displays chiller efficiency (COP) for the selected chiller from the equipment tree for the selected time resolution.
Chiller Trend KPI displays trends of important parameters related to the Chiller’s operation for the selected time resolution.
Chiller Run hours & OAT KPI displays chiller specific run hours against outside air temperature for the selected time resolution, which helps to understand how run hours’ durations vary with changing ambient conditions.
Johnson Controls Enterprise Management (JEM) Product Bulletin 16
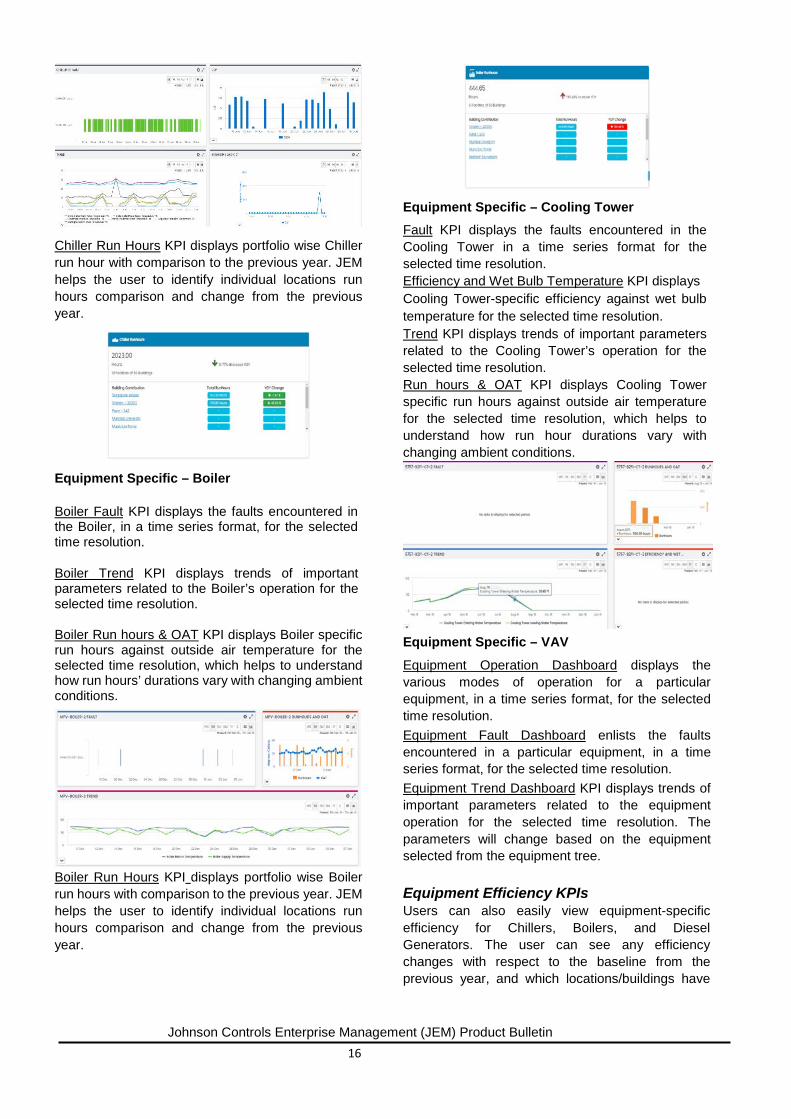
Chiller Run Hours KPI displays portfolio wise Chiller run hour with comparison to the previous year. JEM helps the user to identify individual locations run hours comparison and change from the previous year.
Equipment Specific – Boiler
Boiler Fault KPI displays the faults encountered in the Boiler, in a time series format, for the selected time resolution.
Boiler Trend KPI displays trends of important parameters related to the Boiler’s operation for the selected time resolution. Boiler Run hours & OAT KPI displays Boiler specific run hours against outside air temperature for the selected time resolution, which helps to understand how run hours’ durations vary with changing ambient conditions.
Boiler Run Hours KPI displays portfolio wise Boiler run hours with comparison to the previous year. JEM helps the user to identify individual locations run hours comparison and change from the previous year.
Equipment Specific – Cooling Tower Fault KPI displays the faults encountered in the Cooling Tower in a time series format for the selected time resolution. Efficiency and Wet Bulb Temperature KPI displays Cooling Tower-specific efficiency against wet bulb temperature for the selected time resolution. Trend KPI displays trends of important parameters related to the Cooling Tower’s operation for the selected time resolution. Run hours & OAT KPI displays Cooling Tower specific run hours against outside air temperature for the selected time resolution, which helps to understand how run hour durations vary with changing ambient conditions.
Equipment Specific – VAV
Equipment Operation Dashboard displays the various modes of operation for a particular equipment, in a time series format, for the selected time resolution. Equipment Fault Dashboard enlists the faults encountered in a particular equipment, in a time series format, for the selected time resolution. Equipment Trend Dashboard KPI displays trends of important parameters related to the equipment operation for the selected time resolution. The parameters will change based on the equipment selected from the equipment tree. Equipment Efficiency KPIs Users can also easily view equipment-specific efficiency for Chillers, Boilers, and Diesel Generators. The user can see any efficiency changes with respect to the baseline from the previous year, and which locations/buildings have

Johnson Controls Enterprise Management (JEM) Product Bulletin 17
contributed to an increase or decrease in Average Efficiencies. In addition, the user can also see the impact of faults generated by all equipment.
Equipment Fault Detection and Diagnostics (FDD) Equipment FDD gathers data from sensors and equipment, then applies complex algorithms to uncover potential problems, alerting staff to an impending issue, and identifying the issue’s cause. Easy-to-understand visual displays help technicians quickly zone in on a preventative solution, dramatically reducing baseline energy consumption, capital costs, and equipment wear. Fault Notification A Bell icon, which is an indicator of a Fault Notification, is located in the upper right corner of the screen, and notifies the user of all the latest faults. This Bell icon is present throughout the application, including the setup screen, so that the user can easily review the last 30 days of faults while on any page. The user can see all the faults by clicking the Bell icon. • The number on the Bell icon is representative of
the number of all unacknowledged faults from the last 30 days.
• Clicking the Filter icon in the upper right-hand corner allows the user to filter and display the faults by priority.
• Clicking the Information icon on the right-hand side of the fault displays the Portfolio, Location and Equipment associated with the fault.
• Clicking the Acknowledge icon on the right-hand side of the fault acknowledges and removes the fault from the notification window.
Fault Dashboards Fault Dashboards help the user to quickly and easily identify what spaces are affected by faults. Both dimensions of Fault Counts and Fault Duration are covered. The percentage deviation gives an easy view of the fault trend compared to the last period. Major benefits include: • Provides the user with a complete view of the
Faults and prioritizing them • Categorical distinguishing of faults:
• Fault By Space - gives Fault Count/Duration at the selected Space Level
• Fault By Equipment Category - Gives Fault Count/Duration at the selected Equipment Category Level
• Fault by Type - Gives Fault Count/Duration by Fault Types (Fault Names)
• Easy navigation to get to the Fault root-cause with the Space to Equipment link
• From equipment to the points causing Fault View (Fault Trend View)
• Details of Faults at varying levels: by floor, wing, room, or meter.
• Top Five Faults • Faults Trend
Use the Search function to search for equipment names, fault names, etc. Clicking on a fault reveals the details. A single fault may have multiple diagnostics. Each diagnostic runs an equation and its duration is calculated separately. The diagnostic with the highest duration will be shown at the top, which helps the user to decide at the most probable diagnostic. Each diagnostic can have multiple reasons mapped. These will appear when clicking a particular diagnostic. The equipment relationship gives the fault status of the parent/child equipment, using a color code of red (fault) and green (no fault).
Johnson Controls Enterprise Management (JEM) Product Bulletin 18
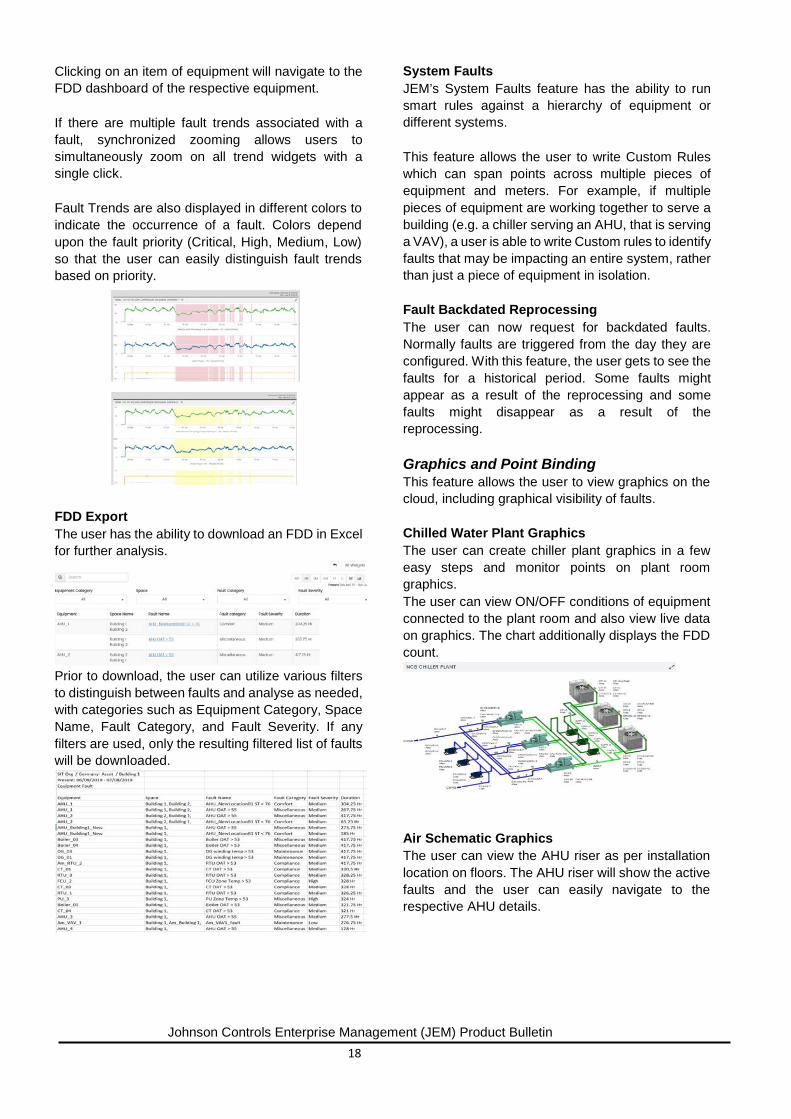
Clicking on an item of equipment will navigate to the FDD dashboard of the respective equipment. If there are multiple fault trends associated with a fault, synchronized zooming allows users to simultaneously zoom on all trend widgets with a single click.
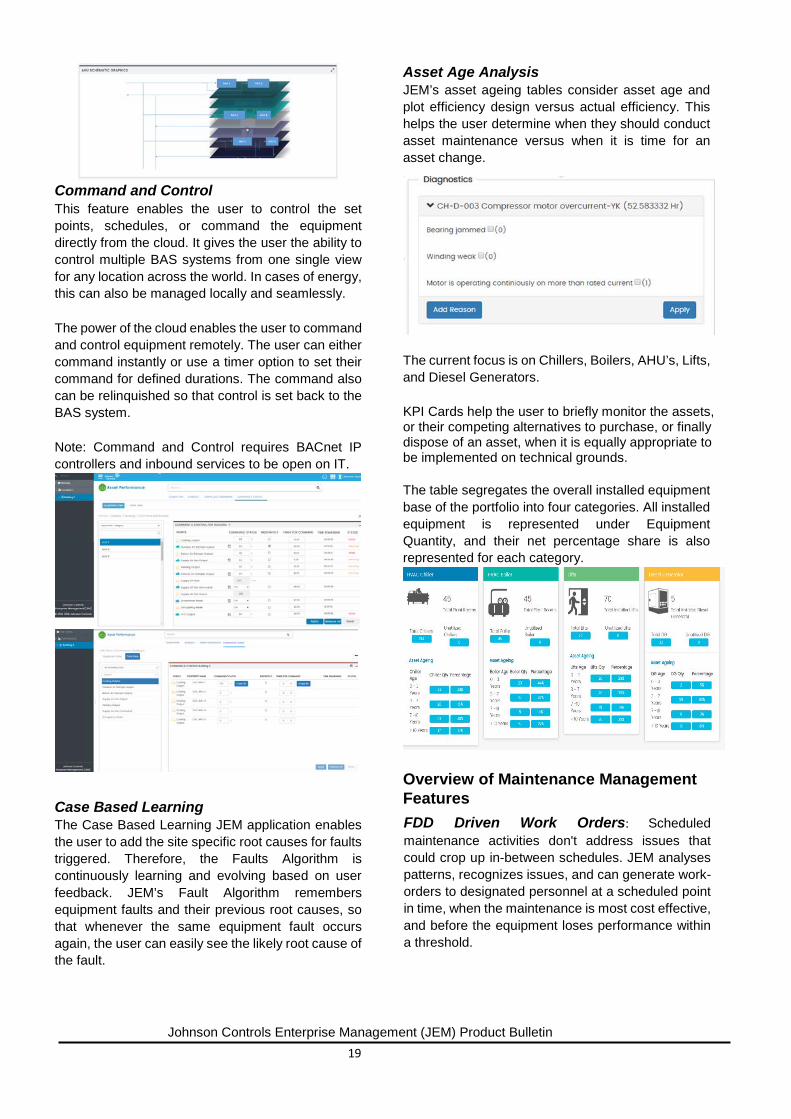
Fault Trends are also displayed in different colors to indicate the occurrence of a fault. Colors depend upon the fault priority (Critical, High, Medium, Low) so that the user can easily distinguish fault trends based on priority. FDD Export The user has the ability to download an FDD in Excel for further analysis.
Prior to download, the user can utilize various filters to distinguish between faults and analyse as needed, with categories such as Equipment Category, Space Name, Fault Category, and Fault Severity. If any filters are used, only the resulting filtered list of faults will be downloaded.
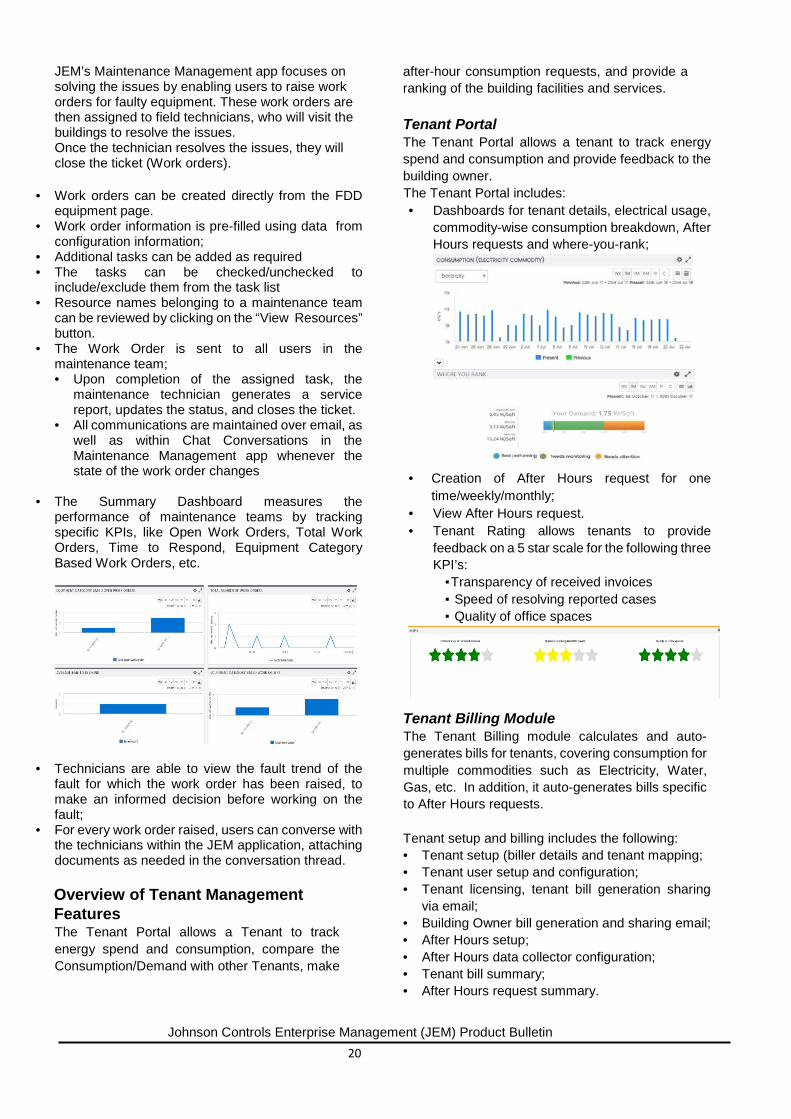
System Faults JEM’s System Faults feature has the ability to run smart rules against a hierarchy of equipment or different systems. This feature allows the user to write Custom Rules which can span points across multiple pieces of equipment and meters. For example, if multiple pieces of equipment are working together to serve a building (e.g. a chiller serving an AHU, that is serving a VAV), a user is able to write Custom rules to identify faults that may be impacting an entire system, rather than just a piece of equipment in isolation. Fault Backdated Reprocessing The user can now request for backdated faults. Normally faults are triggered from the day they are configured. With this feature, the user gets to see the faults for a historical period. Some faults might appear as a result of the reprocessing and some faults might disappear as a result of the reprocessing. Graphics and Point Binding This feature allows the user to view graphics on the cloud, including graphical visibility of faults. Chilled Water Plant Graphics The user can create chiller plant graphics in a few easy steps and monitor points on plant room graphics. The user can view ON/OFF conditions of equipment connected to the plant room and also view live data on graphics. The chart additionally displays the FDD count.
Air Schematic Graphics The user can view the AHU riser as per installation location on floors. The AHU riser will show the active faults and the user can easily navigate to the respective AHU details.
Johnson Controls Enterprise Management (JEM) Product Bulletin 19
Command and Control This feature enables the user to control the set points, schedules, or command the equipment directly from the cloud. It gives the user the ability to control multiple BAS systems from one single view for any location across the world. In cases of energy, this can also be managed locally and seamlessly. The power of the cloud enables the user to command and control equipment remotely. The user can either command instantly or use a timer option to set their command for defined durations. The command also can be relinquished so that control is set back to the BAS system. Note: Command and Control requires BACnet IP controllers and inbound services to be open on IT.
Case Based Learning The Case Based Learning JEM application enables the user to add the site specific root causes for faults triggered. Therefore, the Faults Algorithm is continuously learning and evolving based on user feedback. JEM’s Fault Algorithm remembers equipment faults and their previous root causes, so that whenever the same equipment fault occurs again, the user can easily see the likely root cause of the fault.
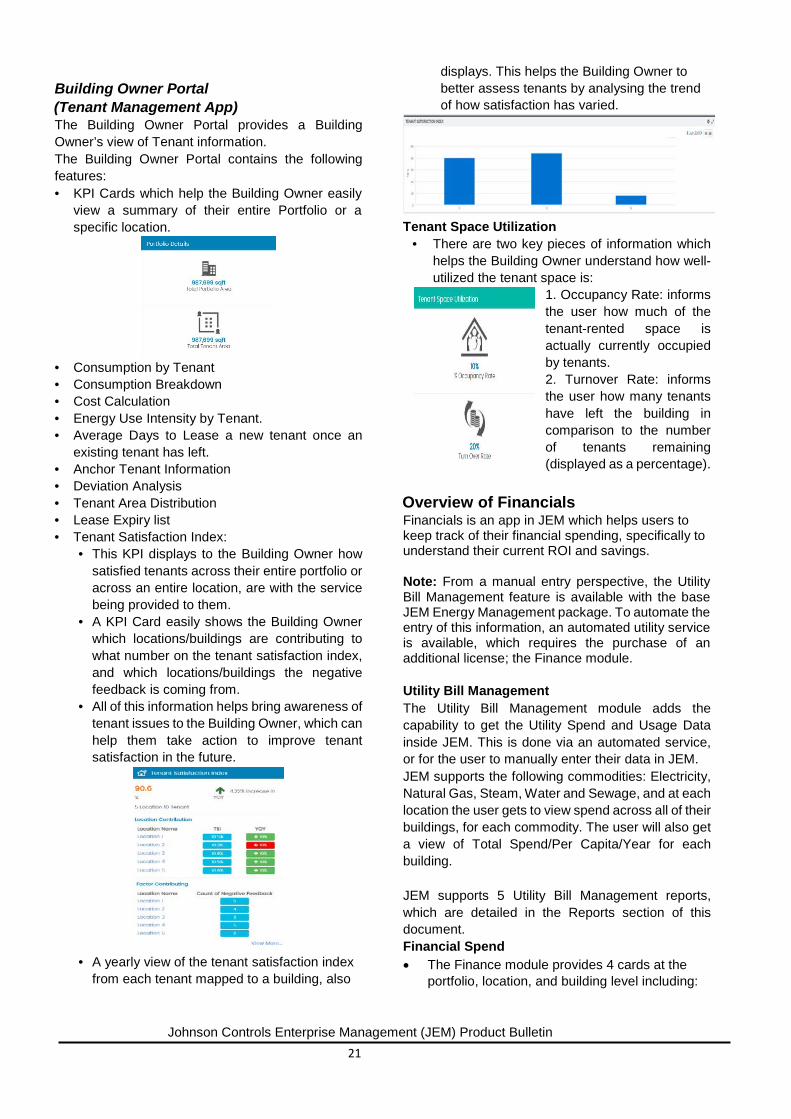
Asset Age Analysis JEM’s asset ageing tables consider asset age and plot efficiency design versus actual efficiency. This helps the user determine when they should conduct asset maintenance versus when it is time for an asset change.
The current focus is on Chillers, Boilers, AHU’s, Lifts, and Diesel Generators. KPI Cards help the user to briefly monitor the assets, or their competing alternatives to purchase, or finally dispose of an asset, when it is equally appropriate to be implemented on technical grounds. The table segregates the overall installed equipment base of the portfolio into four categories. All installed equipment is represented under Equipment Quantity, and their net percentage share is also represented for each category.
Overview of Maintenance Management Features FDD Driven Work Orders: Scheduled maintenance activities don't address issues that could crop up in-between schedules. JEM analyses patterns, recognizes issues, and can generate work-orders to designated personnel at a scheduled point in time, when the maintenance is most cost effective, and before the equipment loses performance within a threshold.
Johnson Controls Enterprise Management (JEM) Product Bulletin 20
JEM’s Maintenance Management app focuses on solving the issues by enabling users to raise work orders for faulty equipment. These work orders are then assigned to field technicians, who will visit the buildings to resolve the issues. Once the technician resolves the issues, they will close the ticket (Work orders).
• Work orders can be created directly from the FDD equipment page.
• Work order information is pre-filled using data from configuration information;
• Additional tasks can be added as required • The tasks can be checked/unchecked to
include/exclude them from the task list • Resource names belonging to a maintenance team
can be reviewed by clicking on the “View Resources” button.
• The Work Order is sent to all users in the maintenance team; • Upon completion of the assigned task, the
maintenance technician generates a service report, updates the status, and closes the ticket.
• All communications are maintained over email, as well as within Chat Conversations in the Maintenance Management app whenever the state of the work order changes
• The Summary Dashboard measures the
performance of maintenance teams by tracking specific KPIs, like Open Work Orders, Total Work Orders, Time to Respond, Equipment Category Based Work Orders, etc.
• Technicians are able to view the fault trend of the fault for which the work order has been raised, to make an informed decision before working on the fault;
• For every work order raised, users can converse with the technicians within the JEM application, attaching documents as needed in the conversation thread. Overview of Tenant Management Features The Tenant Portal allows a Tenant to track energy spend and consumption, compare the Consumption/Demand with other Tenants, make
after-hour consumption requests, and provide a ranking of the building facilities and services. Tenant Portal The Tenant Portal allows a tenant to track energy spend and consumption and provide feedback to the building owner. The Tenant Portal includes: • Dashboards for tenant details, electrical usage,
commodity-wise consumption breakdown, After Hours requests and where-you-rank;
• Creation of After Hours request for one
time/weekly/monthly; • View After Hours request. • Tenant Rating allows tenants to provide
feedback on a 5 star scale for the following three KPI’s: ▪ Transparency of received invoices ▪ Speed of resolving reported cases ▪ Quality of office spaces
Tenant Billing Module The Tenant Billing module calculates and auto-generates bills for tenants, covering consumption for multiple commodities such as Electricity, Water, Gas, etc. In addition, it auto-generates bills specific to After Hours requests. Tenant setup and billing includes the following: • Tenant setup (biller details and tenant mapping; • Tenant user setup and configuration; • Tenant licensing, tenant bill generation sharing
via email; • Building Owner bill generation and sharing email; • After Hours setup; • After Hours data collector configuration; • Tenant bill summary; • After Hours request summary.
Johnson Controls Enterprise Management (JEM) Product Bulletin 21
Building Owner Portal (Tenant Management App) The Building Owner Portal provides a Building Owner’s view of Tenant information. The Building Owner Portal contains the following features: • KPI Cards which help the Building Owner easily
view a summary of their entire Portfolio or a specific location.
• Consumption by Tenant • Consumption Breakdown • Cost Calculation • Energy Use Intensity by Tenant. • Average Days to Lease a new tenant once an
existing tenant has left. • Anchor Tenant Information • Deviation Analysis • Tenant Area Distribution • Lease Expiry list • Tenant Satisfaction Index:
• This KPI displays to the Building Owner how satisfied tenants across their entire portfolio or across an entire location, are with the service being provided to them.
• A KPI Card easily shows the Building Owner which locations/buildings are contributing to what number on the tenant satisfaction index, and which locations/buildings the negative feedback is coming from.
• All of this information helps bring awareness of tenant issues to the Building Owner, which can help them take action to improve tenant satisfaction in the future.
• A yearly view of the tenant satisfaction index
from each tenant mapped to a building, also
displays. This helps the Building Owner to better assess tenants by analysing the trend of how satisfaction has varied.
Tenant Space Utilization
• There are two key pieces of information which helps the Building Owner understand how well-utilized the tenant space is:
1. Occupancy Rate: informs the user how much of the tenant-rented space is actually currently occupied by tenants. 2. Turnover Rate: informs the user how many tenants have left the building in comparison to the number of tenants remaining (displayed as a percentage).
Overview of Financials Financials is an app in JEM which helps users to keep track of their financial spending, specifically to understand their current ROI and savings. Note: From a manual entry perspective, the Utility Bill Management feature is available with the base JEM Energy Management package. To automate the entry of this information, an automated utility service is available, which requires the purchase of an additional license; the Finance module. Utility Bill Management The Utility Bill Management module adds the capability to get the Utility Spend and Usage Data inside JEM. This is done via an automated service, or for the user to manually enter their data in JEM. JEM supports the following commodities: Electricity, Natural Gas, Steam, Water and Sewage, and at each location the user gets to view spend across all of their buildings, for each commodity. The user will also get a view of Total Spend/Per Capita/Year for each building. JEM supports 5 Utility Bill Management reports, which are detailed in the Reports section of this document. Financial Spend • The Finance module provides 4 cards at the
portfolio, location, and building level including:

Johnson Controls Enterprise Management (JEM) Product Bulletin 22
• Utility Consumption • Space & Infra • People & Services • Capital Expenses
Each of the KPI’s have a comparison of budgeted costs versus actual costs based upon the selection of timelines. This helps the user to compare their finances against the target to see whether spending is on track or if it’s higher than expected. Each KPI’s actual spend is broken down into components to help the user identify where most of the expense has occurred. The analytics focus on the ‘what’, ‘where’, and ‘why’ for each of the KPIs. Further details regarding the user’s spending in these individual four categories can be viewed at the location level in terms of Cost/Area/Year.
• The user can also view Operating Expenses
regarding each of the four categories. • The user can view Total Energy Spend for each
commodity in a yearly or monthly format, a Total Cost Breakdown for each commodity for the last
12 months, and a Rolling Trend of Energy Use/Cost.
• Location Performance
• This widget gives an overall view of the spending from different buildings under the selected location for Utility Consumption, Space & Infrastructure, People & Services, and Capital Expenses.
• Account Level Dashboard
• The account level dashboard shows the account level data for each commodity, including consumption and cost.
• It displays a break down at an invoice level, capturing the usage and cost for each billing period.
• Additional information of consumption per billing day and unit cost can also be found here.
Space Performance The Space Performance module is available only with the purchase of the Johnson Controls’ Companion occupant app. Space Performance focuses on the productivity of the people occupying a building. It includes: Meeting Room Utilization
• This widget gives a view of bookings of the meeting room under the selected building, for any given day. This will help the user to understand how each meeting room is being used on a daily basis.
• The location managers are then better equipped with data to best utilize the underutilized space.
Johnson Controls Enterprise Management (JEM) Product Bulletin 23
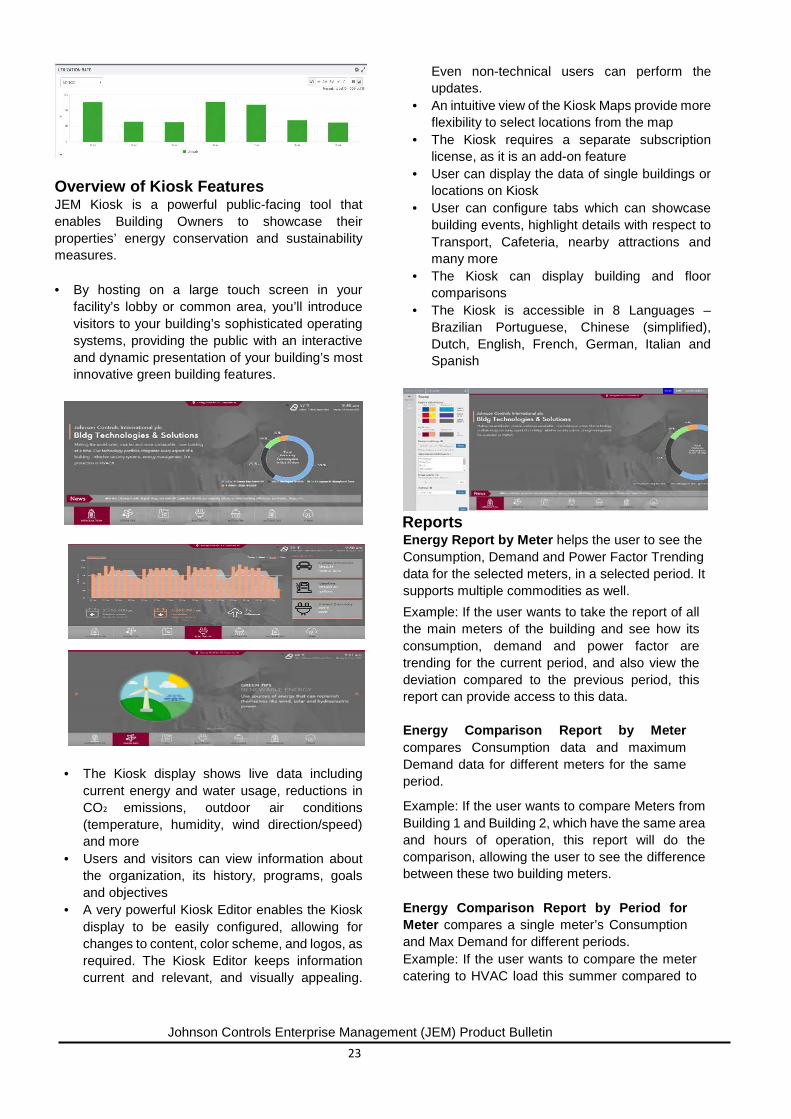
Overview of Kiosk Features JEM Kiosk is a powerful public-facing tool that enables Building Owners to showcase their properties’ energy conservation and sustainability measures.
• By hosting on a large touch screen in your
facility’s lobby or common area, you’ll introduce visitors to your building’s sophisticated operating systems, providing the public with an interactive and dynamic presentation of your building’s most innovative green building features.
• The Kiosk display shows live data including current energy and water usage, reductions in CO2 emissions, outdoor air conditions (temperature, humidity, wind direction/speed) and more
• Users and visitors can view information about the organization, its history, programs, goals and objectives
• A very powerful Kiosk Editor enables the Kiosk display to be easily configured, allowing for changes to content, color scheme, and logos, as required. The Kiosk Editor keeps information current and relevant, and visually appealing.
Even non-technical users can perform the updates.
• An intuitive view of the Kiosk Maps provide more flexibility to select locations from the map
• The Kiosk requires a separate subscription license, as it is an add-on feature
• User can display the data of single buildings or locations on Kiosk
• User can configure tabs which can showcase building events, highlight details with respect to Transport, Cafeteria, nearby attractions and many more
• The Kiosk can display building and floor comparisons
• The Kiosk is accessible in 8 Languages – Brazilian Portuguese, Chinese (simplified), Dutch, English, French, German, Italian and Spanish
Reports Energy Report by Meter helps the user to see the Consumption, Demand and Power Factor Trending data for the selected meters, in a selected period. It supports multiple commodities as well. Example: If the user wants to take the report of all the main meters of the building and see how its consumption, demand and power factor are trending for the current period, and also view the deviation compared to the previous period, this report can provide access to this data. Energy Comparison Report by Meter compares Consumption data and maximum Demand data for different meters for the same period.
Example: If the user wants to compare Meters from Building 1 and Building 2, which have the same area and hours of operation, this report will do the comparison, allowing the user to see the difference between these two building meters. Energy Comparison Report by Period for Meter compares a single meter’s Consumption and Max Demand for different periods. Example: If the user wants to compare the meter catering to HVAC load this summer compared to
Johnson Controls Enterprise Management (JEM) Product Bulletin 24
last summer, and looks for any deviations, this report will help the user to see this.
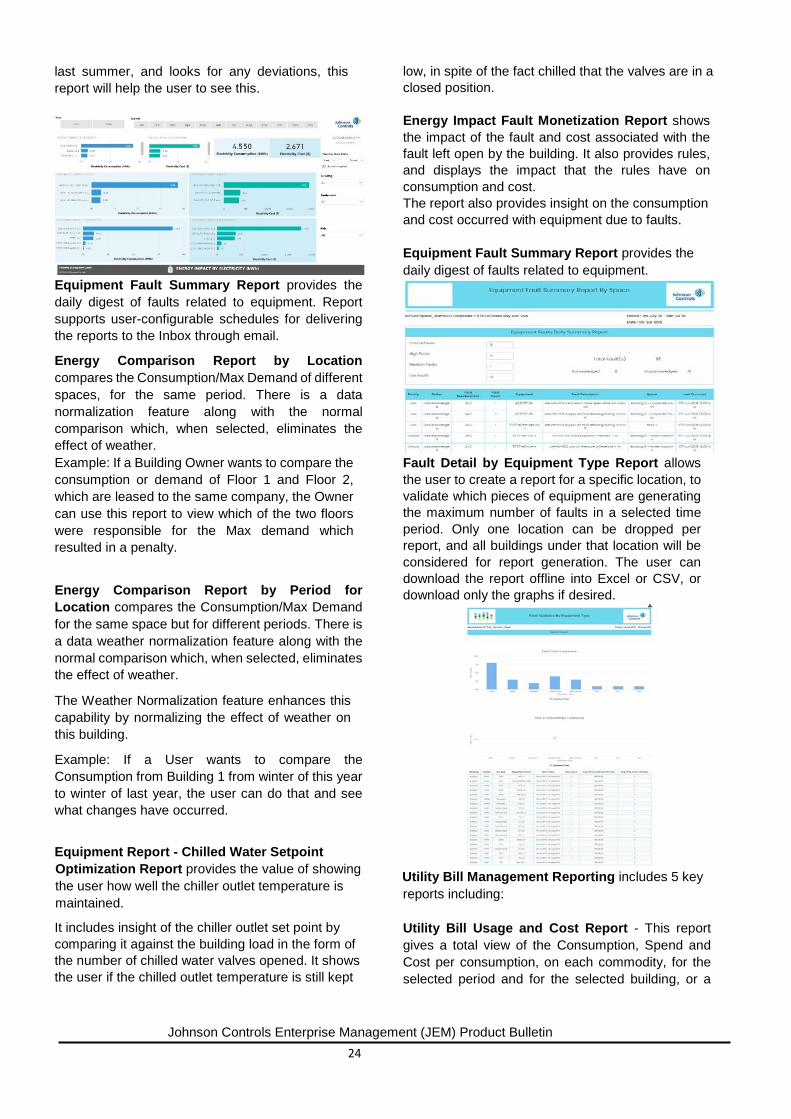
Equipment Fault Summary Report provides the daily digest of faults related to equipment. Report supports user-configurable schedules for delivering the reports to the Inbox through email.
Energy Comparison Report by Location compares the Consumption/Max Demand of different spaces, for the same period. There is a data normalization feature along with the normal comparison which, when selected, eliminates the effect of weather. Example: If a Building Owner wants to compare the consumption or demand of Floor 1 and Floor 2, which are leased to the same company, the Owner can use this report to view which of the two floors were responsible for the Max demand which resulted in a penalty.
Energy Comparison Report by Period for Location compares the Consumption/Max Demand for the same space but for different periods. There is a data weather normalization feature along with the normal comparison which, when selected, eliminates the effect of weather.
The Weather Normalization feature enhances this capability by normalizing the effect of weather on this building.
Example: If a User wants to compare the Consumption from Building 1 from winter of this year to winter of last year, the user can do that and see what changes have occurred.
Equipment Report - Chilled Water Setpoint Optimization Report provides the value of showing the user how well the chiller outlet temperature is maintained.
It includes insight of the chiller outlet set point by comparing it against the building load in the form of the number of chilled water valves opened. It shows the user if the chilled outlet temperature is still kept
low, in spite of the fact chilled that the valves are in a closed position. Energy Impact Fault Monetization Report shows the impact of the fault and cost associated with the fault left open by the building. It also provides rules, and displays the impact that the rules have on consumption and cost. The report also provides insight on the consumption and cost occurred with equipment due to faults. Equipment Fault Summary Report provides the daily digest of faults related to equipment.
Fault Detail by Equipment Type Report allows the user to create a report for a specific location, to validate which pieces of equipment are generating the maximum number of faults in a selected time period. Only one location can be dropped per report, and all buildings under that location will be considered for report generation. The user can download the report offline into Excel or CSV, or download only the graphs if desired.
Utility Bill Management Reporting includes 5 key reports including: Utility Bill Usage and Cost Report - This report gives a total view of the Consumption, Spend and Cost per consumption, on each commodity, for the selected period and for the selected building, or a
Johnson Controls Enterprise Management (JEM) Product Bulletin 25
group of buildings. The user can get data at a monthly or yearly level.
Utility Bill Gap Report – The Gap Report uncovers and presents a gap in billing to the user. It looks for the billing period and the reporting frequency of invoices for each account, and helps the user understand if there are any gaps in accounts.
Utility Bill Detail Report - The bill detail report presents the user with a breakdown of the bill, consolidated at each building or multiple buildings. The breakdown is done for the following categories; Consumption, Demand, Fees, Penalties, Miscellaneous and Taxes.
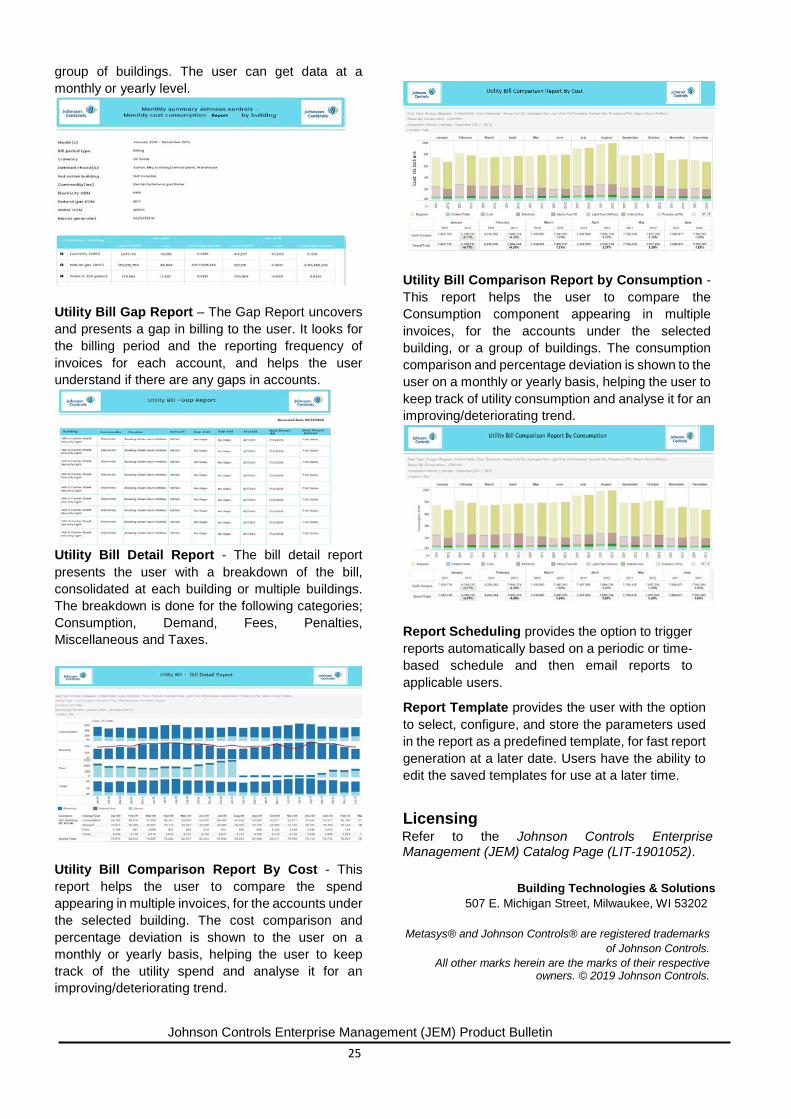
Utility Bill Comparison Report By Cost - This report helps the user to compare the spend appearing in multiple invoices, for the accounts under the selected building. The cost comparison and percentage deviation is shown to the user on a monthly or yearly basis, helping the user to keep track of the utility spend and analyse it for an improving/deteriorating trend.
Utility Bill Comparison Report by Consumption - This report helps the user to compare the Consumption component appearing in multiple invoices, for the accounts under the selected building, or a group of buildings. The consumption comparison and percentage deviation is shown to the user on a monthly or yearly basis, helping the user to keep track of utility consumption and analyse it for an improving/deteriorating trend.
Report Scheduling provides the option to trigger reports automatically based on a periodic or time-based schedule and then email reports to applicable users.
Report Template provides the user with the option to select, configure, and store the parameters used in the report as a predefined template, for fast report generation at a later date. Users have the ability to edit the saved templates for use at a later time.
Licensing Refer to the Johnson Controls Enterprise Management (JEM) Catalog Page (LIT-1901052).
Building Technologies & Solutions
507 E. Michigan Street, Milwaukee, WI 53202
Metasys® and Johnson Controls® are registered trademarks of Johnson Controls.
All other marks herein are the marks of their respective owners. © 2019 Johnson Controls.