joint expert opinion - man group · in case of any inconsistencies between the german and english...
TRANSCRIPT

Joint Expert Opinion
on the Equity Value
of MAN SE,
Munich,
as well as on an appropriate recurring compensation payment and an appro-
priate cash compensation in accordance with § 304 AktG, § 305 AktG as at
6 June 2013 in connection with the intended domination and profit and loss
transfer agreement according to § 291.1 AktG between Truck & Bus GmbH,
Wolfsburg and MAN SE, Munich
This English version serves only as an explanatory note and shall not be signed by us.
In case of any inconsistencies between the German and English version of our joint expert opinion,
the German version shall prevail.

PricewaterhouseCoopers Aktiengesellschaft Wirtschaftsprüfungsgesellschaft
is one of the autonomous and
legally independent member companies of the international PricewaterhouseCoopers network cooperating under PricewaterhouseCoopers International Limited.
-
KPMG AG Wirtschaftsprüfungsgesellschaft,
a subsidiary of KPMG Europe LLP and
a member firm of the KPMG network of independent member firms affiliated with KPMG International Cooperative, a Swiss entity.

KPMG PwC
3
Xx
Table of Contents Page
A. Engagement and scope of work ......................................................................................................... 12
B. Principles and methods of valuation .................................................................................................. 15
I. Basics of the valuation ............................................................................................................. 15
II. Appropriate cash compensation according to § 305 AktG ...................................................... 18
III. Appropriate recurring compensation payment according to § 304 AktG ............................... 18
C. Description of the valuation object .................................................................................................... 19
I. Legal and tax situation ............................................................................................................. 19
II. Economic fundamentals .......................................................................................................... 24
1. Business activity .............................................................................................................. 24
a) General information .................................................................................................. 24
b) MAN Truck & Bus division ......................................................................................... 24
c) MAN Latin America division ...................................................................................... 25
d) MAN Diesel & Turbo division ..................................................................................... 26
e) Renk division .............................................................................................................. 28
2. Market and competition ................................................................................................. 30
a) Preliminary remark and economic indicators in comparison.................................... 30
b) Market positioning and competitive environment in the MAN Truck & Bus
division ....................................................................................................................... 31
c) Market positioning and competitive environment in the MAN Latin America
division ....................................................................................................................... 46
d) Market positioning and competitive environment in the MAN Diesel and
Turbo division ............................................................................................................ 49
e) Market positioning and competitive environment in the Renk division ................... 58
3. Net assets, financial position and results of operations ................................................. 63
a) Net assets and financial position ............................................................................... 63
b) Results of operations ................................................................................................. 67
c) Adjustment of the results of operations ................................................................... 73
4. Major success factors of the MAN Group’s business model .......................................... 74
D. Determination of equity value ........................................................................................................... 77
I. Basis for valuation .................................................................................................................... 77
1. Valuation approach and assumptions ............................................................................ 77

KPMG PwC
4
Xx
Table of Contents Page
2. Forecasting procedure and accuracy .............................................................................. 79
II. Financial projections ................................................................................................................ 82
1. Financial planning of earnings before interest and taxes (EBIT) .................................... 82
a) Financial planning of the MAN group ........................................................................ 82
b) Financial planning of MAN Truck & Bus .................................................................... 83
c) Financial planning of MAN Latin America ................................................................. 90
d) Financial planning of MAN Diesel & Turbo ................................................................ 94
e) Financial planning of Renk ....................................................................................... 100
f) Financial planning of the Corporate Center and consolidation .............................. 103
2. Earnings before interest and tax (EBIT) in the terminal value ...................................... 104
3. Net dividends after personal income tax ..................................................................... 108
III. Determination of the discount rate ....................................................................................... 112
1. Risk-free rate ................................................................................................................ 112
2. Risk premium ................................................................................................................ 113
3. Growth rate .................................................................................................................. 118
4. Derivation of the discount rate .................................................................................... 119
IV. Value of operating assets ....................................................................................................... 120
V. Value of the separately valued assets ................................................................................... 120
1. Properties and buildings ............................................................................................... 120
2. Corporate tax credit ...................................................................................................... 121
VI. Equity value ............................................................................................................................ 121
VII. Liquidation value .................................................................................................................... 121
E. Plausibility assessment of the equity value on the basis of multiples ............................................. 123
I. General approach .................................................................................................................. 123
II. Derivation of the multiples .................................................................................................... 124
III. Multiple valuation .................................................................................................................. 125
F. Determination of appropriate cash compensation pursuant to § 305 AktG and the recurring
compensation payment pursuant to § 304 AktG ............................................................................. 127
I. Share price ............................................................................................................................. 127
II. Determination of the appropriate compensation ................................................................. 130

KPMG PwC
5
Xx
Table of Contents Page
III. Determination of the appropriate recurring compensation payment .................................. 131
G. Summary of results .......................................................................................................................... 136
Appendix
General Engagement Terms for Wirtschaftsprüfer and Wirtschaftsprüfungsgesellschaften (German Pub-
lic Auditors and Public Audit Firms) as at January 1, 2002
For computational reasons, there can be rounding differences in the tables
amounting to ± one unit (€, % etc.).

KPMG PwC
6
Xx
List of abbreviations
% Percent
§ Article
€ Euro
AB Aktiebolag (limited company in Sweden)
AG Aktiengesellschaft (German public limited company)
Agrale Agrale S.A., Caxias do Sul/Brazil
AktE Aktenzeichen OLG (File number of OLG)
AktG Aktiengesetz (German stock corporation act)
AMI International, 2010 "20-Year global naval market forecast: number of ships", Bob Nugent, AMI
International, July 2010
AMI International, 2011 "Changing threats, changing markets – A consideration of the naval future",
AMI International, 2011
Analyse & Prognose Analyse & Prognose GmbH, Wilhelmsfeld
Analyse & Prognose, 2012 "European bus survey report", Analyse & Prognose, August 2012
AO Abgabenordnung (General Tax Code)
Ashok Leyland Ashok Leyland Limited, Chennai/India
BaFin Bundesanstalt für Finanzdienstleistungsaufsicht (Federal Financial Supervi-
sory Authority)
BCG, 2012 "Winning the BRIC truck battle", The Boston Consulting Group, February
2012
BGAV Beherrschungs- und Gewinnabführungsvertrag (domination and profit and
loss transfer agreement)
BGH Bundesgerichtshof (Federal High Court)
bn. billion
BP, 2012 "BP statistical review of world energy 2012", BP p.l.c, London/United King-
dom, June 2012
BRIC Brazil, Russia, India, China
BS Balance sheet
Btu British thermal unit (unit of measurement for energy)
BVerfG Bundesverfassungsgericht (Federal Constitutional Court of Germany)
BvR Aktenzeichen für Verfassungsbeschwerden (File number of an appeal to the
Federal Constitutional Court on a constitutional issue)
CAGR Compound annual growth rate
CAPM Capital asset pricing model
Caterpillar Caterpillar Inc., Peoria/USA

KPMG PwC
7
Xx
CDAX Performance Index Composite DAX
CIQ S&P Capital IQ Inc., a business of the McGraw-Hill Companies, New York
City/USA
CLA Cargo Line A
Clarkson, 2012 "Offshore forecast club report, Spring 2012", Clarkson Research Services
Limited, London/United Kingdom, 2012
CNHDTC China National Heavy Duty Truck Group Company Limited, Jinan/China
Co. Company
Corporate Center Central area consisting of the group holding MAN SE and other companies
Daimler Daimler AG, Stuttgart
DAF DAF Trucks N.V., Eindhoven/Netherlands, a brand of PACCAR
DAX Deutscher Aktienindex (German Stock Index)
DCF Discounted cash flow
Defenceweb.co.za, 2012 "Armoured vehicles MRO market grows while overall market shrinking",
www.defenceweb.co.za, 2012
dena, 2012 dena market analysis 2012: Status and outlook for the worldwide develop-
ment of renewable energies, Deutsche Energie-Agentur GmbH, Berlin, 2012
Deutsche Bank, 2012 "Cement outlook 2013", Deutsche Bank AG, Frankfurt am Main, December
2012
Deutsche Börse AG Deutsche Börse AG (German Stock Exchange), Frankfurt am Main
Dongfeng Dongfeng Motor Corporation, Wuhan/China
E Expected (estimation)
EBIT Earnings before interest and tax
EBITDA Earnings before interest, taxes, depreciation and amortisation
e.g. For example
Eicher Motors Eicher Motors Limited, Delhi/India
EIU Economist Intelligence Unit Limited, London/United Kingdom
et. seq. and the following
EU European Union
EUGH Europäischer Gerichtshof (Court of Justice of the European Union)
EURO-Leasing EURO-Leasing GmbH, Sittensen
EV Enterprise value
e.V. Eingetragener Verein (incorporated association)
EvoBus EvoBus GmbH, Kirchheim unter Teck
Ferrostaal Ferrostaal Aktiengesellschaft, Essen
First Automotive Works First Automotive Works Co., Ltd., Changchun/China

KPMG PwC
8
Xx
FY Fiscal year(s)
GAZ OAO GAZ, Nizhny Novgorod/Russia
GE General Electric Company, Fairfield/USA
GDP Gross domestic product
GmbH Gesellschaft mit beschränkter Haftung (German company with limited liabi-
lity)
GVW Gross vehicle weight
GW Gigawatt
HGB Handelsgesetzbuch (German commercial code)
HHI Hyundai Heavy Industries Co., Ltd., Ulsan/South Korea
hp Horsepower
HR B Handelsregister Abteilung B (trade register section B)
HSH, 2013 "Shipping quarterly 1-2013", HSH Nordbank, February 2013
Hyundai Hyundai Motor Company, Seoul/South Korea
IAS International accounting standard
IDC, 2011 Statement by IDC Research, Framingham/USA, 2011
IDW Institut der Wirtschaftsprüfer in Deutschland e.V. (Institute of Public Audi-
tors in Germany, Incorporated Association), Dusseldorf
IDW S 1 IDW Standard: Grundsätze zur Durchführung von Unternehmensbewertun-
gen (Principles for the performance of business valuations), as at
2 April 2008
i.e. Id est
IEA International Energy Agency, Paris/France
IEA, 2012 IEA – World Energy Outlook 2012
IFRS International Financial Reporting Standard
IHS, 2012 ”Automotive Medium and Heavy Commercial Vehicle Industry Forecast”,
IHS Global Insight, 2012
Inc. Incorporated
IPIC International Petroleum Investment Company, Abu Dhabi/UAE
ISIN International Security Identification Number
Isuzu Motors Isuzu Motors Ltd., Tokyo/Japan
IT Information Technology
Iveco Iveco S.p.A., Turin/Italy ("Iveco")
KAMAZ OAO KAMAZ, Kazan/Russia
KPMG KPMG AG Wirtschaftsprüfungsgesellschaft, Berlin
KPMG, 2011 "Competing in the global truck industry", KPMG, September 2011

KPMG PwC
9
Xx
kW Kilowatt
LMC Automotive Information service provider in the automobile sector, division of LMC In-
ternational Ltd, Oxford/United Kingdom
LMC, 2012 LMC Automotive, Q4 2012
LNG Liquefied natural gas
Ltd. Limited
Ltda. Sociedade Limitada (limited company in Brazil and Portugal)
Mahindra Mahindra & Mahindra Ltd., Mumbai/India
MAN FORCE TRUCKS MAN FORCE TRUCKS Private Limited, Akurdi/India
MAN Group Consolidated MAN SE and its direct and indirect affiliates
MAN SE MAN SE, Munich
MAN Trucks India MAN Trucks India Private Limited, Akurdi/India ("MAN Trucks India")
Management Engineers &
AutoValue, 2010
"How to Move in Moving Markets? The Global Perspective of the Truck
Industry", Management Engineers and AutoValue, 2010
manroland manroland AG, Offenbach
maritime-insight,
2012
"maritime-insight Shipbuilding Outlook Club, October 2012", mari-
time-insight, Västra Frölunda/Sweden
MarketLine, 2012 "Global cement", MarketLine (a division of Datamonitor Ltd, Lon-
don/UK), October 2012
M toe million tonnes of oil equivalent (energy unit measure)
MAZ OAO MAZ, Minsk/Belarus
mbH Mit beschränkter Haftung (with limited liability)
MDT MAN Diesel & Turbo division
MDT SE MAN Diesel & Turbo SE, Augsburg
Mercosur Mercado Común del Sur (joint domestic market in South America)
MFI MAN Finance division
MFI GmbH MAN Finance International GmbH, Munich
Mitsubishi Mitsubishi Motor Corporation, Tokyo/Japan
ML MAN Latin America division
Moody’s Moody’s Investors Service, New York/USA
MPC MPC Industries GmbH, Hamburg
MTB MAN Truck & Bus division
MTB AG MAN Truck & Bus AG, Munich
MW Megawatt

KPMG PwC
10
Xx
Navistar Navistar International Corporation, Warrenville/USA
NAFTA North American Free Trade Agreement
No. Number
N.V. Naamloze Vennootschap (public limited liability company in the Nether-
lands)
OAO Otkrytoje Akzionernoje Obschtschestwo (russian public company)
OECD Organisation for Economic Co-operation and Development
OLG Oberlandesgericht (Higher Regional Court)
OPV Offshore patrol vessel
p.a. per annum
PACCAR PACCAR Inc., Bellevue/US
P&L Profit and loss statement
P/E Price-earnings ratio
PPA Purchase price allocation
PR61 Planning round 61
PROCONVE Programa de Controle da Poluição do Ar por Veículos Automotores
(emission standard in Brazil)
PwC PricewaterhouseCoopers Aktiengesellschaft Wirtschaftsprüfungsge-
sellschaft, Frankfurt am Main
R&D Research and development
Region West B.V. MAN Region west B.V., Vianen/The Netherlands
Renault Trucks Renault Trucks SAS, Saint-Priest/France
Renk Renk division
Renk AG Renk Aktiengesellschaft, Augsburg
RFC Rolling forecast
RMMV Rheinmetall MAN Military Vehicles GmbH, Munich
ROS Return on Sales
S. Page or clause
S.A. Société Anonyme (limited company in France, Luxembourg, Spain and Bel-
gium)
SAS Société par actions simplifiée (simplified public company in France)
SBU Strategic business unit
Scania Scania AB, Södertälje/Sweden
SE Societas Europaea

KPMG PwC
11
Xx
SG&A Selling, general & administrative
Siemens Siemens AG, Munich
Sinotruk Sinotruk (Hong Kong) Ltd., Hong Kong/China
SIPRI Stockholm International Peace Research Institute (www.sipri.org)
SKD Semi Knocked Down
S.p.A. Società per Azioni (public limited liability company in Italy)
S&P Standard & Poor's, a division of The McGraw-Hill Companies, Inc., New
York/USA
t ton(s)
Tata Motors Tata Motors Limited, Mumbai/India
TGA Trucknology generation A
Triade Western Europe, North America and Japan
Truck & Bus GmbH Truck & Bus GmbH, Wolfsburg
UAE United Arab Emirates
UPL Corporate planning
UralAZ OAO Ural AZ, Oblast Tscheljabinsk/Russia
USA United States of America
USD United States Dollar
VAT Value added tax
VCI, 2013 "Die deutsche chemische Industrie 2030 - VCI-Prognose-Studie", Verband
der chemischen Industrie e. V., January 2013
Volkswagen AG Volkswagen Aktiengesellschaft, Wolfsburg
Volvo Volvo AB, Gothenburg/Sweden
WKN Wertpapierkennummer (security identification number)
WpÜG Wertpapiererwerbs- und Übernahmegesetz (securities acquisition and ta-
keover act)
WTO World Trade Organization
XETRA Exchange Electronic Trading

KPMG PwC
12
Xx
A. Engagement and scope of work
1. The management board of Truck & Bus GmbH (formerly: Volkswagen Coaching Gesellschaft mbH),
Wolfsburg ("Truck & Bus GmbH") has appointed PricewaterhouseCoopers Aktiengesellschaft
Wirtschaftsprüfungsgesellschaft, Frankfurt am Main ("PwC"), with engagement letter dated 9 Janu-
ary 2013 and the executive board of MAN SE, Munich ("MAN SE") has appointed KPMG AG
Wirtschaftsprüfungsgesellschaft, Berlin ("KPMG"), (PwC and KPMG hereinafter together referred to as
"we") with engagement letter dated 18 January 2013 to prepare a joint expert opinion on the equity
value of MAN SE as well as on an appropriate recurring compensation payment and cash compensation
in accordance with §304 AktG, § 305 AktG ("joint expert opinion").
2. The reason for this valuation is the intended domination and profit and loss transfer agreement in
accordance with § 291.1 AktG between Truck & Bus GmbH, a 100 % direct affiliate of Volkswagen AG,
Wolfsburg ("Volkswagen AG") and MAN SE. The joint expert opinion on the equity value of MAN SE will
serve to determine the appropriate cash compensation pursuant to § 305 AktG as well as to determine
the appropriate recurring compensation payments pursuant to § 304 AktG for the outside shareholders
of MAN SE.
3. In accordance with § 293.1 AktG, the domination and profit and loss transfer agreement is subject to
approval by the general shareholders’ meeting of MAN SE. The valuation date is the date of the general
shareholders’ meeting of MAN SE at which the resolution is adopted and which has been scheduled for
6 June 2013.
4. We performed our valuation in accordance with the German valuation guideline established by the
Institute of Public Auditors in Germany, Incorporated Association (Institut der Wirtschaftsprüfer in
Deutschland e.V.): IDW S 1 ‘Principles for the Performance of Business Valuations’ as at 2 April 2008
(IDW S 1). In accordance with this standard, we acted as an independent expert and determined an ob-
jectified equity value.
5. The joint expert opinion has been prepared exclusively for internal use by Truck & Bus GmbH, Volks-
wagen AG and MAN SE for the purpose of the joint report on the domination and profit and loss transfer
agreement ("contract report") to be prepared by the parties to the agreement. Internal use also includes
written and verbal reports to shareholders of MAN SE as well as disclosure pursuant to § 293f.3 AktG
and the shareholder's option of inspection of the joint expert opinion in connection with the general
shareholders’ meeting of MAN SE. The management board of Truck & Bus GmbH and the executive
board of MAN SE may attach this expert opinion to their contract report according to § 293a AktG. Fur-
thermore, the joint expert opinion can be used in connection with a possible subsequent legal proce-
dure as well as the reference required by the court appointed auditor within the scope of the verifica-
tion of appropriateness of the compensation and recurring compensation payments according to
KPMG PwC
13
Xx
§ 293b.1 AktG. The joint expert opinion may not be published, duplicated or used for any purpose other
than those mentioned above. Without our prior written consent, this may not be forwarded to third
parties for any purposes other than those mentioned above. Consent will not be denied for undue rea-
sons.
6. This valuation and our responsibilities, including responsibilities towards third parties, are governed by
the "General Engagement Terms" as at 1 January 2002, which are attached to this joint expert opinion.
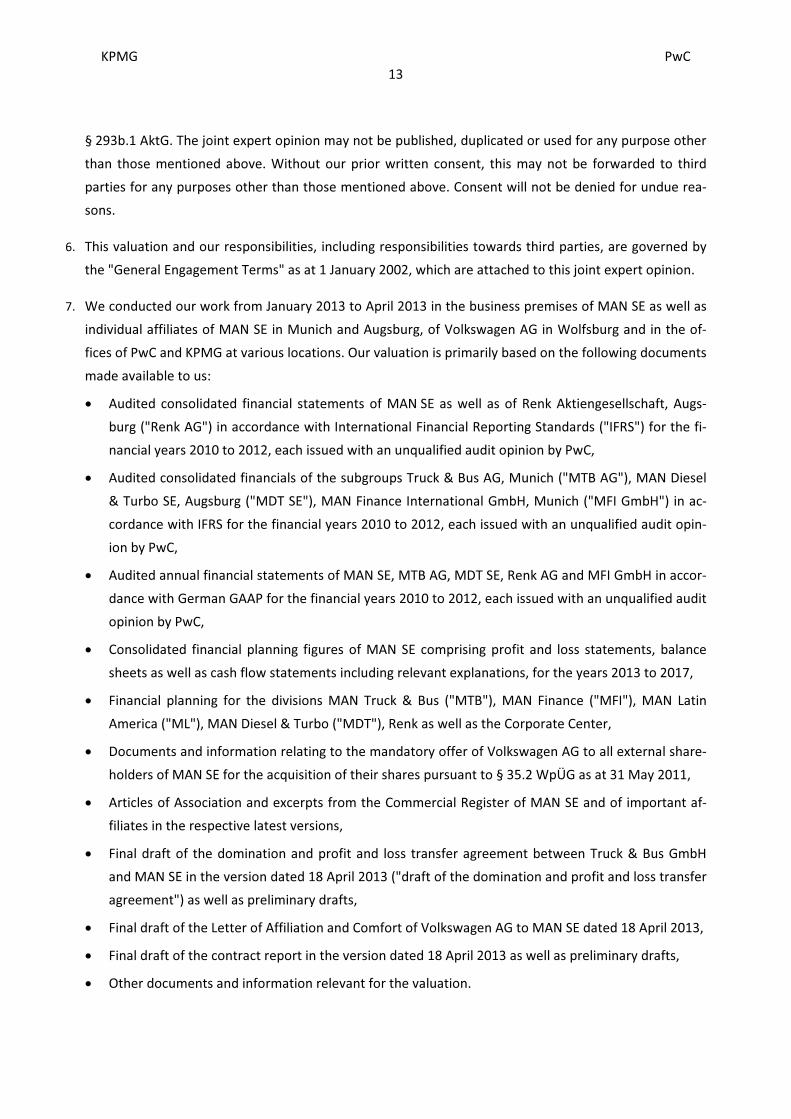
7. We conducted our work from January 2013 to April 2013 in the business premises of MAN SE as well as
individual affiliates of MAN SE in Munich and Augsburg, of Volkswagen AG in Wolfsburg and in the of-
fices of PwC and KPMG at various locations. Our valuation is primarily based on the following documents
made available to us:
• Audited consolidated financial statements of MAN SE as well as of Renk Aktiengesellschaft, Augs-
burg ("Renk AG") in accordance with International Financial Reporting Standards ("IFRS") for the fi-
nancial years 2010 to 2012, each issued with an unqualified audit opinion by PwC,
• Audited consolidated financials of the subgroups Truck & Bus AG, Munich ("MTB AG"), MAN Diesel
& Turbo SE, Augsburg ("MDT SE"), MAN Finance International GmbH, Munich ("MFI GmbH") in ac-
cordance with IFRS for the financial years 2010 to 2012, each issued with an unqualified audit opin-
ion by PwC,
• Audited annual financial statements of MAN SE, MTB AG, MDT SE, Renk AG and MFI GmbH in accor-
dance with German GAAP for the financial years 2010 to 2012, each issued with an unqualified audit
opinion by PwC,
• Consolidated financial planning figures of MAN SE comprising profit and loss statements, balance
sheets as well as cash flow statements including relevant explanations, for the years 2013 to 2017,
• Financial planning for the divisions MAN Truck & Bus ("MTB"), MAN Finance ("MFI"), MAN Latin
America ("ML"), MAN Diesel & Turbo ("MDT"), Renk as well as the Corporate Center,
• Documents and information relating to the mandatory offer of Volkswagen AG to all external share-
holders of MAN SE for the acquisition of their shares pursuant to § 35.2 WpÜG as at 31 May 2011,
• Articles of Association and excerpts from the Commercial Register of MAN SE and of important af-
filiates in the respective latest versions,
• Final draft of the domination and profit and loss transfer agreement between Truck & Bus GmbH
and MAN SE in the version dated 18 April 2013 ("draft of the domination and profit and loss transfer
agreement") as well as preliminary drafts,
• Final draft of the Letter of Affiliation and Comfort of Volkswagen AG to MAN SE dated 18 April 2013,
• Final draft of the contract report in the version dated 18 April 2013 as well as preliminary drafts,
• Other documents and information relevant for the valuation.

KPMG PwC
14
Xx
8. Further information was provided to us by the executive board of MAN SE and managers and employees
named by the board (together "management of MAN SE" or "management"). The executive board of
MAN SE, the executive board of Volkswagen AG and the management board of Truck & Bus GmbH have
provided us with a written statement to the effect that all material information and explanations given
to us in connection with the preparation of our joint expert opinion are both complete and correct.
9. Our valuation is based on the documents provided for the purpose of this valuation. We have assessed
these critically, but have not verified them with reference to an annual audit. We have verified the plau-
sibility of the financial planning figures based on the historical financial development, the current legal
and economic conditions as well as through market studies, analyst reports and industry reports and
have discussed the same with the management of MAN SE. We have not conducted individual audits
with reference to §§ 316 et. seq. HGB. These were not part of our engagement.
10. Please note that the calculations specified in this report have been rounded. Since the calculations were
in fact made with exact values, addition or subtraction of table values may lead to subtotals and totals
that deviate from those presented in these tables.
11. In the context of the valuation, no particular difficulties as defined in § 293e.1, sentence 2, no.3 AktG
have occurred.

KPMG PwC
15
Xx
B. Principles and methods of valuation
I. Basics of the valuation
12. The principles and valuation procedures described below embody standards which are generally ac-
cepted in current business valuation theory and practice and are recognised in jurisdiction.
13. According to IDW S 1 as amended in 2008, the value of a business is determined by the future benefits
the business will generate on the basis of the key success factors inherent to the business at the time of
valuation. The key success factors comprise factors such as the products, market position, organisation,
management, employees as well as the innovative capacity of the business. Assumed that merely finan-
cial objectives are pursued, the value of a business is determined by the capacity of the business to gen-
erate financial surpluses for the shareholders through the combination of all factors which influence the
earnings potential.
14. The value of a business may be determined by either the dividend discount method or the discounted
cash flow method ("DCF"). Both methods are basically equivalent since they share the same theoretical
basis (capitalisation of future benefits) and, when using the same financing assumptions, lead to identi-
cal results. In our joint expert opinion, the dividend discount method was applied.
15. Both methods first determine the present value of the financial surpluses generated by the assets es-
sential for the business (operating assets). Assets (including liabilities) that could be separated from the
business and sold without affecting the actual purpose of the business are classified as non-operating
assets and valued separately. Therefore, the value of a business generally equals the sum of the present
values of financial surpluses that can be derived from the operating and non-operating assets.
16. According to the dividend discount method, the equity value is derived directly from the net income to
shareholders. The discounted net income to the company owners subject to the derivation of the equity
value results mainly from the financial surpluses generated by the company. Financial planning figures
are generally prepared based on historical profitability. In the context of a valuation, only those financial
surpluses should be considered that result from specific measures that have already been initiated, or
that originate from a sufficiently documented and substantiated business concept as at the valuation
date.
17. The principles of the IDW S 1 as amended in 2008 distinguish between real and pseudo synergy effects.
Real synergy effects are surpluses that can only be materialised through the domination and profit and
loss transfer agreement between Truck & Bus GmbH and MAN SE. Pseudo synergy effects can be im-
plemented without the execution of this measure. Real synergies would thus include measures, which
would not be executable without concluding the domination and profit and loss transfer agreement. On

KPMG PwC
16
Xx
the other hand, pseudo synergy effects include the synergies expected from measures that can be exe-
cuted even without the contract between the companies. These pseudo synergy effects should be con-
sidered in the valuation if they are allotted to the valuation object.
18. In determining the value of a business, it is generally assumed that all available financial surpluses
resulting from a documented business concept as at the valuation date will be distributed, subject to
any applicable legal restrictions. Retained earnings as well as their use must be taken into account when
determining the net earnings to shareholders.
19. In order to value a business, the projected future financial surpluses need to be discounted to the valua-
tion date using an appropriate interest rate (discount rate). The discount rate serves to measure the
series of expected financial surpluses against an alternative investment different to the investment in
MAN SE shares.
20. Due to the relevance of personal income taxes to the business value, it is necessary to characterise the
tax situation of shareholders in the framework of objectified business valuations. In case of legally and
contractually motivated valuations within the meaning of IDW S 1 as amended in 2008, the standardisa-
tion is based, in accordance with long-standing legal practice and valuation experience, on the tax situa-
tion of a domestic taxpayer, subject to full taxation ("direct standardisation"). To this end, appropriate
assumptions regarding the personal tax charge on net earnings generated by the company to be valued
and the alternative investment must be made.
21. If it is beneficial to sell the operating and non-operating assets rather than continue the business opera-
tions, the valuation must be based on the liquidation value of the business as well unless this is not pos-
sible on account of legal or factual limitations. This applies at least, if the company has no operating
business and consists only of non-operating assets and liabilities (OLG Düsseldorf 4 October 2006- I-26
W7/06 AktE). This condition does not apply to MAN SE. However, in order to verify whether the liquida-
tion value exceeds the equity value, the liquidation value of MAN SE was roughly determined as at the
valuation date and compared with the equity value determined by us according to the dividend discount
method.
22. The net asset value resulting from an asset-based approach has no independent informative value as
part of a business valuation. The net asset value is the reconstruction cost or replacement value of all
existing intangible and tangible assets (and liabilities) present in the business. Since the market value of
equity of a business as a going concern is determined on the basis of its future earnings potential and
since the net asset value is neither based on future projections nor represents an enterprise value, the
latter was not determined.
23. Since the shares of MAN SE have been admitted to various stock exchanges for trading, it would be
possible to determine the cash compensation using observable share prices of MAN SE. However, there

KPMG PwC
17
Xx
can be strong arguments opposing a cash compensation derived exclusively from the share price, since
share prices depend on numerous special factors such as the size and constriction of the market, on
random trading turnovers as well as on speculative influences and influences that are not related to the
value and can thus be subject to unpredictable variations and developments.
24. The application of share prices (market capitalisation) cannot replace a business valuation according to
the described principles if this valuation uses a more detailed base compared to information available to
the capital market and integrates the capital market considerations into the valuation methodology. The
valuation described in this joint expert opinion is based on an analysis of historical data and on long-
term corporate planning, which is not publicly accessible in this level of detail and scope.
25. The Federal Constitutional Court (Bundesverfassungsgericht or "BVerfG") and the Federal Court of
Justice (Bundesgerichtshof or "BGH") have ruled in multiple cases that the share price should be gener-
ally considered as minimum value when determining a cash compensation for outside shareholders in
connection with some special purpose business valuations (e.g. recurring compensation payment and
compensation in accordance with §§ 304, 305 AktG) (compare e.g. BVerfG, decision dated 27 April 1999,
1 BvR 1613/94, BGH, decision dated 12 March 2001, II ZB 15/00; BGH, decision dated 19 July 2010, II ZB
18/09). However according to the Federal Constitutional Court, the requirement to determine the ap-
propriate compensation based on the share price does not mean that it should always be the only deci-
sive factor. Exceeding the share price is acceptable under constitutional law.
26. Refer to section F.I for the development and relevance of the share prices of MAN SE.

KPMG PwC
18
Xx
II. Appropriate cash compensation according to § 305 AktG
27. A domination and profit and loss transfer agreement must amongst others include the obligation of the
other party to the contract to - on demand of a outside shareholder - acquire the shares in return for an
appropriate cash compensation defined in the agreement (§ 305.1 AktG). In the present case, the draft
of the domination and profit and loss transfer agreement proposes a cash compensation (§ 305.2 no.
3 AktG).
28. According to the knowledge of financial studies, jurisdiction (compare BVerfG decision dated 27 April
1999 – 1 BvR 1613/94; DB 1999, page 1695) and the valuation practice, the equity value is the correct
basis for determining the compensation as per § 305 AktG. Thus, the value of a company as a whole
needs to be considered. This will therefore correspond to the postulate of compensation at full value of
shares developed by the jurisdiction. Therefore, the equity value of MAN SE has to be determined in-
cluding all affiliated companies and the compensation per share has to be derived from this value.
III. Appropriate recurring compensation payment according to § 304 AktG
29. According to § 304.1 sentence 1 AktG, a domination and profit and loss transfer agreement must ar-
range for an appropriate recurring compensation payment for the outside shareholders with a recurring
payment (compensation payment) related to the shares in the share capital. According to § 304.2 sen-
tence 1 AktG, at least the annual payment per share, which could probably be distributed as an average
profit per share according to the previous earnings situation of the company and its future earnings
prospects under consideration of appropriate depreciations and fair value adjustments, however with-
out a retention of other profits, should be assured as compensation payment. According to § 304.1 sen-
tence 2 AktG a domination agreement without profit and loss transfer must guarantee a reasonable
minimum compensation of the earnings of the dominated company to the outside shareholders.
30. The discounted dividend value based on the corporate financial planning figures considers - with regard
to interest effects - the expected payments (dividends and retention of earnings) between company and
shareholders. With respect to a normalised annual compensation payment, the legislative body does
not relate the payment obligation to the expected earnings that vary year by year, but refers to the av-
erage amount per share that could probably be distributed under consideration of appropriate depre-
ciations and fair value adjustments, however without retention of other earnings. The determination of
an average amount per share should thus consider the volatility of profits or losses, but be converted
into a uniform average amount per share.

KPMG PwC
19
Xx
C. Description of the valuation object
I. Legal and tax situation
31. MAN SE was founded through a change in legal form from MAN Aktiengesellschaft to a Societas Eu-
ropaea ("SE") and has been registered in the Commercial Register at the district court of Munich since
2009 under HR B 179426 and under the name MAN SE with its headquarters in Munich. The latest entry
in the Commercial Register is dated 14 March 2013.
32. The fiscal year corresponds to the calendar year.
33. Purpose of the company according to § 2 of the Articles of Association in the version dated 1 April 2010
is
• the investment in companies of all kinds, in particular companies engaging in mechanical engi-
neering, plant engineering, vehicle manufacturing and engine production as well as trade,
• manufacturing of such products as well as the processing of materials of all kinds.
The company is authorised to conduct all business and take all measures deemed necessary or useful for
attaining the company's objectives.
34. The registered share capital of MAN SE as at the date of this joint expert opinion is € 376,422,400. It is
composed of 147,040,000 no-par value bearer shares, which are subdivided into
140,974,350 common shares and
6,065,650 non-voting preferred shares.
According to § 4.2 sentence 2 of the Articles of Association of MAN SE, shareholders may not claim de-
livery of physical share certificates.
35. In accordance with § 17.1 of the company’s Articles of Association, every common share grants one vote
in the general shareholders’ meeting. The general shareholders’ meeting especially decides on the
shareholder representatives of the supervisory board, the appropriation of net profits, on the formal
discharge of the executive board and the supervisory board as well as on the appointment of the exter-
nal auditor.
36. Holders of preferred shares do not have voting rights at the general shareholders’ meeting, except for
cases prescribed by law. However, according to § 24.3 of the Articles of Association of MAN SE, holders
of preferred shares are entitled to a preferred dividend of € 0.11 per preferred share. This preferred
dividend of € 0.11 is payable in advance but is not an additional dividend.

KPMG PwC
20
Xx
37. The executive board is authorised to increase the share capital, with the consent of the supervisory
board, by up to € 188,211,200 by issuing common bearer shares on one or more occasions against cash
contributions and/or noncash contributions in the period up to 31 March 2015.
38. Moreover, the general shareholders’ meeting on 1 April 2010, resolved to contingently increase the
share capital by up to € 76,800,000. The contingent capital increase will only be implemented to the
extent that the holders of convertible bonds or bonds with warrants or with conversion obligations is-
sued for cash consideration by MAN SE or its Group companies by virtue of the authorising resolution of
the general shareholders’ meeting on 1 April 2010, exercise their conversion rights or options or settle
their conversion obligations, and provided that other forms of settlement are not used. We have been
informed that no convertible bonds or bonds with warrants or with conversion obligations have been
issued up to the end of our valuation work.
39. The common and preferred shares of MAN SE are traded on the German electronic stock exchange
trading platform Xetra, as well as on all seven German stock exchanges (Berlin, Düsseldorf, Frankfurt am
Main, Hamburg, Hanover, Munich and Stuttgart).
40. The common shares have been assigned the German security identification number ("WKN") 593700 as
well as the international security identification number ("ISIN") DE0005937007. The preferred shares of
the company have been assigned the German WKN 593703 and the ISIN DE0005937031.
41. Until 24 September 2012, the common shares of the company were listed in the German stock index
"DAX" of Deutsche Börse AG, Frankfurt am Main ("Deutsche Börse AG"). Deutsche Börse AG decided on
a change in composition of the DAX as part of its annual review in September 2012. Due to the low free
float of the common shares of MAN SE, the common shares of the company no longer fulfilled the crite-
rion of Deutsche Börse AG to be retained in the DAX. Accordingly, the common shares of MAN SE were
transferred to the Mid-Cap-DAX ("MDAX"), effective 24 September 2012. The common shares of MAN
SE are listed in further stock exchange indices, including HDAX, CDAX, Euro Stoxx®, Stoxx® Europe 600
and Euro Stoxx® TMI Industrial. The preferred shares of MAN SE are listed in the CDAX.
42. On 3 October 2006, Volkswagen AG announced its acquisition of a 15.06 % share in MAN SE. On
26 February 2007, Volkswagen AG increased its voting rights to 29.9 %. With the acquisition of further
shares in MAN SE, Volkswagen AG exceeded the threshold of 30 % of the voting rights on 9 May 2011
and was, according to the German Takeover Act, obligated to submit a mandatory offer to all external
shareholders of MAN SE to acquire the remaining shares. The takeover price fixed within the scope of
the mandatory offer was € 95.00 per common share of MAN SE and € 59.90 per preferred share. By the
end of the acceptance period, 29 June 2011, the offer for 35,857,607 common shares and 164,613 pre-
ferred shares was accepted. After the approval from all necessary regulatory authorities was granted,
the transaction was completed on 9 November 2011 and the share of Volkswagen AG increased to a
total of 55.90 % of the voting rights and 53.71 % of the share capital in MAN SE.
KPMG PwC
21
Xx
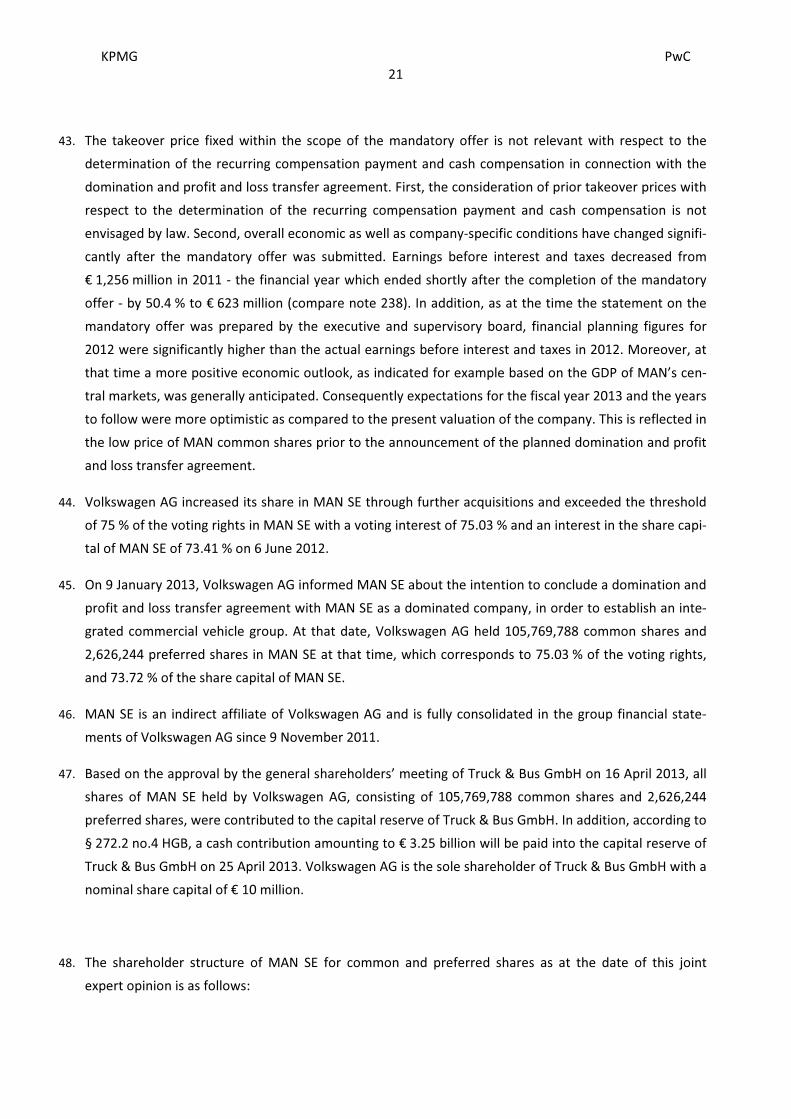
43. The takeover price fixed within the scope of the mandatory offer is not relevant with respect to the
determination of the recurring compensation payment and cash compensation in connection with the
domination and profit and loss transfer agreement. First, the consideration of prior takeover prices with
respect to the determination of the recurring compensation payment and cash compensation is not
envisaged by law. Second, overall economic as well as company-specific conditions have changed signifi-
cantly after the mandatory offer was submitted. Earnings before interest and taxes decreased from
€ 1,256 million in 2011 - the financial year which ended shortly after the completion of the mandatory
offer - by 50.4 % to € 623 million (compare note 238). In addition, as at the time the statement on the
mandatory offer was prepared by the executive and supervisory board, financial planning figures for
2012 were significantly higher than the actual earnings before interest and taxes in 2012. Moreover, at
that time a more positive economic outlook, as indicated for example based on the GDP of MAN’s cen-
tral markets, was generally anticipated. Consequently expectations for the fiscal year 2013 and the years
to follow were more optimistic as compared to the present valuation of the company. This is reflected in
the low price of MAN common shares prior to the announcement of the planned domination and profit
and loss transfer agreement.
44. Volkswagen AG increased its share in MAN SE through further acquisitions and exceeded the threshold
of 75 % of the voting rights in MAN SE with a voting interest of 75.03 % and an interest in the share capi-
tal of MAN SE of 73.41 % on 6 June 2012.
45. On 9 January 2013, Volkswagen AG informed MAN SE about the intention to conclude a domination and
profit and loss transfer agreement with MAN SE as a dominated company, in order to establish an inte-
grated commercial vehicle group. At that date, Volkswagen AG held 105,769,788 common shares and
2,626,244 preferred shares in MAN SE at that time, which corresponds to 75.03 % of the voting rights,
and 73.72 % of the share capital of MAN SE.
46. MAN SE is an indirect affiliate of Volkswagen AG and is fully consolidated in the group financial state-
ments of Volkswagen AG since 9 November 2011.
47. Based on the approval by the general shareholders’ meeting of Truck & Bus GmbH on 16 April 2013, all
shares of MAN SE held by Volkswagen AG, consisting of 105,769,788 common shares and 2,626,244
preferred shares, were contributed to the capital reserve of Truck & Bus GmbH. In addition, according to
§ 272.2 no.4 HGB, a cash contribution amounting to € 3.25 billion will be paid into the capital reserve of
Truck & Bus GmbH on 25 April 2013. Volkswagen AG is the sole shareholder of Truck & Bus GmbH with a
nominal share capital of € 10 million.
48. The shareholder structure of MAN SE for common and preferred shares as at the date of this joint
expert opinion is as follows:

KPMG PwC
22
Xx
Shareholders of MAN SE Number of common
shares
in %
of common shares
Truck & Bus GmbH 105,769,788 75.03
Free float 35,204,562 24.97
Total 140,974,350 100.00
Shareholders of MAN SE Number of preferred
shares
in %
of preferred shares
Truck & Bus GmbH 2,626,244 43.30
Free float 3,439,406 56.70
Total 6,065,650 100.00
Source: Volkswagen AG
49. The organisational structure of the company as well as the capital shares in major individual companies
on the valuation date, which are in some cases held indirectly by MAN SE, are as shown below:
Source: MAN SE
50. On 31 December 2012, the consolidation group included 135 affiliated companies and MAN SE. Fur-
thermore 9 investments were recognised applying the equity method, 11 investments are recognised at
MAN SE
Munich
Renk AG
Augsburg
MAN Diesel & Turbo
SE
Augsburg
MAN Truck & Bus AG
Munich
MAN Latin America
Indústria e Comércio
de Veículos Ltda.
Sao Paulo/Brazil
Sinotruk Ltd.
Hong Kong/China
Scania AB
Södertälje/
Sweden
100.00% 100.00%100.00% 76.00%
MAN Finance
International GmbH
Munich
100.00%
13.35%
(17.37% of the voting rights)25.00% + 1 share

KPMG PwC
23
Xx
amortised cost, and additional 60 investments were not included in the consolidated financial state-
ments (MAN Group).
Tax situation
51. Based on domination and profit and loss transfer agreements, a fiscal unity for corporate and trade tax
purposes exists between MAN SE and the following MAN Group companies in Germany:
• MAN Truck & Bus AG, Munich,
• MAN Diesel & Turbo SE, Augsburg,
• MAN Ferrostaal Beteiligungs GmbH, Munich,
• MAN GHH Immobilien GmbH, Oberhausen,
• MAN Grundstücksgesellschaft mbH, Oberhausen,
• MAN HR Services GmbH, Munich,
• MAN Finance International GmbH, Munich,
• MAN Versicherungsvermittlung GmbH, Munich,
• MAN IT Services GmbH, Munich,
• MAN Beteiligungs GmbH, Munich.
52. Due to further subsidiaries of these companies, with which domination and profit and loss transfer
agreements have been concluded, further indirect fiscal unities for income tax purposes exist between
MAN SE and companies of the MAN Group. There are also fiscal unities for value added tax ("VAT") pur-
poses between MAN SE and these as well as other companies.
53. According to management information, MAN SE's corporate income tax loss carryforwards amounted to
approximately € 639 million and the trade tax loss carryforwards amounted to approxi-
mately € 521 million as at 31 December 2012. Moreover, several domestic and international affiliates of
MAN SE had corporate income tax loss carryforwards amounting to a total of € 633 million, of which
approximately € 334 million are usable. Non-usable loss carryforwards relate to companies in countries
where loss carryforwards may only be utilised for a limited time period and to companies with insuffi-
cient earnings prospects for the utilisation of loss carryforwards.
54. As at 31 December 2012, the corporate tax credit of MAN SE amounted to approximately € 7.76 million.

KPMG PwC
24
Xx
55. The tax assessment of MAN SE, including 2008, has been closed and is subject to subsequent audit as
per § 164.1 AO. Tax returns for subsequent financial years are currently being prepared.
56. An external tax audit for the assessment periods 2002 to 2005 has largely been completed and covered
the audit fields of corporate income tax, trade tax and VAT. The respective tax assessment notices is-
sued in 2012 are subject to subsequent audit. The external tax audit for the financial years 2006 to 2010
for corporate tax, trade tax and VAT had already started in 2012 and was completed for smaller compa-
nies of the fiscal unity.
II. Economic fundamentals
1. Business activity
a) General information
57. The MAN Group is one of the leading players in commercial vehicles and mechanical engineering in
Europe. It mainly supplies trucks, buses, diesel engines, turbomachinery as well as special gear units.
58. The MAN Group focuses on the business areas Commercial Vehicles and Power Engineering.
59. With regard to the business area Commercial Vehicles, the MTB division is one of Europe’s leading
manufacturers of trucks and buses and the ML division represents the largest truck manufacturer in
Brazil. In addition, MAN SE holds an interest of 25 % plus one share in the capital of Sinotruk (Hong
Kong) Ltd., Hong Kong/China ("Sinotruk").
60. In the business area Power Engineering, the MDT division is a globally leading developer and manufac-
turer of large-bore diesel engines for use in ships and power plants and also specialises in the develop-
ment and production of turbo compressors, industrial turbines as well as chemical reactor systems. This
business area is supplemented with a majority holding in Renk, a global manufacturer of gear units, pro-
pulsion components and testing systems.
b) MAN Truck & Bus division
61. The core market of the MTB division, whose leading entity is MTB AG, is the European commercial
vehicle market. MTB also serves markets outside Europe, especially the Russian, Asia-Pacific and Arabian
as well as the African market. MTB has production facilities in four European countries as well as in
South Africa and India. Its products range from general-purpose trucks with a gross vehicle weight
("GVW") of 7.5 t to 44 t and special-purpose vehicles with a gross train weight of up to 250 t, through
buses and coaches, to diesel and gas engines for on- and off-road uses. Operations are supplemented
with an extensive range of services and the sale of used vehicles.

KPMG PwC
25
Xx
62. To support its commercial vehicle business MTB also offers financing solutions (loans and leases) as well
as supplementary services, particularly insurance solutions, through MFI. In addition, MFI’s subsidiary
Euro-Leasing GmbH, Sittensen ("EURO-Leasing") offers short- and long-term rental solutions for com-
mercial vehicles. The predominant function of MFI and its subsidiaries within the MTB division is how-
ever to promote sales of new vehicles. Due to the close linkage of MFI and MTB’s commercial vehicle
business MFI will be presented as part of the MTB division in the following.
63. MTB uses the brand MAN as a product brand in the truck as well as in the bus business. With the series
TGX and TGS (heavy trucks), TGM (medium trucks) and TGL (light trucks), MTB is a full range manufac-
turer producing trucks in a range from 7.5 t to 44 t and offering solutions for the national and interna-
tional heavy duty long-haul transport, the heavy-duty and building site traffic as well as the short-haul
and distribution transport. With the series Cargo Line A ("CLA"), MAN Trucks India Private Limited,
Akurdi/India ("MAN Trucks India") offers a truck for the Indian market as well as selected markets in
Africa and Asia. In the bus segment, MTB offers coaches (MAN Lion’s Coach), intercity buses (MAN Lion’s
Regio), city buses (MAN Lion’s City series) as well as chassis. Coaches are also sold using the premium
brand NEOPLAN.
64. The diesel and gas engines from MTB cover a range from 37 kW (50 hp) to 1,324 kW (1,800 hp) and are
offered as 4- and 6-cylinder in-line units and as 8- and 12-cylinder V engines. Besides the use in the
group’s own trucks and buses, the engines are also offered to third-parties, for power generation in
cogeneration plants and as drive units in agricultural machinery, rail vehicles, ships and boats and spe-
cial-purpose vehicles.
65. In the fiscal year 2012, MTB sold 74,680 trucks and 5,286 buses, achieving revenues of € 8,822 million.
This equals a sales decrease in volumes of 4.1 % compared to the previous year. Including subcontracted
employees, 34,879 employees were employed at the end of the financial year 2012.
c) MAN Latin America division
66. The ML division, whose leading entity is MAN Latin America Indústria e Comércio de Veículos Ltda., São
Paulo/Brazil, concentrates on the production and sale of commercial vehicles and buses (mainly bus
chassis) in Latin America and the southern part of Africa.
67. The product range covers trucks with a GVW of 5 t to 74 t, which are mainly marketed under the Volks-
wagen brand. ML offers the following Volkswagen branded truck series: "Delivery" from 5 t to 10 t,
"Worker" from 13 t to 31 t and "Constellation" from 13 t to 63 t. Moreover, the MAN branded TGX se-
ries was launched in the Brazilian market in 2012. In addition, the Volkswagen branded ADVANTECH
series sold in South America is equipped with MAN engines.

KPMG PwC
26
Xx
68. In 1993, ML launched its first bus chassis (model VW 16.180 CO) and has, since then, been active in the
bus market. ML offers in total eight different chassis for city and intercity buses.
69. All ML vehicles produced for the Brazilian market and delivered in March 2012 or later fulfil the Brazilian
standard PROCONVE P-7 (comparable to the Euro V standard).
70. The main production facility of ML is located in Resende/Brazil. Light trucks and buses are also manufac-
tured at the production facility in Querétaro/Mexico in SKD assembly.
71. ML has developed the concept "Consórcio Modular" for the facility in Resende, in which the actual
manufacturing of the vehicles is done by partner companies. ML employees are only involved in the
product development and quality assurance as well as for sales and customer service. "Consórcio Modu-
lar" is characterised by low capital employed and low investment requirements.
72. At the end of fiscal year 2012, ML employed a total of 1,937 employees, while approxi-
mately 3,800 employees worked in the "Consórcio Modular" production network.
73. In fiscal year 2012, ML sold 45,829 trucks and 10,476 buses, generating revenues of € 2,870 million. This
equals a sales decrease in volumes of 21.9 % compared to the previous year.
74. ML uses an extensive dealer network in Brazil and the other countries served. In Brazil, vehicle manufac-
turers can sell their products to end customers only through dealers. Overall, ML cooperates with ap-
proximately 265 authorised dealers in Latin America, of which approximately 150 are in Brazil.
d) MAN Diesel & Turbo division
75. The MDT division, whose leading entity is MDT SE, is one of the globally leading developers and manu-
facturers of large-bore diesel engines, turbo compressors and industrial turbines for maritime and sta-
tionary applications as well as of chemical reactor systems. With revenues of € 3,780 million in the fiscal
year 2012, the division contributed 23.9 % of the company’s total revenues. As at 31 December 2012,
MDT employed 14,863 employees.
76. MDT consists of three strategic business units (SBUs): Engines & Marine Systems, Power Plants, and
Turbomachinery. The revenue split for these three SBUs is illustrated in the following graph:

KPMG PwC
27
Xx
MAN Diesel & Turbo – Revenues according to SBUs
Source: MAN SE
77. The SBU Engines & Marine Systems develops two-stroke diesel engines for propulsion systems in large
vessels and develops and manufactures four-stroke diesel engines that are used for propulsion systems
for smaller vessels and as auxiliary engines. The engines cover a power range from 450 kW to 87,000
kW. Moreover, the SBU Engines & Marine Systems delivers turbochargers for large-bore diesel engines
as well as propellers and complete ship propulsion systems. After-sales services are offered worldwide
under the brand MAN PrimeServ.
78. MDT is the global market leader for large-bore two-stroke diesel engines with capacities of 2,000 kW to
87,000 kW. Due to their enormous sizes, these engines that are used for large bulk carriers, tankers and
container vessels are manufactured by licensees in the surrounding of shipyards, especially in South
Korea, Japan, and China. The four-stroke engines cover an output range from 450 kW to 21,600 kW and
can run with both liquid and gaseous fuels. The four-stroke engines are mainly used in all types of cargo
vessels, passenger ships, cruise vessels, towboats, dredgers, cable-laying ships, fast ferries and marine
ships. Additionally, the engines can also be used as on-board power gensets. These generator sets have
a power range from 450 kW to 11,200 kW. MDT manufactures the four-stroke engines in its facilities in
Germany, France and India. In fiscal year 2012, the SBU Engines & Marine Systems was the largest of the
three SBUs with revenues of € 1,552 million (2011: € 1,670 million). The order intake amounted to
€ 1,296 million in fiscal year 2012 (2011: € 1,605 million).
79. The SBU Power Plants manufactures and sells stationary diesel and gas engines for power generation,
ranging from small emergency generators up to turnkey power plants with capacities of up to 400 MW.
41.8% 46.3% 41.0%
22.3% 17.9% 20.5%
35.9%35.8%
38.5%
-
500
1,000
1,500
2,000
2,500
3,000
3,500
4,000
2010 2011 2012
€million
Engines & Marine Systems Power Plants Turbomachinery
3,6103,7803,766

KPMG PwC
28
Xx
The four-stroke diesel and gas engines offer capacities of 450 kW to 18,900 kW, the two-stroke engines
of up to 80 MW amongst others. The MDT engines can be powered with diesel, heavy foil, bio-fuels or
gas as well as with a combination of diesel and gas. The SBU Power Plants also offers systems for com-
bined heat and power generation, diesel combined cycle and expandable, modular concepts. The busi-
ness activities also include the operation and maintenance of power plants.
80. In 2012, the order intake in the power plant business increased by 4 % to € 668 million (2011:
€ 640 million). This was mainly due to large orders from emerging and developing countries, where de-
mand for MDT power plant solutions is high, in order to bridge the energy supply gap quickly. Diesel and
gas engine power plants are primarily used as temporary decentralised solutions to cover the base load.
In addition to order intakes, revenues could also be increased in fiscal year 2012. With € 773 million
(2011: € 647 million), revenues were approximately 20 % higher than in the previous year.
81. The SBU Turbomachinery offers a wide range of turbomachinery products. Among others, the product
range includes compressors as well as gas and steam turbines for the oil and gas industry, the processing
industry and for the power generation. This SBU also offers turnkey machine lines including power tur-
bines and auxiliary units, reactors for the chemical and petrochemical industry as well as special devices
for research facilities.
82. Contrary to the general market development, the SBU Turbomachinery increased its order intake in
fiscal year 2012 by approximately 7 % to € 1,546 million (2011: € 1,447 million). Although the orders of
new compressors and turbines declined due to the economic contraction in the overall market, there is
still a considerable need for capital spending at a number of industrial facilities. These requirements
result from the global population growth and the expanding middle class in emerging countries and the
resulting demand for energy and primary materials. Emerging and developing countries, especially Brazil
and China, were the key regions in 2012. The SBU also offers after-sales services for turbomachinery
using the brand MAN PrimeServ. In comparison to the previous year, revenues of the SBU could be in-
creased considerably by approximately 13 % to € 1,455 million mainly due to the business activities in
China (2011: € 1,293 million).
e) Renk division
83. Renk AG is a publicly listed subsidiary of MAN SE and a global manufacturer of special gear units, propul-
sion components and testing systems. MAN SE holds 76.0 % of the company’s share capital. The com-
pany is a leading manufacturer in tracked vehicle transmissions of different sizes as well as in slide bear-
ings for electrical machinery. Renk also has a leading position in the market for special gear units used
for marine and industrial purposes. The product portfolio also includes different types and performance
categories of couplings. In addition, Renk manufactures testing systems used in development, produc-
tion and quality assurance mainly in the automotive, rail and aviation industries.

KPMG PwC
29
Xx
84. In 2012, order intakes increased by approximately 15 % from € 456 million (2011) to € 525 million. In
addition, Renk generated revenues of € 476 million (2011: € 389 million). This corresponds to approxi-
mately 3 % of the total revenues of MAN SE in 2012.
85. In addition to production facilities in Augsburg, Rheine, Hanover and Berlin, Renk operates production
facilities and sales companies all over the world. The company employed 2,245 people (2011:
2,013 employees) as at 31 December 2012.
86. Renk’s business is divided into four SBUs: Vehicle transmissions, slide bearings, special gear units and
standard gear units.
87. In the SBU vehicle transmissions Renk is a leading manufacturer of fully-automatic transmissions for
medium and heavy tracked vehicles and also offers a wide range of high-performance test beds for vari-
ous sectors.
88. Renk’s automatic power-shift transmissions are designed for all modern diesel engines, for rear and
front installation. The transmissions are controlled and monitored electronically. They are predomi-
nantly manufactured at the production site in Augsburg.
89. Renk’s test beds activities are associated with the SBU vehicle transmissions. Renk designs and manufac-
tures customised test beds for the development, production and quality assurance of motor vehicles,
helicopters, rail car components, tracked vehicles and wind turbines.
90. Located in Hanover/Germany, the SBU slide bearings together with ADMOS-Gleitlager Produktions- und
Vertriebsgesellschaft mbH, Berlin, as well as the American sales company Renk Corporation, Dun-
can/USA, supply hydrodynamic lubricated slide bearings. These slide bearings are used in electric mo-
tors, generators, pumps, fans, water turbines, production plants and marine applications.
91. The SBU special gear units comprises the production of large-scale gear units at the Augsburg site of
Renk AG and at Renk-MAAG GmbH, Winterthur/Switzerland. The product range covers stationary
transmissions for various industrial applications, amongst others for the cement industry, through turbo
transmissions with high transmission applications of up to 140 MW to complex transmissions for fast
ships and marine applications with transmission capacities of up to 80 MW.
92. The SBU standard gear units includes the production of large-scale gear units at the Rheine facility of
Renk AG. One of the core areas are vessel gear units for merchant shipping, ferries, LNG tankers and
supply vessels. The SBU also manufactures transmissions for turbine systems and couplings for industrial
applications. In 2011, Renk’s offshore wind power gear unit business was relocated from Augsburg to
Rheine.

KPMG PwC
30
Xx
2. Market and competition
a) Preliminary remark and economic indicators in comparison
93. Our market and competition analysis focuses on the markets and areas of activities that are significant
for the MAN Group. Therefore, we analysed and described the underlying markets of the divisions MTB,
ML, MDT and Renk in more detail.
94. In the past years, the world economy had to face the effects of the financial and sovereign debt crisis
and was thus characterised by volatile and partly reduced growth rates. This difficult economic envi-
ronment strained the development of the Gross Domestic Products ("GDPs") of the markets that are
relevant for the MAN Group. In the EU-countries and in Brazil, the two most important markets of the
MAN Group especially in 2009, the real GDP decreased significantly. Based on the data of The Economist
Intelligence Unit Ltd., London/United Kingdom ("EIU"), the GDP in Germany, the most important market
for the MAN Group within the EU, decreased by 5.1 %, the Brazilian GDP by 0.3 %. After a worldwide
economic recovery in 2010, with considerably positive GDP growth rates, especially in China with
10.4 %, the growth rates have again been declining since 2011 and have again been negative in the EU (-
0.3 % in 2012). A recovery of the world economy with moderately increasing GDP growth rates is again
expected from 2013 onwards. In individual countries of the EU, low growth rates of less than 1.0 % are
expected for 2013. Up to 2017, slightly higher growth rates of the respective GDP as compared to 2012
are forecast for all the markets under consideration, except for China.
95. The development of inflation rates also faced the effects of the financial and sovereign debt crisis. After
a worldwide low inflation level in 2009, the inflation rates in all relevant markets increased up to 2011.
In 2012, the inflation rates were marginally below the level of 2011. For the EU countries, EIU forecasts
a decline in the inflation rate from 2.5 % in 2012 to 2.1 % in 2017. For Germany, nearly stable inflation
rates of approximately 2.0 % are expected (2.1 % in 2012, 2.0 % in 2017). For Brazil, a slightly declining
inflation development from 5.4 % (2012) to 4.9 % (2017) is assumed. On the other hand, increasing infla-
tion rates have been forecast for China and South Korea, the main markets of the MAN Group in Asia. In
2012, the inflation rate for China amounted to 2.6 %, while the South Korean inflation rate amounted to
2.2 %; according to the EIU forecasts, the inflation rate in China will increase to 4.0 % in 2017 and to
3.1 % in South Korea.

KPMG PwC
31
Xx
96. The GDP growth rates as well as the inflation rates over time in the most important markets for the
MAN Group are illustrated in the following overview:
b) Market positioning and competitive environment in the MAN Truck & Bus division
Truck
Global truck market
97. The global truck and commercial vehicle market depends considerably on the general economic devel-
opment and the resulting demand for transport services. The commercial vehicle market is divided into
several categories according to the GVW.1
1 The consideration thus focuses on the vehicle market with a gross vehicle weight of over 6 t that is relevant for
MTB.
GDP growth rate
Difference, % 2009 2010 2011 2012 2013E 2014E 2015E 2016E 2017E
Germany -5.1% 4.0% 3.1% 0.9% 0.7% 1.6% 1.3% 1.3% 1.4%
Brazil -0.3% 7.5% 2.7% 1.0% 3.5% 3.8% 3.5% 3.7% 3.5%
China 9.2% 10.4% 9.3% 7.8% 8.5% 7.8% 7.7% 7.3% 6.4%
South Korea 0.3% 6.3% 3.6% 2.1% 2.9% 3.8% 3.9% 4.0% 4.0%
Russia -7.8% 4.5% 4.3% 3.4% 3.3% 3.7% 4.1% 4.1% 4.0%
India 8.2% 9.6% 6.9% 5.2% 6.5% 7.3% 7.3% 7.5% 7.5%
European Union -4.3% 2.1% 1.6% -0.3% 0.0% 1.2% 1.5% 1.6% 1.5%
…
World -2.3% 3.9% 2.6% 2.1% 2.3% 2.9% 2.9% 2.9% 3.0%
Inflation
Difference, % 2009 2010 2011 2012 2013E 2014E 2015E 2016E 2017E
Germany 0.2% 1.2% 2.5% 2.1% 1.8% 1.9% 2.1% 1.9% 2.0%
Brazil 4.9% 5.0% 6.6% 5.4% 6.1% 5.7% 5.4% 5.1% 4.9%
China -0.7% 3.2% 5.5% 2.6% 4.3% 4.1% 3.9% 4.2% 4.0%
South Korea 2.8% 2.9% 4.0% 2.2% 2.6% 2.8% 2.9% 3.1% 3.1%
Russia 11.7% 6.9% 8.4% 5.1% 6.3% 6.2% 5.7% 5.1% 5.0%
India 10.8% 12.0% 8.9% 9.3% 8.8% 8.0% 7.0% 6.6% 7.1%
European Union 0.7% 1.9% 2.7% 2.5% 2.2% 2.1% 2.3% 2.1% 2.1%
…
World 1.5% 3.0% 4.1% 3.4% 3.4% 3.5% 3.4% 3.3% 3.3%
Source: EIU, February/March 2013

KPMG PwC
32
Xx
98. The following chart gives an overview of the expected development of global truck sales with a GVW
over 6 t according to regions:
Global truck sales (in thousand units)
Source: LMC, 20122
99. Two developments can be observed when considering the development of the truck market. On the one
hand, the significant dependency of the truck market on the overall economic development is reflected
especially in the financial market crisis around the year 2009 (refer to e. g. KPMG, 2011). On the other
hand, it becomes apparent that the market growth mainly results from the growth of the emerging
markets, especially from the BRIC countries (Brazil, Russia, India and China), while the fully developed
and mature markets of the triad (West Europe, North America and Japan) only show marginal growth.
100. Beyond the development of sales volumes, other trends can also be observed in the commercial vehicle
market. The most important trends are given below:
• Development of a noticeably increasing middle class segment,
• The customers’ focus on the total cost of ownership,
• Increasing significance of environmental protection ("Green Fleet"),
• Increasing significance of Asian manufacturers to the disadvantage of European and American
manufacturers.
2 LMC Automotive is one of the leading data providers in the automobile sector and offers turnover and produc-
tion forecasts for passenger cars and trucks as well as forecasts for the supply and demand of engines and
transmissions.
2,231
2,340 2,206
1,811
2,495
2,626
2,321 2,455
2,729 2,885
2,986 3,166
0
500
1,000
1,500
2,000
2,500
3,000
3,500
2006 2007 2008 2009 2010 2011 2012 2013 2014 2015 2016 2017
Europe North America Asia Mercosur Africa and Australia Other
CAGR 2012-17: 6.4 %

KPMG PwC
33
Xx
Cyclicality of the truck market
101. The commercial vehicle industry is subject to a noticeable cyclicality. In comparison with other indus-
tries, the commercial vehicle industry reacts heavily to cyclical changes with respect to both the speed
of adjustments as well as volatility. As a result, fluctuating sales volumes and revenues of truck manu-
facturers can regularly be observed in the course of an economic cycle.
102. The central driver of this development is the real Gross Domestic Product with the input factors private
consumption, gross investments, public expenditures as well as export surplus. When these factors and
thus the overall economic environment improve, this usually has a positive effect on truck sales. Other
relevant macroeconomic drivers are the interest level and the development of the producer price indi-
ces. Besides these macroeconomic indicators, the development of industries that are relevant for the
truck market is also important. These include, for instance, the logistics as well as the building industry.
Changes in these industries often have direct effects on the truck market. In addition to quantitative
factors, there are also qualitative aspects that are important for the development of truck sales. These
include regulatory and legislative initiatives such as the harmonisation of the truck toll in Europe, modi-
fications in emission standards, safety regulations as well as conditions for driving permits in inner-city
environmental zones.
Emerging markets
103. In the last two decades, the significance of various regional truck markets in the global market has
considerably changed in favour of the emerging countries. Especially the BRIC countries have strength-
ened their importance in the truck market at the expense of the triad countries. An analysis by the Bos-
ton Consulting Group (BCG, 2012) shows that the world market share of the triad countries has reduced
from 56 % in 2000 to 17 % in 2010. In the same period, the BRIC countries have increased their share of
worldwide truck sales from 33 % to 74 %. The authors of the study also expect that the truck markets in
the BRIC countries will offer attractive opportunities in future, even though the high growth rates from
the past can probably no longer be attained in future. In the long term, infrastructure problems will
probably brake Russia’s growth. For China, a market slow-down is expected due to expiry of the gov-
ernmental economic stimulus packages that drove the truck market in the past. Yet the European truck
market will also offer opportunities for growth in the coming years due to the catch-up effect from the
financial and sovereign debt crisis. However, growth forecasts for the European market depend on
when the financial and sovereign debt crisis has finally been overcome.
104. Overall, the outlook for the development of the global truck market is positive. The expected average
annual growth in sales for the period from 2012 to 2017 is 6.4 %. The highest level of growth is expected
in Asia, with an average growth rate of 7.7 % p.a. for the period from 2012 to 2017 followed by Europe,
as well as Africa and Australia with average growth rates of 6.3 % and 6.1 % p. a. in the same period.

KPMG PwC
34
Xx
Trends
105. One of the most important trends in the truck market is the shift from the low price segment to the
middle class segment.3 Currently the truck market is dominated by two segments, the premium and the
low price segment (only Brazil has a large middle class segment). While the low price segment is concen-
trated in emerging markets and developing countries, customers in mature markets predominantly de-
mand premium products. The authors of the BCG study expect this situation to change in this decade
and the middle class segment to play the leading role in the global truck market at the expense of the
low price segment. Moreover, the authors of the study anticipate the middle class segment to account
for almost half of global truck sales by 2020, for the BRIC countries; they even expect a share of about
70 %. According to their forecast, the middle class segment of the BRIC countries will generate about
44 % of the global truck sales by 2020, while that share amounted to 25 % in 2010. The graph below
gives an overview of the expected development:
Expected development of market segments in the BRIC countries
Source: BCG, 2012
106. The shift to the middle class segment is the result of government programmes, investments in the
infrastructure of emerging countries and regulations, such as the introduction of stricter emission stan-
dards and safety regulations4. Rising customer expectations regarding quality and the professionalisa-
tion of the transport industry in emerging markets are also significant.
3 Trucks are divided into the three segments of low price, middle class and premium based on multiple criteria,
such as price, compliance with exhaust emission standards, equipment, performance and cost focus, which are
cumulatively used to classify individual models according to the corresponding segments (cf. BCG, 2012)
4 Brazil, for example, introduced the exhaust emission standard PROCOVNE P-7 in 2012 and the introduction of
PROCOVNE P-8 is expected in the future, though the time of introduction is still uncertain.
75%
19%
95%
14%
63%
21%
5%
41%
4%
76%
36%
71%
71%59%
19%
40%
1%9%
1%9%
29%41%
0%
20%
40%
60%
80%
100%
2010 2020 2010 2020 2010 2020 2010 2020
Russia India China Brazil
Low price segment Middle class segment Premium segment

KPMG PwC
35
Xx
107. So far the world market has been dominated by two groups of manufacturers – globally acting premium
manufacturers and local manufacturers in the low price segment – the future focus on the middle class
segment presents new challenges to global manufacturers,. While global manufacturers primarily supply
the premium segment in triad countries, local manufacturers focus on the low price segment in emerg-
ing markets. In order to be competitive in the middle price segment, global premium manufacturers will
need to reduce costs and complexities and achieve a lower level of mechanisation. In line with this trend
a relocation of many of their activities to emerging market countries is expected.
108. Another trend in emerging markets is the increasing relevance of total cost of ownership when purchas-
ing new trucks. Total cost of ownership is already of central importance in mature markets. This trend is
another reason for the shift in demand from the low price segment to the middle class segment in
emerging market countries. According to the authors of the BCG study (BCG, 2012), fuel and mainte-
nance costs make up more than three quarters of the total cost of ownership of trucks in the low price
segment. With fuel prices rising, customers increasingly demand fuel-efficient trucks to reduce operat-
ing costs. Improved reliability and longer life at equal or lower operating cost are also increasingly deci-
sive factors when purchasing new vehicles.
109. Closely related to total cost of ownership, the idea of a "green fleet" will also become more important.
Regulatory authorities are promoting environmental protection around the world by increasingly strin-
gent emission standards, such as the European emission standards.5 This development demonstrates
the increasing relevance of environmental protection. The keyword "green fleet" summarises the trends
to optimise efficiency as well as the use of sustainable technologies and alternative fuels. According to
current expectations, in the long-term perspective a continuous development and optimisation of diesel
engines is the preferred alternative from a cost-benefit point of view. Hence, it is expected that diesel
engines will remain the primary mode of driving for trucks in the future. This gives especially established
American and European manufacturers a competitive advantage, since they have decades of experience
in diesel technology. Despite the advantages of optimising diesel engines, however, hybridisation of
engines is also pressing ahead. However, since purchasing decisions in the commercial vehicle industry
are above all characterised by economic efficiency, costs of hybrid drive systems will have to be signifi-
cantly reduced with a simultaneous increase of efficiency in the future.
Competitive environment
110. The global commercial vehicle market is comparatively fragmented as the activities of most manufac-
turers are primarily focused or even limited to their own regional market. This is particularly true for
truck manufacturers from emerging market countries. Global manufacturers are increasingly attempting
5 Exhaust emission standards like the Euro standard set limits for vehicles on the emission of carbon monoxide,
nitrogen oxides, hydrocarbons and particles and subdivide these into emission classes. In Germany, assignment
to an emission class has an effect on e. g. calculation of the motor vehicle tax.

KPMG PwC
36
Xx
to establish themselves in emerging markets by founding joint ventures and cooperations with local
manufacturers. Examples include the partnerships between Navistar International Corporation, Warren-
ville/USA ("Navistar"), and Mahindra & Mahindra Ltd., Mumbai/India ("Mahindra"), MAN SE and Si-
notruk or Daimler AG, Stuttgart/Germany ("Daimler" ) and OAO KAMAZ, Kazan/Russia ("KAMAZ") and
Beiqi Foton Motor Co., Ltd., Beijing/China, respectively. Moreover, the truck markets in triad countries
are already strongly consolidated.
111. As the graph below shows, Daimler is the world market leader with a market share of 13.1 % in 2012
based on worldwide sales of trucks with a GVW over 6 t. Dongfeng Motor Corporation, Wuhan/China
("Dongfeng") and Volvo AB, Goteborg/Sweden ("Volvo"), follow in second and third place with world
market shares of 7.5 % and 7.2 %. The MAN Group is in eighth place worldwide with a share of 4.5 %.
Market shares in recent years show a trend of Asian manufacturers like Dongfeng, First Automotive
Works Co., Ltd., Changchun/China, or China National Heavy Duty Truck Group Company Limited, Ji-
nan/China ("CNHDTC"), succeeding in expanding their market shares in comparison to global manufac-
turers (KPMG, 2011), although the development in 2012 contradicts this long-term trend.
Global market shares for Trucks > 6 t
Source: LMC, 2012
Regional markets
Europe
112. According to EIU's forecast, an average real GDP growth rate of 1.2 % can be expected for the 27 EU-
member states in the period from 2013 to 2017. The expected recovery of the European economy from
the financial and sovereign debt crisis also implies positive expectations for the European truck market
development. As the graph below shows, LMC Automotive forecasts a compound annual sales growth of
3.4%
5.2%
4.9%
3.7%
4.6%
6.9%
7.3%
6.7%
8.5%
11.3%
3.7%
4.5%
4.5%
5.2%
5.2%
5.7%
6.8%
7.2%
7.5%
13.1%
0% 2% 4% 6% 8% 10% 12% 14%
Navistar
CNHDTC
MAN Group
Isuzu
Paccar
CFAWG
Tata
Volvo
Dongfeng
Daimler
2012 2011

KPMG PwC
37
Xx
6.3 % in the period from 2012 to 2017. However, growth varies considerably between individual mem-
ber states. In particular, for the countries that were hit especially hard by the financial and sovereign
debt crisis - like Spain, Portugal, Ireland and Greece - very high growth rates between 15.2 % and 47.4 %
are expected. To what extent this potential for growth can actually be realised in this period is strongly
dependent on how quickly the crisis will be overcome. When considering the expected growth rates, it is
further important to remember that they mostly represent a recovery of the markets to a pre-crisis level
rather than organic, sustainable market growth (Management Engineers & AutoValue, 2010).
Truck sales - Europe (in thousand units)
Source: LMC, 2012
113. The European truck market is comparatively heterogeneous. While the premium segment with an
emphasis on total cost of ownership prevails in Western Europe, the truck market in Central and Eastern
Europe is characterised by the low and middle price segments. Individual markets are mostly dominated
by local manufacturers. While manufacturers like Volvo, MAN Group, Scania AB, Södertälje/Sweden
("Scania"), and Daimler dominate the markets in Western Europe (LMC, 2012), Russian manufacturers
like KAMAZ, OAO GAZ, Nizhny Novgorod/Russia ("GAZ"), and OAO MAZ, Minsk/Belarus ("MAZ"), hold a
leading position in Central and Eastern Europe (IHS, 2012).
Germany
114. According to EIU's forecast, an average real GDP growth rate of 1.3 % is expected in the period from
2012 to 2017 indicating a recovery of the truck market. New purchases, however, will largely be limited
to replacement purchases. A possible positive effect on truck sales might also result from pull-forward
effects of new purchases because of the introduction of the mandatory Euro VI standard for all newly
232
300
277 265
277
316
350
376
0
50
100
150
200
250
300
350
400
2010 2011 2012 2013 2014 2015 2016 2017
CAGR 2012-2017: 6.3%

KPMG PwC
38
Xx
registered trucks in Germany as of January 2014 (IHS, 2012). In the midterm, the most important growth
factors for the German truck market will be the overall macroeconomic development and the backlog
demand for replacement purchases that has built up during the financial and sovereign debt crisis (IHS,
2012).
115. The graph below displays a sales forecast for the German truck market. According to LMC Automotive,
the compound annual growth rate for the period from 2012 to 2017 will be 3.3 %. While the compound
annual growth for trucks with a GVW of 6-15 t is 1.6 % p.a., growth for trucks with a GVW over 15 t is
considerably higher at 4.1 %. Consequently, sales of the 6-15 t segment are expected to decrease from
32 % in 2012 to 29 % in 2017.
Truck sales – Germany (in thousand units)
Source: LMC, 2012
116. Like in the previous year, Daimler with the brand Mercedes-Benz remains the market leader in the
German truck market in 2012, with a market share of 39 %. MAN Group is in second place with a market
share of 26 %. No other manufacturer in Germany has a market share greater than 10 %. The German
market can hence be described as highly concentrated.
32%31% 32% 32% 31% 31% 30% 29%
68%
69%
68%68% 69%
69%70%
71%
0
10
20
30
40
50
60
70
80
90
100
2010 2011 2012 2013 2014 2015 2016 2017
GVW 6-15 t GVW>15 t
73
89
81 77
80
86 91
95
CAGR 2012-17: 3.3 %

KPMG PwC
39
Xx
Market shares in Germany
Source: LMC, 2012
Russia
117. In contrast to many other emerging markets, the Russian economy was significantly affected by the
financial market crisis and continues to be influenced by its ramifications. According to EIU's forecast, an
average real GDP growth rate of 3.8 % is expected for the period from 2012 to 2017. This forecast eco-
nomic development is expected to have a positive impact on future truck sales. However, according to
BCG's assessment, Russia's long-term growth will be hindered by infrastructural problems caused by its
size and extreme climate in certain areas as well as low investment in the country’s infrastructure in the
past. The graph below shows the sales forecast for the Russian truck market with a GVW over 6 t. The
expected compound annual growth rate for the period from 2012 to 2017 is 4.2 %.
3.5%
1.1%
2.2%
6.0%
6.7%
7.7%
9.3%
26.7%
36.7%
4.3%
1.0%
2.4%
5.7%
6.2%
7.8%
7.9%
26.1%
38.6%
0% 10% 20% 30% 40% 50%
Other
Mitsubishi
Renault Trucks
Scania
Volvo
IVECO Trucks
DAF
MAN Group
Mercedes-Benz
2012 2011

KPMG PwC
40
Xx
Truck sales – Russia (in thousand units)
Source: LMC, 2012
118. The Russian commercial vehicle market has so far been strongly influenced by Europe. About 30 % of
domestic demand for trucks is met by foreign manufacturers (KPMG, 2011). Nevertheless, the Russian
truck market is currently characterised by low technical standards and a dominating low price segment.
However, due to the introduction of stricter emission standards, a modernisation and a quality im-
provement of the Russian truck fleet is expected. Beyond that it is generally assumed that the Russian
government will continue to release more stringent emission standards in the future (BCG, 2012). Both
developments may lead to the middle class and premium class segments achieving higher growth rates
at the expense of the low price segment and becoming the major segments in the future.
119. The graph below illustrates the competitive situation in the Russian truck market. Despite the fact that
many manufacturers from the triad countries have established themselves in the Russian market, this
already concentrated market remains dominated by local manufacturers. Market leader is the Russian
manufacturer KAMAZ with a market share of 31.5 % in 2012. GAZ and MAZ follow with market shares of
18.9 % and 9.3 % respectively. MAN Group is the leading foreign manufacturer in the Russian truck mar-
ket with a market share of 7.2 % and takes the fourth place. The dominance of local manufacturers with
trucks in the low price segment is based on historical reasons and partly also caused by protectionist
measures of the Russian government that make it difficult for foreign companies to serve the Russian
market. However, this situation is expected to change in the future due to Russia's accession to the
World Trade Organization (WTO) in 2012. Nevertheless, the potential positive effects of Russia's WTO
accession may be reduced by the introduction of the "utilization fee". The "utilization fee" is charged on
imported vehicles from foreign manufacturers and could overcompensate for the reduction of tariffs
due to Russia’s WTO accession. If the "utilisation fee" is restricted to importers only, localising the pro-
23%21%
22% 28% 28% 27% 27% 27%
77%
79%78%
72% 72% 73%
73%73%
81
125
132139
144140
154162
0
20
40
60
80
100
120
140
160
180
2010 2011 2012 2013 2014 2015 2016 2017
GVW 6-15 t GVW > 15 t
CAGR 2012-17: 4.2 %

KPMG PwC
41
Xx
duction could possibly help to avoid these protectionist measures. In addition, demand is increasingly
shifting towards technically developed, environmentally friendly trucks (KPMG, 2011). This provides
triad manufacturers with the opportunities to expand their competitive position in the Russian market.
Market shares in Russia
Source: LMC, 2012
India
120. According to EIU's forecast, an average real GDP growth rate of 7.2 % is expected in the period from
2013 to 2017. Approximately the same figures apply to the Indian truck market. As the graph below
shows, a compound annual sales growth of 7.6 % is expected for the Indian truck market with a GVW
over 6 t in the period from 2012 to 2017. While the expected compound annual growth rate for trucks
with a GVW of 6-15 t is 4.3 %, the expected growth for trucks over 15 t is considerably higher at 10.4 %.
This will reduce the share of the 6-15 t segment from 50 % in 2012 to 43 % in 2017.
11.4%
2.3%
5.0%
6.0%
6.0%
7.9%
7.5%
10.8%
12.0%
31.2%
9.1%
3.6%
3.8%
4.2%
6.2%
6.3%
7.2%
9.3%
18.9%
31.5%
0% 5% 10% 15% 20% 25% 30% 35%
Other
Mercedes-Benz
Scania
Hyundai
Volvo
UralAZ
MAN Group
MAZ
GAZ
KAMAZ
2012 2011

KPMG PwC
42
Xx
Truck sales – India (in thousand units)
Source: LMC, 2012
121. The low price segment currently dominates the Indian market (BCG, 2012). However, it is expected that
a middle class segment will develop and replace the low price segment over the long term.
122. The introduction of more stringent emission standards is one of the most important driving forces
behind the modernisation of the Indian truck fleet. In 2010, the Indian government changed its national
emission standards from Bharat II (corresponds to Euro II) to Bharat III (corresponds to Euro III), while
urban emission standards were increased from Bharat III to Bharat IV (corresponds to Euro IV) (BCG,
2012). According to the BCG study, national emission standards are expected to be raised to Bharat IV in
the near future as well. Another driving force is the expected expansion and improvement of the infra-
structure network. For example, investments in the expansion of a national highway system are in-
tended to allow for a pan-Indian long-distance travel and transportation.
123. With regard to competition, the Indian truck market is highly concentrated and primarily dominated by
the local manufacturer Tata Motors Limited, Mumbai/India ("Tata Motors"), with a market share of
59.1 % in 2012. Other leading competitors include Ashok Leyland Limited, Chennai/India ("Ashok Ley-
land"), and Eicher Motors Limited, Delhi/India ("Eicher Motors"), with market shares of 21.4 % and
12.1 % respectively. Joint ventures and cooperations with local manufacturers are also gaining in impor-
tance in India, such as for example between Volvo and Eicher Motors or Navistar and Mahindra. The
individual companies’ market shares for the years 2011 and 2012 are as follows:
48% 47% 50% 50% 47% 45% 44% 43%
52% 53%50% 50%
53%55%
56%57%
311 309281 292
331
363385
405
0
50
100
150
200
250
300
350
400
450
2010 2011 2012 2013 2014 2015 2016 2017
GVW 6-15 t GVW>15 t
CAGR 2012-17: 7.6 %

KPMG PwC
43
Xx
Market shares in India
Source: LMC, 2012
Bus
Global bus market
124. The global market for buses with a GVW over 8 t can be divided into the categories of city buses, inter-
city buses and coaches.
125. Compared to the truck market, the bus market is less dependent on general economic developments
and macroeconomic factors. Rather government and tourism expenditures comprise the quantitative
influencing factors on the bus market. The city bus segment is particularly dependent on government
spending, as city buses are normally financed by the public sector. In times of tight government budgets
- like in many European countries - there are often delays in planned bus fleet renewals which have cor-
responding negative effects on the market development. Due to the consequences of the financial and
sovereign debt crisis, this can currently be observed in particular in southern European countries. How-
ever, many German municipalities have also been forced to reduce their spending. The intercity and
coach segments are rather dependent on the development of tourism spending.
126. Legislative initiatives and government incentives further influence the bus market. Examples of this
include the elimination of the train monopoly in Germany, legislative initiatives such as the require-
ments to wear seatbelts or to provide seats and access for disabled travellers, or the grant of EU subsi-
dies. In addition, an analysis of the bus market must take into account replacement cycles and special
events like the Olympic Games and the FIFA World Cup that lead to increased demand for transporta-
tion.
0.3%
0.1%
0.0%
0.8%
2.1%
3.1%
12.1%
19.2%
62.1%
0.3%
0.3%
0.8%
1.4%
2.2%
2.4%
12.1%
21.4%
59.1%
0% 10% 20% 30% 40% 50% 60% 70%
Other
Volvo
Mercedes-Benz
Mahindra
Swaraj Mazda
AMW
Eicher Motors
Ashok Leyland
Tata Motors
2012 2011
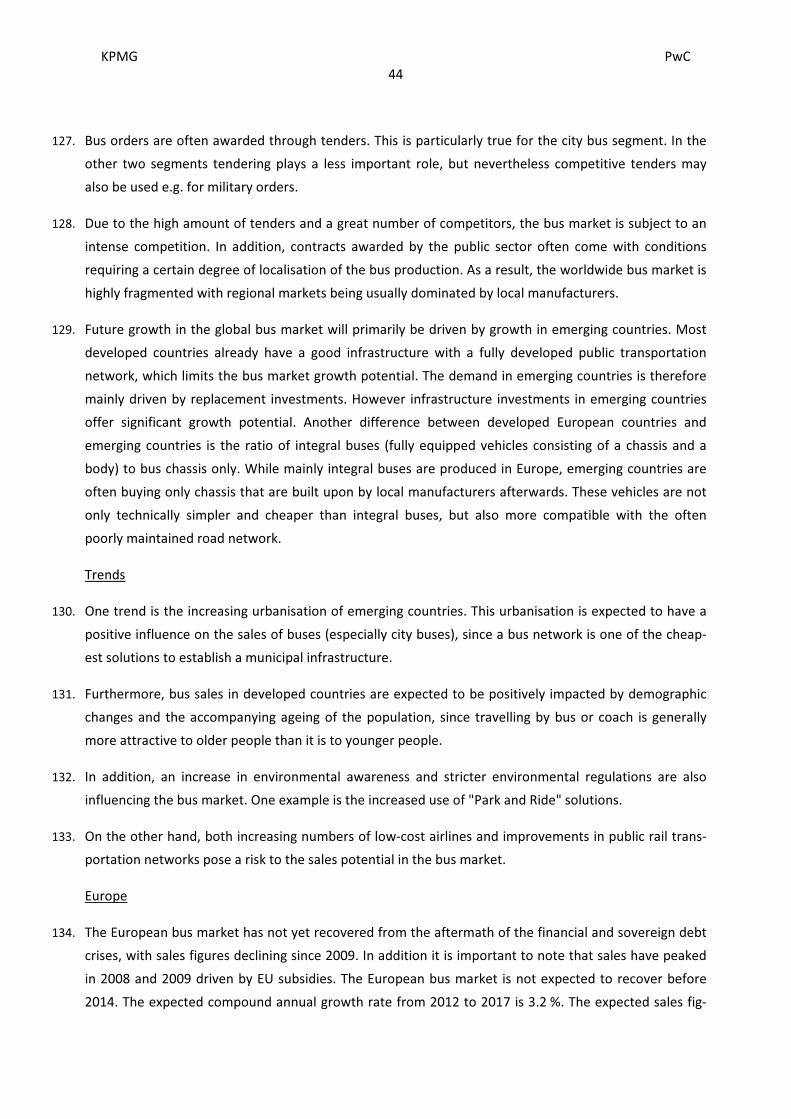
KPMG PwC
44
Xx
127. Bus orders are often awarded through tenders. This is particularly true for the city bus segment. In the
other two segments tendering plays a less important role, but nevertheless competitive tenders may
also be used e.g. for military orders.
128. Due to the high amount of tenders and a great number of competitors, the bus market is subject to an
intense competition. In addition, contracts awarded by the public sector often come with conditions
requiring a certain degree of localisation of the bus production. As a result, the worldwide bus market is
highly fragmented with regional markets being usually dominated by local manufacturers.
129. Future growth in the global bus market will primarily be driven by growth in emerging countries. Most
developed countries already have a good infrastructure with a fully developed public transportation
network, which limits the bus market growth potential. The demand in emerging countries is therefore
mainly driven by replacement investments. However infrastructure investments in emerging countries
offer significant growth potential. Another difference between developed European countries and
emerging countries is the ratio of integral buses (fully equipped vehicles consisting of a chassis and a
body) to bus chassis only. While mainly integral buses are produced in Europe, emerging countries are
often buying only chassis that are built upon by local manufacturers afterwards. These vehicles are not
only technically simpler and cheaper than integral buses, but also more compatible with the often
poorly maintained road network.
Trends
130. One trend is the increasing urbanisation of emerging countries. This urbanisation is expected to have a
positive influence on the sales of buses (especially city buses), since a bus network is one of the cheap-
est solutions to establish a municipal infrastructure.
131. Furthermore, bus sales in developed countries are expected to be positively impacted by demographic
changes and the accompanying ageing of the population, since travelling by bus or coach is generally
more attractive to older people than it is to younger people.
132. In addition, an increase in environmental awareness and stricter environmental regulations are also
influencing the bus market. One example is the increased use of "Park and Ride" solutions.
133. On the other hand, both increasing numbers of low-cost airlines and improvements in public rail trans-
portation networks pose a risk to the sales potential in the bus market.
Europe
134. The European bus market has not yet recovered from the aftermath of the financial and sovereign debt
crises, with sales figures declining since 2009. In addition it is important to note that sales have peaked
in 2008 and 2009 driven by EU subsidies. The European bus market is not expected to recover before
2014. The expected compound annual growth rate from 2012 to 2017 is 3.2 %. The expected sales fig-

KPMG PwC
45
Xx
ures are shown in the following graph:
New bus registrations > 8 t in Europe (in thousand units)
Source: Analyse & Prognose, 2012
135. Contrary to the truck market, the introduction of the Euro VI-standard will most likely have no notice-
able impact on the growth of the bus market as public investors are generally driven by demand rather
than the introduction of new emission standards. One factor that should positively affect the bus market
is the recently enacted EU law requiring the installation of a lift and two seats for wheelchair users in
every bus as of 2015. This amendment of the law will predominantly affect coaches and intercity buses,
since most city buses have already been adapted to that requirement.
136. A rebound to pre-crisis levels is expected in the coming years for the mature and saturated European
bus market. Although, a stable level of bus sales is expected in the long run, historical trends indicate
declining sales since the 1970s.
137. Because of the fragmented market structure, individual European markets are dominated by local
manufacturers. The Daimler-owned EvoBus, Irisbus owned by Iveco S.p.A., Turin/Italy ("Iveco"), MTB,
Volvo and Scania are among the leading manufacturers in Europe.
138. Based on the number of new registrations, Germany is the second largest European bus market behind
France with approximately 19 % market share in 2012. Because of the liberalisation of long-distance bus
lines in Germany, a precise sales forecast is currently hardly possible. It is still uncertain whether there
will be a significant growth in the intercity bus segment, since at first long-distance line operators will
most likely play the role of a middleman and will probably use the spare capacities of travel businesses
rather than build their own fleets. Moreover, it is expected that no new lines, but rather extensions to
17% 17% 19% 20% 19% 18% 17% 17%
83% 83% 81% 77% 77% 77% 79% 81%
3%4%
5% 4% 2%26 26
24 2426
28 28 28
0
5
10
15
20
25
30
2010 2011 2012 2013 2014 2015 2016 2017
Germany
Europe without Germany
Liberalisation of long-distance bus service
CAGR 2012-17: 3.2 %

KPMG PwC
46
Xx
existing lines with stops in Germany will be established. In the graph above (Note 134), the expected
impact of the long-distance bus deregulation is depicted separately. A compound annual growth rate of
1.3 % (without deregulation of long-distance lines in Germany) is expected for the period between 2012
and 2017. According to the Omnibus study conducted by Analyse & Prognose, EvoBus along with MTB
dominate the German bus market with market shares in 2011 of approximately 50 % and 30 %, respec-
tively (Analyse & Prognose, 2012).
c) Market positioning and competitive environment in the MAN Latin America division
Truck - Brazil
139. According to EIU’s forecast, an average annual growth rate of 3.6 % is expected for the Brazilian econ-
omy from 2013 to 2017. The forecasts for the Brazilian truck market are also positive. As shown in the
graph below, LMC Automotive expects a compound annual truck sales growth rate of 4.1 % from 2012
to 2017. While the expected growth rate for trucks with a GVW of 6-15 t is 1.7 %, the expected annual
growth rate for trucks over 15 t is significantly higher with 5.2 %. Consequently, the sales share of trucks
from 6 -15 t is expected to decline from 34 % of the total sales in 2012 to 30 % in 2017.
140. However, the growth of the Brazilian truck market is being hampered by the country’s underdeveloped
infrastructure. Only 12 % of the roads in Brazil are paved, while the percentages of paved streets in India
and Russia are 47 % and 81 % respectively (BCG, 2012).
141. Major sport events like the FIFA-World Cup in 2014 and the 2016 Summer Olympics are expected to
have a positive impact on the public transportation system, but will have no noteworthy impact on the
quality of the long-distance infrastructure that trucks heavily rely on. Nevertheless it is expected, that
these events will have a stimulating effect on the Brazilian economy as a whole and therefore the Brazil-
ian truck market as well.

KPMG PwC
47
Xx
Truck sales – Brazil (in thousand units)
Source: LMC, 2012
142. In contrast to other emerging countries, the middle class truck segment is already predominant in Brazil.
The premium segment is also significant due to the maturity of the Brazilian market, while the low price
segment is of minor importance. This market structure is expected to remain in the future. The quality
increase of the Brazilian truck fleet is especially driven by stricter safety and emissions standards. The
introduction of the emission standard PROCONVE P-7 (equal to Euro V) in 2012 was one important in-
fluencing factor. The impending introduction of the PROCONVE P-8 standard (equal to Euro VI) is also
expected to further affect truck sales. There is however no consensus yet, when exactly it will take
place6. For the coming years BCG expects that the middle class segment will retain its dominant position,
although its share is expected to decline from 71 % in 2010 to 59 % in 2020. Correspondingly, the pre-
mium segment is expected to increase to approximately 40 % of total Brazilian truck sales by 2020 (BCG,
2012).
143. A key success factor in the Brazilian middle and premium segments is a supply of trucks tailored to cope
with the country’s poor infrastructure. From a regulatory perspective a local production is another key
to success. Foreign manufacturers are released from import tariffs only when they manufacture 60 % or
more of their production domestically. Finally, distribution and service networks are continuously gain-
ing importance due to rising customer expectations.
144. As shown in the following graph, the Brazilian truck market is dominated by global manufacturers, who
control the market with products customised for the Brazilian market. These vehicles are generally more
6 BCG assumed in their 2012 study, that the new standard will go into effect in 2017.
32% 34%34% 33% 33% 32% 29% 30%
68% 66%
66%67%
67%68%
71%70%
162 166
132
144152
161
147
161
0
20
40
60
80
100
120
140
160
180
2010 2011 2012 2013 2014 2015 2016 2017
GVW 6-15 t GVW > 15 t
CAGR 2012-17: 4.1 %

KPMG PwC
48
Xx
robust, simpler and cheaper than their equivalents in triad countries. MAN respectively ML is the market
leader in Brazil with a share of 30.7 %, followed by Mercedes-Benz and Ford Motor Company with re-
spective shares of 26.7 % and 15.9 %. Agrale S.A. is one of the few local manufacturers that could de-
fend its position as a niche provider of special-purpose vehicles.
Market shares in Brazil
Source: LMC, 2012
Bus - Brazil
145. As is commonly seen in emerging countries, the Brazilian bus market is characterised by the separate
manufacturing of bus chassis and bodies. With over 20,000 units sold in 2012 the Brazilian bus market is
approximately comparable in size with the European market. The size of the Brazilian market is a result
of the fact that personal transportation is virtually exclusively done using the road system. Rail and air
transportation are only being used to a minor extent. Another influencing factor are the infrastructure
and the automobile industry incentive programmes provided by the Brazilian government. These in-
clude for example the announced and partially in 2012 implemented purchase of 8,570 school buses.
146. An increasing demand is expected in the coming years because of the two major events: the FIFA World
Cup in 2014 as well as the 2016 Summer Olympics.
147. Just like the truck market, the Brazilian bus market is mainly dominated by global players. ML has as-
sumed a leading competitive position along Daimler, while Agrale is the only domestic manufacturer
that was able to retain a relevant market share finding themselves behind Daimler and ML as one of the
leading market competitors (IHS, 2012).
0.3%
1.1%
6.4%
8.1%
10.9%
17.2%
25.4%
30.7%
0.3%
0.4%
6.8%
7.8%
10.8%
15.9%
26.7%
30.7%
0% 5% 10% 15% 20% 25% 30% 35%
International
Agrale
Iveco
Scania
Volvo
Ford
Mercedes-Benz
MAN
2012 2011
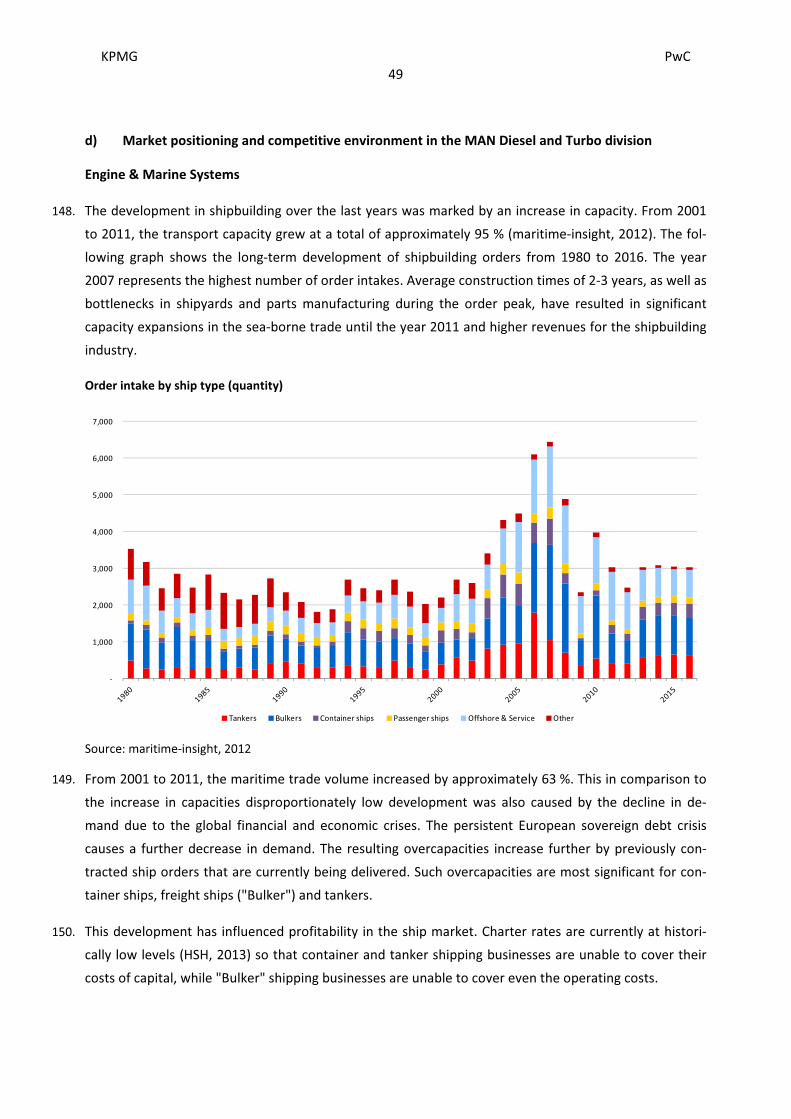
KPMG PwC
49
Xx
d) Market positioning and competitive environment in the MAN Diesel and Turbo division
Engine & Marine Systems
148. The development in shipbuilding over the last years was marked by an increase in capacity. From 2001
to 2011, the transport capacity grew at a total of approximately 95 % (maritime-insight, 2012). The fol-
lowing graph shows the long-term development of shipbuilding orders from 1980 to 2016. The year
2007 represents the highest number of order intakes. Average construction times of 2-3 years, as well as
bottlenecks in shipyards and parts manufacturing during the order peak, have resulted in significant
capacity expansions in the sea-borne trade until the year 2011 and higher revenues for the shipbuilding
industry.
Order intake by ship type (quantity)
Source: maritime-insight, 2012
149. From 2001 to 2011, the maritime trade volume increased by approximately 63 %. This in comparison to
the increase in capacities disproportionately low development was also caused by the decline in de-
mand due to the global financial and economic crises. The persistent European sovereign debt crisis
causes a further decrease in demand. The resulting overcapacities increase further by previously con-
tracted ship orders that are currently being delivered. Such overcapacities are most significant for con-
tainer ships, freight ships ("Bulker") and tankers.
150. This development has influenced profitability in the ship market. Charter rates are currently at histori-
cally low levels (HSH, 2013) so that container and tanker shipping businesses are unable to cover their
costs of capital, while "Bulker" shipping businesses are unable to cover even the operating costs.
-
1,000
2,000
3,000
4,000
5,000
6,000
7,000
Tankers Bulkers Container ships Passenger ships Offshore & Service Other
KPMG PwC
50
Xx
151. The slump in demand in merchant shipping (comprised of container, bulkers and tankers) has been
somewhat weakened by a less severe order decrease for offshore, passenger and other ships. As a re-
sult, orders for merchant ships accounted for approximately 67 % of total orders in 2007, and approxi-
mately 50 % in 2012 (maritime-insight, 2012).
152. Overall, these circumstances led to a decline in ship orders in 2012 and a corresponding price pressure
on ship and ship components manufacturers.
153. The HSH Nordbank forecast in February 2013 (HSH, 2013) a further stagnation of charter rates for 2013
and no recovery of the charter rates before the end of 2014 for container ships, freight ships
and tankers.
154. Maritime-insight assumes a low point in ship orders in 2012 and expects an order increase beginning in
2013 to a level approximately 20 % higher than the average from 1980 to 2003 (maritime-insight, 2012).
This expectation relies mainly on the assumption that global trade will continue to grow and on the re-
lated stronger demand for transport capacity. However, the increase in transport capacity is expected to
be covered by larger ships with a significantly larger carrying capacity. Therefore from 2011 to 2021,
ship sales are expected to increase 0.9 % p.a., while the average increase in carrying capacity is assumed
to be 3.6 % p.a. (maritime-insight, 2012).
155. MDT manufactures four-stroke engines for ships up to approximately 5,000 gross registered tons and for
cruise liners up to 60,000 gross registered tons. Larger ships are usually powered by two-stroke engines
and although MDT develops such engines, they are licensed to and manufactured by partner companies
near the shipyards.
156. Stricter requirements for four-stroke engines concerning the emission of nitrogen and sulphur oxides as
well as improved efficiency could lead ship-owners to modernise their fleet. Therefore, both for envi-
ronmental and cost reasons an increased demand is expected in the coming years for dual-fuel motors
that can use both gas and diesel as fuel or even for pure gas engines in the long run. An increasing de-
mand for gas as an energy source is currently causing high demand for liquid gas transportation ships,
also known as LNG-Tankers.
157. The four-stroke engine market is highly competitive. The Wärtsilä Corporation, Helsinki/Finland ("Wärt-
silä") is the market leader with 38 % (2011), followed by MDT with 17 % and Hyundai Heavy Industries
Co., Ltd., Ulsan/South Korea ("HHI"), with 10 % (Source: MDT). The shipyard operator HHI founded the
brand Himsen in 2001 and since then could considerably extend its market share. Following this strat-
egy, the possibility exists that other large shipyards with their machine production could also enter the
market as direct competitors to MDT. MDT is the market leader for two stroke engines with a market
share of approximately 80 %, with Wärtsilä having approximately 18 % (Source: Wärtsilä). Nevertheless,

KPMG PwC
51
Xx
it should be considered, that the manufacturing takes place exclusively over licensees located near the
shipyards.
Power Plants
158. The SBU Power Plants of MDT operates as a manufacturer of stationary diesel and gas engines that are
used to generate electricity. Generally these engines are used for the propulsion of generators in decen-
tralised diesel and gas engine power plants with a total deployable capacity of up to 400 MW. Due to
low investments requirements and a relatively short construction time compared to contemporary
power plants, diesel and gas power plants are being used as a temporary solution for a decentralised
covering of base loads especially in developing countries. With increasing energy demand a shift to large
power plants is following as a long term solution. The market for diesel and gas power plants lies there-
fore in developing countries which are in the beginning stages of their economic development. In devel-
oped countries MDTs power plant solutions are used mainly as emergency power or peak load generat-
ing units. Since diesel and gas engines have an estimated life expectancy of 20 to 30 years regional sales
change accordingly over the years. In comparison to the market as a whole, diesel and gas engines that
are deployed to generate electricity represent only a niche market (Source: MDT).
159. Likely growth indicators for the relevant market are the energy and electricity demand growth rates, as
well as the energy production in the respective countries. The growth in demand for energy is deter-
mined by the overall economic development and is expected to lie slightly lower than the overall eco-
nomic growth rates in the next few years. By 2035 the worldwide energy demand is expected to in-
crease by approximately 35 %, or on average by 1.2 % p. a. (IEA, 2012). The increase in energy demand is
especially attributable to the rising population and growing wages.

KPMG PwC
52
Xx
Development of the global energy demand
Source: IEA, 2012
160. However, the increasing demand for energy is predominantly coming from non OECD countries. In
North and South America, energy demand in 2035 is expected to be only 4.8 % higher than the current
level, while in Europe an increase of only 0.5 % is expected. On the other hand, demand in emerging and
developing countries is expected to increase significantly. China and India are showing average yearly
growth rates of 1.9 % and 3.2 % respectively. China alone is expected to contribute approximately 33 %
to the global growth in energy demand by 2035.
161. In particular, the demand for natural gas is forecast to rise significantly by 2035, with an estimated
growth of 50 %. The demand for electricity from oil and coal is also expected to continue to grow 14 %
and 21 % respectively in the same period. In both cases, growth is again driven by an increasing demand
from non-OECD countries. Approximately 50 % of the growth in oil demand can be traced back to China.
Oil demand is expected to grow by 2.2 % p. a. in China, and by 3.3 % p. a. in India until 2035. However, in
OECD countries the demand for oil and coal is expected to decrease. By 2035 the demand for coal in
Europe is expected to decline to approximately 60 % of its 2010 level. The demand for oil is also ex-
pected to decrease on average by 1.0 % p. a. in Europe, and by 1.4 % in the USA until 2035. The decreas-
ing demand is mainly driven by an increasing efficiency and an on-going shift to alternative fuels in the
transportation business. Consequently, the proportion of global energy demand for fossil fuel energy is
expected to decrease from approximately 81 % to approximately 70 % in 2035.
162. Renewable energy sources are increasingly gaining importance as an alternative to fossil fuels. A signifi-
cant growth is forecast until 2035 for renewable energies. The IEA predicts a total growth of 82.8 % (IEA,
2012). Renewable energies are assumed to show the highest growth of all energy sources and are con-
8,779
12,730
13,989
14,922
15,675
16,417
17,197
-
2,000
4,000
6,000
8,000
10,000
12,000
14,000
16,000
18,000
1990 2010 2015 2020 2025 2030 2035
millio
n to
e
1.9%
1.9%
1.3%
1.0%
0.9%
0.9%
CAGR

KPMG PwC
53
Xx
sequently expected to contribute a higher share to the total energy consumption, going from approxi-
mately 20 % in 2010 to approximately 31 % in 2035.
163. The development in electricity demand of the particular region will dictate the building of new power
plants. The development in electricity demand and generation, especially in developing countries, is
therefore of significant relevance to the SBU Power Plants. The demand for electricity is expected to
grow faster than any other energy related area with an estimated growth rate of 71 % or 2.2 % p.a. be-
tween 2010 and 2035. More than 80 % of this increase will come from non-OECD countries, with more
than 50 % from China and India.
164. Furthermore, electricity prices are expected to increase by 15 % in the forecast period, mostly caused by
increasing primary energy prices. The power generation capacity is expected to increase in line with
demand. The capacity will thus grow by approximately 72 % in total between 2010 and 2035. The energy
sources with the highest contribution will most likely be gas and wind with expected capacity growth of
nearly 50 %. In addition, long-term trends show a shift from diesel- and heavy oil-powered power plants
towards plants powered by natural gas or alternative energy sources. This means for MDT that more
and more dual fuel motors or gas motors will be required. The development of electricity generation by
fossil fuels is shown below:
Electricity generation by fossil fuels:
Source: IEA, 2012
165. Electricity generation is expected to increase in Asia, as well as in those markets that MDT identified as
their target markets. In Africa and the Middle East the average annual growth rates are approximately
3.0 % with a declining growth trend in the long run. This will ultimately result in a slow-down of the ca-
CAGR
5.1%
1.8%
1.9%
3.6%
0.0%
4,5616,600 6,629 6,401
2,929
7,847
11,163
14,528
-
5,000
10,000
15,000
20,000
25,000
1990 2010 2020 2035
TWh
OECD Non-OECD
-0.2%
CAGR
CAGR

KPMG PwC
54
Xx
pacity increase. The forecast trends in energy generation from different regions are shown below:
166. Wärtsilä was the market leader for medium-speed motors in 2011 with a market share of 51 %. MDT
followed with a market share of 24 %, of which nearly half was attributable to licenses. On third and
fourth places followed HHI and Caterpillar Inc., Peoria/USA ("Caterpillar") with 8 % and 7 % respectively.
Wärtsilä is also the market leader in the increasingly relevant gas engine market with a market share of
approximately 71 % in 2011. MDT had a market share of 13 % followed by HHI with 3 % and Caterpillar
with 2 % (Source: MDT).
Turbomachinery
167. The SBU Turbomachinery provides compressors, gas and steam turbines and reactors for the oil and gas
industries, the processing and energy generation industries, as well as complete machinery trains for the
chemical and petrochemical industries. The developments in the production, pipeline transport and
processing of oil and gas as well as in the chemical and petrochemical industries are therefore the main
drivers of the SBU Turbomachinery.
168. Especially the technologically advanced production of oil and gas from offshore and other unconven-
tional sources has been identified as a relevant growth market for the SBU Turbomachinery. One third
of the total oil and gas supply is currently provided by offshore sources, with the total share expected to
increase in the future.
169. The oil and gas supply is necessarily dependent on the discovery and exploration of new sources. There-
fore, a forecast can be made based on the discovery of new oil and gas fields in the near past as well as
the number of discovered, but not yet explored sources. From 2001 to 2011 on average 102 oil and gas
offshore fields were explored each year. The number of producing fields has increased by 3.9 % p. a. in
the same timeframe. It is estimated that an average of 115 oil and gas fields will be explored every year
from 2012 to 2020. Compared to the past, a higher number of new sites is required to maintain the
same output, since more and more fields are being exploited (Clarkson, 2012).
CAGRs 1990-2010 2010-2020 2020-2035 2010-2035
OECD 1.8% 0.9% 0.7% 0.8%
Eastern Europe / Eurasia -0.6% 1.6% 1.3% 1.4%
Asia (Non-OECD) 8.4% 5.5% 2.6% 3.8%
Middle East 6.8% 3.8% 2.6% 3.0%
Africa 3.8% 3.6% 2.6% 3.0%
Latin America 4.0% 2.8% 1.9% 2.3%
Non-OECD 4.7% 4.5% 2.4% 3.2%
EU 1.3% 0.5% 0.5% 0.5%
Worldwide 3.0% 2.8% 1.8% 2.2%
Source: IEA, 2012
Electricity development by regions
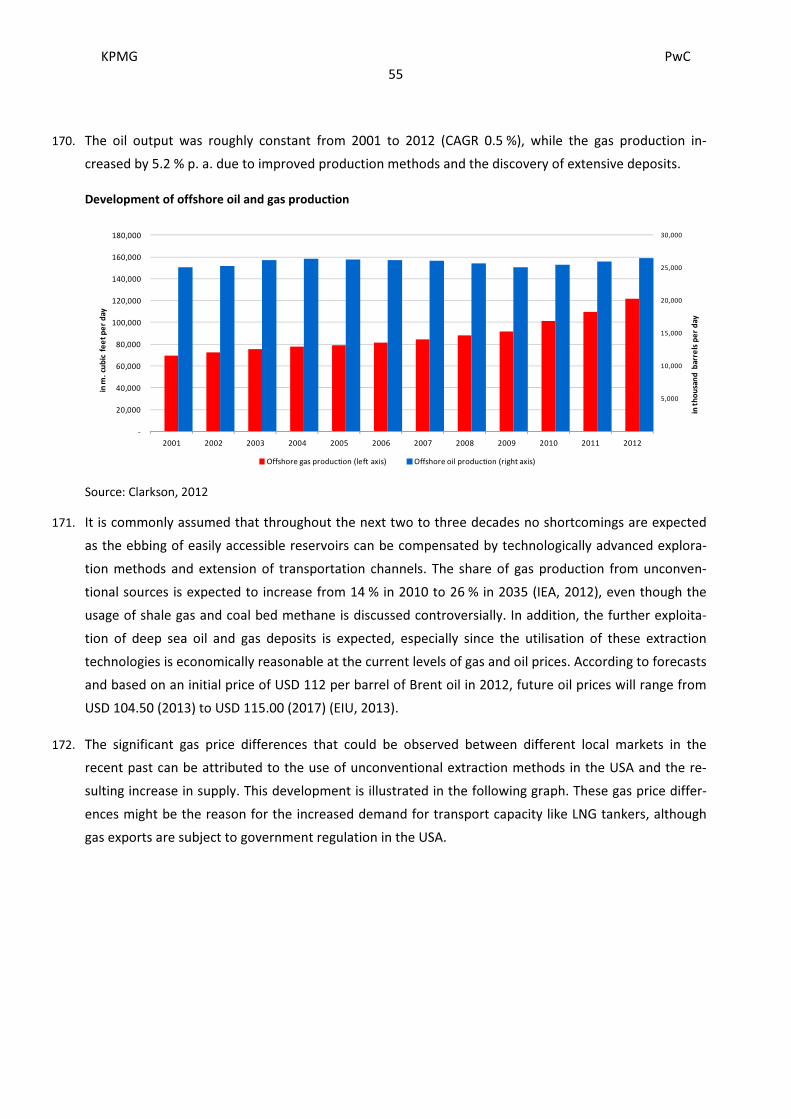
KPMG PwC
55
Xx
170. The oil output was roughly constant from 2001 to 2012 (CAGR 0.5 %), while the gas production in-
creased by 5.2 % p. a. due to improved production methods and the discovery of extensive deposits.
Development of offshore oil and gas production
Source: Clarkson, 2012
171. It is commonly assumed that throughout the next two to three decades no shortcomings are expected
as the ebbing of easily accessible reservoirs can be compensated by technologically advanced explora-
tion methods and extension of transportation channels. The share of gas production from unconven-
tional sources is expected to increase from 14 % in 2010 to 26 % in 2035 (IEA, 2012), even though the
usage of shale gas and coal bed methane is discussed controversially. In addition, the further exploita-
tion of deep sea oil and gas deposits is expected, especially since the utilisation of these extraction
technologies is economically reasonable at the current levels of gas and oil prices. According to forecasts
and based on an initial price of USD 112 per barrel of Brent oil in 2012, future oil prices will range from
USD 104.50 (2013) to USD 115.00 (2017) (EIU, 2013).
172. The significant gas price differences that could be observed between different local markets in the
recent past can be attributed to the use of unconventional extraction methods in the USA and the re-
sulting increase in supply. This development is illustrated in the following graph. These gas price differ-
ences might be the reason for the increased demand for transport capacity like LNG tankers, although
gas exports are subject to government regulation in the USA.
5,000
10,000
15,000
20,000
25,000
30,000
-
20,000
40,000
60,000
80,000
100,000
120,000
140,000
160,000
180,000
2001 2002 2003 2004 2005 2006 2007 2008 2009 2010 2011 2012
in t
ho
usa
nd
b
arre
ls p
er d
ay
in m
. cu
bic
fe
et p
er d
ay
Offshore gas production (left axis) Offshore oil production (right axis)

KPMG PwC
56
Xx
History of gas prices in USD per million Btu
Source: BP, 2012
173. However, in the long run oil and gas prices, and thus investments in the corresponding infrastructure,
are not exclusively determined by production sources and technologies but rather by the demand for
these energy sources. Overall, a moderate increase in demand is expected with an average yearly
growth rate of 0.5 % for oil and 1.6 % for gas from 2010 to 2035. In total, the share of oil and gas in the
primary energy mix is predicted to fall from approximately 54 % in 2010 to approximately 51 % in 2035
(IEA, 2012).
174. In the chemical market MDT’s turbo machinery are especially used for the production of nitrogen based
fertilisers, and in petrochemical applications for the production of ethylene. The expected long-term
growth rates for the fertiliser and the petrochemical industries are shown in the following graph:
-
2
4
6
8
10
12
14
16
1996 1997 1998 1999 2000 2001 2002 2003 2004 2005 2006 2007 2008 2009 2010 2011
Japan (LNG) European Union USA

KPMG PwC
57
Xx
Development of the chemical industry 2011 – 2030 (production)
Source: VCI, 2013
175. Population growth and the establishment of a growing middle class in developing countries are the main
drivers of the chemical market. This development is also connected with the demand for energy. From
2009 to 2020, Brazilian, Chinese and Indian energy consumption is projected to grow on average by
3.2 % p. a, 3.6 % p. a. and 3.2 % p. a. respectively. Russia shows slower expected growth rates of 1.3 %
p. a. (EIU).
176. The competition for the SBU Turbomachinery is especially high for machinery used in the oil and gas
production due to an intensive price competition. According to company information, MDT’s market
share for oil and gas industry compressors is approximately 16 %. In other markets, e.g. the chemical
industry, MDT’s average market share is approximately 24 %. The main competitors in the turbo ma-
chinery market are General Electric Company, Fairfield/USA ("GE"), Siemens AG, Munich/Germany
("Siemens"), Dresser-Rand Group Inc., Houston/USA ("Dresser Rand"), Elliott - a brand of Ebara Corpora-
tion, Tokyo/Japan - Caterpillar and Mitsubishi Heavy Industries, Ltd., Tokyo/Japan ("MHI") (Source:
MDT). It is expected that the price pressure in the turbo machinery market will continue to rise due to
an increasingly intense competition.
1.8%
1.3%
0.4%
4.5%
3.2%
4.5%
0%
1%
2%
3%
4%
5%
Germany chemistry
(general)
Germany fertilisers Germany
petrochemicals
World chemistry
(general)
World fertilisers World petrochemicals
CA
GR
20
11
-2
03
0

KPMG PwC
58
Xx
e) Market positioning and competitive environment in the Renk division
Definition of the relevant markets
177. Across the four SBUs Vehicle Transmissions, Special Gear Units, Standard Gear Units and Slide Bearings,
Renk has a diversified range of applications of its products in various markets.
178. The SBU Vehicle Transmissions basically refers to the market for military equipment, and in specific the
market for tracked vehicles. The world market for military equipment is geographically limited due to
government restrictions on exports. Important markets are located in Europe and Asia.
179. The SBU Special Gear Units serves the market for military equipment with navy gear units, in particular
the market for marine ships. Additionally, turbo gear units are primarily used in the power industry,
most of all for conventional energy production. Gear units used in cement mills are manufactured for
cement mill constructors.
180. The SBU Standard Gear Units provides marine gear units especially for four-stroke engines used in the
civilian shipbuilding industry. In the recent past, especially the segment for LNG tankers gained impor-
tance. In addition, the SBU offers gears for offshore wind power plants with capacities from 5 MW,
turbo gear units and couplings.
181. Similar to the SBU Special Gear Units, the SBU Slide Bearings operates in the power as well as the elec-
trical engineering industry. Moreover, the bearings are also deployed in two and four-stroke engines for
ships.
Market for military equipment, especially tracked vehicles and naval vessels
182. According to analyses by the Stockholm International Peace Research Institute ("SIPRI") worldwide
defence expenditures stagnated in 2011, after having experienced a ten year continuous growth.7 How-
ever, the situation basically varies if looked at from a regional perspective. In North America and the
largest European markets (i.e. Germany, Great Britain, France), defence expenditures are generally de-
clining. In Southern Europe, military expenditure was also reduced due to the sovereign debt crisis. In
contrast, a positive market development is predicted for Russia and Eastern Europe since military
equipment, which was purchased during the Cold War, will be discharged and needs to be replaced by
modern equipment. Demand for military equipment is also expected to increase in the Middle East due
to the political situation and the on-going potential for conflict.
183. An increasing demand for military equipment is also expected in the Asia-Pacific region as in comparison
to western countries the region has a relatively high need for modernisation and is characterised by
territorial disputes.
7 On average by 4.5 % p.a. from 2001-2009

KPMG PwC
59
Xx
184. The trend to extend the useful life of military equipment works in the opposite direction. Amongst
others, this trend results from cost cutting measures, which are of special importance for the govern-
ments of countries that have been hit by the financial crisis. In part, these cost cutting measures have a
direct effect on the investment budgets for military equipment. However, these investment projects are
basically long term in nature and initiated based on strategic needs. Hence, fiscal constraints should lead
to the deferral of future investment projects rather than their complete cancellation.
185. The global market for tracked vehicles is – based on year 2011 – expected to shrink slightly by a total of
4.0 % until 2021 (IDC, 2011). A stronger decline is expected in the market for armoured infantry fighting
vehicles, where Renk offers a newly developed gear unit. This development is shown in the following
graph:
Worldwide development of the market for armoured infantry fighting vehicles (2011-2021)
Source: IDC 2011
186. The related decline in new orders should be partially offset by increasing revenues from after-sales
business (www.defenceweb.co.za, 2012). The development of a secondary market for older and used
tanks where countries offer their decommissioned models supports this development.
187. With regard to the market development for naval vessels it can be generally noted that requirements
towards the fleets have changed in past years. To this end, a development towards ever more flexible
actions and hence to smaller types of ships has taken place (AMI International, 2011). The market out-
look for gears for naval vessels (frigates, corvettes, speedboats, offshore patrol vessels ”OPV”) is funda-
mentally positive (AMI International, 2010). Growth potential is particularly seen in the OPV segment
(AMI International, 2011).
188. Due to geopolitical developments (e.g. the threat of piracy) as well as partially outdated fleets further
growth potential is identified in the Asia-Pacific region.
6.1
7.2 6.7
6.3 6.5 6.2
5.3 5.1 4.9 4.8 4.8
0.0
1.0
2.0
3.0
4.0
5.0
6.0
7.0
8.0
2011 2012 2013 2014 2015 2016 2017 2018 2019 2020 2021
in b
n.
US d
oll
ar

KPMG PwC
60
Xx
Market for energy production
189. Since the market for energy production is relevant to both, Renk and MDT, please refer to the respective
overview in paragraph C.II.2.d).
190. According to projections made by IEA, 2012, global production capacities will on average grow annually
between 2010 and 2035 with regard to fossil fuels by approximately 1.5 %, nuclear energy by approxi-
mately 1.9 % and hydropower by approximately 2.0 %, respectively.
Market for cement plants
191. The most important growth driver for cement plant construction remains economic and population
growth in developing and emerging countries and the associated demand of cement of the construction
industry. This is illustrated by the fact that over the last two decades, global cement consumption has
grown on average by 5.2 % p. a., whereas China’s cement consumption grew disproportionally higher by
an average of 10.5 % p. a.
192. In 2011, China was the largest buyer of cement, accounting for a share of 56 % of global consumption.
India followed with a share of 6.4 %, the USA with 2.1 %, Brazil with 1.8 % and Russia with 1.5 %.
193. Cement producers’ demand for new cement plants was rather moderate in 2011 and 2012 due to a shift
in investments caused by restrictive measures in the infrastructure and real estate sector (e.g. decline of
construction activity in China) as well as a weak economic development in many regions.
194. Following these past periods of comparably moderate growth, a positive outlook is expected for the
global cement market. However, depending on the respective source from which the data is retrieved a
wide range of annual growth rates from approximately 5 % to 10 % can be observed. For instance, the
cement plant supplier FLSmidth & Co. A/S, Valby/Denmark, expects an average growth rate of approxi-
mately 4 % to 5 % p. a. for the next years. Whereas a more optimistic estimate of an average growth
rate of 10.7 % p.a. is shown for the time period from 2011 to 2016 in the "Global Cement" study (Mar-
ketLine, 2012). According to Deutsche Bank AG, Frankfurt am Main (Deutsche Bank, 2012), the annual
growth rate is expected to range between 5.5 % and 6.8 % from 2013 to 2015.
195. It remains questionable, whether these comparably high growth rates will directly lead to investments
in new cement plants, since already established plants are not yet utilised to full capacity. According to
analyses by Deutsche Bank, in 2011 production capacity utilisation was at 75 % on a global level and at
81 % in China.
Market for civilian shipbuilding
196. The market for civilian shipbuilding as one of MDT’s core markets is already described in detail in Para-
graph C.II.2.d). With regard to Renk, sales volumes for ships with two-stroke engines are of minor impor-

KPMG PwC
61
Xx
tance, since gear units are typically not built into two-stroke engines due to low-rotation speeds; how-
ever, couplings and slide bearings are used.
197. The market for LNG tankers which is served by Renk with gears for diesel, gas and electric combination
propulsion systems is currently experiencing a temporary boom. This development stems from a grow-
ing demand for gas as source of energy. While this trend is predicted to persist throughout 2013, the
market is expected to be saturated in the medium term as a result of the significant build up in capacity.
Market for offshore wind power plants
198. Renk supplies gears for offshore wind power plants with a nominal capacity of at least 5 MW. The mar-
ket for offshore wind power plants differs from the onshore market as the technical installation and
commissioning of offshore plants is more complex. In the past, the development was affected by techni-
cal problems, missing grid infrastructure, restrictive financing as well as political uncertainties concern-
ing public incentives (dena, 2012). Nevertheless, offshore projects offer structural advantages when
compared to onshore projects because of more stable wind conditions as well as higher average wind
velocities.
199. Up to now, offshore plants predominantly were erected in the North and the Baltic Sea. It’s also Europe
where the highest growth rates are expected. In addition, the development of markets in America, Can-
ada, South Korea and Taiwan is expected. Tests are currently being carried out in China and Japan.
200. In principal, wind power plants can be designed with or without gears. As a consequence, Renk’s market
share depends on the extent to which technologies based on gears will be applied in the future. So far,
onshore plants are predominantly equipped with gears and offshore plants almost exclusively use gears.
Gearless offshore plants are a less tested concept (Energie und Technik, 2012). The biggest advantage of
plants with gears is a lower weight due to smaller generators as well as their compact design. Since most
large generators use permanent magnets, which require at current highly priced rare earths, they are
comparatively more expensive. However, the possibility that gearless plants will become more estab-
lished for offshore wind power plants cannot entirely be ruled out. Siemens, as well as GE have already
developed gearless offshore solutions.

KPMG PwC
62
Xx
201. Between 2010 and 2035, IEA expects an average annual increase of the installed capacity by 7.1 % (IEA,
2012). The growth forecasts for the most important regions are depicted in the following table:
Source: IEA, 2012
202. Whether or not aforementioned market forecasts can be translated into potential sales volumes for
wind turbine gear units depends on several factors: Firstly, the future demand for plants with gears and
secondly, the construction of offshore wind power plants with comparably large plant size. Within this
context, it has to be considered that to date time delays were rather common in the development of
offshore wind power plants. Furthermore, an increase in competition seems probable due to the high
degree of standardisation.
Wind power: Installed capacity CAGR
GW 2010 2015 2020 2025 2030 2035 2010 2035 2010-2035
World 198 390 586 760 924 1,098 3.8% 11.8% 7.1%
USA 40 68 93 117 140 161 3.7% 12.1% 5.7%
EU 85 134 182 222 257 288 9.3% 23.0% 5.0%
Japan 2 5 9 16 22 25 0.8% 7.1% 10.1%
Eas tern Europe/Euras ia 1 4 6 10 14 19 0.3% 3.4% 11.2%
China 45 123 200 254 293 326 4.5% 13.6% 8.3%
India 13 27 44 62 80 97 6.9% 12.0% 8.4%
Brazi l 1 4 9 12 13 15 0.8% 6.1% 11.6%
Middle Eas t 0 1 2 4 10 23 0.0% 5.2% 24.7%
% of total production

KPMG PwC
63
Xx
3. Net assets, financial position and results of operations
203. We conducted the analysis of consolidated net assets, financial position and results of operations on the
basis of MAN SE’s end of year financial statements, prepared in accordance with IFRS, for the fiscal years
2010 to 2012. The statements have all been audited and issued with an unqualified audit opinion.
a) Net assets and financial position
204. The consolidated balance sheets for the MAN Group prepared in accordance with IFRS as of reporting
date 31 December for the fiscal years 2010 to 2012, respectively, are displayed as follows:
Source: MAN SE
MAN Consolidated Balance Sheet as at 31 December
€ million 2010 2011 2012
Intangible assets 1,914 1,883 2,140
Property, plant and equipment 2,064 2,091 2,245
Equi ty-method investments 2,085 838 521
Financia l investments 51 1,251 1,702
Assets leased out 1,755 2,303 2,501
Noncurrent financia l services receivables 838 953 1,071
Deferred tax assets 1,159 1,078 1,335
Other noncurrent assets 180 226 237
Noncurrent assets 10,046 10,623 11,752
Inventories 2,852 3,513 3,373
Trade receivables 1,982 2,331 2,141
Current financia l services receivables 495 532 575
Current income tax receivables 133 117 58
Assets held for sa le 139 0 0
Other current as sets 713 596 652
Marketable securi ties 14 1 1
Cash and cas h equiva lents 1,057 957 1,366
Current assets 7,385 8,047 8,166
Assets 17,431 18,670 19,918
Subscribed capi ta l 376 376 376
Capi ta l reserves 795 795 795
Retained earnings 4,483 4,428 4,263
Accumulated other comprehens ive income 280 -71 116
Noncontrol l ing interests 56 62 69
Total equity 5,990 5,590 5,619
Noncurrent financia l l i abi l i ties 1,973 1,976 2,966
Pens ions and other post-employment benefi t 226 378 591
Deferred tax l iabi l i ties 849 724 958
Other noncurrent provis ions 653 709 684
Other noncurrent l i abi l i ties 722 951 1,106
Noncurrent liabilities and provisions 4,423 4,738 6,305
Current financia l l i abi l i ties 876 1,194 2,333
Trade payables 1,981 2,324 2,006
Prepayments received 762 823 908
Current income tax payables 534 623 147
Other current provis ions 1,465 1,485 1,166
Other current l i abi l i ties 1,400 1,893 1,434
Current liabilities and provisions 7,018 8,342 7,994
Liabilities 17,431 18,670 19,918

KPMG PwC
64
Xx
205. The intangible assets mainly compromise goodwill recognised in conjunction with acquisitions by the
MTB, ML und MDT divisions, capitalised development costs as well as licences, software and similar
rights. They increased from € 1,914 million as at 31 December 2010 to € 2,140 million as at 31 December
2012. As at the reporting date 2012, € 208 million were attributable to the goodwill resulting from the
increase in the shares in the former joint venture company MAN FORCE TRUCKS Private Limited,
Akurdi/India ("MAN FORCE TRUCKS"), now MAN Trucks India Private Limited, Akurdi/India ("MAN Trucks
India").
206. The increase in fixed assets from € 2,064 million as at 31 December 2010 by 8.8 % to € 2,245 million as
at 31 December 2012 is mainly due to investments for replacement and maintenance. In addition to
this, investments were made for growth-related reasons in capacity expansions for different locations as
well as in the development of new products and measures for quality improvements and efficiency in-
creases in production. The fixed assets as at 31 December 2012 include land and buildings amounting to
€ 1,010 million, production plant and machinery of € 764 million, other plant, operating and office
equipment of € 315 million as well as prepayments and construction in progress amounting to € 156
million. As at the 2012 reporting date, the fixed assets include investment property with a carrying
amount of € 20 million.
207. The investments comprise associated companies that are accounted for using the equity method as well
as financial investments. As at the 2012 reporting date, the investments mainly include the 25 % equity
interest in the associated company Sinotruk (€ 399 million according to the equity method), the 13.35 %
equity interest in Scania (€ 1,656 million) held as financial investment, as well as the 49 % interest in the
associated company RMMV (€ 75 million according to the equity method). Until the beginning of Janu-
ary 2011, the shares in Scania were accounted for using the equity method and thereafter were re-
corded as an available-for-sale financial asset in accordance with IAS 39. The decrease in the carrying
amount of investments amounting to € 47 million between 2010 and 2011 mainly reflects the lower fair
value of the investment in Scania at the end of 31 December 2011 compared with the carrying amount
as at 31 December 2010. The increase in investments of € 134 million between 2011 and 2012 mainly
reflects the higher fair value of the investment in Scania as at 31 December 2012 and the lower carrying
amount of equity-method investments. The decrease in carrying amounts (change of € -190 million for
Sinotruk and € -41 million for RMMV) was due to the impairment losses recognised on the investments
in Sinotruk and RMMV, as well as the change in the presentation of the shares of the former joint ven-
ture MAN FORCE TRUCKS, which was fully consolidated as at 31 December 2012.
208. Assets leased out increased from € 1,755 million as at the 2010 reporting date by € 746 million to
€ 2,501 million as at the 2012 reporting date. This resulted in particular from the initial consolidation of
two companies in fiscal year 2011 as well as a higher volume of sales with buyback obligations at MTB.
Assets leased out primarily relate to commercial vehicles which are leased on the basis of operating
leases or sold to customers with buyback options.

KPMG PwC
65
Xx
209. The current and noncurrent financial services receivables include finance lease receivables as well as
customer and dealer finance receivables. These increased from € 1,333 million as at 31 December 2010
by € 313 million to € 1,646 million as at 31 December 2012 mainly due to an increase of finance lease
receivables from € 1,050 million as at the 2010 reporting date to € 1,304 million as at the 2012 reporting
date.
210. Deferred tax assets arise in particular from obligations and other provisions, pensions and similar obli-
gations as well as corporate and trade tax loss carryforwards. As at 31 December 2010, the deferred tax
assets amounted to € 1,159 million and increased to € 1,335 million as at 31 December 2012.
211. The other current and noncurrent assets remained rather unchanged at the level of the 2010 reporting
date (€ 893 million), at € 889 million as at the 2012 reporting date. As at 31 December 2012, these as-
sets mainly included other tax receivables amounting to € 207 million, VAT receivables of € 165 million
as well as prepaid expenses of € 100 million.
212. The increase in inventories by 23.2 % to € 3,513 million as at 31 December 2011 as compared to the
previous year was mainly due to the increased business volumes in the two business areas Commercial
Vehicles and Power Engineering as well as partially increased stock-keeping periods. The subsequent
reduction by 4.0 % to € 3,373 million as at 31 December 2012 was mainly attributable to the reduction
in remaining Euro III vehicles, which had been accumulated in particular at ML at the end of 2011. Inven-
tories amounted to € 3,373 million as at 31 December 2012 and included work in progress and finished
products (€ 2,294 million), merchandise (€ 499 million), raw materials, consumables and supplies (€ 445
million) as well as prepayments (€ 135 million).
213. Trade receivables increased mainly due to volume-related factors, by 17.6 % from € 1,982 million as at
the 2010 reporting date to € 2,331 million as at 31 December 2011. The subsequent reduction by € 190
million to € 2,141 million as at 31 December 2012 was mainly due to the reduction in business volumes
in the Commercial Vehicles business area.
214. As at 31 December 2010, the 30 % interest in Ferrostaal Aktiengesellschaft, Essen ("Ferrostaal")
amounting to € 139 million, was reported as asset held for sale.
215. Cash and cash equivalents increased due to the nature of the business by € 309 million from € 1,057
million as at the 2010 reporting date to € 1,366 million as at the 2012 reporting date.
216. Despite positive net income of € 247 million, equity declined by € 400 million to € 5,590 million as at
31 December 2011 as compared to 31 December 2010. The reduction is mainly due to negative currency
translation differences (change of € -187 million) as well as an increase in actuarial losses on pensions of
€ 148 million. In addition, the development of equity was influenced by the agreements signed with
International Petroleum Investment Company, Abu Dhabi/U.A.E. ("IPIC"), and MPC Industries GmbH,
Hamburg ("MPC"), in connection with the disposal of Ferrostaal, and accordingly decreased net income.
KPMG PwC
66
Xx
As at 31 December 2012, equity increased marginally by approximately 0.5 % to € 5,619 million. This
development resulted from a positive net income of € 189 million and the increased fair value meas-
urement of the investment in Scania amounting to € 457 million recognised in other comprehensive
income. This increase was partially offset by dividend payments for fiscal year 2011 of € 342 million, a
decrease of the positive currency translation difference (€ -192 million) as well as the increase in actuar-
ial losses on pensions of € 146 million.
217. Current and noncurrent financial liabilities increased in fiscal year 2011 in comparison to the previous
year by a total of € 321 million, in particular due to an increase in bank borrowings. The increase in fi-
nancial liabilities by € 2,129 million to € 5,299 million as at 31 December 2012 resulted from the issu-
ance of new bonds.
218. The increase of pension obligations from € 226 million as at 31 December 2010 to € 591 million as at
31 December 2012 is mainly due to the application of comparably lower discount rates for the meas-
urement of provisions.
219. Tax liabilities (deferred tax liabilities and current income tax payables) declined from € 1,383 million as
at 31 December 2010 to € 1,105 million as at 31 December 2012. The decline reflects the additional tax
payments arising from the tax audit for the years 2002 to 2005.
220. The slight increase in other current and noncurrent provisions from € 2,118 million as at 31 December
2010 to € 2,194 million as at 31 December 2011 is mainly attributable to provisions of € 65 million that
were recognised on the basis of information obtained to date in connection with the investigation of
irregularities in the transfer of four-stroke marine diesel engines at MDT in fiscal year 2011. The de-
crease in other current and noncurrent provisions to € 1,850 million as at 31 December 2012 was mainly
due to a decline in miscellaneous other provisions for business risks amounting to € 186 million.
221. Other current and noncurrent liabilities increased from € 2,122 million as at the 2010 reporting date to
€ 2,844 million as at the 2011 reporting date and decreased in 2012 by 10.7 % to € 2,540 million. This
development is mainly due to the settlement of obligations entered into at the end of November 2011
in connection with the sale of Ferrostaal, as well as the concurrent settlement of the litigation with IPIC.
222. Due to volume-related factors, trade receivables increased by € 343 million to € 2,324 million as at the
2011 reporting date in comparison to the previous year. Due to the market-driven decline in production
volumes in fiscal year 2012, trade receivables decreased by € 318 million to € 2,006 million as at 31 De-
cember 2012, which represent levels close to fiscal year 2010.
223. Prepayments received increased due to the MAN Group’s business development from € 762 million as
at the 2010 reporting date to € 908 million as at the 2012 reporting date despite a lower level of order
intakes at MDT in fiscal year 2012.

KPMG PwC
67
Xx
b) Results of operations
224. MAN Group’s results of operations is displayed in the following table, based on MAN SE’s end of year
company financial statements, prepared in accordance with IFRS, for the fiscal years 2010 to 2012.
These statements have been audited and issued with an unqualified audit opinion.
Source: MAN SE
MAN Group Income Statement
€ million 2010 2011 2012
Revenue 14,675 16,472 15,772
Cost of goods sold and services rendered -11,400 -12,791 -12,499
Gross margin 3,275 3,681 3,273
Other operating income 516 622 540
Sel l ing expenses -1,095 -1,173 -1,181
Genera l and adminis trative expenses -741 -854 -950
Other operating expenses -1,142 -979 -877
Net income of financia l investments and equi ty-method
investments 470 -41 -182
Earnings before interest and taxes (EBIT) 1,283 1,256 623
Net interest expense -158 -134 -312
Earnings before tax (EBT) 1,125 1,122 311
Tax expense -338 -434 -122
Loss from discontinued operations -65 -441 0
Earnings after tax 722 247 189
of which attributable to noncontrol l ing interests 9 9 12
of which attributable to shareholders of MAN SE 713 238 177
Gross income margin 22.3% 22.3% 20.8%
EBIT margin 8.7% 7.6% 3.9%

KPMG PwC
68
Xx
225. Revenues increased in fiscal year 2011 in comparison to the previous year by 12.2 % to € 16,472 million
and subsequently reduced in fiscal year 2012 by 4.2 % to € 15,772 million. The revenues are divided
between the different divisions as follows:
Source: MAN SE
226. The Commercial Vehicles business area (MTB and ML) contributed significantly to the increase in reve-
nues of the MAN Group in fiscal year 2011 with an increase in revenues by 18.7 % from € 10,586 million
in fiscal year 2010 to € 12,563 million in fiscal year 2011. In fiscal year 2011 MTB accounted for € 8,984
million due to a revenue increase of 20.7 % in comparison to the previous year due to high order intake.
In fiscal year 2011, ML generated revenues of € 3,579 million and managed to increase revenues, par-
ticularly in the Brazilian market by 9.9 % from a total of 65,630 vehicles to 72,102 vehicles.
227. The reduction in revenues in the Commercial Vehicles business area in fiscal year 2012 by 6.9 % from
€ 12,563 in fiscal year 2011 to € 11,692 million resulted particularly from the introduction of the
PROCOVNE P-7 emission standard in Brazil (corresponding to Euro V) as well as the deterioration in the
economic situation in connection with difficult financing conditions for customers, which had a negative
impact on ML revenues. As a result of a weaker market for commercial vehicles in Europe, MTB’s reve-
nues declined by 1.8 % to € 8,822 million and were also below prior-year level.
228. Revenues in the Power Engineering business area (MDT and Renk) declined by € 170 million to € 3,999
million in fiscal year 2011. The decline was mainly attributable to a decrease by 4.1 % from € 3,766 mil-
lion (2010 fiscal year) to € 3,610 million (2011 fiscal year) at MDT. Despite an improved order intake,
MDT's revenues declined as a result of longer project throughput times and lower order intake from
previous years. The decrease compared with the prior year is mainly attributable to the Power Plants
SBU, which recorded € 190 million less revenue for billing reasons as projects with long throughput
times were billed in fiscal year 2010, increasing revenues by € 233 million to € 839 million as compared
to fiscal year 2009. The business volume in the SBU Engines & Marine Systems and the SBU Turbo-
machinery remained more or less stable. Revenue development at Renk was also impacted by long
Revenue by division
€ million 2010 2011 2012
MAN Truck & Bus incl . MAN Finance 7,446 8,984 8,822
MAN Latin America 3,140 3,579 2,870
Business area Commercial Vehicles 10,586 12,563 11,692
MAN Diesel & Turbo 3,766 3,610 3,780
Renk 403 389 476
Business area Power Engineering 4,169 3,999 4,256
Corporate Center/Consol idation -80 -90 -176
Revenue MAN Group 14,675 16,472 15,772

KPMG PwC
69
Xx
throughput times typical for large-scale gear unit construction. Despite of an increase in order intake,
revenues decreased by 3.5 % to € 389 million.
229. In fiscal year 2012, however, the Power Engineering business area generated revenue of € 4,256 million,
exceeding prior-year level by 6.4 %. This increase was mainly attributable to the MDT division, which
recorded revenue increases in the SBUs Turbomachinery and Power Plants resulting from deliveries for
the Chinese market as well as the delivery of several large dual-fuel engines for a power ship. The reve-
nue of the SBU Engines & Marine System remained below prior-year figures as a result of the tense eco-
nomic situation in the shipbuilding sector. In total, the MDT division increased its revenue by 4.7 % from
€ 3,610 million in fiscal year 2011 to € 3,780 million in fiscal year 2012. As a result of the positive devel-
opment of order intake, Renk increased its revenues in comparison to the previous year by 22.4 % to
€ 476 million in fiscal year 2012.
230. Cost of goods sold and services rendered increased in line with revenues in fiscal year 2011. As a result,
the gross margin recorded a profitability of 22.3 % following an increase of € 406 million. This corre-
sponded to the profitability of the previous year. In fiscal year 2012, cost of goods sold and services ren-
dered did not decrease to the same extent as revenues. The gross margin decreased by € 408 million
and profitability declined to 20.8 %. This development reflects the increasing pressure on prices MAN
Group, in particular MTB, faced in fiscal year 2012. The decrease in gross margin at MDT resulted from a
drop in licence business in the SBU Engines & Marine Systems as well as from effects from project-
specific provisions for plants under construction in the SBU Power Plants.
231. The composition of other operating income is displayed as follows:
Source: MAN SE
232. Other operating income mainly contains income generated by financing activities of MFI, which are
recorded as income from financial services. Also included are gains on financial instruments, which re-
sult from the remeasurement of foreign exchange positions and currency and interest rate hedges. The
increase of other operating income by 20.5 % in fiscal year 2011 in comparison to the previous year is
mainly due to the transfer of assets to the joint venture with Rheinmetall AG, Düsseldorf, which resulted
Other operating income
€ million 2010 2011 2012
Income from financial services 150 162 203
Gains from nonrecurring items - 111 -
Gains on financial instruments 115 101 57
Other trade income 50 34 44
Gains on disposal of property, plant, and equipment,
and intangible assets 10 14 6
Miscellaneous other income 191 200 230
Other operating income 516 622 540

KPMG PwC
70
Xx
in a nonrecurring earnings effect of € 111 million. In fiscal year 2012, other operating income decreased
to € 540 million and hence, was slightly above the level of fiscal year 2010.
233. Selling expenses grew more slowly than revenues, increasing by 7.1 % from € 1,095 million in fiscal year
2010 to € 1,173 million in fiscal year 2011 and were roughly on a comparable level at € 1,181 million
despite decreasing revenues in fiscal year 2012.
234. General and administrative expenses increased in fiscal year 2011 by 15.2 % from € 741 million in fiscal
year 2010 and by 11.2 % to € 950 million in fiscal year 2012 due to project-related matters and in-
creased personnel expenses. The number of employees increased within the respective period by
14.9 % from 45,693 to 52,481 in fiscal year 2012.
235. Other operating expenses mainly contain expenses for research and development, which were not
allocated to contract related production costs as well as expenses from financial services, impairment
losses on inventories and miscellaneous other expenses.
Source: MAN SE
236. The significant decrease in other operating expenses by 14.3 % to € 979 million in fiscal year 2011
resulted mainly from lower project-specific provisions in the SBU Power Plants as compared to the pre-
vious year. In fiscal year 2011, a total of € 72 million relate to losses from nonrecurring items and com-
prise € 65 million provisions in the MDT division which were recognised in connection with the investi-
gation of irregularities in the transfer of four-stroke marine diesel engines for possible on-board retrofit
solutions and for expenditures for specialists engaged in connection with the investigation. The remain-
ing € 7 million relate to cost commitments for the establishment of a job creation company at the now
insolvent printing press manufacturer manroland AG, Offenbach.
237. The net income from financial investments and equity-method investments in fiscal year 2010 resulted
mainly from reversals of impairment losses on the Scania investment in the amount of € 357 million,
resulting from improved economic conditions as well as from MAN's share of Sinotruk's net income, an
investment that is accounted using the equity method. In fiscal year 2011, the income from investments
declined significantly to € -41 million. This decline was mainly the result of the impairment loss of € 677
Other operating expenses
€ million 2010 2011 2012
Research and development -373 -390 -428
Impairment losses on inventories -94 -129 -94
Expenses from financial services -100 -90 -123
Losses from nonrecurring items - -72 -
Legal, audit and consulting costs -70 -57 -29
Losses on financial instruments -39 -52 -39
Bad debt allowances on receivables -84 -41 -67
Miscellaneous other expenses -382 -148 -97
Other operating expenses -1,142 -979 -877

KPMG PwC
71
Xx
million recognised on the Scania investment as well as the effect of the initial recognition of this invest-
ment at fair value and the related reclassification to financial investments, amounting to € 495 million.
The net income from financial investments and equity-method investments decreased to € -182 million
in fiscal year 2012, in particular due to impairment losses on the investments in Sinotruk (€ 190 million)
and on RMMV (€ 41 million). This decrease was offset by dividend income from the investment in Scania
amounting to € 60 million.
238. Earnings before interest and taxes decreased by 2.1 % in fiscal year 2011 and declined further by 50.4 %
to € 623 million in fiscal year 2012. It is divided between the divisions as follows:8
Source: MAN SE
239. The increase in EBIT in the MTB division in fiscal year 2011 from € 158 million in fiscal year 2010 by
€ 518 million is mainly due to increased sales volumes and is reflected to virtually the same extent in
gross profit. Besides decreasing sales volumes, which are accordingly reflected in gross profits, the sub-
sequent decrease of EBIT by € 503 million in fiscal year 2012 can additionally be attributed to a signifi-
cant increase in selling expenses.
240. The decline in revenues in the ML division by € 270 million from fiscal year 2010 to fiscal year 2012 was
partially offset by a reduction of selling expenses during the same period. Hence, EBIT declined by a
total of only € 133 million from fiscal year 2010 to fiscal year 2012.
8 In this respect, it should be noted that the performance measure for assessing and managing the performance of
a division as defined by MAN Group is operating profit which corresponds to EBIT adjusted for earnings effects
from purchase price allocations and nonrecurring items. The calculation of ROS, which is the ratio of operating
profit to revenue, is based on this earnings measure. The MAN Group aims for a ROS of 8.5 % +/-2 percentage
points.
Earnings before interest and taxes (EBIT) by division
€ million 2010 2011 2012
MAN Truck & Bus incl . MAN Finance 158 676 172
EBIT margin 2.1% 7.5% 1.9%
MAN Latin America 271 301 138
EBIT margin 8.6% 8.4% 4.8%
MAN Diesel & Turbo 439 395 437
EBIT margin 11.7% 10.9% 11.6%
Renk 52 53 66
EBIT margin 12.9% 13.6% 13.9%
Corporate Center/Consol idation 363 -169 -190
1,283 1,256 623MAN Group EBIT

KPMG PwC
72
Xx
241. The development of earnings (EBIT) in the MDT division is comparatively stable. A reduction in gross
profit from fiscal year 2010 to fiscal year 2012 was partially offset by lower other operating expenses.
Hence, EBIT declined by a total of only € 2 million from fiscal year 2010 to fiscal year 2012.
242. The increase in earnings (EBIT) by € 13 million in the Renk division in fiscal year 2012 was due to a sig-
nificant increase in revenues by € 87 million from € 389 million to € 476 million, which was reflected in
the improved gross profit.
243. The fluctuations in EBIT in Corporate Center/Consolidation are primarily due to changes in the result
from financial investments and equity-method investments (cf. note 237).
244. The results of fiscal year 2011 were particularly impacted by the results of the purchase price allocations
performed as part of the acquisition of ML in fiscal year 2009, which amounts to € -99 million as well as
from the interest in Sinotruk acquired at the end of 2009, amounting to € -10 million. In fiscal year 2012,
effects from purchase price allocations totalled € -110 million. Of this amount, € -91 million relate to ML,
€ -12 million to the joint venture with RMMV and € -7 million to the investment in Sinotruk.
245. Net interest expense includes net interest on pensions and interest payable on tax liabilities as well as
interest on bank balances and bank liabilities. The decrease in net interest expense by € 24 million in
fiscal year 2011 in comparison to the previous year mainly resulted from higher gains on the sale of se-
curities. The subsequent increase in net interest expense by € 177 million was mainly due to interest
expenses relating to additional tax payments arising from the tax audit for the years 2002 to 2005.
246. The tax expense increased in fiscal year 2011 in comparison to the previous year by 28.3 % to € 434
million. Correspondingly, the tax rate increased from 30.0 % in fiscal year 2010 to 38.6 % in fiscal year
2011, in particular due to prior-periodic taxes and valuations of financial investments that are not rec-
ognised for tax purposes. In fiscal year 2012 the tax expense decreased to € 122 million and the tax rate
increased to 39.2 % in particular due to the non-tax-deductible impairment losses on investments.
247. In fiscal year 2011, the loss from discontinued operations mainly included the agreements signed with
IPIC and MPC in connection with the disposal of Ferrostaal (€ -434 million). The remaining losses of € 7
million were due to the remeasurement of potential obligations from the corporate sale of manroland in
2006.
248. Throughout the historical period, net income decreased from € 722 million (2010) by a total of € 533
million to € 189 million (2012) due to the reasons set out above and in particular due to a decrease in
sales volumes with almost unchanged selling expenses and general and administrative expenses which
decreased to a disproportionately low extent.

KPMG PwC
73
Xx
c) Adjustment of the results of operations
249. In order to enable comparability of previous earnings with the company’s forecast figures, earnings have
to be adjusted for exceptional, one-off and/or items relating to other time periods. The following ad-
justments for the past three fiscal years have been applied by us for valuation purposes only:
Source: MAN SE
250. We identified the result from financial investments and equity-method investments as item to be ad-
justed for valuation purposes in the time period under review since they did not result from operating
activities of the consolidated companies.
251. With respect to the MTB division, the following earnings components were identified and adjusted for in
the relevant time period under review:
• MTB AG generated earnings of approximately € 4 million in fiscal year 2011, resulting from the ac-
quisition of individual sales companies in Belgium and France as well as the sale of shares in a joint
venture, which was recorded as other operating income.
• In relation to its past investment in the joint venture MAN FORCE TRUCKS, the MTB division re-
corded additional one-off expenses related to a claim waiver which totalled approximately € 7 mil-
lion in fiscal year 2011.
• The development and sales activities of wheeled military vehicles were combined in the newly
founded joint venture RMMV in fiscal year 2010. The production facilities of the Vienna plant were
Adjustments to the results of operations
€ million 2010 2011 2012
Earnings before interest and tax (EBIT) 1,283 1,256 623
Income from financia l and at-equi ty investments -470 41 182
MTB divi s ion
Resolution of Joint Venture MAN Region West B.V. -4
Cla im waiver on Joint Venture MAN FORCE TRUCKS 7
RMMV - deconsol idation effect from the contribution
of the production faci l i ties of the Vienna plant -111
MDT divi s ion
Valuation adjustment on accounts receivables aga inst
manroland 2
Provis ions for extraordinary factors 39 -88
Reserves in connection wi th investigation of
i rregulari ties in MDT's transfer of four-s troke marine
diesel engines (Project Poseidon) 65
Valuation adjustment on overdue cla ims at the
Danish branch 13
EBIT after adjustments 813 1,295 730
EBIT margin 8.7% 7.6% 3.9%
EBIT margin after adjustments 5.5% 7.9% 4.6%

KPMG PwC
74
Xx
therefore integrated into the joint venture at the end of 2011. An amount of € 111 million resulting
from this deconsolidation and the simultaneous acquisition of 49 % of the activities contributed by
Rheinmetall to the joint venture were recorded as other operating income.
252. With regard to the MDT division, the following exceptional and one-off income items were identified
and correspondingly adjusted for.
• In connection with the insolvency of the formerly associated company manroland, claims in the
amount of € 2 million were written down in 2011 which mainly comprised reimbursements of costs
for the training centre and energy supplies.
• In addition, as at 31 December 2011 provisions for extraordinary factors in the amount of € 39 mil-
lion were recognised. In the following year provisions for extraordinary factors amounting to € 88
million were released to income.
• Provisions in the amount of € 65 million were recognised in connection with the investigation of
irregularities in MDT’s transfer of four-stroke marine diesel engines in fiscal year 2011.
• At the Danish branch of MDT SE, overdue claims in the amount of € 13 million referring to Chinese
customers were written off in fiscal year 2012.
4. Major success factors of the MAN Group’s business model
Commercial Vehicles business area (MTB and ML divisions)
253. In the market and competitive environment that has been described, the business area Commercial
Vehicles demonstrates a number of strengths and opportunities:
• High reputation of the MAN brand, in particular in Europe.
• Introduction of the MAN brand to Brazil and Latin America with planned localisation from 2014,
opening up additional potential in the heavy duty area.
• Significant market share of the truck and bus divisions, both in the domestic market in Germany as
well as in Brazil.
• Established modern technologies and a broad service portfolio.
• Market developments in developing and quickly developing countries could positively influence the
sales potential for quality high-value MTB and ML products in the medium- to long-term; by way of
the investment in Sinotruk and the subsidiary MAN Trucks India MAN Group is present in the antici-
pated growth markets China and India.
KPMG PwC
75
Xx
• ML’s ‘Consórcio Modular’ business model, in which the partners are also suppliers and investors,
allows less capital to be employed and lowers investment needs.
• Extension of after sales operations, e. g. increasing the availability of replacement parts reduces the
inoperative time of the customer’s vehicles and thereby increases customer satisfaction and loyalty.
• Expected synergy effects resulting from the close cooperation with Volkswagen AG and Scania, in
particular in the areas procurement, manufacturing as well as research and development.
• Regulatory environment with regard to further development of emission standards
(EURO/PROCONVE) regularly leads to MAN’s customers exchanging their fleets ahead of time.
254. On the other hand, the following weaknesses and risks are faced:
• Due to considerable cyclicality of the business area Commercial Vehicles economic fluctuations and
shrinking core markets have significant impact on the business development.
• Heavy fluctuations in capacity utilisation of production plants due to economic fluctuations leads to
elevated uncertainty with regard to fixed-cost-coverage.
• Significant build-up of overhead at MTB in the recent past; margin improvement relies on respective
volume increases and realisation of savings potentials.
• Production plants predominantly located in high-wage countries; the current MTB vehicle portfolio
is particularly centred on modern industrial nations (in respect to equipment and quality).
• Vendors from the Asian market may make inroads into the core market in Europe and hence, in-
crease the already substantial levels of competition in Europe.
• The market share in Latin America may be impacted by price pressure and increasing competition as
well as an incomplete product portfolio with regard to the truck segment from 3.5 to 5 t.
• Sales risks in Russia due to the introduction of the ” utilization fee” which may make the import of
trucks to the Russian market unattractive.
• Current liquidity position of MAN Group (negative cash flow from the 2012 business activities) limits
the scope for larger investment prospects in the business area Commercial Vehicles; potentially re-
sulting investment backlog could prove to be a competitive disadvantage in the medium to long-
term.
Power Engineering business area (MDT and Renk divisions)
255. In the market and competitive environment that has been described, the business area Power Engineer-
ing demonstrates the following strengths and opportunities:

KPMG PwC
76
Xx
• High reputation of the MAN and Renk brands, in particular due to longstanding expertise and long-
term customer relationships.
• Market-leader in the field of two-stroke engines and in Renk’s field of tracked vehicle transmissions,
as well as high market share in the remaining business areas.
• Diversified and promising future product and services portfolio, in particular dual-fuel diesel and gas
engines as well as engines that can be operated with gas only; in addition, technological leadership
with special gears from Renk.
• Expanding after sales activities with worldwide service and sales presence.
• Positive influence of the increasing energy consumption in developing and emerging countries as
well as developing prosperity with a need of decentralised energy supply. The expected growth of
the middle class in the developing and emerging countries ensures the demand for products that
are produced by using MDT’s turbomachinery, particularly in the chemical industry sector.
• The increasing globalisation, population growth and the related increase in world trade are drivers
of a medium-term recovery in the shipping market.
• The trend for stronger environmental protection in combination with increasing energy prices leads
to demand for more efficient engines (lower emissions at lower fuel consumption).
256. On the other hand, the following weaknesses and risks are faced:
• Maintaining and respectively improving the technological competitiveness in the engines business is
associated with high capital investments in new product developments.
• Currently low levels of capacity utilisation in the SBU Engines & Marine Systems and high fixed costs.
• Turnkey projects in the SBU Power Plants are accompanied by increased project risks.
• Medium term overcapacity in the shipping market (2013 and 2014) and corresponding risks from
continuing market weaknesses.
• Intensification of competition and entry of new competitors from the Asian market as well as risks
from increasing product piracy.
• Renk has a dependency on a few large customers, whose large-scale projects can be delayed or
stopped. In the military field, the business is mainly dependent upon export permits from the Ger-
man federal government.
• Impact of fiscal and sovereign debt crisis on the real economy results in lower consumption com-
bined with weaker global trade.

KPMG PwC
77
Xx
D. Determination of equity value
I. Basis for valuation
1. Valuation approach and assumptions
257. The following section provides an overview on the methodological approach for the determination of
the equity value of MAN SE. The equity value comprises the fair value of the operating business derived
using the dividend discount method, the fair value of non-operating assets as well as any other assets
that were valued separately (special value items).
258. The valuation object is MAN SE, including its subsidiaries and associated companies. For the purpose of
this valuation, we assumed that the business subject to valuation will continue as a going concern in the
future. MAN SE’s equity value pursuant to the dividend discount method has been determined on the
basis of its consolidated financial forecasts according to IFRS.
259. For the determination of the equity value using the dividend discount method, projections for a detailed
planning period (Phase I) as well as subsequent periods (Phase II; terminal value) are required. Phase I
comprises a period of five fiscal years from 2013 to 2017. These projections are based on the company’s
forecasts for the fiscal years 2013 to 2017, which we previously assessed on the basis of actual figures
for the fiscal years 2010 to 2012 in order to determine their plausibility. For this purpose, extraordinary
and non-recurring items as well as items that relate to other time periods in the company’s income
statement were identified for the fiscal years 2010 to 2012. Subsequently, these items were adjusted in
order to derive a normalised EBIT for the fiscal years 2010 to 2012 (cf. note 249 et seqq.). A further as-
sessment of the plausibility of the assumptions underlying the planning was based on the planning
documentation and information provided by the company as well as external industry and market data.
For Phase II an expected long-term average EBIT is assumed. This pertains the periods as of the fiscal
year 2018. Actual results for each fiscal year from 2018 onwards can and will deviate from this average
EBIT.
260. The consolidated financial planning figures include all consolidated affiliated companies. The consoli-
dated financial planning figures are depicted and explained in more detail in section D.II.1. In addition,
MAN SE has several direct and indirect investments in companies that are not subject to consolidation.
We separately considered the associated investment income as a part of MAN SE’s income of invest-
ments.
261. All expected synergy potentials from a closer cooperation with Volkswagen AG and Scania, which may
be leveraged irrespective of the execution of the domination and profit and loss transfer agreement
("pseudo synergy effects"), are fully reflected in the financial forecasts. In contrast to pseudo synergy

KPMG PwC
78
Xx
effects, the synergy potentials, which can only be realised in case of a domination and profit and loss
transfer agreement ("real synergy effects"), are neither included in the financial planning figures nor
relevant for this valuation. Of the expected synergy effects of approximately € 200 million p. a. gener-
ated on Volkswagen AG-group level, sustainable pseudo synergy effects attributable to MAN SE amount
to approximately € 125 million p. a. These arise primarily from material cost savings and economies of
scope from joint purchasing.
262. The starting point for the dividend discount method is the derivation of future EBIT of MAN SE. In order
to determine distributable earnings based on the EBIT of MAN SE we next derived and considered the
income from investments and the net interest result.
263. MAN SE’s net interest result for the planning periods was derived using an integrated financial model,
which is based on income statements and balance sheets for each year of the financial planning. In ac-
cordance with general valuation principles, the distribution policy for Phase I is assumed to be congru-
ent with the financial planning figures of MAN SE.
264. Subsequently, corporate income taxes as well as personal income taxes of the owners were deducted
from the projected pre-tax income. Corporate income taxes include foreign income taxes as well as for
domestic income the applicable German trade taxes, corporate income taxes and the solidarity sur-
charge. Some of the companies comprised in the MAN group exhibit substantial tax loss carryforwards.
To the extent to which these tax loss carryforwards can be utilised, the respective amounts were con-
sidered as tax deductions for the derivation of income taxes. Noncontrolling interests of the MAN
Group’s subsidiaries were deducted from earnings after taxes. The earnings after noncontrolling interest
are available to MAN SE’s shareholders. The earnings distributable to the MAN SE shareholders were
discounted to the valuation date in order to obtain MAN SE’s equity value according to the dividend
discount method.
265. The MAN Group has non-operating assets consisting of land and buildings. In our valuation, non-
operating assets were not considered with their respective income. Instead, these assets were valued
separately and added to the equity value of the operating assets. For valuation purposes we notionally
assumed a disposal of non-operating assets. The earnings attributable to shareholders from the disposal
of these assets were assumed to be generated at the valuation date. In addition, MAN SE has of a corpo-
rate income tax credit, which was considered as a special value item. The corporate income tax credit
will be recovered throughout the planning period through disbursements from the financial administra-
tion. Hence, the associated cash flows were discounted to the valuation date.
266. For the purpose of our valuation we did not consider any diluting effects from contingent capital. Ac-
cording to the information provided there are no financial instruments outstanding, which could lead to
a dilution of the share capital.

KPMG PwC
79
Xx
267. The relevant valuation date for the determination of the equity value of MAN SE is 6 June 2013. On this
day the general shareholders’ meeting of MAN SE shall approve the domination and profit and loss
transfer agreement.
268. Consequently, all of MAN SE’s cash flows that will accrue after 6 June 2013 (including the entire cash
flows of the current fiscal year 2013) have to be taken into account for the valuation. The technical
valuation date is 31 December 2012. All projected earnings were discounted to this technical valuation
date. The equity value determined for 31 December 2012 was subsequently compounded to 6 June
2013. The equity value as of 6 June 2013 served as the basis for determining the appropriate cash com-
pensation and the appropriate recurring compensation payment.
2. Forecasting procedure and accuracy
Preliminary remarks
269. The uncertainty of future expectations must be considered when estimating future earnings. Both, risks
and opportunities must be considered equally. Earnings in the past may provide an initial guidance.
270. The analysis of the past fiscal years, as well as the adjustment of selected positions of the income state-
ment of the company, serves the purpose of enhancing the assessment of basic assumptions underlying
the financial planning.
271. In the course of the retrospective analyses, adjustments were made for extraordinary and non-recurring
income and expenses as well as those that relate to other periods. These adjustments have no effect on
the determination of the equity value as the valuation result is based on projections of future fiscal
years. Any adjustments to results of past periods merely serve information purposes and the assess-
ment of the plausibility.
Forecasting procedure
272. The financial planning of MAN SE comprises projected income statements, cash flow projections and
projected balance sheets, prepared in accordance with IFRS. The detailed planning period covers the
time period from 2013 to 2017.
273. The financial planning is part of the regular internal planning and reporting process of MAN SE. Gener-
ally, a long-term financial planning covering the upcoming five fiscal years is prepared in the course of
the strategic planning process by the end of the second quarter of each fiscal year. In September 2012,
the financial planning figures were, for the first time, submitted to Volkswagen AG by the executive
board of MAN SE to be included within the group planning process of Volkswagen AG ("planning round
for the fiscal years 2013 to 2017", in brief “PR61").

KPMG PwC
80
Xx
274. A more detailed budget, covering a three-year period, ("Unternehmensplanung", in brief "UPL") is
subsequently prepared in the fourth quarter of each fiscal year. The UPL for the fiscal years 2013 to
2015 was finalised in November 2012.
275. For the respective current fiscal year, quarterly updates are prepared, based on the latest business
developments. The update for the fiscal year 2013 was prepared within the context of the "Rolling Fore-
cast", in brief "RFC1" in the first quarter, and adopted at the end of March 2013.
276. Thus, the financial planning figures underlying the valuation consist of the RFC 1 for the fiscal year 2013,
the UPL for the fiscal years 2014 and 2015 and the PR61 for the fiscal years 2016 and 2017.
Forecast accuracy
277. We have conducted our analysis of the forecast’s accuracy with respect to revenues, gross margin and
EBIT. In this context, we identified the most important deviations between planning and actual figures.
An overview of the comparison is presented in the following table. Please note that actual figures before
adjustments are displayed.
Source: MAN SE, PwC/KPMG-Analysis
2010
278. Due to an unexpectedly strong economic recovery in 2010, which followed the extraordinarily strong
economic decline of the year before, revenues increased much more than originally projected. This de-
velopment was supported primarily by the increased global demand for commercial vehicles. As a result,
the business area Commercial Vehicles recorded a significant increase in revenues of approximately
36 %, which had not been anticipated to this extent. Especially in the ML division the forecast was ex-
ceeded. The positive impact of the economic recovery on MTB’s actual revenues and EBIT was also
much greater than expected. In the MDT division, the forecast was exceeded by approximately 8 % due
to an increase in demand in the SBU Engines & Marine Systems, particularly for two-stroke engines.
Likewise, the higher gross margin of the company in the fiscal year 2010 is the result of the unexpected
strong recovery in the commercial vehicles market. Regarding EBIT, a write-up of the investment in
Scania, amounting to € 357 million, led to an additional positive deviation from the original forecast.
2011
279. The business development in 2011 was driven by the continued and unexpectedly strong recovery in the
global economy. MTB budgeted revenues at the same level as the previous year due to uncertainties
Planned/actual data MAN Group
Deviation from 2010 Deviation from 2011 Deviation from 2012
€ million 2010E 2010 abs. % 2011E 2011 abs. % 2012E 2012 abs. %
Revenue 12,383 14,675 2,292 18.5% 15,069 16,472 1,404 9.3% 17,383 15,772 -1,611 -9.3%
Gross margin 2,568 3,275 707 27.5% 3,321 3,681 360 10.8% 3,963 3,273 -690 -17.4%
EBIT 403 1,283 880 218.0% 958 1,256 298 31.1% 1,463 623 -840 -57.4%

KPMG PwC
81
Xx
arising from the financial and economic crisis. However, MTB was able to increase its revenues by ap-
proximately 19.8 %. Due to new emission standards, customers unexpectedly pulled forward a large
amount of their investments resulting in further demand and causing that the revenues in the ML divi-
sion were clearly exceeded in 2011. In the MDT division revenues showed a positive deviation of ap-
proximately 3 % against budgeted levels. Overall, a less favourable development in the SBU Power
Plants was compensated by a clear improvement in the SBU Engines & Marine Systems. Due to higher
than expected revenues, a gross margin in line with planning assumptions as well as relatively moderate
increases in overhead costs, the group-wide EBIT exceeded budgeted figures.
2012
280. The fiscal year 2012 was characterised by a downturn in the market environment, caused among other
reasons by the on-going sovereign debt crisis, which had not been accounted for in the forecasts on
such a scale. Against this background, MTB exhibited a negative deviation in revenues of approximately
13.0 %, which was primarily attributable to lower sales volumes in Europe. In its budget, ML had under-
estimated the impact of the accelerated purchases in 2011 because of the new emission standard. Thus,
ML showed a negative deviation of 8.0 % against budgeted revenues. For MDT, revenues in 2012 were
close to the budgeted figures, although minor shifts occurred at the level of the individual SBUs. The
lower than expected gross margin resulted from the fact that costs could not be adjusted to the same
extent those revenues had decreased compared to the previous year. The group-wide EBIT was 57.4 %
below projections, which can mainly be ascribed to the MTB division. Lower margins, lower capacity
utilisation in the plants as well as an increase in selling and administration expenses ratios adversely
affected earnings, as additional personnel was hired especially in the areas sales, services, research and
development and quality assurance to account for expected future revenue growth.
281. The analysis of the planning accuracy shows that the planning processes have become more difficult due
to the volatile economic conditions since the beginning of the financial and sovereign debt crisis. The
majority of deviations between the company's actual and forecast figures can be attributed to unfore-
seeable or difficult to predict market developments, which were mainly caused through a variety of
exogenous economic factors However, taking the elements of uncertainty currently prevailing in the
markets as well as the detailed planning procedure that is based on the assessment of the persons re-
sponsible for the planning into account, we deem MAN Group’s financial forecasts to be a suitable basis
for valuation purposes despite of the deviation described above.

KPMG PwC
82
Xx
II. Financial projections
1. Financial planning of earnings before interest and taxes (EBIT)
a) Financial planning of the MAN group
282. The consolidated financial planning figures at MAN Group level for the period until the fiscal year 2017 is
displayed below:
Source: MAN SE
283. Revenues are expected to increase throughout the planning period from € 15,772 million in 2012 by
€ 6,266 million to € 22,039 million in 2017. This is primarily attributable to a planned increase in revenue
in the business area Commercial Vehicles, which contributes more than 80 % of the total revenue
growth. The MTB division expects an increase of revenues of almost 30 % or € 2,538 million in the plan-
ning period. The ML division also contributes a significant part to the revenue growth bearing in mind
ML’s plans to almost double revenues from € 2,870 million in 2012 to € 5,528 million in 2017. The ex-
pected revenue increase at MDT over the same period is approximately 32 % or € 1,220 million. The
revenue of the Renk division is expected to increase from € 476 million in 2012, by € 117 million (25 %),
to € 593 million in 2017. For the detailed planning assumptions underlying these projections on division
level we refer to the sections below.
284. MAN SE expects an increase in consolidated gross profit at the group level throughout the planning
period by € 1,909 million from € 3,273 million in 2012 to € 5,182 million in 2017. The planned improve-
ment of the gross margin over the same period, from 20.8 % in 2012 to 23.5 % in 2017 results from a
less than proportional increase in cost of goods sold compared to revenues across all divisions. The larg-
est absolute and relative improvement of the gross margin is expected for the MTB division. This is
mainly attributable to the planned reduction in cost of materials alongside improvements in the pro-
MAN Group Income Statement
€ million 2012 2013E 2014E 2015E 2016E 2017E
Revenue 15,772 15,799 17,805 19,658 20,779 22,039
Cost of goods sold and services rendered -12,499 -12,471 -13,891 -15,233 -15,991 -16,856
Gross margin 3,273 3,327 3,914 4,425 4,788 5,182
Other operating income 540 354 499 517 559 576
Sel l ing and genera l and admini strati ve expenses -2,131 -2,138 -2,183 -2,201 -2,187 -2,193
Other operating expenses -877 -987 -1,255 -1,374 -1,425 -1,500
Earnings before interest and taxes (EBIT)* 805 557 975 1,367 1,735 2,065
Revenue growth rate -4.2% 0.2% 12.7% 10.4% 5.7% 6.1%
Cost of goods sold ratio 79.2% 78.9% 78.0% 77.5% 77.0% 76.5%
Gross income margin 20.8% 21.1% 22.0% 22.5% 23.0% 23.5%
Selling and general and administrative expenses ratio 13.5% 13.5% 12.3% 11.2% 10.5% 10.0%
EBIT margin* 5.1% 3.5% 5.5% 7.0% 8.3% 9.4%
EBIT margin after adjustments 4.6%
* EBIT does not include income from investments .

KPMG PwC
83
Xx
curement process, plus an improved integration of the production, development and procurement de-
partments as well as a higher utilisation of the production facilities. The expected improvement of ML’s
gross margin also contributes to the disproportionally high increase of the gross profit at the group
level.
285. For other operating income an increase of 6.8 % is expected throughout the planning period, from
€ 540 million in 2012 to € 576 million in 2017. The observable developments within the different divi-
sions compensate each other to a large extent.
286. For selling and general and administrative expenses, an increase is expected from € 2,131 million in
2012, to € 2,193 at the end of the planning period. In total, a less than proportional increase compared
to the increase of revenues until 2017 is assumed. Main driver for this development will be a tighter cost
management as well as regressively planned new hires in specific with regard to MTB. An adjustment of
the number of selling and administration staff is targeted to ensure the competitiveness in comparison
to direct competitors.
287. Other operating expenses are expected to increase from € 877 million in 2012 by € 623 million to
€ 1,500 million in 2017 or. Nearly half of the planned increase is attributable to the MTB division, where
it mainly results from directly expensed development costs.
288. Particularly due to the less than proportional increase of projected expenses in comparison to revenues,
it is expected that earnings will increase significantly and that the EBIT margin (without income from
investment) will improve accordingly. MAN SE’s management expects an improvement of the EBIT mar-
gin from 5.1 % in 2012 to 9.4 % in 2017, which equates to an EBIT margin improvement of more than
80 %.
289. Taking into account the increasingly intensive competition, we consider the financial planning figures for
the fiscal years 2013 to 2017 at the MAN Group level to be distinctly ambitious but still feasible.
Whether or not projected results will materialise in the fiscal years 2013 to 2017 is mainly dependent on
the ability to realise costs of material savings, the successful implementation of a reduction in overheads
(especially in the administration and sales departments), an increase of the capacity utilisation in the
production facilities of MTB and ML as well as a sustainable economic recovery in particular in MTB’s
core markets.
b) Financial planning of MAN Truck & Bus
290. MTB’s key figures for the fiscal years 2013 to 2017 - compared to the adjusted figures of the fiscal year
2012 - are as follows:

KPMG PwC
84
Xx
Source: MAN SE, MTB AG
Business development
291. Following a reduction in the European market volume in 20129 for trucks over 6 t to approximately
274,000 units (2011: approximately 301,000 units), MTB expects a further decline to approxi-
mately 271,400 units in 2013. For the remaining planning years a moderate growth of the European
market is expected. The growth mainly represents a recovery of the European truck market, which has
been severely affected by the financial and sovereign debt crisis. Stronger growth is expected from 2015
onwards.
292. The expected market recovery is characterised by broad growth in all European regions. The highest
growth rates are, however, expected for countries that have been heavily affected by the crisis such as
Italy and Greece, and for Eastern European countries. For 2017 MTB expects a market volume of
322,000 units for trucks over 6 t based on an extrapolation for the years 2015 to 2017. The market vol-
ume expected by MTB is below LMC Automotive’s forecast. The main reasons are lower growth expec-
tations for Southern European countries like Italy and Spain, but also for Germany and France. With
regard to the Southern European markets, LMC Automotive's forecast assumes a recovery to pre-crisis
levels by 2015. However, from today's perspective, this is associated with a high degree of uncertainty.
Taking into account that the first few months of fiscal year 2013 have shown only moderate growth for
MTB, a market recovery to any significant extent - as forecast by LMC Automotive - is yet still highly
uncertain from MTB’s perspective.
293. Compared to long-term averages, we regard MTB’s forecasts for Germany and France as reasonable.
Considering the historically high accuracy of MTB’s market forecasts, we regard MTB's overall market
forecast as appropriate.
294. After a decrease of MTB’s market share for trucks over 6 t to 17.0 % (2011: 17.9 %), MTB is planning to
increase its market share gradually to 18.0 % by 2015. The decline in 2012 was mainly due to the aggres-
9 Compared to LMC Automotive (see Section C.II.2) MTB uses a slightly different definition of the European region
to report market volume.
MAN Truck & Bus incl. MAN Finance
CAGR
€ million 2012 2013E 2014E 2015E 2016E 2017E 2012 - 2017
Revenue 8,822 8,889 9,870 10,500 10,900 11,360 5.2%
Depreciation and amortisation 231 263 271 309 326 343 8.2%
Capi ta l expendi tures 640 406 541 576 601 625 -0.5%
EBIT* 230 257 433 573 747 952 32.8%
EBIT margin* 2.6% 2.9% 4.4% 5.5% 6.9% 8.4%
Employees 34,879 34,446 33,779 33,788 33,524 33,265 -0.9%
* EBIT does not include income from investments .

KPMG PwC
85
Xx
sive market presence of competitors. In 2012, Mercedes-Benz was able to gain market share - among
other factors - due to the launch of the second generation of the Actros at the end of 2011. In addition,
competition is increasing from the mid-class segment through market players such as DAF Trucks N.V.,
Eindhoven/The Netherlands ("DAF"), whose products are increasingly being seen as an appropriate al-
ternative by customers. To win back market share MTB is accelerating technical innovations and imple-
menting a stronger customer focus. Until the planned launch of the new heavy series, the existing prod-
uct ranges will be continuously enhanced by the staged introduction of technical improvements in order
to increase their attractiveness for customers. Moreover the sales force will be reoriented towards a
stronger customer focus, and the range of supporting services will be steadily expanded and improved.
This includes a suitable range of financing solutions, to be marketed by MFI, and intended to support the
growth in new vehicle sales.
295. Outside Europe, Russia is the largest and most important single market for MTB. However, due to the
utilization fee introduced on 1 September 2012 the forecast for the Russian market is currently highly
uncertain. As long as the utilization fee will continue to be applied for importers only, MTB assumes that
in the medium term the requirements to avoid the utilization fee can be met by increasing the localisa-
tion of the production. Based on the currently high level of uncertainty, MTB has forecast a decrease in
sales in Russia for 2013. For the following years, it is assumed that the potential of the Russian market
will be accessible to MTB. Another relevant market for MTB is Turkey. Until 2017 an average annual
growth rate comparable to market expectations for Turkey was considered in the planning. Other
growth markets are Brazil and the Middle East. For the Middle East an average annual growth in double
digit percentages is planned. Important sales markets in the Middle East are Saudi Arabia, the United
Arab Emirates and Oman. For the CLA series the most important sales market is India, for which, for the
years 2013 - 2017, constant sales volumes have been assumed.
296. The intense competition in the European truck market, as well as the partly difficult economic condi-
tions on the demand side, cause that increases in costs can only be partly passed on to customers and
must therefore amongst others be compensated by efficiency gains to avoid a decrease of the operating
margin. Significant price increases are therefore only expected in 2014 due to the compulsory introduc-
tion of the Euro VI standard. From 2015 onwards, MTB assumes considerably smaller price increases.
297. The sales volumes in the European bus market also declined in 2012 to approximately 26,000 units
(2011: approximately 29,000 units). Given the dependency on public spending, the financial and sover-
eign debt crisis also affected the bus market. MTB expects a recovery of the bus market to approxi-
mately 30,500 units in 2017. This expectation is slightly above the market forecast by Analyse & Prog-
nose, 2012. The expected market growth results on the one hand from a recovery of Southern European
countries that were severely hit by the financial and sovereign debt crisis such as Italy and Spain, as well
as the recovery of Eastern European countries such as Bulgaria, Romania, Czech Republic or Poland,
whose market volumes have fallen sharply since the peak year in 2008. On the other hand, the major

KPMG PwC
86
Xx
Western European states such as Germany, France and Great Britain will also be contributing to the
expected growth.
298. The combined market share of MAN and NEOPLAN for buses over 8 t was 12.6 % in 2012 (2011: 13.6 %).
Especially Mercedes-Benz and the VDL Bus & Coach bv, Valkenswaard/The Netherlands, gained market
share in 2012. One reason for the slight decrease in MTB's market share was the launch of the second
generation of the Citaro city buses by Mercedes-Benz. For the planning period MTB expects they will be
able to sustain their market share at 12.7 %. As the market share of MAN and NEOPLAN is below 10 % in
the growth regions of Southern and Eastern Europe, this implies an increasing market share in these
markets. The continuous update of the product range, for example, the launch of a new generation of
the "Jetliner" series, which was presented in mid-2012, is supposed to contribute to this increase.
299. Major bus sales markets outside Europe are Russia, South Africa, Mexico and Asia (e. g. Hongkong,
Malaysia, The Philippines and Singapore). A modest growth is expected in these markets. In many non-
European markets bus chassis and bodywork are regularly built separately. As MTB predominately acts
as an integral bus manufacturer, MTB can utilise the growth in these markets only to a limited extent. In
addition, the MAN and NEOPLAN buses, which belong to the premium segment, are often too expensive
for growth regions like India. Furthermore, requirements found in tenders (e. g. a partly localised pro-
duction), often impede the market entry for MTB.
300. Due to the high competition in the market for busses and orders often awarded through tenders, price
increases are hard to achieve in the bus business. Hence, in total the volume effect outweighs the price
effect considerably with regard to the revenue planning. As opposed to the truck market, for buses only
minor price increases are expected from the introduction of the Euro VI standard.
301. For the other business units (used vehicles, after-sales as well as engines and components), constant
growth in line with the expected increase in sales for new trucks and buses is expected for the planning
period.
302. The used vehicle business primarily supports new vehicle sales, and is used to resell financed vehicles or
vehicles sold with a buy back obligation. Similarly to the new vehicle business, the used vehicle business
is also volatile throughout the economic cycle. For the planning years MTB therefore assumes growth
rates linked to the expected development of the new vehicles business.
303. The after-sales business is set to be continuously expanded over the coming years. Different initiatives
have been identified to optimise the after-sales business, some of which have already been imple-
mented. These include an expansion of after-sales services across Europe, an extension of the portfolio,
more attractive pricing, as well as training and incentivising of employees. For the planning period an
average growth rate of 2.7 % is expected.

KPMG PwC
87
Xx
304. MTB also plans to actively expand the engine and component business. Significant drivers for the ex-
pected growth are the industrial and agricultural as well as the onroad business, meaning the installa-
tion of engines in trucks and buses. Based on 2012, a compounded annual growth rate of 4.6 % is ex-
pected until 2017.
305. Overall, the expected revenue growth of 5.2 % p. a. on average to € 11,360 million in 2017 is mainly
based on the expected recovery of the European truck market as well as the expected growth of non-
European markets. In addition, a moderate growth of MTB’s market share is expected. Finally, the sys-
tematic expansion of the after sales business as well as the engine and components business is also sup-
posed to contribute to the revenue growth. In total, from 2014 onwards the truck business is expected
to grow faster than the bus business shifting the revenue mix slightly towards the truck business. Plan-
ning risks primarily stem from uncertain development of the Russian market caused by the introduction
of the utilization fee in 2012.
Earnings before interest and tax (EBIT)
306. The gross margin is expected to continuously improve from 2013 onwards throughout the planning
period. This is due to an optimisation of the procurement performance achieved through realising sav-
ings in materials costs. Benchmarking analysis showed potential for optimisation, and initiatives were
introduced to ensure that the identified potentials can be achieved. The most important actions to im-
prove the procurement processes are a bundling of purchases, renegotiation or new negotiations with
suppliers, as well as technical optimisations of the product with regard to a reduction of the costs of
material. Pseudo synergy effects from the cooperation with Volkswagen AG and Scania, which are ex-
pected to increase steadily up to € 125 million by 2017, have also been considered. A sustainable im-
provement of the procurement performance of 2.6 % for 2013 and of 2 % p. a. for 2014 onwards is ex-
pected. In addition, it is expected that warranty costs will increase less than proportionally compared to
revenues by systematically expanding the quality organisation. MTB also expects a positive effect on the
gross margin due to a higher capacity utilisation of production plants resulting in economies of scale.
307. MTB's selling, general and administrative expenses (SG&A expenses) have risen in the past years be-
cause of new hires due to an expected market recovery. This has contributed to a reduction of the oper-
ating margin. MTB’s ratio of SG&A expenses to revenues is significantly higher than for most of its com-
petitors. Therefore, MTB intends to consequently reduce the SG&A expenses throughout the planning
period by reducing personnel expenses using the regular employee turnover in the sales, administrative
and technical departments. In addition, controlling of overhead expenses has been intensified. MTB
plans to reach its targeted SG&A expense ratio of approximately 10 % - 11 % of revenues until 2016.
308. MTB’s SG&A expenses also include the overhead expenses of MFI. These expenses mainly consist of
personnel and IT expenses, as well as depreciation and amortisation. Because of new hires as part of the
continuous expansion and professionalisation of the comparatively young business, and the introduction

KPMG PwC
88
Xx
of a new IT system, an increase of SG&A expenses predominantly in the years up to 2015 is expected for
MFI.
309. MTB's other operating expenses throughout the planning period mainly comprise research and devel-
opment expenses. Research and development expenses in relation to revenues are expected to increase
during the planning period, reaching the target level of 5.0 % of revenues from 2015 onwards. Devel-
opment costs are partly capitalised and amortised over the following years. Further elements of the
other operating expenses include the depreciation of inventories (finished products and used vehicles),
and other depreciation and amortisation expenses.
310. For MFI, other operating income includes interest income from the financing and leasing business, as
well as other income such as provisions from insurance brokerage. Interest income is expected to in-
crease throughout the planning period mainly because of the expected expansion of the portfolio from
€ 2,934 million in 2012 to € 4,404 million in 2017. This expansion is based on MTB’s planned sales devel-
opment as well as the assumed increasing penetration rates and average financing volumes.
311. The corresponding interest expenses and risk costs are shown under other operating expenses. While
the gross margin is expected to remain almost constant compared to 2012 during the planning period,
MFI expects to be able to increase the net margin steadily until 2015 by reducing the risk costs, espe-
cially in countries heavily affected by the financial and sovereign debt crisis such as Italy and Spain, as
well as for Russia. From 2015 onwards only marginal increases of the net margin based on a normalised
level are expected.
312. In total, MTB’s planning figures assume a constant improvement of the EBIT margin to 8.4 % in 2017.
The improvement of the EBIT margin is - to almost equal parts - the result of a reduction of the costs of
goods sold ratio as well as the SG&A expense ratio. Both expense ratios are expected to decrease by
almost four percentage points by 2017. The improvement is partly based on expected synergies result-
ing from a closer cooperation with Volkswagen AG and Scania (see note 261). In contrast, an increase of
other operating expenses is expected, which mainly results from increased research and development
expenses.
313. Overall, in our opinion MTB’s financial planning can be characterised as ambitious but feasible. How-
ever, a successful realisation of the expected operating results for the years 2013 to 2017 depends sig-
nificantly on the successful implementation of the targeted savings in materials costs, the successful
reduction of SG&A expenses, especially in the administration and sales organisation, the realisation of
expected synergies and a sustainable economic recovery. Based on the documents and information
provided we considered all pseudo synergy effects for the present valuation.

KPMG PwC
89
Xx
Employees
314. Expecting an economic recovery after the 2009 financial crisis, MTB significantly increased its workforce,
especially in 2011. However, the continued financial and sovereign debt crisis deterred the recovery of
the truck sales market causing new hires to significantly adversely affect the operating margin. There-
fore, - although the number of employees in development projects is assumed to increase - a reduction
of the workforce is planned for the planning period, especially in 2013 and 2014, to reduce the SG&A
expense ratio.
Depreciation, amortisation and capital expenditures
315. In the planning period the focus is on the development of a new heavy truck series (TGX/TGS), as well as
the optimisation of the production and sales network. Investments therefore are mainly planned for
new production facilities (e.g. cab painting), investments in product maintenance and enhancements, as
well as the sales organisation. Planned depreciation and amortisation expenses increase in the planning
period due to rising capital expenditures, as well as higher research and development expenses and the
resulting amortisation of capitalised development expenses (for the new heavy truck series).

KPMG PwC
90
Xx
c) Financial planning of MAN Latin America
316. ML’s key figures for the fiscal years 2013 to 2017 - compared to fiscal year 2012 - are as follows:
Source: MAN SE, ML
Business development
317. ML’s sales volume forecast for the Latin American truck and bus market is based on both internal ex-
perience from the ML sales network and external market studies.
318. After the market volume of the Brazilian truck market over 5 t decreased in 2012 to approximately
136,600 units (2011: approximately 171,200), ML expects a moderate recovery of the Brazilian market in
2013 and continuous growth for the remaining planning period. Among other things, the growth expec-
tations are backed by government incentives introduced at the beginning and in the course of 2012.
These include tax incentives, favourable financing conditions, a government infrastructure investment
programme, as well as direct purchases of trucks and (school) buses. Further stimulating effects for the
Brazilian truck market are expected from the upcoming major sport events: the FIFA-World Cup in 2014
and the 2016 Summer Olympics. In addition, ML expects a beneficial effect - mainly for the heavy and
extra-heavy vehicle series - from the exploitation of new discovered mineral resources. As the average
age of the commercial vehicle fleet in Brazil is over 16 years, in the medium term there will also be a
substantial need for replacement investments. Overall, ML expects sales growth rates of 9.0 % p. a. on
average until 2017 leading to a market volume of 210,000 units for trucks over 5 t. More stringent emis-
sion standards, i. e. the introduction of PROCONVE P-8 (comparable to EURO VI), are not expected
within the planning period. ML’s forecast market development for Brazil for trucks over 5 t is signifi-
cantly above the expectations of LMC Automotive, and should therefore be considered as optimistic.
319. Following an increase of ML’s market share in Brazil in 2012 for trucks over 5 t to 30.3 % (2011: 29.7 %),
ML expects a decrease of its market share to approximately 27 % for 2013. The expected loss of market
share is on the one hand due to increasingly intensive competition and on the other hand due to the
MAN Latin America
CAGR
€ million 2012 2013E 2014E 2015E 2016E 2017E 2012 - 2017
Revenue 2,870 3,025 3,635 4,344 4,901 5,528 14.0%
Depreciation and amortisation 145 123 143 123 104 147 0.3%
of which attributable to PPA 92 76 60 43 28 25 -22.7%
Capi ta l expendi tures 100 160 176 218 182 170 11.2%
EBIT 137 139 220 312 422 525 30.7%
EBIT margin 4.8% 4.6% 6.0% 7.2% 8.6% 9.5%
8.0% 7.1% 7.7% 8.2% 9.2% 10.0%
Employees 1,937 2,102 2,102 2,102 2,102 2,102 1.6%
EBIT margin (excl. PPA
depreciation)

KPMG PwC
91
Xx
fact that the strongest growth is expected in the extra-heavy market segment, in which ML so far is only
present to a smaller extent. In the course of the planning period ML expects to regain a market share of
approximately 28 %. To regain market shares and to overcome the increasing intensive competition, ML
is focusing on technical innovations and continuous product enhancements as well as on the expansion
of its product portfolio. Examples are amongst others the introduction of the MAN TGX series in Brazil in
2012 and the MAN D08 engine, also introduced in 2012. In addition, ML is currently developing the new
Phevos series, which will replace the VW Delivery series in the market segment up to 10 t. Moreover,
the Phevos series will add a smaller truck in the 3.5 t segment to ML’s product range.
320. The Brazilian bus market also decreased in 2012 to a volume of approximately 28,800 units (2011:
34,600). In the bus market ML also expects the market to recover within the planning period to ap-
proximately 42,000 units in 2017. These expectations are well above external market expectations. ML’s
expectations are based on a quicker than anticipated recovery of the Brazilian economy in conjunction
with the positive effects from the government incentives and the two upcoming major sport events
described above.
321. ML’s market share for buses over 8 t was 27.9 % in 2012 (2011: 32.2 %). Thus, ML still ranks second in
the Brazilian bus market behind Mercedes-Benz. For the planning period ML expects to steadily increase
its market share to over 30 %. In order to achieve this, the introduction of a new bus chassis series as
well as further product innovations is planned.
322. ML’s overall planned sales growth for trucks and buses is more optimistic than that of current market
studies. The aspired sales forecast is therefore ambitious, and to a large extent dependent on the overall
development of the Brazilian economy.
323. Besides the sales in the domestic market, ML also exports a significant portion of its manufactured
vehicles. ML’s most important export markets are other Latin American countries like Mexico, Argen-
tina, Uruguay, Peru and Chile, as well as some African markets, like Angola, Nigeria and South Africa.
Especially in the emerging countries in Latin American there is significant sales potential due to the ex-
pected growth of these regions.
324. Overall, ML expects an average growth rate of approximately 14 % p. a. from the export business to
17,000 units in 2017. One key driver of this positive development, in addition to an increased competi-
tiveness due to the revision and expansion of the product portfolio, is especially the expansion of the
sales and service network in the individual markets. Towards the end of the planning period, a further
positive effect promoting ML’s competitiveness in the export markets is expected from the introduction
of the Phevos series.

KPMG PwC
92
Xx
325. The price effect is of minor importance compared to the volume effect in the truck as well as in the bus
business during the planning period. However, ML expects continuous price increases during the plan-
ning period in both the domestic and export markets.
326. The development of revenues is therefore primarily driven by the expected volume growth. In total, an
average annual growth rate of 14.0 % is expected for the planning period up to 2017. The growth rate
for domestic and export sales contribute in approximately equal parts to the expected growth. From
2013 to 2015 the highest growth rates are expected for extra-heavy vehicles. On the one hand this is
based on the introduction of the TGX series, and on the other hand on the higher expected demand due
to the major sport events as well as a positive development of the overall economy. In 2016 and 2017
an increasing demand for light trucks is expected due to the continuous growth of the metropolitan
areas. To meet the growing demand for light trucks the introduction of the Phevos series is planned for
this period.
327. Compared to the truck business, ML expects lower growth rates in the bus market leading to a slightly
decreasing share of the bus business in terms of ML’s total revenues. ML assumes that in the medium-
term the bus business will represent about 16 % of its total revenues.
328. ML does not differentiate between revenue and order intakes as, in the Brazilian market, long-term
orders are not common. Customers rather tend to purchase finished vehicles or order their vehicles at
short notice depending on current requirements.
Earnings before interest and tax (EBIT)
329. ML’s management expects to be able to reduce the cost of goods sold in relation to revenues by ap-
proximately two percentage points by 2014. The costs of goods sold mainly comprise costs of materials,
the cost of goods sold of the Mexican production facility, expenses for warranty provisions as well as
depreciation and amortisation and freight costs.
330. As under the production concept "Consórcio Modular" the actual production of the vehicles is carried
out by partner companies at the Resende plant, cost of materials represents the bulk of cost of goods
sold. The purchasing costs for the manufactured vehicles, as well as the services provided by the partner
companies are bundled as costs of materials. "Consórcio Modular" allows ML to react flexibly and rap-
idly to changes in demand. As the employees working in production are mainly employed by partner
companies, the proportion of fixed costs is relatively low in Brazil.
331. The employees directly employed by ML are only involved in product development, quality assurance,
as well as sales and customer service. The cost of goods sold, which arise from these employees, hence
represent only a small share of the cost of goods sold.

KPMG PwC
93
Xx
332. The currently still relatively high costs of goods sold in the second production facility are supposed to be
reduced during the planning period using efficiency-increasing programmes and an expansion of the
"Consórcio Modular" concept.
333. Alongside the expected revenue growth, selling expenses are also planned to increase up to 2015. The
increase in costs results mainly from expected product launch costs, for example for the TGX series
launched in 2012. Towards the end of the planning period sales expenses are expected to move towards
a normalised level. The general and administrative expenses in 2012 were characterised by IT related
one-off costs. For 2013 a reduction of general and administrative expenses is expected. In the following
years moderate cost increases are assumed. Overall however, ML expects that economies of scale can
be achieved as a result of the planned growth of the operating business, and that the ratio of SG&A ex-
penses with regard to revenues will therefore be reduced accordingly.
334. ML's other operating expenses in the planning period mainly include research and development ex-
penses. Due to the Phevos project, higher research and development costs are expected for the plan-
ning period. Since a significant part of the development costs is planned to be capitalised, the additional
expenditure will not be fully reflected in the operating margin.
335. Due to savings, for example as part of the measures to improve the profitability in Mexico, as well as by
achieving economies of scale, ML expects a significant improvement of the operating margin from 2014
onwards. Due to the production concept "Consórcio Modular" and the resulting flexibility of operating
costs, ML's EBIT margin varies much less than unusual in this industry. The expected EBIT increase to
€ 525 million in 2017 is therefore mainly the result of the planned expansion of the operating business.
The expected operating margin is approximately equal to historical levels. The planning therefore seems
ambitious, mainly because of the growth expectations for the Brazilian market, but feasible.
Employees
336. At the end of the fiscal year 2012 ML employed a total of 1,937 people, who primarily work in the prod-
uct development and quality assurance, as well as sales and customer service. Additionally approxi-
mately 3,800 people were employed by partners or service providers in the production concept "Con-
sórcio Modular". The directly employed workforce is expected to stay constant in the planning period
from 2013 onwards; salaries and wages were indexed using the expected inflation rates. For 2013 the
recruitment of 165 new employees is planned in order to manage the future revenue growth. The num-
ber of employees working in the production concept "Consórcio Modular" is expected to rise to over
6,700 in 2015. This increase is reflected in ML’S increasing cost of materials.
Depreciation, amortisation and capital expenditures
337. Within the planning period the major capital expenditures at ML result from the development of the
Phevos series and from the modification of the paint shop in the Resende plant. In addition, a further
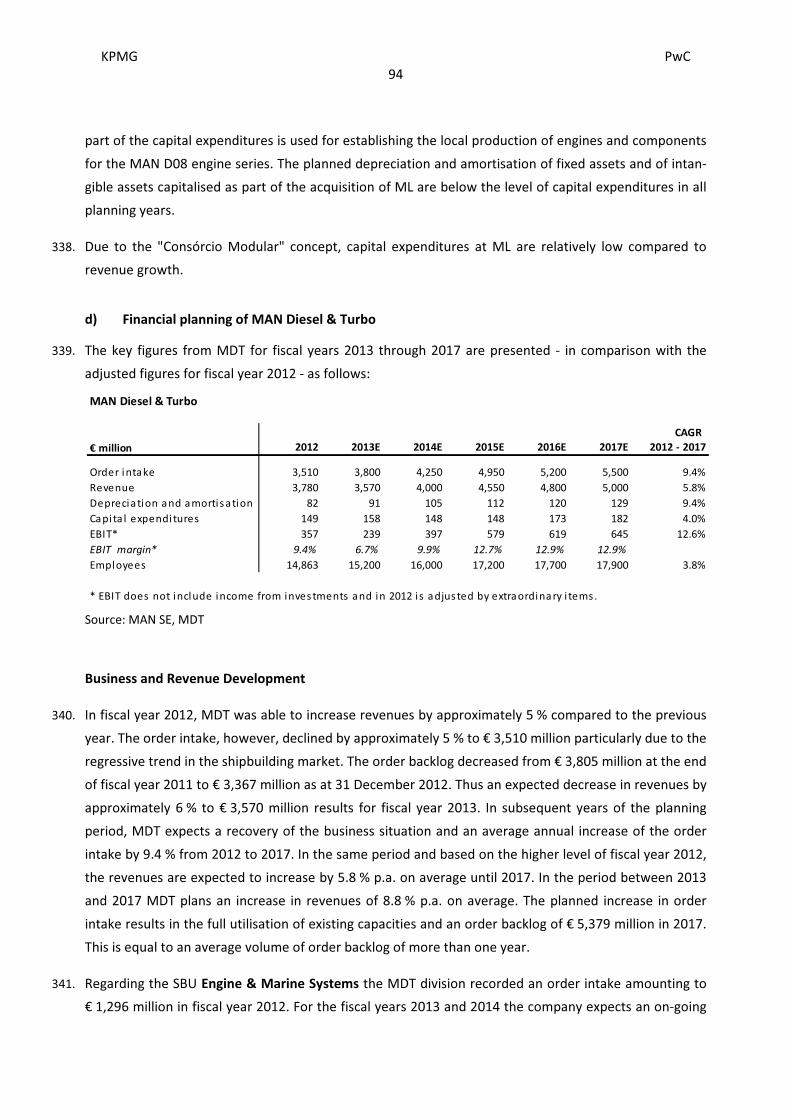
KPMG PwC
94
Xx
part of the capital expenditures is used for establishing the local production of engines and components
for the MAN D08 engine series. The planned depreciation and amortisation of fixed assets and of intan-
gible assets capitalised as part of the acquisition of ML are below the level of capital expenditures in all
planning years.
338. Due to the "Consórcio Modular" concept, capital expenditures at ML are relatively low compared to
revenue growth.
d) Financial planning of MAN Diesel & Turbo
339. The key figures from MDT for fiscal years 2013 through 2017 are presented - in comparison with the
adjusted figures for fiscal year 2012 - as follows:
Source: MAN SE, MDT
Business and Revenue Development
340. In fiscal year 2012, MDT was able to increase revenues by approximately 5 % compared to the previous
year. The order intake, however, declined by approximately 5 % to € 3,510 million particularly due to the
regressive trend in the shipbuilding market. The order backlog decreased from € 3,805 million at the end
of fiscal year 2011 to € 3,367 million as at 31 December 2012. Thus an expected decrease in revenues by
approximately 6 % to € 3,570 million results for fiscal year 2013. In subsequent years of the planning
period, MDT expects a recovery of the business situation and an average annual increase of the order
intake by 9.4 % from 2012 to 2017. In the same period and based on the higher level of fiscal year 2012,
the revenues are expected to increase by 5.8 % p.a. on average until 2017. In the period between 2013
and 2017 MDT plans an increase in revenues of 8.8 % p.a. on average. The planned increase in order
intake results in the full utilisation of existing capacities and an order backlog of € 5,379 million in 2017.
This is equal to an average volume of order backlog of more than one year.
341. Regarding the SBU Engine & Marine Systems the MDT division recorded an order intake amounting to
€ 1,296 million in fiscal year 2012. For the fiscal years 2013 and 2014 the company expects an on-going
MAN Diesel & Turbo
CAGR
€ million 2012 2013E 2014E 2015E 2016E 2017E 2012 - 2017
Order intake 3,510 3,800 4,250 4,950 5,200 5,500 9.4%
Revenue 3,780 3,570 4,000 4,550 4,800 5,000 5.8%
Depreciation and amortisation 82 91 105 112 120 129 9.4%
Capi ta l expendi tures 149 158 148 148 173 182 4.0%
EBIT* 357 239 397 579 619 645 12.6%
EBIT margin* 9.4% 6.7% 9.9% 12.7% 12.9% 12.9%
Employees 14,863 15,200 16,000 17,200 17,700 17,900 3.8%
* EBIT does not include income from investments and in 2012 i s adjusted by extraordinary i tems.

KPMG PwC
95
Xx
slowdown of the commercial shipbuilding market. Hence, a significant reduction of license revenues
from two-stroke diesel engines was considered. Due to the increasing after-sales business, revenues of
€ 1,410 million (2013) are above order intake levels for the fiscal year 2012. In accordance with an as-
sessment of the current market for four-stroke diesel engines, a slight recovery of ship orders is ex-
pected in 2013. Based on this, the expected increase in revenues of 14.0 % in fiscal year 2014 should
particularly result from a recovery in the business of four-stroke engines as well as from increasing reve-
nues in the after-sales business. An increase in revenues by 12.6 % to € 1,809 million is planned for fiscal
year 2015, which represents a higher level than in 2011 with € 1,670 million. Aside from the successive
introduction of new products starting from 2015 (to a large extent from 2016), the management of MDT
expects this increase in particular with regard to the recovery of the commercial ship building market.
Furthermore, the after-sales business in particular is supposed to contribute to the high revenue levels
projected for 2015. Considerable growth of the installed basis from the peak stage of the ship building
market also contributes thereto during the planning period. Additional growth is also supposed to be
generated from the expansion of the global organisation, in particular with regard to the sales organisa-
tion as well as the after-sales business. Based on the already high level of revenues of fiscal year 2015,
the company expects a comparably moderate development in fiscal years 2016 and 2017, with revenues
of € 1,863 million in 2017. This is consistent with the previously shown stable development of the ship-
ping market from this date onwards. Overall, we consider the planning of revenues in the SBU Engine &
Marine Systems to be plausible.
342. The market development for the SBU Power Plants is primarily determined by the overall economic
development. After the significant growth rates achieved particularly in 2011, the economic develop-
ment remained behind expectations in 2012. The order intake in 2012 amounted to € 668 million and
ranges partially up to three years. In fiscal year 2013, MDT expects the revenues in the SBU Power Plants
to amount to € 628 million (2012: € 773 million). This takes into account, that a major large-scale project
in Brazil does not start to generate revenues until fiscal year 2014. A slight recovery of the market is
expected in the emerging and developing countries starting from 2013, since the generally high energy
demand will remain unchanged. The trend towards a more decentralised energy supply also contributes
to the planned development of revenues.
343. Besides the manufacturing and distribution of generator sets for power generation, the SBU Power
Plants also provides turnkey power plants as a general contractor. In October 2008, MDT received an
order from a French power company to construct turnkey diesel power plants on Corsica and in the
overseas departments of La Réunion, Guadeloupe and Martinique. In the period between 2010 and
2012 this project contributed approximately half of the revenues achieved with turnkey power plants
and according to the current state of knowledge, it should be finished until fiscal year 2015. The share of
additional contracts on turnkey power plants in revenues should rise successively in the planning period,
and therefore capacities that become available after the project with the French power company is fin-
ished could be used for various other projects. MDT explains the increase in revenues in the SBU Power

KPMG PwC
96
Xx
Plants by approximately 29 % to € 1,146 million in 2016 by projects, which are newly granted during the
planning period and contribute to the revenues from fiscal year 2016 onwards. In addition, MDT intends
to successively increase the market share of the SBU Power Plants through, among other things, a fur-
ther expansion of the global sales organisation and newly developed products that are expected to en-
ter the market mostly from 2016 onwards. During the planning period the growth of the installed basis
of engines will contribute to an increase in revenues generated through the after-sales business.
344. Overall, the projected revenues in the SBU Power Plants are expected to increase by 10.1 % p.a. on
average in the period between 2012 and 2017 and hence, in 2017 with € 1,250 million should be almost
twice as high as expected for fiscal year 2013. Within this context, the company intends to significantly
expand its market share. Gas engines will be of increasing relevance in the projected market develop-
ment. Currently, Wärtsilä holds an important market position in this sector. Based on this, we consider
the planned increase in revenues in the SBU Power Plants as ambitious but feasible.
345. In contrast to the general market trend, the order intake of the SBU Turbomachinery was in 2012 with
€ 1,546 million approximately 7 % higher than in the previous year (€ 1,447 million). With the economic
slowdown, the sale of new compressors and turbines has slightly decreased. Nevertheless, the SBU was
able to increase the order intake both from chemical and fertiliser plants and the oil and gas sector as
well as from the after-sales business. For instance, a Brazilian customer extended one contract con-
cluded with MDT in 2002 on maintenance, servicing and operational support of 20 MAN gas turbines
and compressors on four Brazilian offshore platforms for another five years. The key regions in 2012 for
the turbo machinery business were also primarily emerging and developing countries, in particular Brazil
and China.
346. In 2013 the SBU expects an increase in turnover from € 1,455 million by 5.2 % to € 1,531 million mainly
due to the increased order intake in 2012. In 2013 and 2014, MDT expects a continuously positive, but
slightly weaker growth for the process industry in emerging countries. Due to population growth, there
is basically a high long-term demand for basic materials. The pricing pressure will continue to increase
nonetheless, due to more intense competition. For the process industry markets, future growth consid-
ered in the planning is especially stemming from gas and steam turbines, screw compressors, very large
air separation units as well as turbo machinery for the production of fertilisers and ethylene.
347. The expected positive market development in the oil and gas industry is the result of the exploitation of
new deep-sea oil reserves as well as investments in the extraction and sea transport of natural gas. Due
to a comparatively low price of natural gas, especially in the US, this should lead, among others, to new
developments in energy infrastructure, transport, petro chemistry and production. The development to
use natural gas as an alternative to oil basically has a positive impact on all major regions. MDT there-
fore expects further growth in the oil and gas industry in 2013 and 2014. Additional growth is planned in
sales and after-sales business as a result of the expansion of the global organisation.

KPMG PwC
97
Xx
348. Revenues in the SBU Turbomachinery are planned to increase to € 1,854 million by the year 2015. The
company expects the business to be stabilised on this level that is approximately 27 % above the reve-
nue in 2012. The revenue is expected to slightly decrease by 1.7 % in 2016 and increase by 3.5 % to
€ 1,887 million in the following year. This development is associated with an expected cyclic nature of
the business and results from price and competition effects.
349. An average revenue growth of 5.3 % is planned in the SBU Turbomachinery for the period from 2012 to
2017. The long-term demand for oil and gas is expected to increase on average by approximately 0.5 %
for oil and 1.6 % for gas. Due to increasingly complex extraction methods in more remote extraction
areas, comparably higher growth in the relevant market for turbo machinery for oil and gas exploitation
and for pipeline transport is expected in the medium-term. The growing middle class in developing
economies as well as further population growth indirectly increases the demand for turbo machinery
that is used in the production of basic materials and fertilisers. However, competitors much larger than
MDT take part in the market for turbo machinery and hence, the market is characterised by an increas-
ing pricing pressure. Based on this, we consider the planning of revenues in the SBU Turbomachinery
overall as plausible.
Earnings before interest and tax (EBIT)
350. Despite the slightly increased revenues of MDT in fiscal year 2012, the EBIT margin, adjusted for special
effects, significantly decreased from 13.4 % (2011) to 9.4 %. This was in particular caused by a decrease
in the gross margin from the license business, a continuing high competitive pressure in the new engines
business of four-stroke engines with an associated underutilisation in the SBU Engines & Marine Sys-
tems as well as increased costs related to large plant construction projects in the SBU Power Plants.
Both an increase in the after-sales business and the SBU Turbomachinery partially compensates these
effects.
351. For the fiscal year 2013 MDT expects a further decline of the EBIT by approximately € 118 million. Ac-
cordingly, the EBIT margin is expected to decrease further by 2.7 percentage points to 6.7 %. The cause
for this expected decline is on the one hand a further deterioration of the situation in the shipping mar-
ket, in particular with regard to the construction of large commercial vessels and the associated de-
crease in revenues from licenses. On the other hand, significant adverse effects to EBIT margin are still
expected especially in fiscal year 2013 from large plant construction projects in the SBU Power Plants.
The negative effects resulting from large plant construction projects are expected to decrease substan-
tially in fiscal year 2014. Additionally, a declining margin in the SBU Turbomachinery contributes to the
decline of the EBIT margin in fiscal year 2013.
352. The increase of the EBIT margin through fiscal year 2015 can be traced back to approximately equal
parts to developments in the SBUs Power Plants and Turbomachinery. With regard to the SBU Engines &
Marine Systems no significant contributions to an increase of the EBIT during this period are expected

KPMG PwC
98
Xx
by MDT. This is due to the situation in the ship building market that is expected to continue to be tense,
primarily with regard to the license business for two-stroke engines used in commercial ships. Addition-
ally, margins in the area of four-stroke engines will further decrease until the launch of major product
innovations starting from fiscal year 2016. With regard to the SBU Power Plants the negative effects
from large plant construction projects are expected to significantly decrease in 2014. The after-sales
business as well as effects of the planned and partially initiated cost-saving measures should in particu-
lar contribute to the improvement of profitability until 2015 in the SBU Turbomachinery.
353. From 2016 onwards, MDT expects a stabilisation of the EBIT margin at 12.9 %. This EBIT margin is ap-
proximately 1.4 percentage points above the average adjusted EBIT margin from 2010 to 2012. The
company has taken into account the offsetting effects from the different cycles of the SBUs. Next to
margin effects resulting from the introduction of new products, the SBU Engines & Marine Systems ex-
pects a recovery of the shipbuilding sector of commercial vessels, which will lead to increased license
revenue. In contrast, a cyclical-related decline in the profitability in the SBU Turbomachinery is ex-
pected. To this end, the effects from the intended cost-saving measures are expected to be exceeded by
an increase in the intensity of competition and the resulting pricing pressure. For the SBU Power Plants
the company expects a stable development of profitability in 2016 and 2017.
354. Adjusted for one-time special effects, the EBIT margin amounted to 11.6 % in 2010, 13.4 % in 2011 and
9.4 % in 2012. The EBIT margin in 2016 and 2017 is in the upper range of the historical EBIT margins. In
this regard, we consider the planned development of the EBIT margin of MDT to be plausible, although,
on the basis of the assumed continuously positive economic trend, to be rather ambitious. This conclu-
sion incorporates the expected business situation of relevant competitors.
Employees
355. On 31 December 2012, MDT employed 14,863 employees, including temporary workers. The increase of
approximately 6 % compared to the previous year is basically due to the development of distribution,
service and research departments as well as due to the consolidation of additional companies.
356. Despite declining revenues MDT plans an increase in the number of employees, including temporary
workers, by 2.3 % in 2013. The increase in the number of employees is associated with the intended on-
going internationalisation as well as the expansion of the global organisation. To this end, the interna-
tional after-sales business-activities as well as sale capacities are planned to be enhanced in particular.
Overall, with an average increase of 3.8 % p.a., the number of employees is planned to increase less
than the intended average annual growth of revenues of 5.8 % p.a. during the planning period. An in-
creased utilisation of existing capacities has been taken into account.

KPMG PwC
99
Xx
Depreciation, amortisation and capital expenditures
357. In order to maintain its competitiveness, MDT significantly increased its investment activities in fiscal
year 2012 and invested approximately 4 % of revenues. Capital expenditures were focused on the pro-
duction and development of engines as well as on the manufacturing and testing sites of the SBU Tur-
bomachinery located in Oberhausen and Zurich.
358. MDT plans the launch of new generations of engines and other product innovations primarily from the
year 2016 onwards. Accordingly, almost one fifth of the total capital expenditures are earmarked for
capitalised development costs until and including the year 2015. This portion gradually decreases in the
following years up until 2017. A significant portion of the remaining capital expenditures in tangible
assets is also related to product innovations, test beds in particular. The other key part of the invest-
ments in this period refers to replacement capital expenditures. The increase of the capital expenditures
volume in 2016 and 2017 is associated with the planned revenue growth. The capital expenditures ratio
(capital expenditures in relation to revenue) decreases from 4.4 % to 3.3 % in the period between 2013
and 2015 and continues at 3.6 % for 2016 and 2017. The average capital expenditures ratio amounts to
3.4 % in the periods from 2010 to 2017 and 3.8 % from 2012 to 2017.
359. The planned increase of depreciation and amortisation is associated with the increase of capital expen-
ditures in the past as well as in the planning period. The average depreciation ratio (in relation to reve-
nues) amounts to 2.4 % in the period from 2010 to 2017 and to 2.5 % in the period from 2012 to 2017,
respectively. In 2017 the depreciation ratio is expected to amount to 2.6 %.

KPMG PwC
100
Xx
e) Financial planning of Renk
360. Renk’s key figures for the fiscal years 2013 to 2017 are presented - in comparison with the fiscal year
2012 - as follows:
Source: MAN SE, Renk
Business and revenue development
361. Renk's order intake is expected to increase during the planning period by approximately € 36 million
from € 525 million in 2012 to € 561 million in 2017 (CAGR: 1.3 %). Within this context, it has to be con-
sidered that in 2012 the level of order intake was relative high, primarily due to the intake of major long-
term contracts for vehicle transmissions and special gear units.
362. During the detailed planning period, the projected development of revenues is positively affected by the
comparably high order intake in the past fiscal year 2012. Revenues are expected to increase from € 476
million in 2012 to € 593 million in 2017 (CAGR: 4.5 %).
363. For the planning year 2013, it is projected that Renk’s order intake from the sale of vehicle transmissions
will increase significantly. This is mainly due to the expected signing of a major contract regarding the
delivery of gear units for tracked vehicles. For the fiscal year 2014, no comparable major contracts are to
be expected, which contributes to the expected decline of order intake. In subsequent years, expected
order intake from various projects requiring vehicle transmission and being known in the market were
taken into account. Apart from the project business, annual order intakes and revenues from the spare
parts and maintenance business for vehicle transmissions were considered.
364. The revenues from the sale of vehicles transmissions can be predominantly ascribed to a few major
projects. For simplification purposes, the possibility that corresponding timelines might be postponed,
the scope of projects might be adjusted or projects might be even abandoned was not taken into con-
sideration. Projects awarded at short notice might also bring some compensatory effects. Renk’s over-
proportional increase in revenues from 2013 to 2014 is mainly attributable to the start-up of the above
mentioned major projects.
Renk
CAGR
€ million 2012 2013E 2014E 2015E 2016E 2017E 2012 - 2017
Order intake 525 545 502 533 573 561 1.3%
Revenue 476 474 563 559 578 593 4.5%
Depreciation and amortisation 14 17 18 18 19 19 5.3%
Capita l expenditures 28 37 33 36 35 28 0.2%
Employees 2,245 2,333 2,407 2,430 2,457 2,501 2.2%

KPMG PwC
101
Xx
365. Renk’s slide bearings business is characterised by comparably high quantities as well as the intense
competition. In addition, the global market is saturated on the supply side and, the products offered by
Renk in particular are subject to a high degree of standardisation.
366. Comparable to the vehicle transmission business, order intakes for special gear units are also affected
by major contracts. In 2012, major contracts for special gear units were concluded in the marine busi-
ness, resulting in an expected decrease of order intake in 2013. Principally, Renk expects to win further
major contracts, for instance from the Asia-Pacific and the South American regions, for highly sophisti-
cated gear units in the marine business. Hence, projected order intake in the marine business is ex-
pected to remain at a high level until 2016. Towards the end of the detailed planning period, it is ex-
pected that the scope of investment programmes currently observable in the market will be reduced,
which will affect a decrease of order intake. It is projected that this effect will be partially offset by an
upturn in the stationary gear sector whose outlook was subdued in the recent past as well as in the be-
ginning of the detailed planning period. Following a phase of reluctance of investments caused by the
financial and sovereign debt crisis, expected market recovery is predominantly linked to the business
with gear units for the cement industry but also to other major industrial applications that are depend-
ent on economic cycles. In the stationary gear sector the business volume is predominately influenced
by the spare parts and maintenance business.
367. Over the last years, the Renk’s standard gear business has benefited from a temporary boom in demand
for LNG tankers. Currently, the demand for LNG tankers is declining due to significantly increased trans-
port capacity. This results in the decreased order intake in 2012 as well as an expected decline of order
intake in the planning year 2013. Subsequently, Renk anticipates a recovery in the remaining commer-
cial shipbuilding market, which is currently at a low level due to low freight rates. In addition to this, an
order intake for gears for offshore wind power plants with a capacity above 5 MW is expected. The pos-
sibility that gearless wind power plants, which are in the prototype phase for the performance class of
above 5 MW that is relevant for Renk, will be successful in displacing already proven systems with gears,
was not considered in the forecast.
368. Particularly at the beginning of the planning period, Renk expects significant revenues from the sale of
standard gear units due to a good order situation for gears for LNG tankers. Under the consideration of
the intense competitive environment, revenues from gears for wind power plants are expected to ex-
hibit a moderate increase during the planning period.
369. Overall and mainly due to the consideration of major projects in the planning figures as well as the
relatively stable development of revenues starting from 2014, we consider the revenues projected by
Renk to be plausible.

KPMG PwC
102
Xx
Earnings before interest and tax (EBIT)
370. During the planning period, it is expected that Renk’s EBIT will increase from € 65 million in the fiscal
year 2012 to € 80 million in the fiscal year 2017, representing an average growth of 4.2 % per year. To
this end, cost of goods sold is generally planned at product group level except for major projects, which
are planned at the level of the respective project. Key parameters are the anticipated use of materials,
the projected utilisation of employees and, especially important for the SBUs Vehicle Transmissions and
Special Gear Units, projected warranty obligations. In principal, the derivation of projected gross mar-
gins for future orders is based on past experiences and expected market trends, such as the increased
competition in the market for wind power gear units. As soon as order-specific special effects are known
or expected, they are considered in the forecasts.
371. The selling expenses partially include project-specific expenses and are characterised by the fact that
the business has become more consulting intensive. In the slide bearing business highly competitive
markets require a high degree of assistance and consulting efforts. The vehicle transmissions and special
gear unit business customers also have increasingly extensive and time-consuming requirements regard-
ing the documentation accompanying the orders.
372. The other operating income of the past years is mainly comprised of gains from currency differences
and derivatives. In the planning period, other operating income and expenses are not expected to be
high since balances from hedging are expected to offset each other.
373. Other operating expenses primarily consist of research and development, write-downs, loss provisions
and scrapping. Operating expenses ratios in relation to revenues are projected to be lower in compari-
son to the past years.
374. Within the planning period, resulting EBIT margins are projected to remain nearly constant and, in
comparison to the past periods from 2010 to 2012, almost unchanged. From 2013 to 2017, the EBIT
margin is expected to range between 12.7 % and 13.6 %. Mainly due to the well-established business
model as well as the relatively diversified product portfolio offered by Renk as a manufacturer of special
gears, we consider the projection of a relatively stable development of EBIT margins to be comprehen-
sible and appropriate.
Employees
375. A moderate increase of the number of employees, from 2,245 employees in 2012 to 2,501 employees in
2017 is projected for the Renk division. Hence, the expected average increase of 2.2 % per year is less
than proportional in comparison to the expected development of revenues.

KPMG PwC
103
Xx
Depreciation, amortisation and capital expenditures
376. As in the recent past starting from 2008, expected capital expenditures in the planning period are af-
fected by a renewal programme of production processes. The programme is already completed for the
sites in Rheine and Hanover and is projected to be carried out at the site in Augsburg in 2015. Conse-
quently, the capital expenditures ratio (capital expenditures in relation to revenues) decreases from
7.8 % (2013) to 4.8 % (2017) during the planning period. Nevertheless, Renk continuously invests in
state-of-the-art production processes in order to maintain its competitiveness, which is also reflected in
the almost stable development of the EBIT margin. The derivation of planned capital expenditures in
accordance to projected revenues is comprehensible since higher business volumes regularly require an
expansion of machinery and plants as well as an increase in productivity in the light of basically satu-
rated markets and stable EBIT margins.
377. Particularly as a result of the investment programme described above, projected depreciation and
amortisation steadily increases during the planning period. The peak is anticipated in 2016, followed by
a slight decrease in 2017. In relation to revenues depreciation ratios are expected to range between
3.7 % (2013) and 3.1 % (2017). This almost matches with depreciation and amortisation ratios that were
observable in the past, ranging between 3.0 % (2012) and 3.3 % (2011).
f) Financial planning of the Corporate Center and consolidation
378. The central area "Corporate Center" includes MAN SE, as the group holding, and eleven other compa-
nies, in which primarily the Shared Service Centres such as Personnel and IT Services are organised cen-
trally.
379. The Corporate Center as the strategic management centre at the head of MAN Group is responsible for
the strategic and structural development of the group, the development of management resources and
the central controlling as well as the external reporting, taxation and corporate communication. In addi-
tion, the Corporate Center handles the central financial management, which primarily includes financing
and liquidity management of the MAN Group as well as processing internal payment transactions.
380. The figures for the central area, including the consolidation effects of the MAN Group for the fiscal years
2013 through 2017 are presented - in comparison with the fiscal year 2012 - as follows:
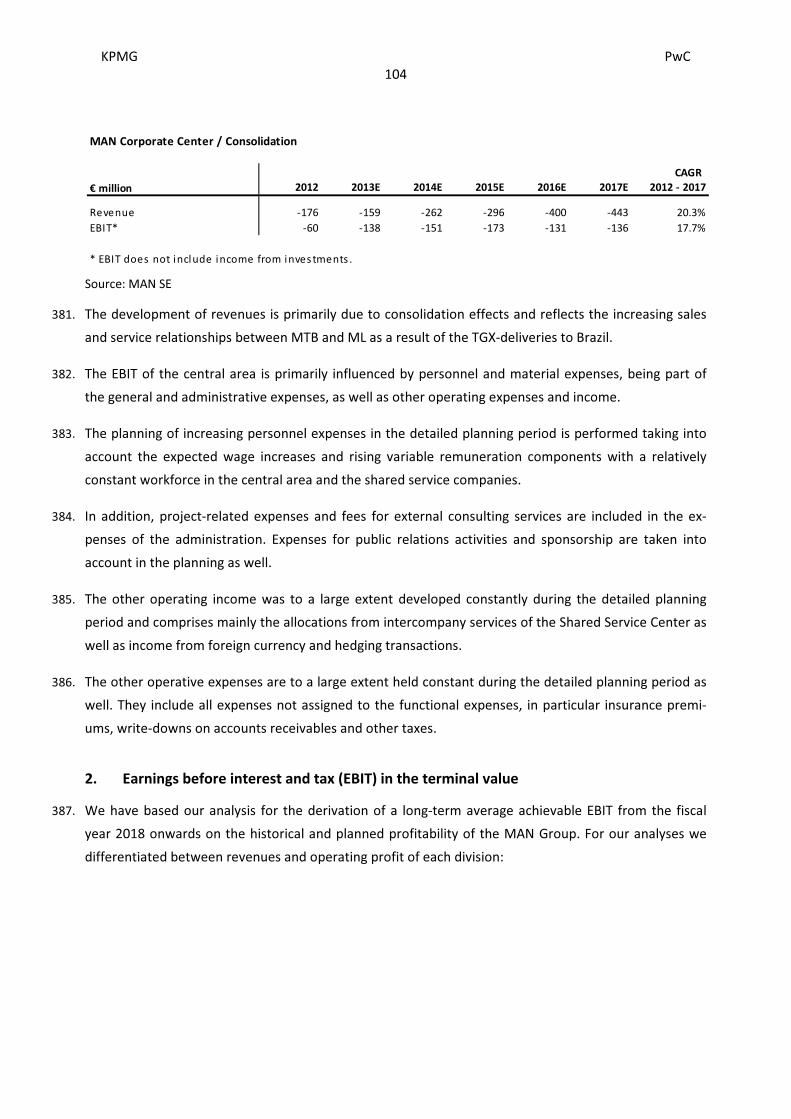
KPMG PwC
104
Xx
Source: MAN SE
381. The development of revenues is primarily due to consolidation effects and reflects the increasing sales
and service relationships between MTB and ML as a result of the TGX-deliveries to Brazil.
382. The EBIT of the central area is primarily influenced by personnel and material expenses, being part of
the general and administrative expenses, as well as other operating expenses and income.
383. The planning of increasing personnel expenses in the detailed planning period is performed taking into
account the expected wage increases and rising variable remuneration components with a relatively
constant workforce in the central area and the shared service companies.
384. In addition, project-related expenses and fees for external consulting services are included in the ex-
penses of the administration. Expenses for public relations activities and sponsorship are taken into
account in the planning as well.
385. The other operating income was to a large extent developed constantly during the detailed planning
period and comprises mainly the allocations from intercompany services of the Shared Service Center as
well as income from foreign currency and hedging transactions.
386. The other operative expenses are to a large extent held constant during the detailed planning period as
well. They include all expenses not assigned to the functional expenses, in particular insurance premi-
ums, write-downs on accounts receivables and other taxes.
2. Earnings before interest and tax (EBIT) in the terminal value
387. We have based our analysis for the derivation of a long-term average achievable EBIT from the fiscal
year 2018 onwards on the historical and planned profitability of the MAN Group. For our analyses we
differentiated between revenues and operating profit of each division:
MAN Corporate Center / Consolidation
CAGR
€ million 2012 2013E 2014E 2015E 2016E 2017E 2012 - 2017
Revenue -176 -159 -262 -296 -400 -443 20.3%
EBIT* -60 -138 -151 -173 -131 -136 17.7%
* EBIT does not include income from investments .

KPMG PwC
105
Xx
MTB
388. MTB’s sustainable revenues amounting to € 10,500 million were derived based on long-term trends and
correspond to annual sales of 87,000 trucks and 5,500 buses. For the derivation of the sustainable reve-
nues the cyclical nature of the truck and bus business was taken into account based on analyses of the
competitive environment and an analysis of MTB’s long-term development in the past (2001 to 2012)
and the entire planning period (2013 to 2017), so in total a period of 17 years. The sustainable revenues
of € 10,500 million are slightly higher than the average revenues planned for the detailed planning pe-
riod, which amount to approximately € 10,300 million.
389. Long-term analyses of MTB’s historical and projected EBIT margins show average EBIT margins of ap-
proximately 5.0 % - 6.0 %. The historical average EBIT margin for the fiscal years 2001 to 2012 was ap-
proximately 5.0 %, for a shorter period from 2004 to 2012 an average EBIT margin of approximately
5.5 % was achieved. Historical long-term average EBIT margins of comparable companies are approxi-
mately equal to 6.0 %. Taking the cyclical nature of the business and potential synergies with Volks-
wagen and Scania into account and given the current environment, we consider an EBIT margin for the
MTB division of 6.0 % - representing a sustainable average EBIT margin - as ambitious, but feasible for a
medium- to long-term perspective.
ML
390. Our derivation of the sustainable revenues for the ML division of € 5,000 million is based on a long-term
assessment of the Latin American truck and bus market and the management’s targeted market shares
in these markets. Also considering the past and projected development of ML over the period between
2010 and 2017 - taking the major sport events in 2014 and 2016 into account - sustainable average
revenues of € 5,000 million are appropriate. This value corresponds to a production of approximately
93,000 units p. a.
Sustainable revenues and EBIT*
Revenue
EBIT
margin* EBIT*
€ m. % € m.
MAN Truck & Bus incl . MAN Finance 10,500 6.00% 630
MAN Latin America 5,000 8.25% 413
MAN Diesel & Turbo 5,050 11.75% 593
Renk 550 13.30% 73
Corporate Center/Consol idation -447 n.a . -137
MAN Group 20,653 7.61% 1,572
* EBIT does not include income from investments.
Source: PwC/KPMG analysis
KPMG PwC
106
Xx
391. The sustainable EBIT margin for the ML division of 8.25 % was derived on the basis of the average EBIT
margins of the period 2008 to 2012 (approximately 8.0 %), the detailed planning period (approximately
8.5 % adjusted for depreciation and amortisation resulting from the PPA) and the projected increase of
profitability at the end of the planning period. By observing an appropriate timeframe, the cyclical na-
ture of the trucks & bus business was adequately addressed.
MDT
392. Based on long-term trend analyses of the past as well as the projected development in the detailed
planning period (2001 to 2017), we consider the revenues of € 5,000 million expected for 2017 to be
appropriate. The revenues of € 5,000 million are neither at the bottom nor the top of the range of the
cycle that can be observed for the business. The sustainable revenues of the MDT division amounting to
€ 5,050 million were therefore derived from the projected revenues of 2017 by applying a growth rate
of 1.0 %. The sustainable revenues adequately reflect the long-term business cycles, the intense compe-
tition, and the stabilising after-sales business.
393. MDT was able to improve its profitability in the past. MDT’s long-term average EBIT margin (2001 to
2017) is slightly below 10 %. Over a shorter period from 2010 to 2017 the average EBIT margin is 11.2 %.
Assuming that loss-generating projects in the SBU Power Plants are not sustainable an EBIT margin of
more than 12 % can be derived. On the contrary it needs to be considered that in the past as well as in
the planning period the level of depreciation and amortisation has always been below capital expendi-
tures. Therefore, the EBIT does not adequately reflect its cash generating power. As, in the long-term,
the level of depreciation, amortisation and capital expenditures will converge, we considered the differ-
ence of approximately 1.0 percentage points between depreciation and amortisation on the one hand
and capital expenditures on the other hand for the derivation of the sustainable EBIT margin. The sus-
tainable EBIT margin was set at 11.75 %. This EBIT margin is also in line with actual and projected EBIT
margins of comparable companies in the Power Engineering industry.
Renk
394. Based on the cyclicality of the plant and engine construction business as well as the assessment of Renk
AG’s management, we consider sustainable revenues of € 550 million as appropriate for Renk. Accord-
ing to the information provided, the capacity of Renk allows revenues of up to approximately € 600 mil-
lion. Considering the sustainable reinvestment rate, we regard sustainable revenues of € 550 million -
which are close to the maximum capacity utilisation - as appropriate to reflect a sustainable average
over differing business cycles.
395. The company targets a sustainable reinvestment rate of 5.0 % of revenues. This is below the long-term
average for the period between 2010 and 2017 of 6.2 %. Due to the current reinvestment programme
we consider the lower sustainable reinvestment rate as appropriate. Accordingly, we consider a sustain-

KPMG PwC
107
Xx
able EBIT margin of 13.3 %, reflecting an eight year average over the period 2010 to 2017
as appropriate.
Corporate Center/Consolidation
396. The sustainable earnings of the Corporate Center/Consolidation were derived based on the last planning
year, considering a sustainable growth rate of 1.0 %.
MAN Group
397. Overall, the assumptions result in sustainable revenues of € 20,653 million and an EBIT of € 1,572 million
for the years from 2018 onwards. This equates to an EBIT margin of 7.6 %.
398. When assessing the EBIT margin it needs to be considered that the expected income from investments
that are not fully consolidated - in particular Scania and Sinotruk - is not included in the EBIT, but sepa-
rately taken into account as part of the income from investments (see note 400 et seq.). Considering the
expected income from investments as part of the EBIT would increase the EBIT margin by 1.1 percent-
age points to approximately 8.7 %. Considering the income from investments based on the company’s
planning for the last planning year would result in a ROS margin of 8.3 % for the terminal value.
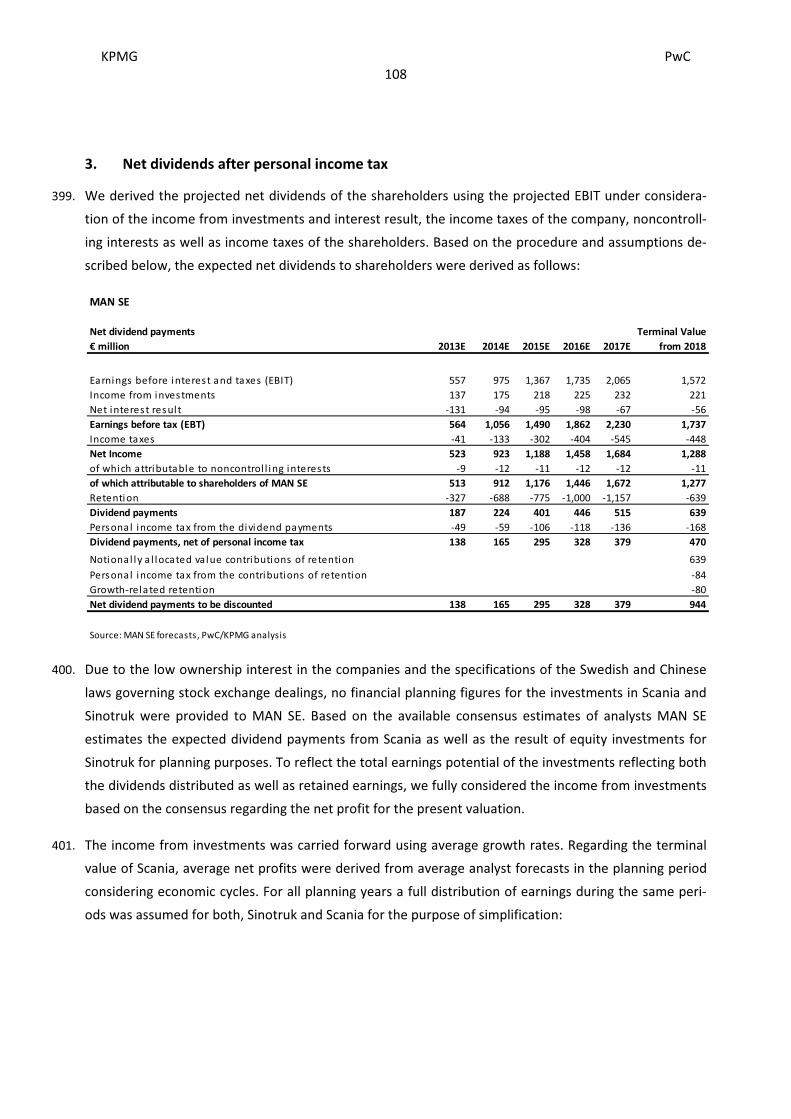
KPMG PwC
108
Xx
3. Net dividends after personal income tax
399. We derived the projected net dividends of the shareholders using the projected EBIT under considera-
tion of the income from investments and interest result, the income taxes of the company, noncontroll-
ing interests as well as income taxes of the shareholders. Based on the procedure and assumptions de-
scribed below, the expected net dividends to shareholders were derived as follows:
400. Due to the low ownership interest in the companies and the specifications of the Swedish and Chinese
laws governing stock exchange dealings, no financial planning figures for the investments in Scania and
Sinotruk were provided to MAN SE. Based on the available consensus estimates of analysts MAN SE
estimates the expected dividend payments from Scania as well as the result of equity investments for
Sinotruk for planning purposes. To reflect the total earnings potential of the investments reflecting both
the dividends distributed as well as retained earnings, we fully considered the income from investments
based on the consensus regarding the net profit for the present valuation.
401. The income from investments was carried forward using average growth rates. Regarding the terminal
value of Scania, average net profits were derived from average analyst forecasts in the planning period
considering economic cycles. For all planning years a full distribution of earnings during the same peri-
ods was assumed for both, Sinotruk and Scania for the purpose of simplification:
MAN SE
Net dividend payments Terminal Value
€ million 2013E 2014E 2015E 2016E 2017E from 2018
Earnings before interest and taxes (EBIT) 557 975 1,367 1,735 2,065 1,572
Income from investments 137 175 218 225 232 221
Net interest result -131 -94 -95 -98 -67 -56
Earnings before tax (EBT) 564 1,056 1,490 1,862 2,230 1,737
Income taxes -41 -133 -302 -404 -545 -448
Net Income 523 923 1,188 1,458 1,684 1,288
of which attributable to noncontrol l ing interests -9 -12 -11 -12 -12 -11
of which attributable to shareholders of MAN SE 513 912 1,176 1,446 1,672 1,277
Retention -327 -688 -775 -1,000 -1,157 -639
Dividend payments 187 224 401 446 515 639
Personal income tax from the dividend payments -49 -59 -106 -118 -136 -168
Dividend payments, net of personal income tax 138 165 295 328 379 470
Notional ly a l located va lue contributions of retention 639
Personal income tax from the contributions of retention -84
Growth-related retention -80
Net dividend payments to be discounted 138 165 295 328 379 944
Source: MAN SE forecasts, PwC/KPMG analysis

KPMG PwC
109
Xx
402. As a plausibility check a benchmark against the current market capitalisation of the two investments
was conducted. This analysis shows that the discounted income from investments considered in the
financial planning figures exceeds the proportionate market capitalisation of both investments as at the
end of our valuation work.
403. Other investments (e. g. the 49.0 % share in RMMV) and non- consolidated investments are summarised
as other financial investments. The operating non-consolidated investments were considered on the
basis of the higher of the proportionate net profit of the last fiscal years or the return on the propor-
tionate equity applying the cost of equity of the MAN Group. In favour of a higher enterprise value, all
other non-operating consolidated investments were considered based on the return on the proportion-
ate equity applying the cost of equity of the MAN Group. This means that in favour of the outside share-
holders it was assumed that even the non-operating investments earn their respective cost of capital.
404. The net interest result was derived based on cash and cash equivalents and interest-bearing debt of the
MAN Group as of 31 December 2012 and using an integrated balance sheet and financing plan. Besides
the planned capital expenditures, depreciation and amortisation, the expected development of the net
current assets and long-term provisions were also considered to derive the net interest result. The ex-
pected reduction of the (negative) interest result is caused by the expected retention of net profits that
will be explained in the following.
405. For the interest-bearing net debt average annual interest rates of 3.0 % to 4.0 % were applied based on
existing debt, bonds, loan agreements and pension provisions, as well as future refinancing volumes. We
applied a sustainable interest rate on interest-bearing debt of approximately 3.5 %.
406. The income tax burden was determined on the basis of the applicable income tax rate on earnings
before taxes according to IFRS. Any systematic differences between the tax base and the projected earn-
ings before taxes according to IFRS were taken into account using separate calculations.
407. For earnings accrued in Germany, the trade tax, the corporate income tax and the solidarity surcharge
were considered for the calculation of income taxes.
408. The MAN Group has total trade tax loss carryforwards in Germany in the amount of approximately
€ 576 million and corporate income tax loss carryforwards of about € 700 million. To the extent these
MAN SE
Income from investments Terminal Value
€ million 2013E 2014E 2015E 2016E 2017E from 2018
Scania 117 135 159 161 162 146
Sinotruk 18 26 41 41 41 41
Other financial investments 3 14 19 24 29 34
Income from investments 137 175 218 225 232 221
Source: MAN SE, CIQ
KPMG PwC
110
Xx
tax loss carryforwards can be used, they were considered in the calculation of the income tax burden to
reduce the tax payments. The tax loss carryforwards that cannot be used stem from entities in countries
where tax loss carryforwards can only be used for a limited period and the expected earnings are not
sufficient for using the existing tax loss carryforwards.
409. For the trade tax unity an average trade tax collection rate of 444 % was applied to calculate trade taxes.
This results in an average effective tax rate of 8.1 % in the detailed planning period taking into consid-
eration the deviations between the tax base and the earnings before tax according to IFRS. At Renk and
the EURO-Leasing average trade tax collection rates of 439 % and 380 % have been applied. This results
in average effective trade tax rates of 15.1 % and 1.4 % in the detailed planning period.
410. Corporate income tax for the consolidated German tax unity, Renk and EURO-Leasing was uniformly
determined at a statutory tax rate of 15.0 %. The solidarity surcharge was calculated using a rate of
5.5 % on top of the respective corporate income tax. The average effective corporate income tax rate
incl. the solidarity surcharge in the detailed planning period is 5.4 % (German fiscal unity), 15.5 % (Renk)
and 1.7 % (EURO-Leasing).
411. The payments entitlement of approximately € 1.6 million p. a. until the year 2017 resulting from the
corporate income tax credit of MAN SE were considered as a special value item (see section D.V.2).
412. For all earnings that accrued abroad, we, for simplifying reasons, distinguished between the entities in
Brazil and all other foreign entities. For the Brazilian entities, income taxes were determined applying a
nominal tax rate of 34.0 % and taking into account the tax loss carryforwards of approximately
€ 98 million.
413. The calculation of income taxes for all the other foreign companies was summarised to simplify the
calculation. The income taxes were calculated applying a weighted average tax rate of 24.5 % for these
foreign entities. The total tax loss carryforwards of these other foreign entities of the MAN Group sum
up to € 207 million. To the extent these tax loss carryforwards can be used, they were deducted in the
determination of the relevant tax base.
414. The non-controlling interests result from Renk AG. MAN SE holds a capital share of 76.00 % of Renk AG.
Taking into consideration the stocks held by Renk AG itself, this results in an effective capital share of
approximately 78 %, so that a share of non-controlling interest of approximately 22 % was deducted.
415. For the detailed planning period retained earnings were considered in line with the financial planning of
the MAN Group. The company plans on average for the planning period a distribution ratio of approxi-
mately 31 % of the respective net profit of each period of MAN Group. The retained earnings will in par-
ticular be used to finance net current assets (that is expected to develop in line with revenues) and capi-
tal expenditures and to retire debt. Based on these assumptions retained earnings are not notionally
attributed to the net dividends for the shareholders, but taken into account as capital available for the

KPMG PwC
111
Xx
determination of capital requirements. Retained earnings are therefore implicitly considered in the cal-
culation of the interest result.
416. From 2018 onwards a sustainable average dividend distribution ratio of 50.0 % of the net income after
noncontrolling interests was assumed. This dividend distribution ratio is based on historical dividend
distribution ratios observed for German companies. Applying this assumption, the value resulting from
retained earnings is directly notionally attributed to the shareholder and thus does not result in any
changes of the sustainable net interest result of the MAN Group for the present valuation.
417. As the equity value is determined from the perspective of the company’s shareholders, the sharehold-
ers’ tax burden on dividends and capital gains (notionally added retained earnings) must be taken into
account.
418. When valuing German corporate entities, it must be taken into account that interest income as well as
dividend payments are subject to a uniform nominal tax rate of 25 % plus solidarity surcharge, regard-
less of the individual circumstances of the particular shareholder. The same applies for realised capital
gains for acquisitions since 1 January 2009.
419. Different effective tax burdens result due to differing times of cash inflows and realisation of capital
gains. The effective tax rate on interest income and dividend payments generally equals the nominal tax
rate. The effective tax rate on retained earnings leading to capital gains, however, depends on the effec-
tive date when the capital gains are being realised. The effective tax rate decreases with the holding
period of a share. Shareholders will therefore be tempted to lengthen the holding period of a share in
order to minimise the effective tax rate on capital gains. Consequently, the assumption of longer holding
periods in combination with the associated effect from discounting, leads to an effective tax rate on
capital gains that is significantly lower than the nominal tax burden of 25 % plus solidarity surcharge. We
therefore applied an effective tax rate equal to half of the nominal tax rate plus solidarity surcharge.
420. The growth-related retained earnings in the terminal value, take into account that the future growth of
balance sheet items associated with the expected growth of income statement items as well as the fi-
nancial surpluses is partly also financed with equity to retain a constant capital structure. The retained
earnings required to finance the expected balance sheet growth is therefore not to be included in the
value arising from the retained earnings directly attributed to the shareholders.

KPMG PwC
112
Xx
III. Determination of the discount rate
421. For business valuation purposes, future earnings are discounted to the valuation date, using an appro-
priate discount rate. The discount rate is based on the (expected) return on a comparable alternative
capital investment. The discount rate represents the minimum return on capital that the business must
realise in order to ensure that shareholders are not worse off than they would have been, if they had
invested in the next best alternative investment. When determining objectified business values, the
alternative investment and the corresponding return are generally characterised by an investment in a
bundle of publicly listed corporate shares (stock portfolio), adjusted to incorporate the risk structure of
the business subject to valuation. In the case of direct standardisation of personal income taxes, the
future earnings to be discounted are reduced for personal income taxes. In addition, the discount rate is
also to be applied after the deduction of personal income taxes.
422. When assessing returns on investments in shares, usually there is a need to distinguish between the
risk-free rate and the risk premium. The potential growth of the earnings subsequent to the detailed
planning period is to be assessed and taken into consideration as a growth rate deduction in the dis-
count rate.
1. Risk-free rate
423. In accordance with the recommendations of the IDW, we based the determination of the appropriate
risk-free rate on a yield curve, which we determined by taking into account the current interest rates as
well as interest structure data published by the German Federal Bank (Deutsche Bundesbank). The ap-
plied interest structure data consists of estimates, which have been calculated on the basis of observed
current yields of (quasi) risk-free coupon bonds, i. e. government bonds, government obligations and
treasury bills.
424. The determined interest rate curve establishes the connection between interest rates and terms to
maturity applicable for zero bonds with no credit default risk. The use of zero bond factors derived from
the interest rate curve that are appropriate in terms of maturity ensures the required equivalence with
the principle of equivalent maturity between the alternative investment and the future earnings subject
to valuation.
425. From the determined interest rate curve, we derived a uniform risk-free rate of about 2.50 % (pre per-
sonal income taxes), based on a three-month average (covering the period from January 2013 to March
2013), and taking into account the structure of the future earnings subject to valuation. The resulting
risk-free rate was rounded to ¼-percentage points in order to smooth short-term market fluctuations as
well as potential estimation errors, in particular regarding long-term returns on investments. Consistent
with the assumptions made in determining the risk premium, the risk-free rate is adjusted for the per-

KPMG PwC
113
Xx
sonal income tax rate, amounting to 25 % plus solidarity surcharge. This leads to a risk-free rate after
personal income taxes of 1.84 %.
426. Regarding possible valuation effects that might arise due to a change in interest rates in the time period
between the end of our valuation work and the day of the general shareholders’ meeting, the 6 June
2013, please refer to notes 486 and 502.
2. Risk premium
427. Entrepreneurial activities always involve risks and opportunities. Therefore, the future earnings cannot
be forecast with certainty. In order to consider these entrepreneurial uncertainties (entrepreneurial
risks), market participants require a risk premium in addition to the risk-free rate.
428. To ensure risk equivalence with the future earnings to be discounted, the determination of the risk
premium must be based on the risk structure of the entity subject to valuation.
429. In order to determine the risk premium for the entity subject to valuation and according to the defini-
tion of the alternative investment, reference can be made to models for establishing prices in capital
markets. These models allow an evaluation of the entity-specific risk premia, based on the market risk
premium derived for a market portfolio. Pursuant to professional standards, we applied the Tax Capital
Asset Pricing Model (Tax CAPM) to estimate the risk premium.
430. On the basis of the Tax CAPM, the entity-specific risk premium is obtained by multiplying the beta factor
of the entity subject to valuation with the market risk premium. The beta factor measures the corporate
risk in relation to the market risk. A beta factor above 1.0 means that the equity value of the company
responds more than average to market fluctuations. A beta factor below 1.0 reflects that the value re-
sponds, on average, less than proportionally to market fluctuations.
431. Considering current market observations, capital market studies and implicitly derived market risk
premiums based on forecasts by financial analysts and rating agencies as well as the currently applicable
tax legislation regarding the taxation of dividend payments and capital gains as well as the standardisa-
tion of the tax situation, we deem a market risk premium after personal income taxes of 5.5 % to be
appropriate. The approach is in line with the current statement of the Special Committee for Business
Valuation and Business Management (Fachausschuss für Unternehmensbewertung und Betrieb-
swirtschaft, in brief "FAUB") of the IDW, dated 19 September 2012. According to the aforementioned
statement, parameter changes attributable to the financial crisis have to be taken into consideration
when determining the risk premium, in particular an altered risk tolerance. In comparison to recent
years, this has resulted in higher market risk premiums at present.
432. As MAN SE is a publicly listed company, it is possible to estimate MAN SE’s beta factor by applying
appropriate econometric models. However, it must be taken into account that throughout the period

KPMG PwC
114
Xx
covered by our analysis, Volkswagen AG increased its interest in MAN SE. Thus, it cannot be ruled out
that MAN SE’s share prices are influenced by factors other than the original risk of the company and that
they are hence distorted (cf. section F.I). We have therefore determined the beta factor on the basis of a
peer group analysis.
433. Nevertheless, we have analysed the beta factor of MAN SE for plausibility purposes as well. We deter-
mined the beta factor of MAN SE based on data from the financial information service provider S&P
Capital IQ, a company of The McGraw-Hill Companies, New York City/USA ("CIQ"). On the basis of
monthly returns on investment of the common stock, the beta factor of MAN SE is approximately 1.30.
Considering average debt to equity ratios throughout the regression period and assuming full equity-
financing ("unlevered beta factor" or "beta factor for a debt-free entity"), we determined a beta factor
of approximately 1.10.
434. To derive the beta factor of the peer group, we have also relied on the capital market data of CIQ. As far
as the selection of the peer group is concerned, generally a comparison with companies from the same
industry, which offer similar products and are subject to comparable market structures, is appropriate. A
complete congruence with the peer group companies is neither possible nor necessary. However, future
cash flows of the peer group companies and of the entity subject to valuation should be subject to a
largely matching operational risk.
435. For purposes of the valuation of MAN SE, in a first step we have analysed the main business areas and
have determined key influential factors for the two business areas Commercial Vehicles and Power En-
gineering. In a second step, potential peer group companies, which operate in the same industry as
MAN SE were identified. Additionally, we considered the listing on a stock exchange as well as a suffi-
ciently liquid trading for our peer group selection. It has to be noted that it is generally not possible to
find two entities that are comparable in their entirety. However, we deem the level of operating risk
derived by the peer group analysis to be comparable overall.
436. Applying these selection criteria, we have identified the following ten peer group companies that are
comparable in their business activities to those of MAN SE:
AB Volvo
AB Volvo, Gothenburg/Sweden ("Volvo"), is a globally operating manufacturer of heavy commercial
vehicles. The company produces and sells trucks for medium and heavy transport for commercial and
construction purposes, compact and heavy construction equipment, buses and bus chassis, ship en-
gines, gas turbines and parts for aircraft engines. Moreover, Volvo offers its customers financing and
insurance services. In fiscal year 2012 Volvo generated revenues of € 35,241 million (2011:
€ 34,755 million) and an EBIT of € 2,045 million (2011: € 3,012 million). This is equivalent to an EBIT
margin of 5.8 % (2011: 8.7 %). The geographical distribution of revenues shows Europe (37 %) as the

KPMG PwC
115
Xx
strongest market, ahead of America (33 %), Asia (23 %) as well as Africa and the rest of the world (7 %).
With 63 %, the trucks division accounted for the majority of total revenues, followed by the construction
equipment division with 21 % and the bus division with 7 %.
Isuzu Motors Ltd.
Isuzu Motors Ltd., Tokyo/Japan ("Isuzu Motors"), builds and sells light to heavy transporters, buses and
shuttle buses, cars and diesel engines for automotive, industrial and maritime applications. Revenues for
the fiscal year 2012, which ended on 31 March 2012, were € 12,755 million (2011: € 12,117 million). An
EBIT of € 883 million (2011: € 610 million) was achieved. This is equivalent to an EBIT margin of 6.9 %
(2011: 5.0 %). The sales focus is on the Asian market. In fiscal year 2011, Isuzu Motors generated 70 % of
its revenues in Asia, with Japan contributing 40 % to total revenues. Accounting for 5 %, North America
was the second-biggest market of Isuzu Motors.
PACCAR Inc.
PACCAR Inc., Bellevue/USA ("PACCAR"), is a globally operating provider of light, medium and heavy
transporters as well as related spare parts and accessories. PACCAR also designs, produces and sells
diesel engines for trucks and offers its customers financial and leasing services. In 2012 PACCAR gener-
ated revenues of € 12,899 million (2011: € 12,629 million) and an EBIT of € 1,352 million (2011:
€ 1,312 million). This is equivalent to an EBIT margin of 10.5 % (2011: 10.4 %). The USA contributed 48 %
of total revenues. Europe and the rest of the world followed with 25 % and 27 % respectively.
Scania AB
Scania is a globally operating producer of trucks, buses and coaches as well as industrial and ship en-
gines. Furthermore, the company offers a wide range of services and financial services. Volkswagen AG
holds 71.81 % of voting rights and 49.29 % of the share capital of Scania. In fiscal year 2012 the company
generated revenues of € 9,569 million (2011: € 10,113 million) and achieved an EBIT of € 963 million
(2011: € 1,388 million). This result is equivalent to an EBIT margin of 10.1 % (2011: 13.7 %). The largest
market for Scania is Europe, where 52 % of revenues were generated, while America contributed 23 %
(mainly attributable to Latin America) and Asia 10 % to global revenues. The trucks division at Scania
contributed the largest share in revenues (61 %), while services and buses accounted for 21 % and 9 %
respectively.
Daimler AG
Daimler, is a German manufacturer of passenger cars and commercial vehicles of all kinds as well as a
provider of corresponding financial services. In the area of heavy trucks, Daimler is the global market
leader with a market share of about 15 %. In fiscal year 2012, Daimler was able to achieve revenues of
€ 114,297 million (2011: € 106,540 million) and generate an EBIT of € 8,615 million (2011:

KPMG PwC
116
Xx
€ 8,755 million). This is equivalent to an EBIT margin of 7.5 % (2011: 8.2 %). The largest share of reve-
nues was generated in Europe (34 %). This is followed by the NAFTA regions (North American Free Trade
Agreement: Canada, Mexico, USA) with 28 % and Asia with 22 %. At 52 %, the passenger car segment
contributes the largest share in revenues. The truck segment accounted for 26 % of 2012 revenues,
while financial services, vans and buses followed with 11 %, 8 % and 3 % respectively.
Hino Motors Ltd.
Hino Motors Ltd., Tokyo/Japan ("Hino Motors"), is a manufacturer of trucks, buses and diesel engines, in
which the Toyota Motor Corporation, Tokyo/Japan has a majority interest (50.2 % of share capital and
50.7 % of voting rights). In the trucks segment, Hino Motors produces light, medium and heavy trans-
porters for commercial and construction purposes. Diesel engines are assembled in the production of
Hino Motors’ trucks and buses but are also marketed for other industrial applications. In fiscal year
2012, which ended on 31 March 2012, the company generated revenues in the amount of
€ 11,976 million (2011: € 10,637 million), translating into an EBIT of € 190 million (2011: € 157 million).
This is equivalent to an EBIT margin of 1.6 % (2011: 1.5 %). Hino Motors’ main sales market is the do-
mestic Japanese market, with a revenue share of 68 %. A further 24 % of revenues are accounted for by
other Asian countries.
Navistar International Corporation
Navistar International Corporation, Lisle/USA ("Navistar"), is an international producer of medium to
heavy trucks and transporters for private, commercial, military and construction purposes, buses, diesel
engines and service parts for a large number of brands of trucks and mobile homes. Moreover, the
company offers financial services. In fiscal year 2012, which ended on 31 October 2012, Navistar gener-
ated revenues in the amount of € 10,009 million (2011: € 9,863 million) and an EBIT of -€ 691 million
(2011: € 451 million). This is equivalent to an EBIT margin of -6.9 % (2011: 4.6 %). With a revenue share
of 78 % in the USA and Canada, it becomes clear that the company has a major focus on its domestic
market, i.e. North America. With 61 %, the truck division, which comprises all products on four or more
wheels, makes up the majority of revenues, followed by the engines division (23 %), service parts (14 %)
and financial services (2 %).
Caterpillar Inc.
Caterpillar Inc., Peoria/USA ("Caterpillar"), is a globally operating manufacturer of construction and min-
ing machinery and vehicles, diesel and gas engines as well as industrial gas turbines. Moreover, the
group offers financing and insurance products via its financial products division. Caterpillar is divided
into the segments "Energy & Power Systems", "Construction Industries", "Resource Industries" and "Fi-
nancial Products". The "Energy & Power Systems" segment bundles the activities with engines, assem-

KPMG PwC
117
Xx
blies and turbines. The "Construction Industries" segment groups the design, production and sale of
construction machines, such as wheel and backhoe loaders or caterpillars. "Resource Industries" covers
vehicles and machines for mining. In fiscal year 2012 Caterpillar managed to generate revenues in the
amount of € 49,837 million (2011: € 46,439 million) and an EBIT of € 7,089 million (2011:
€ 6,161 million). The result is equivalent to an EBIT margin of 14.2 % (2011: 13.3 %). With 37 %, North
America has the largest share in revenues, followed by EMEA (24 %), Asia-Pacific (26 %) and Latin Amer-
ica (14 %). The "Energy & Power Systems" and "Resource Industries" segments each have a 32 % reve-
nue share, followed by "Construction Industries" with 29 % and "Financial Products" with 5 %.
Dresser-Rand Group Inc.
The Dresser-Rand Group Inc., Houston/USA ("Dresser-Rand"), is a global manufacturer of propulsion
technology products, such as engines, turbines and compressors. Moreover, the company operates in
the after-sales business. This covers the operation and maintenance of installed machines as well as the
related parts, and of power plants. In fiscal year 2012 the company achieved revenues in the amount of
€ 2,070 million (2011: € 1,785 million) and an EBIT of € 254 million (2011: € 200 million). This corre-
sponds to an EBIT margin of 12.3 % (2011: 11.2 %). In terms of geographical revenue distribution, with
33 % North America is ahead of Europe with 25 % and Latin America with 16 %. Asia-Pacific contributes
15 % to revenues and the Middle East and Africa 10 %. The revenue share of the propulsion technology
segment is 48 %.
Wärtsilä Corporation
Wärtsilä is an international manufacturer and provider of power plants and propulsion systems for
ships. In the "Services" segment, the company supports its customers during the service life of its prod-
ucts. The construction of power plants is grouped in the "Power Plants" segment. Propulsion solutions
for ships are brought together in the "Ship Power" segment. This includes ship design, engines, genera-
tors, reduction gears, propulsion technology, automation and power distribution systems as well as seal-
ing solutions. In fiscal year 2012 Wärtsilä was able to achieve revenues in the amount of € 4,725 million
(2011: € 4,209 million) and generate an EBIT of € 481 million (2011: € 445 million). This result is equiva-
lent to an EBIT margin of 10.2 % (2011: 10.6 %). From a geographical perspective, the company gener-
ates the largest share of its revenues (43 %) in the Asian market. Europe follows with 25 % and America
with 21 %. With 40 %, the "Services" segment contributes the largest share in revenues, followed by
"Power Plants" with 32 % and "Ship Power" with 28 %.
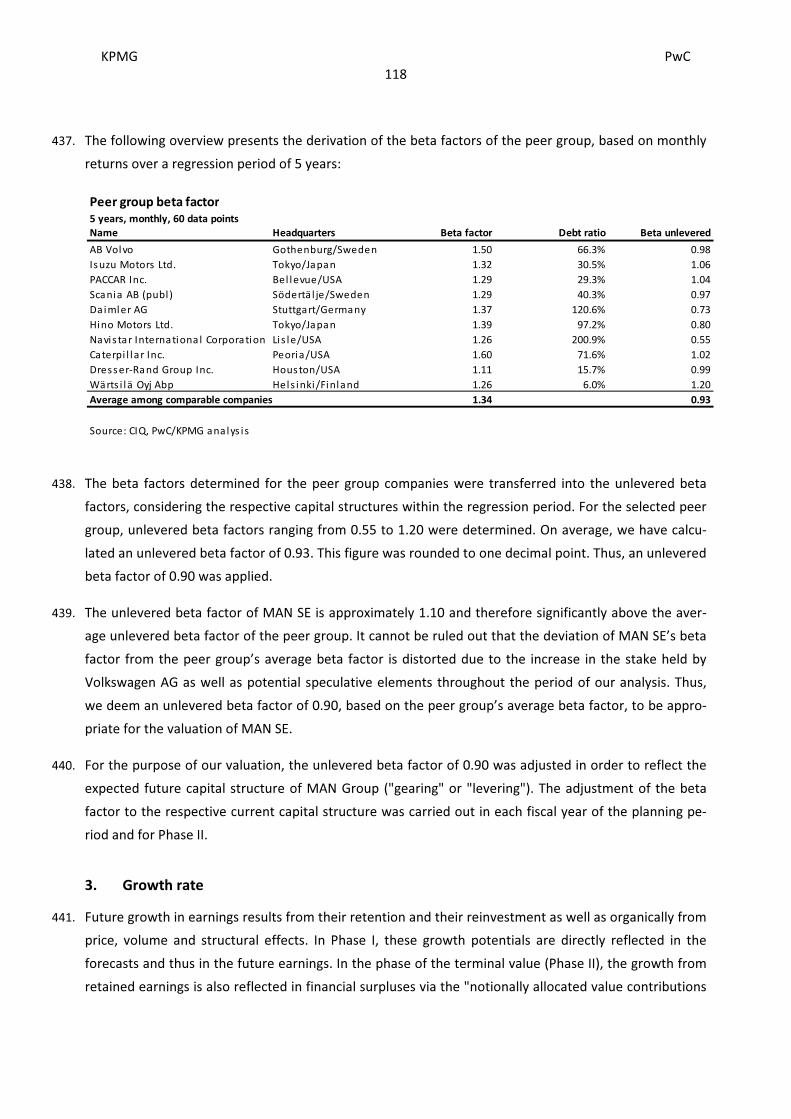
KPMG PwC
118
Xx
437. The following overview presents the derivation of the beta factors of the peer group, based on monthly
returns over a regression period of 5 years:
438. The beta factors determined for the peer group companies were transferred into the unlevered beta
factors, considering the respective capital structures within the regression period. For the selected peer
group, unlevered beta factors ranging from 0.55 to 1.20 were determined. On average, we have calcu-
lated an unlevered beta factor of 0.93. This figure was rounded to one decimal point. Thus, an unlevered
beta factor of 0.90 was applied.
439. The unlevered beta factor of MAN SE is approximately 1.10 and therefore significantly above the aver-
age unlevered beta factor of the peer group. It cannot be ruled out that the deviation of MAN SE’s beta
factor from the peer group’s average beta factor is distorted due to the increase in the stake held by
Volkswagen AG as well as potential speculative elements throughout the period of our analysis. Thus,
we deem an unlevered beta factor of 0.90, based on the peer group’s average beta factor, to be appro-
priate for the valuation of MAN SE.
440. For the purpose of our valuation, the unlevered beta factor of 0.90 was adjusted in order to reflect the
expected future capital structure of MAN Group ("gearing" or "levering"). The adjustment of the beta
factor to the respective current capital structure was carried out in each fiscal year of the planning pe-
riod and for Phase II.
3. Growth rate
441. Future growth in earnings results from their retention and their reinvestment as well as organically from
price, volume and structural effects. In Phase I, these growth potentials are directly reflected in the
forecasts and thus in the future earnings. In the phase of the terminal value (Phase II), the growth from
retained earnings is also reflected in financial surpluses via the "notionally allocated value contributions
Name Headquarters Beta factor Debt ratio Beta unlevered
AB Volvo Gothenburg/Sweden 1.50 66.3% 0.98
Is uzu Motors Ltd. Tokyo/Japan 1.32 30.5% 1.06
PACCAR Inc. Bel levue/USA 1.29 29.3% 1.04
Scania AB (publ ) Södertä l je/Sweden 1.29 40.3% 0.97
Da imler AG Stuttgart/Germany 1.37 120.6% 0.73
Hino Motors Ltd. Tokyo/Japan 1.39 97.2% 0.80
Na vis tar Interna tiona l Corpora tion Lis le/USA 1.26 200.9% 0.55
Caterpi l lar Inc. Peoria/USA 1.60 71.6% 1.02
Dress er-Ra nd Group Inc. Hous ton/USA 1.11 15.7% 0.99
Wärts i lä Oyj Abp Hels inki/Finland 1.26 6.0% 1.20
Average among comparable companies 1.34 0.93
Source: CIQ, PwC/KPMG ana lys i s
Peer group beta factor
5 years, monthly, 60 data points

KPMG PwC
119
Xx
of retention". In Phase II, additional growth potential is taken into account for valuation purposes by
allowing for a growth rate discount on the discount rate.
442. EIU economic forecasts expect inflation rates of 1.8 % to 2.3 % p. a. for Germany and the EU from 2013
to 2017. When evaluating MAN Group’s sustainable growth potential, several factors have to be taken
into account, such as projected volumes in the respective business areas, expected market shares and
pricing policies for newly acquired or renewed contracts. Furthermore, exchange rate developments are
relevant for foreign business activities. The MAN Group generally assumes constant foreign exchange
rates as at the valuation date. Thus, it is implicitly assumed that the possible deterioration of a foreign
currency, which is a planning currency, such as the Brazilian Real compared to the Euro, will be compen-
sated by a corresponding inflationary growth of cash flows in the respective home country. The same
rationale must be valid for the determination of the sustainable growth rate. Thus, the sustainable
growth rate must overall correspond to the level of growth in the Euro-zone.
443. We assume MAN Group’s sustainable average growth rate to be 1.0 %. The growth rate is below ex-
pected inflation rates for Germany and the EU. This is due to fierce competition as well as the partially
tense markets.
4. Derivation of the discount rate
444. The derivation of the discount rates is summarised in the following table. Changes in the risk premium
result from changes in the underlying financial structure of the company in the detailed planning period
as well as in the phase of the terminal value:
MAN SE
Cost of capital Terminal Value
2013E 2014E 2015E 2016E 2017E from 2018
Risk-free rate 2.50% 2.50% 2.50% 2.50% 2.50% 2.50%
Personal income tax from risk-free rate -0.66% -0.66% -0.66% -0.66% -0.66% -0.66%
Risk-free rate, net of sharholder income tax 1.84% 1.84% 1.84% 1.84% 1.84% 1.84%
Market ri sk-premium, net of persona l income tax 5.50% 5.50% 5.50% 5.50% 5.50% 5.50%
Debt to equity ratio 25.10% 24.75% 22.61% 18.83% 15.62% 10.64%
Beta relevered 1.06 1.10 1.08 1.04 1.03 0.98
Risk premium 5.82% 6.06% 5.95% 5.70% 5.67% 5.40%
7.66% 7.90% 7.79% 7.55% 7.51% 7.24%
Termina l growth rate -1.00%
7.66% 7.90% 7.79% 7.55% 7.51% 6.24%
Source: PwC/KPMG analysis
Cost of equity, net of personal income tax
Cost of equity, net of personal income tax, after growth discount

KPMG PwC
120
Xx
IV. Value of operating assets
445. The discounted dividend value of the operating assets of MAN SE as at 6 June 2013 can be derived from
the net distributions to shareholders to be discounted, the value contribution from profit retention and
the period-specific discount rates (adjusted for the capital structure).
446. In order to determine the present values of the net distributions, the projected earnings must be dis-
counted individually for each fiscal year from 2013 to 2017. Regarding the average distributable earn-
ings as well as the notionally added value from profit retention from fiscal year 2018 onwards, the pre-
sent value is calculated according to the formula for the terminal value. The present value of the termi-
nal value also has to be discounted to the valuation date.
447. As at the valuation date 6 June 2013, the value of the operating assets of MAN SE under the dividend
discount method amounts to € 11,831 million in total.
V. Value of the separately valued assets
1. Properties and buildings
448. Non-operating assets in terms of IDW standard S 1 as amended in 2008 are assets which can be freely
disposed of without affecting the actual corporate business (functional differentiation criterion). These
non-operating assets have to be valued separately. Taking these guidelines into account, real property
and buildings which are non-essential for the operational business, i.e. which do not relate to produc-
tion, administration, sales etc., were identified as non-essential operating assets. Apart from investment
property with a fair value of approximately € 64 million, land in South America with a fair value of ap-
proximately € 7 million was classified as non-operating asset. Investment property mainly comprises
company premises, residential buildings and hereditary building rights that are not used by MAN Group
any more. Taking corporate income taxes on capital gains into account (no application of personal in-
come taxes), the total value for non-operating property amounts to approximately € 57 million.
MAN SE
Determination of the discounted dividend value Terminal Value
€ million 2013E 2014E 2015E 2016E 2017E from 2018
Net dividend payments to be discounted 138 165 295 328 379 944
Discount rate 7.66% 7.90% 7.79% 7.55% 7.51% 6.24%
Present va lue factor 0.929 0.861 0.799 0.743 0.691 11.066
Present value 128 142 236 244 262 10,451
Discounted dividend value as at 31 December 2012 11,462
Accumulation factor 1.032
Discounted dividend value as at 6 June 2013 11,831
Source: PwC/KPMG analysis

KPMG PwC
121
Xx
2. Corporate tax credit
449. As at 31 December 2012, MAN SE has a corporate tax credit of approximately € 8 million, which pre-
sumably will be paid out until 2017. Discounted to the day of the general shareholders’ meeting in 2013,
the corporate tax credit amounts to approximately € 7 million.
450. Thus, the total of non-operating assets and separately valued items were included at approximately
€ 64 million.
VI. Equity value
451. Taking the discounted dividend value of the operating assets as well as the value of the separately
valued assets into account, the equity value of MAN SE as at 6 June 2013 is calculated as follows:
452. As at the valuation date 6 June 2013, the equity value of MAN SE amounts to € 11,894 million.
VII. Liquidation value
453. In case it proves to be more advantageous to separately dispose of all operating assets and non-
operating assets in comparison to a valuation under the going concern premise, the liquidation value
should form the basis for the valuation to the extent that there are no legal or actual constraints. This
approach is at least applicable if the entity no longer conducts an operating business and solely consists
of non-operating assets (OLG Düsseldorf 4 October 2006- I-26 W7/06 AktE). Although the going concern
premise is assumed to be valid for the valuation at hand, MAN SE’s liquidation value was roughly deter-
mined on the basis of the most recent available information regarding the net asset position of the
Special items
€ million
Non-operating assets 57
Corporate tax credi t 7
Special items 64
Source: MAN SE, PwC/KPMG analysis
Equity value
€ million
Discounted dividend value as at 6 June 2013 11,831
Special items 64
Equity value as at 6 June 2013 11,894
Source: MAN SE, PwC/KPMG analysis

KPMG PwC
122
Xx
company from the consolidated financial statements as at 31 December 2012. In this respect, it was
reviewed whether the liquidation value exceeds the equity value based on the dividend discount
method. The corresponding calculations are described below.
454. The value of the assets is determined by the market for the assets to be liquidated. In our calculations,
we assumed that the fixed assets can be disposed of almost at the carrying amount. Deferred tax assets
were assumed to be not recoverable due to their inability to be used. For reasons of simplification we
assumed the carrying amounts as at 31 December 2012 as estimate for a liquidation value for other
assets,while taking into account the reduced proceeds resulting from receivables and inventories when
determining the liquidation value.
455. Furthermore, for the determination of the liquidation value, trade names and patents of the MAN
Group must be considered. Since these intangible assets are internally generated, they generally cannot
be capitalised in the balance sheet. Nevertheless, it is possible to sell trade names and patents. To de-
termine the liquidation value of the intangible assets, we have taken into account the fair value of the
trade names on the basis of notional royalty payments. Furthermore, we have calculated a rough esti-
mate of the fair value for patented technology.
456. The company’s debts must be deducted from the assets determined on this basis. For reasons of simpli-
fication, these were, except for deferred tax liabilities, which are generally without value in the case of
liquidation, considered at their balance sheet value as at 31 December 2012. Additionally, the costs aris-
ing from liquidation, e.g. winding-up costs and social plan expenses must be deducted. At the same
time, it should be taken into consideration that the liquidation phase is associated with considerable
costs with at the same time decreasing revenues. The liquidation value assessed on this basis is signifi-
cantly below the dividend discount value and is therefore irrelevant for the valuation of MAN SE and the
derivation of the value per share.

KPMG PwC
123
Xx
E. Plausibility assessment of the equity value on the basis of multiples
I. General approach
457. The valuation practice uses simplified valuation procedures based on market multiples to assess the
plausibility of the valuation results on the basis of the dividend discount method or a DCF method. The
value of a company based on market multiples is determined by the product of key financial figures of
the company and the respective multiple.
458. Appropriate multiples can be derived from capital market data of stock exchange listed comparable
companies ("peer group") or from comparable transactions and applied to the company subject to
valuation. However, it is important to remember that in general no company is fully comparable to an-
other. Therefore, valuations based on multiples are generally used to determine a range of possible
equity values comprising the actual equity value. For transaction multiples it needs to be considered
that actually paid purchase prices are highly dependent on the subjective expectations of the involved
parties. Therefore, they can for example reflect expected synergies and other subjective expectations.
Hence, the relevance of transaction multiples for the assessment of the plausibility of an objectified
equity value is generally lower than that of trading multiples. Correspondingly, we only considered com-
parable companies for the following analysis.
459. For market-based valuation approaches multiples can be derived based on different key figures:
• EV/revenues (enterprise value to revenues): Enterprise multiple, can offset differences resulting
from company specific capital structures to a certain extent and assume an almost equivalent oper-
ating profit margin. The enterprise value comprises the equity value defined as a market value of
equity as well as the market value of net debt and therefore differs from the equity value that is de-
termined in the present valuation.
• EV/EBITDA (enterprise value to earnings before interest, taxes, depreciation and amortisation): En-
terprise multiple, can offset differences resulting from company specific capital structures, assumes
comparable capital expenditures for depreciating assets and possibly smoothes differing investment
cycles.
• EV/EBIT (enterprise value to earnings before interest and taxes): Enterprise multiple, can offset dif-
ferences resulting from company specific capital structures.
• P/E (Price-earnings multiple): Equity multiple, focusing on the companies’ earning potential after all
expenses (in particular after interest and taxes) as a reference to determine the equity value. The
multiple therefore requires comparable capital structures.

KPMG PwC
124
Xx
460. For the market-based valuation the same peer group as for the derivation of the beta factor was consid-
ered. For the selection criteria please refer to the description in note 434 et seqq.
II. Derivation of the multiples
461. While the dividend discount method explicitly uses the expected future cash flows to determine the
equity value, multiples are generally based on forecast revenues or earning figures of a single base year
in the near future. Longer-term earnings expectations, characteristic earnings development and risks are
reflected in the multiple. Under certain assumptions, income-based approach and market-based ap-
proach can lead to the same result.
462. Crucial factors of a market-based valuation are the forecast key figures and the peer group selection to
determine the respective multiples.
463. Among the peer group companies, there are partly differences between the actual operating margins
achieved in the past and achievable future operating margins. As the EV/revenues multiple does not
consider the cost structure of the company to be valued, this multiple is of only limited validity for the
plausibility assessment of the present equity value and was therefore not considered.
464. The explanatory power of the price-earnings multiple is affected by the capital structure and various tax-
related issues. Both aspects can basically be avoided by applying enterprise multiples. We have there-
fore not applied price-earnings multiples.
465. Accordingly, we considered EV/EBITDA and EV/EBIT multiples of the peer group companies for the
market-based valuation of MAN SE. The enterprise value used for the calculation of EV/EBITDA and
EV/EBIT multiples comprises the market capitalisation plus interest-bearing debt, net pension liabilities
and noncontrolling interests of the peer group companies less cash and cash equivalents.
466. To derive the multiples we have considered the average EBITDA and EBIT estimates of the peer group
companies for the fiscal years 2013 and 2014 as provided by the financial information provider CIQ. At
the time our valuation was performed, the number of EBITDA and EBIT estimates available for the peer
group companies for fiscal years after 2014 was not sufficient.

KPMG PwC
125
Xx
467. The following multiples of peer group companies were determined:
III. Multiple valuation
468. In order to derive the enterprise value, the determined multiples of the peer group companies are
multiplied with the key figures EBITDA and EBIT expected for MAN Group in fiscal years 2013 and 2014:
Multiples
2013 2013 2014 2014 2013 2013 2014 2014
EV EBITDA EV/EBITDA EBITDA EV/EBITDA EBIT EV/EBIT EBIT EV/EBIT
Peer group € m. € m. multiple € m. multiple € m. multiple € m. multiple
AB Volvo 37,927 4,023 9.4x 4,943 7.7x 2,395 15.8x 3,310 11.5x
Isuzu Motors Ltd. 8,642 1,402 6.2x 1,570 5.5x 1,093 7.9x 1,228 7.0x
PACCAR Inc. 17,230 1,364 12.6x 1,579 10.9x 1,020 16.9x 1,120 15.4x
Scania AB (publ) 20,960 1,522 13.8x 1,710 12.3x 1,160 18.1x 1,350 15.5x
Daimler AG 122,548 12,830 9.6x 14,549 8.4x 7,887 15.5x 9,377 13.1x
Hino Motors Ltd. 6,207 867 7.2x 1,028 6.0x 511 12.1x 628 9.9x
Navistar International Corporation 5,641 365 15.4x 702 8.0x 173 32.6x 493 11.4x
Caterpillar Inc. 79,319 7,953 10.0x 9,326 8.5x 5,897 13.5x 6,895 11.5x
Dresser-Rand Group Inc. 4,116 441 9.3x 543 7.6x 378 10.9x 466 8.8x
Wärtsilä Oyj Abp 7,630 699 10.9x 753 10.1x 566 13.5x 625 12.2x
Minimum 4,116 365 6.2x 543 5.5x 378 7.9x 466 7.0x
Median 12,936 1,383 9.8x 1,575 8.2x 1,093 13.5x 1,174 11.5x
Mean 31,022 3,147 10.4x 3,670 8.5x 2,323 13.8x 2,549 11.6x
Maximum 122,548 12,830 15.4x 14,549 12.3x 7,887 18.1x 9,377 15.5x
The abnormal value of EV/EBIT multiple for Navistar International Corporation in 2013 was not considered in the analysis.
Source: CIQ
Valuation based on market comparables
2013 2014 2013 2014
EV/EBITDA EV/EBITDA EV/EBIT EV/EBIT
multiple multiple multiple multiple
Minimum 6.2x 5.5x 7.9x 7.0x
Median 9.8x 8.2x 13.5x 11.5x
Mean 10.4x 8.5x 13.8x 11.6x
Maximum 15.4x 12.3x 18.1x 15.5x
EBITDA incl . income from investments 1,196 1,692
EBIT incl . income from investments 694 1,150
Enterprise value, € million
Minimum 7,376 9,314 5,490 8,089
Median 11,680 13,924 9,353 13,200
Mean 12,489 14,395 9,581 13,375
Maximum 18,484 20,745 12,543 17,844
plus specia l i tems 64 64 64 64
plus cash and cash equivalents 1,367 1,367 1,367 1,367
less financia l l iabi l i ties and pens ions -4,244 -4,244 -4,244 -4,244
less noncontrol l ing interests -139 -139 -139 -139
Market value of equity, € million
Minimum 4,423 6,361 2,538 5,137
Median 8,727 10,972 6,401 10,248
Mean 9,537 11,442 6,629 10,422
Maximum 15,532 17,793 9,590 14,892
Source: CIQ, PwC/KPMG analysis

KPMG PwC
126
Xx
469. Based on the median and average EV/EBITDA multiples of the peer group companies, the enterprise
value of MAN SE is in a range between € 11,680 million and € 14,395 million. To determine the market
value of equity, interest-bearing liabilities, noncontrolling interests and the net pension liabilities of the
MAN Group as at the valuation date are deducted, while any existing cash and cash equivalents and the
value of special items of the MAN Group are added. The resulting equity value (market value of the eq-
uity), is in a range between € 8,727 million and € 11,442 million. The determined equity value based on
the dividend discount method plus the value of special value items of the MAN Group of in total
€ 11.894 million is thus above the equity value range of the EBITDA-multiple valuation.
470. Based on the median and average EV/EBIT multiples of the peer group companies, the enterprise value
of MAN SE is in a range between € 9,353 million and € 13,375 million. To determine the market value of
equity, interest-bearing liabilities, noncontrolling interests and the net pension liabilities of the MAN
Group as at the valuation date are deducted, while any existing cash and cash equivalents and the value
of special items of the MAN Group are added. The resulting equity value (market value of the equity), is
in a range between € 6,401 million and € 10,422 million. The determined equity value based on the divi-
dend discount method plus the value of special items of the MAN Group is thus above the equity value
range of the EBIT-multiple valuation.
471. The lower equity values resulting from the market-based valuation can mainly be explained by the
intrinsic assumptions of multiple valuation assuming both comparable growth prospects and compara-
ble risk profiles of the peer group companies. The growth expectations of the MAN Group with regard to
EBITDA and EBIT are, to some extent, significantly above the expected growth rates of the peer group
companies. Thus, the dividend discount value is above the equity value based on market expectations.
The market-based valuation therefore clearly shows the ambitious character of the financial planning
figures of the MAN Group as well as the relatively low earnings level of the MAN Group at the beginning
of the detailed planning period.

KPMG PwC
127
Xx
F. Determination of appropriate cash compensation pursuant to § 305
AktG and the recurring compensation payment pursuant to § 304
AktG
I. Share price
472. With regard to the decision of the Federal Constitutional Court (BVerfG) on 27 April 199910, the share
price of the entity to be valued should be compared to the value per share based on the dividend dis-
count method for the purpose of determining the cash compensation. According to the decision of the
BVerfG, an existing market price shall not be disregarded when determining the cash compensation.
Hence, the market price basically forms the lower limit of the appropriate cash compensation. A lower
value may only be considered, if the market price exceptionally does not reflect the fair value of the
entity to be valued. The decision of the BVerfG was confirmed and further specified by the decisions of
the Federal Court of Justice ("BGH") on 12 March 200111 and on 19 July 201012.
473. The following graph shows the market price developments of common and preferred shares of MAN SE
for the period from 1 January 2009 to 1 April 2013:
Source: Capital IQ, KPMG-PwC-Analysis
10 File No. 1 BvR 1613/94, BVerfGE 100, 289 et.seq.
11 File No. II ZB 15/00, ZIP 2001, Page 734-737.
12 File No. II ZB 18/09, NJW 2010, Page 2657-2660.
0
500
1,000
1,500
2,000
2,500
3,000
3,500
4,000
4,500
5,000
0
20
40
60
80
100
120
€
MAN SE common and preferred shares
Trading volume (common shares, in thousands) Trading volume (preferred shares, in thousands)
Closing price (common shares) Closing price (preferred shares)
13.04.12: Ad-hoc
communication of MAN
SE.
VW AG acquires further
shares in MAN SE
31.05.11: VW AG submits
a mandatory offer
for MAN SE
9.1.13: MAN SE ad-hoc
communication on BGAV

KPMG PwC
128
Xx
474. According to the decision of BGH on 12 March 2001, the determination of the respective share price is
generally based on a reference price obtained from the average market prices over a period of three
months prior to the general shareholders’ meeting, which will decide on the matter. However, this is
only possible if not contradicted by certain impacts. The use of average prices is supposed to eliminate
possible manipulative influences as well as short-term distortions. The decision of the BGH of
12 March 200113, which was strongly criticised in legal literature, was corrected by the decision of the
BGH on 19 July 2010 to the effect, that henceforth the share price used as the basis for appropriate cash
compensation has generally to be determined as a weighted average price of a three-month reference
period prior to the announcement date of the matter on hand.
475. During the three-month reference period (see note 474) between 9 October 2012 and 8 January 2013 -
the last trading day prior to the public announcement of the intention to conclude a domination and
profit and loss transfer agreement – trading volume of common and preferred shares of MAN SE was
recorded on all trading days. Hence, there is no evidence in the case on hand, that individual sharehold-
ers were unable to sell their shares at the stock exchange due to low trading volumes. In addition, there
is no evidence that these market prices were manipulated. However, it was observed that the share
prices of the common and preferred shares increased prior to the mandatory offer of Volkswagen AG
dated 31 May 2011 as well as prior to the public announcement of the acquisition of additional shares in
April 2012. A further increase of common and preferred share prices was observable in connection with
the public announcement dated 9 January 2013 regarding the intended domination and profit and loss
transfer agreement. Overall, there are no indications that these market prices could be considered as
not being relevant as specified by law when determining the appropriate cash compensation in accor-
dance with § 305 AktG.
476. The weighted average share prices determined according to § 31.7 WpÜG in conjunction with § 5.3
WpÜG-Angebotsverordnung and published by the Federal Financial Supervisory Authority, Bonn
(Bundesanstalt für Finanzdienstleistungsaufsicht or "BaFin"), for the three-month period between
9 October 2012 and 8 January 2013 amounted to € 79.08 per common share and € 73.39 per preferred
share of MAN SE.
13 BGH ZIP 2001, 734.

KPMG PwC
129
Xx
477. The following share price movements could be observed from 9 October 2012 to 8 January 2013:
MAN SE common and preferred shares
Source: BaFin, Capital IQ, PwC/KPMG-Analysis
478. In case of a longer time gap between the public announcement of the matter and the day of the general
shareholders’ meeting as well as indications based on the share price development which would imply
that adjustments are required, the BGH decided that the share price would have to be extrapolated in
accordance with the general or industry specific performance, considering the share price development
from the date of announcement of the matter. Since the time period between the announcement of the
intention to conclude a domination and profit and loss transfer agreement on 9 January 2013 and the
general shareholders’ meeting of MAN SE on 6 June 2013, which decides on the matter, merely amounts
to approximately five months, the above described decision of the BGH is not applicable. This time
frame is solely required for the determination and the audit of the appropriate cash compensation and
the appropriate recurring compensation payment as well as to prepare and convene the general share-
holders’ meeting within the stipulated period. Hence, an extrapolation of share prices is not required in
the case on hand.
479. By its decision on 27 April 1999 the BVerfG noted that the actual price paid by the dominant shareholder
for the shares in the controlled company may not be considered when determining the value of the
share ownership in order to calculate the appropriate cash compensation in accordance to § 305 AktG,
since this price regularly does neither relate to the "true" value of the share ownership of the outside
shareholder, nor to the fair value of the shares. The subjective considerations of a shareholder, who is
willing to accept excessive prices within the course of a measure in accordance with corporate law, are
55
60
65
70
75
80
85
55
60
65
70
75
80
85
€
Volume weighted share prices (common shares) Volume weighted average share prices over 3 months (common shares)
Volume weighted share prices (preferred shares) Volume weighted average share prices over 3 months (preferred shares)

KPMG PwC
130
Xx
of no importance to third parties. This opinion is adopted by the prevailing view in legal literature as
well as in decision made by the highest court. A similar decision was taken by the Court of Justice of the
European Union (Europäischer Gerichtshof or "EuGH") on 15 October 200914. According to the EuGH, the
Community law does not include any general principle of law under which outside shareholders are
protected by an obligation of the dominant shareholder, when acquiring or exercising control of a com-
pany, to acquire their shares under the same conditions as those agreed upon when a shareholding con-
ferring or strengthening the control of the dominant shareholder was acquired.
II. Determination of the appropriate compensation
480. MAN SE has issued common as well as preferred shares of a total of approximately 147 million shares.
The preferred share is entitled to a preferred dividend of € 0.11 as opposed to the common share. In ex-
change, bearers of preferred shares do not have voting rights except for cases prescribed by law (see sec-
tion C.I).
481. Based on the planned dividend payments by MAN SE, preferred shares have no economic advantage as
compared to common shares, since the planned dividends of at least approximately € 1.25 per share are
significantly higher than the preferred dividend right of € 0.11. In contrast – considering the Truck & Bus
GmbH share of more than 75 % of the common shares of MAN SE – there is no relevant legal advantage in
having voting rights, as decisions at the general shareholders’ meeting can be approved solely by the
shares held by the Truck & Bus GmbH.
482. Thus, there are neither relevant exclusive characteristics for common nor preferred shares. We there-
fore conclude an equal treatment of common and preferred shares to be appropriate. Observable dif-
ferences in the share prices are mainly attributable to the inclusion in different share indices as well as
the higher liquidity of the common shares.
483. The equity value of MAN SE of € 11,894 million as at 6 June 2013 was allocated equally to the total
number of shares of MAN SE of 147,040,000 shares. The resulting value per common and preferred
share is therefore € 80.89.
484. According to the case law of the Federal Constitutional Court ("BVerfG") the share price generally repre-
sents the lower limit for the compensation. In the present case the cash compensation has to be deter-
mined based on the pro rata share of the equity value of MAN SE, since the pro rata share according to
the dividend discount method of € 80.89 is above the relevant share price of € 79.08 for common shares
and € 73.39 for preferred shares (regarding the share price see note 476). Therefore, we consider an
amount of € 80.89 per share (common and preferred shares of MAN SE) as an appropriate cash com-
pensation in accordance with § 305 AktG.
14 Rs. C-101/08, AG 2009, S. 821 ff.

KPMG PwC
131
Xx
485. The determination of the cash compensation according to the dividend discount method is based on the
information received until the end of our work. However, our results will have to be adjusted, in case of
any events occurring in the period between the end of our work and the day of the general sharehold-
ers’ meeting on 6 June 2013, which affect the value of the cash compensation.
486. Due to the currently dynamic development of the economic environment and the associated effect on
interest rate conditions, changes to the risk-free rate - applied in accordance with the relevant valuation
principles – in the period between the signing of our joint expert opinion and the date of the general
shareholders’ meeting, which decides on the matter, cannot be excluded. A change in the risk-free rate
by +/-0.25 % results in a change in equity value by approximately 4 % (approximately € 3.50 per share).
As a consequence of these uncertainties, we provide a scenario analysis along with our results, which
considers the effect of risk-free rates of 2.75 % and 2.25 %. For reasons of simplification, we assumed all
other valuation parameters and procedures to remain unchanged. This applies in particular for possible
effects that might offset the change in interest rates, i.e. value-reducing effects of a declining interest
rate. The following table gives an overview of the values per share based on these assumptions:
Risk-free rate: Equity Value per share
(common and preferred shares)
2.75 % € 77.57
2.50 % € 80.89
2.25 % € 84.43
487. Applying a risk-free rate of 2.75 % would result in a compensation per common share of € 79.08, since
the relevant average share price is higher than the value per common share according to the dividend
discount method. However, the value per preferred share would be € 77.57 based on the higher divi-
dend discount value.
III. Determination of the appropriate recurring compensation payment
488. According to § 304 AktG, a profit and loss transfer agreement (same applies to domination and profit
and loss transfer agreements) must include a clause determining an appropriate compensation payment
for the outside shareholders in the form of a recurring payment (recurring compensation payment)
based on an outside shareholder’s pro rata share of the share capital. According to § 304.2 sentence 1
AktG the recurring compensation payment must at least ensure an annual payment of the expected
profit share attributable to each share considering the company’s past earnings position as well as its
future earnings potential, taking into account reasonable depreciation and valuation allowances, how-
ever without allocating any other revenue reserves. According to § 304.1 sentence 2 AktG in the case of

KPMG PwC
132
Xx
a pure domination agreement without an obligation to transfer profits and losses ("isolated domination
agreement"), the dominant company has to guarantee an appropriate dividend representing an annual
profit share based on the appropriate compensation payment to the remaining shareholders. According
to the draft version of the domination and profit and loss transfer agreement such an isolated domina-
tion agreement is intended for the fiscal year 2013 of MAN SE, in case the domination and profit and
loss transfer agreement becomes effective in 2013 upon registration with the Commercial Register
(Handelsregister).
489. Generally, a company’s earnings position varies throughout the years. The volatility of earnings is ade-
quately reflected in the forward-looking discounted dividend value. This value reflects all payments be-
tween shareholders and the company considering interest and tax payments. For companies generating
profits, these payments are considered as dividends to the shareholders. In order to smooth the ex-
pected dividend payments, the legislator does not require an annually changing payment according to
the fluctuating earning expectations, but the payment of an expected average profit share per share.
Hence, the average profit per share shall consider this earnings volatility, in order to smooth these fluc-
tuations by way of a uniform average amount.
490. The recurring compensation payment was calculated as an annuity of the determined equity value of
MAN SE. With regard to the recurring compensation payment "without allocating any other revenue
reserves" according to § 304.2 sentence 1 AktG, it needs to be considered that the assumed retained
earnings do not reduce the discounted dividend value, which is the basis for the determination of the
recurring compensation payment, and therefore do not reduce the recurring compensation payment
either.
491. In its resolution dated 21 July 2003 the BGH15 decided that the outside shareholders shall be granted a
(fixed) compensation equalling the average distributable proportion of the gross profit per share less
corporate income tax (according to the applicable tax rate) to be paid by the company. The resolution
states in detail that the profit equals the profit before corporate income tax which represents the base
for the deduction of the statutory relevant amount of corporate income taxes. Furthermore in the BGH’s
view the annuity of the equity value has to be determined applying the full risk-adjusted discount rate.
Assets which have to be considered separately – in particular non-operating assets – should not be
taken into account when determining the recurring compensation payment.
492. Parts of this resolution that concerned one individual case for which the corporate income tax imputa-
tion system, which was applied until 31 December 2000, was relevant are not generally applicable. The
(usually volatile) future earnings of MAN SE are reflected in the company’s equity value taking into ac-
count the chronological sequence of the earnings as well as separately valued assets and non-operating
assets. The equity value therefore represents the payments between the company and the sharehold-
15 AktZ. II ZB 17/01, ZIP 2003, 1745.

KPMG PwC
133
Xx
ers. In particular, it does not appear appropriate - notwithstanding the above mentioned procedure
outlined by the BGH - that value is permanently withdrawn from the shareholders by not considering
non-operating assets. To determine the recurring compensation payment demanded by law, the annual
compensation payment was determined therefore calculated as an annuity of the equity value of MAN
SE as at 6 June 2013. This procedure ensures that the non-operating assets are also part of the recurring
compensation payment.
493. Furthermore, the above-mentioned decision of the BGH does not consider that the recurring compensa-
tion payment – at least during the period of the contract – is more or less risk-free. Hence, an annuity
based on a fully risk-adjusted discount rate (before personal income tax) is not appropriate. In the case
of a domination and profit and loss transfer agreement there is regularly the risk of the dominant com-
pany terminating the agreement and the illiquidity of the dominant company. From that point of view,
the future recurring compensation payment is not completely risk-free. Furthermore there is the risk,
that the earning potential of the company is reduced throughout the duration of the contract and that
the shareholder participates in a company of reduced value after the contract is terminated.
494. To reduce these risks, § 5.6 included in the draft of the domination and profit and loss transfer agree-
ment between the Truck & Bus GmbH and MAN SE, determines that upon the termination of the con-
tract the entitled compensation of the outside shareholders will be reinstated with the contractually
fixed amount of € 80.89 for each common and preferred share. In this special case the business risk of a
reduced value of the MAN SE shares is therefore not applicable to the outside shareholders on conclu-
sion of this contract as long as the Truck & Bus GmbH is able to pay the appropriate compensation upon
termination of the contract. Upon termination of the contract the outside shareholders temporarily
have the option to demand the appropriate compensation offered at the time of the conclusion of the
profit and loss transfer agreement or alternatively to remain shareholder and again participate in the
business risk of MAN SE. As a result, the risk profile of the outside shareholders corresponds to that of a
bondholder after the conclusion of the profit and loss transfer agreement. As the recipient of the ap-
propriate compensation has to bear the default risk of the debtor of the appropriate compensation, in
this case based on the Letter of Affiliation and Comfort (see also § 7 of the domination and profit and
loss transfer agreement) the default risk of the Volkswagen AG, it is appropriate to derive the annuity
factor based on the default risk (credit rating) of Volkswagen AG.
495. The interest rate for the annuity (annuity factor) equals the total of the risk-free rate and an appropriate
credit spread reflecting the default risk (credit rating).
496. To objectively determine the credit spread we therefore considered the bonds issued by the Volks-
wagen International Finance N.V., Amsterdam/The Netherlands, a 100 % subsidiary of Volkswagen AG,
with long-term maturities. Amongst others we considered the € denominated bond issued in March
2013 maturing on 22 March 2033. The analysed bonds are guaranteed by Volkswagen AG. Throughout

KPMG PwC
134
Xx
the last months credit spreads of up to 1.30 % could be observed for these kinds of bonds compared to
default-free government bonds of equivalent maturities.
497. In total, considering the risk-free rate we have based the calculation of the recurring compensation
payment on an interest rate (annuity factor) of 3.80 % before personal income tax.
498. Due to partially tax free income, future earnings of the MAN Group are not in total subject to German
corporate income taxes. According to the specifications of the BGH the expected distributable average
gross profit is therefore to be divided into a component with German corporate income tax burden and
a component without a German corporate income tax burden. This breakdown is derived on an alterna-
tive derivation of the equity value of MAN SE considering respectively not considering corporate income
taxes plus the resulting solidarity surcharge. Afterwards the equity value of MAN SE can be divided into
a component with corporate income tax plus solidarity surcharge and a component without these taxes.
499. The determination of the appropriate recurring compensation payment is shown in the following chart:
500. The appropriate recurring compensation payment according to § 304 AktG therefore equals € 3.30 for
each common share and preferred share (pro rata gross profit per share) less corporate income tax in-
cluding solidarity surcharge to be paid by MAN SE. The applicable corporate income tax rate including
solidarity surcharge at the time of the conclusion of the contract is 15.825 %; resulting in a corporate
income tax deduction of € 0.23 for each common and preferred share. Assuming the corporate income
tax rate remains unchanged at 15.0 % and the solidarity surcharge at 5.5 %, the recurring compensation
payment is € 3.07 for each common and preferred share (net recurring compensation payment per
share).
501. The determination of the recurring compensation payment according to the dividend discount method
is based on the information received until the end of our work. However, the valuation will have to be
adjusted, in case of any events occurring in the period between the end of our work and the day of the
Determination of appropriate recurring compensation payment (incl. corporate income
tax and solidarity surcharge)
with corporate
income tax and
solidarity
surcharge
without
corporate
income tax and
solidarity
surcharge Total
Equi ty va lue as at 6 June 2013 (€ mi l l ion) 4,653 7,242 11,894
Number of shares (common and preferred shares) 147,040,000 147,040,000 147,040,000
Equi ty va lue per share, € 31.64 49.25 80.89
Appropriate recurring compensation payment per share, € (net of personal income tax,
net of corporate tax and solidarity surcharge), annuity factor 2.798% 0.89 1.38 2.26
Personal income tax 26.375% 0.32 0.49 0.81
Appropriate net recurring compensation payment per share, € (before personal income
tax, net of corporate income tax and solidarity surcharge) 1.20 1.87 3.07
Corporate income tax incl . sol idari ty surcharge 15.825% 0.23 - 0.23
Appropriate gross recurring compensation payment per share, € (before personal
income tax, before income corporate tax and solidarity surcharge ) 1.43 1.87 3.30

KPMG PwC
135
Xx
general shareholders’ meeting on 6 June 2013, which affect the value of the recurring compensation
payment.
502. In the following we also show scenarios for the recurring compensation payment which alternatively
considers the effect of risk-free interest rates of 2.75 % and 2.25 % respectively. For reasons of simplifi-
cation we assumed that all other valuation parameters and procedures remain unchanged. This applies
in particular for possible offsetting effects, which have not been taken into account. Amongst others the
development of the credit spread used to calculate the recurring compensation payment is uncertain
until the day of the general shareholders’ meeting that decides on the matter. The following table gives
an overview of the net recurring compensation payment per share based on these assumptions:
Risk-free rate: Net recurring compensation payment per share
(common and preferred shares)
2.75 % € 3.14
2.50 % € 3.07
2.25 % € 3.00

KPMG PwC
136
Xx
G. Summary of results
503. The result of our joint expert opinion on the equity value of MAN SE can be summarised as follows:
• The management board of Truck & Bus GmbH has appointed PwC and the executive board of MAN
SE has appointed KPMG to prepare a joint expert opinion on the equity value of MAN SE as well as
on an appropriate recurring compensation payment and cash compensation in accordance with
§ 304 AktG, § 305 AktG, respectively.
• As at the valuation date 6 June 2013, the equity value of MAN SE amounts to approximately
€ 11,894 million. Based on the current number of 147.040.000 shares issued by MAN SE, the equity
value per common share and preferred share amounts to € 80.89.
• The average share price of MAN SE is € 79.08 per common share as well as € 73.39 per preferred
share for the three-month period between 9 October 2012 and 8 January 2013. These are lower
than the determined equity value of each share and hence, not relevant for the determination of
the cash compensation.
• The appropriate cash compensation in accordance with § 305 AktG amounts to € 80.89 per common
and preferred share.
• A domination and profit and loss transfer agreement shall include a recurring compensation pay-
ment based on the outside shareholder’s pro rata share in share capital. According to § 304.1, sen-
tence 1, § 304.2, sentence 1, the net recurring compensation payment for each common and pre-
ferred share is € 3.07 and in accordance with the case law of the BGH, the appropriate gross recur-
ring compensation payment for each common and preferred share is € 3.30.
• The determination of the appropriate recurring compensation payment as well as the cash compen-
sation using the discounted dividend method is based on the information provided to us until the
end of our valuation work. The values should be adjusted accordingly, if events should occur during
the period between the end of our valuation work and the day of the general shareholders’ meet-
ing, which could have an influence on the amount of the recurring compensation payment as well as
the cash compensation.
KPMG PwC
137
Xx
504. We have prepared this joint expert opinion on the basis of the documents made available to us, the
information given to us as well as the results of our own investigations.
505. We provide this joint expert opinion to the best of our knowledge and belief with reference to the basic
principles, as they are recorded in §§ 2 and 43 of the Law Regulating the Profession of Wirtschaftsprüfer
(Wirtschaftsprüferordnung).
Munich, 18 April 2013
This English version serves only as an explanatory note and shall not be signed by us.
In case of any inconsistencies between the German and English version of our joint expert opinion,
the German version shall prevail.