joint iet/erb fellowship and professional …repository.out.ac.tz/133/1/huria_journal_v… · web...
TRANSCRIPT
HURIAJournal of The Open University of Tanzania
Volume IX JUNE, 2011 ISSN 0856 6739
COVER SKETCH TO BE REPLACED ON
PRINTING
The Open University of TanzaniaP. O. Box 23409
DAR ES SALAAMTANZANIA

HURIAJournal of The Open University of Tanzania
Volume IX. JUNE, 2011 ISSN 0856 6739
The Open University of TanzaniaP. O. Box 23409
DAR ES SALAAMTANZANIA


Editorial Board
Prof. M. D. Varisanga Chairperson/Editor, Faculty of Science, Technolgy and Environmental Studies, The Open University of Tanzania
Dr. C. Muganda Institute of Continuing Education, The Open University of Tanzania
Dr. E. Babyegeya Faculty of Education, The Open University of Tanzania
Mr. P.P. Lipembe Faculty of Arts and Social Science, The Open University of Tanzania
Prof. N.N.N. Nditi Faculty of Law, University of Dar es Salaam
Dr. A. Nyamora University of Dar es Salaam
Editorial Office
The Open University of Tanzania,Kawawa Road, Kindondoni Municipality,P. O. Box 23409,Dar es Salaam, TanzaniaTel: (255) 022-2668835, 022-2668820Fax: (255) 022-2668759Website: http://www.out.ac.tz
© The Open University of Tanzania 2008All rights reserved.
NOTE
Opinions expressed in this journal are those of the authors and not necessarily those of the publishers – The Open University of Tanzania.

Contents
Editorial i v
The Impact of Visual Tools in Teaching Programming to Novices: The Case of Random Access Memory (RAM) Diagrams
Leonard J. Mselle 01
Inspirations from Nature in the Development of New Materials for the FutureE.T. Bisanda 11
Development and Applications of Insect Pest Management Technologies in Stored Crops: A Contribution T=to Integrated Pest Management
C.P. Rugumamu 17
Flower Colour Inheritance in Nicotiana Alata (Solanaceae) and its use as a Genetic Marker for Gene Flow Studies
Margaret Mollel1 and Teklehaimanot Hailesesalssie2 33
Reproductive Performance, Mineral and Body Condition Status of Smallholder Dairy Cattle in Rungwe District, Tanzania
A. A. Gimbi1, A. E. Kimambo2, N. L. Kanuya3, L. A. Mtenga2, G. H. Laswai2 and J. Madsen4 39
Natural Forest Regeneration, Stocking Structure and Uses of Tree Species: The Case of Munene Forest Reserve in Bukoba Rural District, North Western Tanzania
D. B. Fungameza 47
Evaluation of Mosquito Traps for Sampling Man-biting Mosquitoes in Rufiji District, Tanzania
1E.S.P. Kigadye, 2G. Nkwengulila 3S. Magesa, 4S. bdullah 61
Heavy Metal Levels in Drinking Water: Mining Area vis-à-vis Poorly Planned City in Tanzania
I.A. Tarimo1 and J. A. Saria2 70Characteristics and uses of Solar Home Systems in Selected Un-Electrified Rural Villages in Muleba District, Tanzania
D. P. Ikwaba 80
Editorial
iii
Dear esteemed readers, I am cordially introducing you to a special volume of Huria Journal which carries a combination of scientific papers. This was done deliberately to encourage scientists to publish in the Huria Journal and do away with the notion that the Huria Journal is meant for Open and Distance Learning only. Actually, as the name Huria means in Kiswahili, the Journal is open for any subject area. May I also take this opportunity to appreciate the job well done by the editorial team whose tenure has come to an end. They did a commendable job in carrying the journal from a local context to international status. Presently the Journal accepts articles from all over the world.
The article by Mselle focuses on the impact of visual tools in teaching programming to novices. The article articulates the challenges faced in teaching and understanding programming. The paper emphasizes that when teaching programming visual tools improve the understanding of programming to novices. Mselle recommends a more forceful campaign to combine RAM diagrams with lectures and laboratory work in teaching programming to overcome apathy among novices. Bisanda’s paper is a review article in which he explores on how nature can inspire human mind to develop smart material of the future. The articles brings awareness on how research and development of engineering systems based on imitations of natural bio-mechanical systems in plants and animals could be utilized to intricate tasks not possible at present.
Rugumamu’s article critically analyses developments and applications of technologies in the management of insect pests of stored crops. She argues that when wisely employed these technologies can play a great role in increasing food security, environmental conservation, reduction of poverty and ultimately improving the people quality of life. Mollel and Hailesesalssie paper is a research article which investigated Flower colour inheritance in Nicotiana Alata (Solanaceae). They performed reciprocal and backcrosses to confirm their findings that flower colour in Nicotiana alata, can be used as an easily interpreted morphological marker, in the following combination: red x white, red x lime green, lime green x white and pink x white.
Gimbi and others endeavoured to establish the causes of suboptimal reproductive performance (RP) of dairy cows and heifers kept by small-holder farmers and investigated possible intervention measures. Their findings conformed suboptimal reproductive performance (RP) in the dairy cows and the study suggested supplementation of deficient minerals. Fungameza’s paper is a research paper which investigates natural forest regeneration. Among other things the paper proposes that local community be involved in conservation of forests. In addition the study investigated the sustainability of natural species for timber and other forest products.
Kigadye and others evaluates the sampling efficiency of mosquito traps for sampling man-biting mosquitoes in Rufiji District Tanzania. The study validates the
iv

use of CDC light traps as an alternative for human biting catches in the estimation of the entomological inoculation rates (EIR) and vectorial capacity (VC) in malaria transmitting mosquitoes in the study area. Tarimo and Saria have researched on high heavy metal levels in drinking water in a mining area (Mererani) and a poorly planned city (Dar es Salaam) in Tanzania. The Heavy metals in the mining area is attributed to decay, decomposition and leaching of old used materials while heavy metals in drinking water in Dar es Salaam is attributed to untreated waste products and age of pipes. The last contribution in this special issue of Huria Journal is by Ikwaba. The author recommends the use of solar electricity in un-electrified remote villages in Tanzania as a more viable alternative to grid electricity. The paper discusses technical problems and how they can be resolved.
Finally, the Editorial team record its appreciation for the voluntary work done by various distinguished academicians, who have accepted to review the articles found in this very issue. It is our hope that from this range of articles, you will find the current volume stimulating or challenging, and may even provoke you to consider our Journal in your future academic publications.
Prof. M.D. VarisangaEditor-in-ChiefHuria Journal
v

The Impact of Visual Tools in Teaching Programming to Novices: The Case of Random Access Memory
(RAM) DiagramsLeonard J. Mselle
School of Informatics and Virtual EducationThe University of Dodoma, Box 259 Dodoma Tanzania
Abstract: In this paper, manual Random Access Memory (RAM) diagrams are demonstrated; an experiment to test their impact on teaching programming to novice students is carried out. Chi Square-Test is carried out on means between two groups (experiment and control). Results are presented and discussed.
Key words: Teaching Programming, Visual tools, RAM Diagrams, Novice programmers.
INTRODUCTIONBackground
Difficulties in teaching and understanding programming Problems faced by novice programmers together with general difficulties inherent in learning programming have been widely covered in the literature [1,2,12]. Andrew Scott et al state that it is a well-established fact that many students find introductory programming concepts difficult to master [3].
The reason, some researchers contend, is due to multiple issues that a student is required to master simultaneously. Kirsti Ala-Mutka states that the art of programming includes knowledge of programming tools and languages, problem- solving skills and effective strategies for programme design and implementation [1]. With such multiple issues to tackle, it is easy for students to become overwhelmed and demotivated [3].
Leslie J. Waguespack Jr. reported that poor programming skills and a complete inability to write program after two or even three years’ study appeared to be a common problem to most computer science students. He maintains that most computer science students graduate with weaknesses reflected in: Insufficient prior knowledge in the fundamental concepts and general
programming principles poor understanding of basic codes general lack of confidence in writing any programme due to poor memory of
syntax [6].
A survey carried out at the Kigali Institute of Science and Technology (KIST) in 2005 and 2006 revealed that more than 99.2% of graduates in computer science shunned the programming projects. More than 95% did not want to pursue any career that involved programming. This is in consistence with what is said in the literature.
1
Solution from Visual ToolsVisualization solutions in programming education have received wide attention. Various researches have announced results in favour of such tools [2,3,6,8].
An extensive literature review concerning the use of visual tools in programming is found in the work by Kirsti Ala-Mutka. In this work, the author covers a wide range of challenges inherent in teaching programming as well as possible solutions that visual tools can provide [1].
Ben Ari et al have shown that animation tools have improved leaning of elementary programming. Employing an animation tool called ‘Jeliot 2000’ they found evidence that the improvement was due to the rich concrete terminology that the animations supplied [8].
Similar tools, with slight variations in their focus, have been devised and their results have been favourable.
Andrew Scott et al. introduced an on line tool that perform flow chart simulation. In this work, they argued that their effort was focused on overcoming the weaknesses of algorithmic problem solving and subsequent development of source code. They further assert that flow charts have been traditionally used to visualize programming structure and that they are excellent to a novice. They contend that flow charts are easily understood with little or no prior training and provide the novice with an accurate mental model of an algorithm [3].
In related works, but with emphasis on the ‘roles of variables’, Sajaniemi et al employed visualization to test the effect of the concept of ‘roles of variables’ in teaching programming. In this research they reported positive results [7,9]. Supporters of visual tools have argued that such tools are essential in developing mental models for novices. Such mental models, they confirm, are imperative for programmers to develop abstract representations of processes in the form of logical structures [1,2,8,11].
The current situation in Tanzania and RwandaSo far, lectures and laboratory work are invariably the exclusive method used in teaching programming in Tanzania, Rwanda and most certainly, elsewhere in Africa. Visual tools, with exception of flow charts are rare. A survey of 57 programming books done in two Tanzanian universities - University of Dar es Salaam (UDSM) and The University of Dodoma (UDOM) and two Rwandan universities - National University of Rwanda (NUR) and Kigali Institute of Science and Technology (KIST) found that only three titles had employed RAM diagrams to complement lectures and laboratory work. However, these titles did not employ such diagrams consistently.
When lecture notes from 26 lecturers from these Universities were checked for visual tools, only one lecturer had employed RAM diagrams. Fourteen out twenty six had used flow charts. The remaining had not complemented their lectures with any type of visual aids.
2

These findings lead to the conclusion that the practice of using RAM diagrams to enhance comprehension, has yet to capture sufficient attention of mainstream programming teaching. The evidence shows that flow charts are still the only prevalent visual tool used to complement code statements. The reason could be one or combination of the following;
The current programming books, which play a key role oi curricula design, are still too much language–focused at the expense of pedagogical concerns vis a vis comprehension. The few books that happen to include RAM diagrams, have not presented the concept in a consistent manner. Such diagrams are not employed methodically, so as to be followed throughout the introductory course. They are rather presented in isolated fashion, only helping to address one isolated programming concept such as, arrays or parameter passing between functions, etc.
Most curricula are designed to respond more to specific programming languages rather than to the pedagogical challenges of making programming comprehensible to novices.
Most of present visual tools are more available in soft form, i.e. (program animation) rather than in hard (paper/book) form. Availability of such tools in books would have quickened their dissemination and popularise their use because books and papers are still the major means of content presentation.
The effectiveness and impact of RAM diagrams has not been sufficiently popularized.
The above scenario called for the effort to devise and test some elementary visual tools in the form of RAM diagrams. These diagrams were used to complement lectures and laboratory work in teaching programming to novices. The aim is to provide the novices with the image of variables in the computer memory during different phases of code writing, compilation and execution. These images are employed consistently by the lecturer throughout different stages of the course.
OBJECTIVESThis paper presents a sample of manual RAM diagrams that were employed in teaching and learning programming in KIST. The diagrams depict the effect of each code statement in relation with the variables in the computer memory. This depiction is expected to show the variable’s behaviour in response to each statement. Such depiction is expected to simplify the teaching and understanding of the code to novices.
Furthermore, an experiment is carried out to measure the impact of employing RAM diagrams in teaching programming. Data from a group of students who are taught employing RAM diagrams and another group that is taught without employing such tool are compared. Chi Square test is carried out to determine whether there is significant impact on the process of understanding of the subject, as well as student’s competency and confidence in coding when RAM diagrams are employe to teach them.
3

METHODS
Description of RAM Diagrams The RAM diagrams comprise three main parts. The first part is the heading, stating the aspect of programming that is being demonstrated i.e. Variable declaration, data feeding, selection, etc. The second part is the RAM-image which is represented by contiguous square cells (rectangles). The third part is the piece of code associated with its impact on the memory variables.
The effect of the code-statement on memory cells is shown by depicting such effect on the corresponding RAM-cells. Below are RAM diagrams depicting the effect of two statements:1. The first code segment is about variable declaration with statements like int x;
etc. The associated RAM diagram depicts the link that is established between a memory cell and the variable names; ‘x’ and ‘y’ as a result of variable declaration statements (int x; char y;).
2. The second piece of code is about data feeding with statements such as x=5; etc. Changes of the contents in respective variables are depicted by a corresponding RAM diagrams.
Figure 1: Example of RAM DiagramsRAM Diagram (1) Variable declaration RAM Diagram (2) Data Feeding int x; x=5; char y; y= ‘a’;
The size and format of these diagrams is freely chosen by the lecturer depending on the aspect that is being covered. These diagrams are manually drawn during or before lectures and laboratory sessions. They may also be prepared by using software such as Power Point or MS Word. The important condition is that they are employed consistently throughout the introductory part of the course to cover all preliminary aspects of programming ranging from variable declaration, data feeding, flow of control (sequence, bifurcation and looping), functions, arrays and file handling.
Advantages of RAM Diagrams1. In order to employ or understand them, RAM diagrams do not require students
to learn any new concept.
x Reserved
y Reserved
Free
Free
Free
Free
x 5
y a
Free
Free
Free
Free
4

2. RAM diagrams portray a direct relationship between the code statement and its effect on the memory variable.
3. Roles of variables, are tacitly expressed by RAM diagrams when demonstrating the aspects of flow of control, arrays and functions.
4. Their incorporation in the curricula requires neither additional time nor additional tools (software or hardware).
5. RAM diagrams are not machine dependent. They can be employed within or outside computer environment. This gives them advantage of portability and flexibility and therefore adaptability and spread.
The ExperimentLectures and laboratory worksA total of seven hundred and four (704) students and nine lecturers were involved in the experiment.
A group of 64 students (experimental/variable group) composed of randomly selected–students pursuing electrical engineering, were lectured and tutored while applying RAM pictures. This group was assigned to one lecturer who was competent in the usage of these pictures.
The remaining 640 students (control group) were lectured and tutored without using the diagrams by various lecturers. All lectures were based on the same syllabus Introduction to C programming. The sample was taken from first year students pursuing first degree in various engineering and science disciplines.
Lectures and laboratory work were carried out within the same semester. For the experimental group, lectures and laboratory work were conducted by the same lecturer. For the control groups, laboratory work was conducted by different tutorial assistants. Lecture hours, tutorials and laboratory work were the same for all students.
Every week, all students were required to submit written codes in relation to previous lectures and laboratories. In total, twelve code segments were demanded from each student. The assignments were identical.
Their ability to code and submit the assignments on time was recorded to determine both the interest and competency in the subject on the student’s side. This was done during the entire semester. Observation was divided into three phases and results were recorded and summarised in a graph (Ref. Chart No. 1).
Final examinationAt the end of the course, a common final examination was given to all students. The examination had a total of eight questions. Students were asked to choose any five questions. Each question had a section for both theoretical knowledge and coding. Coding formed ¾ of each question. In order to minimise bias, it was ensured that:
5

(a) The lecturer of the experiment group was excluded from setting and grading the final examination;
(b) No single question in the examination had been attempted before by the students in the experimental group (this condition did not apply to control groups);
(c) No student was notified of this study.
Ability to understand questions and student’s confidence to tackle them was measured by recoding all queries posed by students. Respective invigilators were requested to tape record all queries posed by students. At the end of examination, these queries were given to the researcher. The questions were categorized as follows:(a) Queries that indicate lack of understanding of examination by student (i.e. I do
not understand this question). These are shown as Q1 in Table 1. The smaller percentage for such queries indicates confidence and understanding of the subject by students;
(b) Queries that seek clarification due to obvious mistakes (i.e. I think semi colon or a brace is missing in this code). These are shown as Q2 in the table. The bigger percentage of such queries indicate, confidence and sufficient level of understanding of the subject;
(c) Queries that seek clarification due to tacit ambiguity (i.e. this condition/expression is out of array boundary). These are shown as Q3 in Table 1. Bigger percentage of such queries indicate high degree of understanding and high confidence in the subject;
(d) To complement the above, at the beginning of the examination, all lecturers were requested to administer a one-question interview to examinees and record the results. The question was, “who thinks that he/she can tackle this exam easily?” Results from this question are presented as Q4 in Table 1. A larger percentage of students who are confident in tackling the exam indicates more confidence and understanding of the subject;
(e) Comparison was done on examination results to determine the difference in performance between the experiment and control groups. The base score is 55%. This is shown as Q5 in Table 1. The more the number of students with scores equal or above 55% is, the higher the level of understanding of that group in programming. Results from experiment are presented in Table No. 1 and summarised by graphs in Charts 2 and 3.
6

RESULTS AND DISCUSSION
Observation
Chart No. 1: Comparison of student’s ability to code and submit assignments in time
0%
10%
20%
30%
40%
50%
60%
70%
80%
WK1 To 4 WK 5 To 9 WK 10 To 14
Control
Experiment
In the first four weeks, as shown in Chart No 1, the number of students who were still interested in the subject was not very different between the two groups (10% gap). As time went on, the number of students with interest increased from 54% to 65% in the experiment group while it shrank to 12% in the control group. This difference continued to the end of the course, with a gap of 66%.
The experiment Table No. 1 presents the number of queries in percentages, and overall performance in the final examination between the experiment group and the control group.
Table No 1: Percentages of different queries posed by students during final examination
Queries Q1 Q2 Q3 Q4 Q5
Control Group 50% 14% 0% 14% 14%
Experiment group 2% 30% 50% 80% 64%
Queries that were categorised as Q1, classified as uninformed queries, were more prevalent in the control group compared to experimental group. Chart No. 2 reflects the difference between the experimental group and the control group.
7

Chart No. 2: Comparison of percentages of uninformed queries posed by students in the final examination
0%
10%
20%
30%
40%
50%
60%
Q1
Control
Experiment
Queries that are grouped as Q2, and Q3, categorised as informed queries are used to measure the student’s confidence and mastery on the subject. The more there are such queries the more informed the group is.
Regarding ability by students to detect obvious errors, as represented by Q2, the experiment group was 26% more capable as compared to the control group.
On the capacity of students to detect tacit errors, represented as Q3, the margin is 50% in favour of experiment group.
The confidence, to tackle questions as measured by Q4 in the interview, is 76% higher on the part of the experiment group.
The experiment group is 50% better on the number of students with a score equal or above 55% in the final examination.
Chart No. 3 summarises the differences observed between the two groups.
8

Chart No. 3. Comparison of percentages of informed queries, and answers from interview during the final examination
0%
10%
20%
30%
40%
50%
60%
70%
80%
90%
Q2 Q3 Q4 Q5
ControlExperiment
Chi square ResultsThe chi square test was performed on the above data to determine the significance of the difference between the means of the two groups.
At the level of confidence 95% the chi square value obtained was 3.39 with the degree of freedom 2. This, indicate a significant difference between the means of the two groups.
CONCLUSIONSThe presented RAM pictures are simple enough to be adopted without any alteration of curricula. They are portable and adoptable for various examples in different media–i.e, on paper, on teaching board and on machine provided they convey the image of variable behaviour in the computer memory.
Results from the experiment showed that students who were taught by combining RAM diagrams with lectures and laboratory works were consistently interested in the subject. The majority– above 70%, found it easy to do their assignments and their confidence and understanding of the subject was undiminished.
To the contrary, students who were taught without RAM diagrams lost their interest on the subject much earlier. More than 76% had difficulties gaining competence and at the end the majority had lost interest in the subject. As indicated by the results, use of RAM diagrams, had a positive impact, on teaching and understanding programming. The statistical results on the performance in the examination show an improvement of over 55%.
9

The Chi square test results support the idea of using visual tools, and in particular, RAM pictures in teaching programming to enhence understanding and comprehension.The overall results are consistent with the idea that, when employed consistently and methodically in teaching programming, visual tools improve the teaching and understanding of programming to novices.
RECOMMENDATIONSI would recommend a more forceful campaign to combined RAM diagram with lectures and laboratory work in teaching programming to overcome the apathy among programming novices. The popularity and systematic use of these tools is lagging behind. It is therefore useful that further studies be done to find out ways of making their use popular in consonance with their effectiveness.
References
Ala-Mutka, K. (2003). “Codewitz, Needs Analysis”, http://www.cs.tut.fi/~ edge/literature_study.pdf. (accessed, Dec 2007)
Ben-Ari, M. and Sajaniemi, J. (2003). “Role of variables from the perspective of computer science educators “ http://cs.joensuu.fi/pub/Reports/A-2003-6.pdf (accessed, Dec 2007).
Scott, A., Watkins, M. and Duncan McPhee (2005). “A Step back from Coding – An Online Environment and Pedagogy for Novice Programmers”, http://www.ics. heacademy.ac.uk/events/jicc11/scott.pdf (accessed, Dec 2007)
Deitel, H.M. and Deitel, P. How to program with C++, and Java, 3rd.ed., Pearson Education Inc, New Delhi, 2000.
Lafore, R. Turbo C++, Galgotia Publications, New Delhi, 1994.Leslie J. Waguespack, Jr. (1989). “Visual metaphors for teaching programming
concepts”, ACM SIGCSE Bulletin, v.21, n.1, p.141-145.Stutzle, T. and Sajaniemi, J. (2005). “An empirical evaluation of visual metaphors
in the animation of roles of variables”, http://inform.nu/Articles/Vol8/v8p087 -100stut.pdf (accessed, Dec 2007).
Ben Bassat Levy R., Ben Ari M,. and Uronen P, (2001). “An extended experiment with Jeliot 2000”. In Proceeding of the First International Program Visualization Workshop, University of Joensuu Press, Pavoo Finland, pp: 131-140.
Sajaniemi, J. and Hu, C. (2005) ” Teaching programming: Going beyond “objects” first” . http://www.ppig.org/papers/18th-sajaniemi.pdf (accessed, Dec, 2007)
Venugopol, K.R. & Kumar, Mastering C++, McGraw-Hill, New Delhi, 2001 Tudoreanu M, (2003). “Designing Effective Program visualization tools for
reducing users cognitive effort”. In proceeding of 2003 ACM Symposium on software Visualization, ACM Press, San Diego, California.
Soloway, E. and Spoher, J. Studying the Novice Programmer, Laurence Erlbaum Associates, Hillsdale, New Jersey, 1989.
Kann, C. Lindeman, R. and Heller R. (1997). “Integrating Algorithm Animation into a Learning environment”, Computers and Education, Vol. 28 issue 4, Elsevier Science Ltd. Oxford, pp 223-228.
10

Westphal B., Harris, F. and Fadali, M. (2003). “Graphical Programming: A Vehicle for Teaching Computer Problem solving”, 33rd ASEE/IEEE Frontiers in Education Conference, Colorado, p.
Inspirations from Nature in the Development of New Materials for the Future
E.T. BisandaFaculty of Science, Technology and Environmental Studies,
The Open University of TanzaniaP.O. Box 23409 Dar es Salaam
Abstract: The natural world presents the most sophisticated but efficient examples of smart machines that defy common understandings of mechanics of machines. By emulating these physical examples, scientists and engineers have been to design machines that can fly like birds, dive like sharks, etc. The new generation of materials called smart materials is a result of intricate studies made on natural systems, that resulted in development of materials that can mimic nature.
In this paper, a review is made of several examples where smart materials have changed our world. These include piezo-electric materials, electro- and magneto- rheostatic materials, auxetic materials, photochromic materials, halochromic materials, and smart clothing materials. Examples of smart phenomena in nature that can be used for development of future materials are also presented. These include the termite mound, geckos feet, the basilisk lizard, and the spider silk. The papers goes to show that the extent to which we can emulate nature to design mechanical systems that can do intricate tasks not possible at present.
Key words: smart materials, biomimetics, piezo-electric, gecko tape, spider silk.
INTRODUCTIONDevelopment in the human society has always been associated with landmark technologies and materials that are dominant during that era. Thus we saw the stone, bronze, and iron ages that we use to describe human history on basis of materials that were used for making tools. The industrial revolution in the western world was only possible after discovery of efficient ways of producing iron and steel massively, new technologies for smelting non – ferrous alloys, processing of plastics, and more recently, composite materials.
Due to increased knowledge in the internal structure of materials, new processing techniques were innovated, new materials emerged, and engineers were able to develop sophisticated machines and structures such as the internal combustion engine, the gas turbine, and millions of electromechanical gadgets that surround our world today. Today, it is even hard to imagine how we survived in the past without electricity, radio, mobile phones, email, TV, etc. Yet, all these came about due to inventions and improvements in materials processing, and increased understanding of the natural world, from which new systems evolved. The future of advanced
11

materials and new technologies is dependent on our ability to mimic nature and natural system, in the same way we learnt to design planes by looking at how and why birds fly.
Material scientists use four interrelated areas of structure, properties, processing, and performance to develop new materials. The structure relates to how the atoms (or molecules), crystals, and phases are arranged. They investigate their size, orientation, and perfection. There are only about 100 different kinds of atoms (elements) in the universe, and materials formed from these atoms depend largely on how they are put together. For example, the charcoal left after a fire, graphite in a pencil, diamonds in jewellery, and carbon nanotubes, are all made of carbon atoms put together in different ways.
Properties of a material, including the strength, toughness, hardness, conductivity, melting point, etc. are all strongly dependent on the structure. Other properties of interest are optical, electrical and electronic behaviour.
Processing relates to how the material is made – whether it is cast, drawn, moulded, machined, or fabricated. During processing, the material is subjected to heating, cooling, or pressure. Each of these is likely to alter the shape while also modifying the internal arrangement of atoms, crystals or phases. As a consequence of changes in the internal structure, the properties will also change.
Performance is a measure of how well a material functions in its intended use. For example, a high performance material will be one that has maximum specific strength (strength to density ratio), the best resistance to environmental degradation (resistance to heat, moisture, radiation, etc), or one that improves the overall reliability of the product/system. The performance of a material can be modified by the introduction of thin films or coatings to surfaces, or injecting atoms of a foreign element into the near surface. An example is the razor blades produced by Gillette, which have a surface coating applied to maintain a sharp cutting edge while improving corrosion resistance. Gears are often subjected to surface hardening by the addition of nitrogen or carbon atoms at the surface to improve resistance to wear. Another example is that of polymer light-emitting diodes, or polyLEDS. Previously, LEDs were only available in red or green. Today, any colour in the visible spectrum can be made by modifying the structure of the polymer – such as poly(p-phenylenevinylene) or poly(flourene) – or by adding dyes to the polymer to change the colour of light emitted.
This paper looks at potential technologies of the future, which will be based on imitating natural systems, i.e. use of lessons from living organisms to design mechanical and electromechanical systems for performing difficult tasks that are not yet possible with existing technology.
SMART MATERIALSSmart materials are a new generation of materials that try to mimic materials and structures of the natural living world. Most of the materials familiar to us, are ‘dumb’, because they have been processed and designed to offer only a limited set
12

of responses to external stimuli. Even the most advanced composites such as glass or carbon fibre reinforced plastics, can only be tailored to a single combination of properties. ‘Dumb’ materials and structures contrast sharply with the natural world, where animals and plants have a very clear ability to adapt their environment in real time. Thus a new field of materials research called biomimetics has emerged, which looks at the extraction of engineering design concepts from biological materials and structures, so as to come up with new materials of the future. The concept is to evolve truly ‘smart’ or intelligent response, allowing a flexible structure to adapt its form in real time, such as to minimize the effects of an external force or changes in the environment, in order to prevent catastrophic collapse.
Thus, smart materials are those that respond to stimuli in their environment, such as temperature, light, magnetic fields, or electrical currents. We may start to think of advances such as a self-repairing house, antennae that bend towards the signal, liquids that solidify when heated, and cans that can be crushed and then regain their original shape under heat – so – called shape memory metals. Let us examine a few examples of smart phenomena and related materials.
Piezo-electric materialsPiezoelectric materials are crystalline materials that have the ability to generate a voltage when stress is applied and vice-versa. Such materials are now in common use is electromechanical transducers, such as generation of ultrasonic waves, digital timers, and various sensors of external forces in measuring systems. Another useful example in our everyday life is the airbag sensor in your car. The material senses the force of an impact on the car and sends an electrical charge deploying the airbag.
Electro-rheostatic and Magneto-rheostaticElectro-rheostatic (ER) and magneto-rheostatic (MR) materials are fluids, which experience dramatic change in their viscosity. These fluids change from a thick fluid (similar to engine oil) to nearly solid substance within the span of a millisecond when exposed to a magnetic or electric field; and the effect can be reversed just as quickly when the field is removed. MR fluids are now being developed for use in car shocks, damping washing machine vibration, prosthetic limbs, exercise equipment, and surface polishing machine parts. ER fluids have mainly been developed for use in clutches and valves, as well as engine mounts designed to reduce noise and vibration in vehicles.
Auxetic MaterialsAuxetics are materials that, when stretched, become thicker perpendicularly to the applied force. That is, they have a negative Poisson's ratio. This occurs because they contain hinge-like structures which flex when stretched. Such materials are expected to have interesting mechanical properties such as high energy absorption and fracture resistance. This may be useful in applications such as body armour, packing material, knee and elbow pads, robust shock absorbing material, and sponge mops [1]. It is hoped that in future, bumper bars may be made of an auxetic material which grows fatter when stretched and thinner when compressed.
13

Photochromic materialsThese are materials that change colour in response to light. A good example are the light sensitive sunglasses that darken when exposed to bright sunlight. Scientists at the Department of Energy's Lawrence Berkeley National Laboratory and the University of California–Berkeley, have discovered accidentally, an inexpensive material that changes color on exposure to light [2]. The material, which they were studying in an effort to improve the performance of an advanced rechargeable battery, may be useful in developing a next generation of energy-efficient windows that switch from transparent to opaque spontaneously upon exposure to increasing levels of sunlight, or by the application of a small voltage.
Halochromic MaterialsA halochromic material is a material which changes colour when pH changes occur [3]. The term ‘chromic’ is defined as materials that can change colour reversibly with the presence of a factor. In this case, the factor is pH. The pH indicators have this property. Halochromic substances are suited for use in environments where pH changes occur frequently, or places where changes in pH are extreme. Halochromic substances detect alterations in the acidity of substances, like corrosion in metals.
Halochromic substances may be used as indicators to determine the pH of solutions of unknown pH. The colour obtained is compared with the colour obtained when the indicator is mixed with solutions of known pH. The pH of the unknown solution can then be estimated. Obvious disadvantages of this method include its dependency on the colour sensitivity of the human eye, and that unknown solutions that are already coloured cannot be used.
The colour change of halochromic substances occur when the chemical binds to existing hydrogen and hydroxide ions in solution. Such bonds result in changes in the conjugate systems of the molecule, or the range of electron flow. This alters the amount of light absorbed, which in turn results in a visible change of colour. Halochromic substances do not display a full range of colour for a full range of pH because–after certain acidities, the conjugate system will not change. The various shades result from different concentrations of halochromic molecules with different conjugate systems.
Smart ClothingResearch is in progress to develop smart materials in clothes that would monitor our health, stress levels, or other physical needs and respond accordingly. The fabric would– for example, be more insulating when it gets cold, emit an alarm– if you are having a heart attack, or provide a read out of vital signs.
It has been reported [4] that skiers from the USA and Canada at the 2006 Winter Olympics wore suits that were made from a smart material that instantly hardens upon impact, protecting the wearer from injury.
BIOMIMETICSThe natural world is full of examples of smart phenomena, including the ability of plants to adapt their shape in real time, e.g. to allow leaf surfaces to follow the
14

direction of sunlight, reflex to heat or pan in animals, etc. These materials and structures of living things (plants or animals) have capability to sense their environment, process this data, and respond. Just as a falling apple is said to have inspired Sir Isaac Newton in formulating the famous laws of motion and gravitation in physics, so 21st century materials scientists and engineers are turning to nature for inspiration. Biomimetics is attracting considerable attention in the construction industry, where there is enormous potentials for improvements to materials, construction techniques and building design. Inspiration is found in some unlikely places!
The Termite MoundThe Eastgate Building in Harare, Zimbabwe, is the country’s largest commercial and shopping complex, and yet it uses less than 10 percent of energy consumed by a conventional building of its size because there is no central air conditioning and only a minimal heating system. The design follows the cooling and heating principles used in the region’s termite mounds.
Geckos FeetHave you ever considered how a gecko is able to stay and crawl upside down on the ceiling without falling? Now some physicists have established that some geckos can take a load of up to 40kg without falling from that position!
Unlike tree frogs and many insects that use some form of glue-like fluid to get a grip, geckos are dry danglers. Their fan-shaped, highly flexible feet enable them to get traction on a wide range of surfaces while moving or standing, either up, down, or upside down. This gravity – defying power is said to lie in the tens to hundreds of thousands hair–like structures, known as setae, on gecko’s toe pads. In 2000, researchers were able to demonstrate that the large surface area of setae allow the animals to take advantage of the molecular–level attraction called Van der Waals forces, to stick virtually at any surface. More recently, it has been shown [5] that friction is also involved, and these animals use a whole bag of tricks to help them adjust to circumstances from moment to moment. Now researchers and corporations around the world are racing to create the first synthetic ‘gecko glue’, and the US military is leading the way in trying to create gecko–inspired robots that can scale any surface.
It has been reported [6] that a team of physicists at the University of Manchester were able to produce the first ‘gecko tape’. Humans may soon be able to climb walls, crawl across ceilings, and slip through high towering walls of any building, with the agility and skill of a gecko!
The Basilisk Lizards that walk on waterIn 2004, Havard researchers discovered how a basilisk lizard (sometimes called “Jesus Lizards” because they appear to walk on water) manage to run across the surface of water on their two hind legs, with front arms outstretched. They move at speeds faster than 1.5 m/s comparable to a human running at 104 km/h! The lizard
15

first slaps the water with its web-like foot, strokes downward with an elliptical motion to create an air pocket, and then pulls its foot out of the water by curling its toes inward. By repeating this sequence up to 10 times a second, it generates sufficient forward thrust and lift to run on water without tipping over or sinking. Now scientists at Carnegie Mellon University in the US have built a tiny robot that can walk on water [7], much like insects known a water skimmers, water skaters, pond skaters, or Jesus bugs. Although the robot is still at prototype stage, it is believed that one day it could be equipped with biochemical sensors that monitor water quality. It could also be fitted with cameras for spying, search and rescue operations, or for exploration. The robot might also be outfitted with bacteria to help break down pollutants in the environment.
Spider SilkScientists have recently found out [8] that spider silk is a light, tough and strong material, with many potential applications. A team of researchers at MIT are struggling to investigate ways of producing a material with the enormous energy absorption and strength of spider silk. Such a material would be ideal for making artificial tendons, speciality textiles, and lightweight bullet-proof gear. However, unlike sheep or silkworms, spiders cannot be penned in together or raised as a group, and are difficult to domesticate because they are territorial and cannibalistic.
Spider silk is known to be a polymer with two distinct alternating phases. One phase is soft and elastic, while the other consists of hard crystallites. Spider silk’s strength and flexibility is said to come from the nanoscale crystalline reinforcement and from the way the tiny crystallites are oriented and adhere to the softer and amorphous phase constituent [9].
CONCLUSIONIn this paper, an attempt has been made to bring to the awareness of Tanzanian readers, the immense opportunities that are available for research and development of engineering systems based on smart materials and the imitation of natural bio-mechanical systems in plants and animals. The extent to which we can emulate nature is limitless.
References
[1] http://en.wikipedia.org/wiki/Auxetics[2] http://www.lbl.gov/Science-Articles/Archive/cheap-photochromics.html[3] http://en.wikipedia.org/wiki/Halochromism[4] http://www.science.org.au/nova/093/093key.htm[5] Russell, A & Johnson, M. (2007): http://www.sciencedaily.com/releases/
2007/12/071220133448.htm[6] John Roach (2003): National Geographic News, June 2, 2003.[7] http://www.pittsburghlive.com/x/pittsburghtrib/s_440639.html[8] http://web-mit.edu/newsoffice/2003/spiderweb.html
16

[9] (http://www.sciencedaily.com/releases/2007/01/07011911513.htm).
Development and Applications of Insect Pest Management Technologies in Stored Crops: A Contribution to Integrated Pest Management
C.P. RugumamuDepartment of Zoology and Wildlife Conservation,
College of Natural and Applied Sciences,University of Dar es Salaam,
P.O. Box 35064, Dar es SalaamE-mail: [email protected]
Abstract: This paper presents a critical analysis of developments and applications of technologies in the management of insect pests of stored crops. The management technologies discussed include, industrial chemical pesticides; biological control; varietal resistance; Genetic Modified Crops (GMCs); traditional pesticide materials; policies and legislation. Further, the implications of each management technology to the welfare of the communities and the ecosystems in general are discussed. They are these technologies which could form components in the Integrated Pest Management (IPM) approach to combating insect pests of stored crops. It is revealed from the analysis that when wisely employed– free of antagonistic use, developments in pest management play a great role in increasing food security, environmental conservation, reduction of poverty and ultimately improving the peoples’ quality of life.
Key words: Insect pests, management technologies, integrated pest management, food security, reduction of poverty
INTRODUCTION Insect pest infestations cause greater losses of stored crops in developing countries thereby hindering agricultural development resulting in food insecurity. In cases of insect pest outbreak, the stored crop is at high damage risk given the low Economic Injury Level (EIL). In controlling this hazardous condition, the major thrusts reported in the developments of insect pest management technologies were initially directed to crops in farm fields amongst rural communities (Abate et al., 2000; Chapman, 2000; Rugumamu, 2005). Away from the farms at international border posts of many countries, government agencies are also reported to enforce plant quarantine regulations as pest control measures. In principle pest control measures have to be extended to storage ecosystems and integrated into an operational system, be it large or small in scale, if they are to be effectively applied. The major objective of this paper is to search and critically analyse developments and applications of insect pest management technologies in order to recommend their wise use in protecting stored crops in an integrated manner.
17

In the recent past, therefore, development and applications of technologies in the management of insect pests form a sound basis for a better understanding of their contribution to the Integrated Pest Management (IPM) approach. In most cases, one deciphers that some technologies are so integrated to become components of IPM. The current thrust in pest management is on IPM, a domain of extension science referring to a management system that combines all economically, technically and ecologically applicable technologies to keep pest populations below those causing economic injury while minimizing unwanted side effects of the applied measures (Hill, 1987; Benbrook, 1996; Matteson, 2000; Neuenschwander et al., 2003). Timely application of arthropod pests control measures following fluctuations of pest populations in relation to their general equilibrium position, economic threshold and economic injury levels was illustrated by Hill (1987).
Various scientific and technological discoveries and developments over time have been contributing vastly in managing insect pests and vectors of crop diseases particularly in farm fields at varying degrees. In this regard, Chapman (2000) outlined landmark events in insect-related basic biology and applied entomology of the twentieth century. Table 1 shows some major advances in insect pest management over time as modified from Chapman (2000).
Table 1 Major developments in insect pest management over time
Time Development in pest control1920s – 1930s Biological control campaign against prickly pear in Australia
1940 DDT first synthetic insecticide used
1950s -1990s Varietal resistance to insect pests broadly classified by Painter (1951) and Russell (1978). Silent spring published.Synthetic pyrethroids based on structure/activity relations.Sterile male technique eliminates screw worm from most of North America.IPM concepts established.Transgenic cotton containing Bacillus thuringiennsis toxin commercially available.
As correctly stated by FAO (1991) losses in stored food crops impact negatively the national food security in particular and the economy in general. Food security is conceived to be a situation in which people do not live in hunger or fear of starvation (Wikipedia Encyclopedia). It is reported that worldwide, around 852 million men, women and children are chronically hungry due to extreme poverty, while up to 2 billion people are intermittently food insecure due to varying degrees of poverty (FAO, 2003). According to FAO (1996), food security exists when all people, at all times, have access to sufficient, safe and nutritious food to meet their dietary needs and food preferences for an active and healthy life.
18

FAO is currently carrying out a Special Programme for Food Security (SPFS) assisting some governments replicate successful food security practices on a national scale. The SPFS also encourages investment in rural infrastructure, off-farm income generation, urban agriculture and safety nets. It is also reported that for the United States Department of Agriculture (USDA), food security is attained when all household members’ access at all times to enough food for an active, healthy life (FAO 1996). Noting that a household is the lowest level of community organization in Africa the above conception merits high consideration in this regard.
In Tanzania for instance, the overall policy in the food and agriculture sector, is to achieve self-sufficiency in food and food security through increased food production as well as increased commodities for export and hence reduction of poverty, (URT, 1996; URT, 2005). This policy places emphasis on, among other things, food production and underscores the need to utilize science and technology in order to develop the agricultural sector and that science and technology should aim at the maximization of productivity through introduction of improved methods of farming, seed varieties and better methods of food and crop processing, preservation and storage.
Science and technology is a term of art generally used to encompass the relationship between science and technology. According to the Wikipedia Encyclopedia, technology can be broadly referred to as the entities, both material and immaterial, created by the application of mental and physical effort in order to achieve some value. By the same token, pest management technology may refer to a collection of control techniques and methods, skills, processes, tools and raw materials to creat a current state of knowledge in order to produce desirable management approach to solve problems of pest infestations in farm stores. On the other front, science is the reasoned investigation or study of phenomena, aimed at discovering enduring principles among elements of the phenomenal world by employing formal techniques such as the scientific methods (The Reader’s Digest Great Encyclopaedic Dictionary). Hence technology is often a consequence of science and engineering, although technology as a human activity precedes the two fields.
This paper is organized around eight inclusive introduction, namely insect pest infestations of stored crops, application of chemical pesticides, biological control, varietal resistance, application of traditional pesticides, legislative methods and lastly the way forward in stored products Integrated Pest Management (IPM).
Insect Pest Infestations of Stored CropsAccording to Hall (1970); Pantenius (1987) and Dick (1988) for instance, the harvested crop is the net result of all prior production efforts and any subsequent losses incurred are absolute losses with no possibilities for compensatory action. It is imperative therefore, to develop effective management technologies against stored crop pests especially in such a system where rural livelihoods are based on agricultural production. Maize, (Zea mays), for example, is a staple food and cash crop grown and stored in almost all the regions of the tropics (Burtt-Davy, 1914; Acland, 1975 and Lupatu, 1980, Abate et al., 2000). The recent technological development including
19

the introduction of many new maize varieties to farmers have taken the crop propagation into the highlands and middle altitudes.
In the early 1980s problems associated with maize and cassava storage in some East and West African countries– for example, have been aggravated by the accidental introduction of the Larger Grain Borer (LGB), Prostephanus truncatus (Golob and Hodges, 1982; Bell and Waters, 1982; Golob, 1988). The beetle is a serious alien insect pest of drying maize in the field and to a greater extent in storage where the crop is stocked for several months for future consumption (Rugumamu, 2003a). The LGB was given various local names reflecting the great losses it causes to on-farm stored maize and cassava (Hodges et al., 1983). Both larvae and adults of this serious pest do eat voraciously creating a lot of dust and frass not fit for human consumption and hence causing economic damage to the crops in traditional storage systems.
Prevailing relative increases in crop yields have been facilitated partly by scientific and technological advances in breeding for genotypes of greater resistance to field pests and diseases and partly by application of modern farm practices and implements. However, Okiwelu, et al. (1987) and Abate et al., (2000), among others, noted that greater storage losses to insect pests may also result from some of the improved technologies. Some new crop varieties, however, are mostly susceptible to insect pest infestations in farm fields and in storage. This observation emanates from the fact that not all technologies enhance culture in a creative way as in some cases it can also triger negative impacts to societies.
Until recently, it was commonly believed that resistance of a crop variety could only be effective to growing plant in the field (Painter, 1951; Hill, 1987). It was later demonstrated that some grain physical and chemical/nutritional characteristics incorporated during breeding could result into its susceptibility to insects in storage (Arnason and Gale, 1992; Throne, 1994; Rugumamu, 2005). As advanced by de Waal (1997), some efforts have been made to prevent and alleviate famine disasters through mitigation and prevention while others have concentrated on relief supplies. It is, however, cautioned that whereas some measures have proved successful some other relief forms perpetuate famine. Following from the above, users should be cautioned given that some technological development efforts knowingly or unknowingly could aggravate socio-economic problems.
Application of Industrial Chemical PesticidesHistorically, when synthetic chemical pesticides mostly the organochlorine group came into widespread use in the 1940s they promised an era of abundant agricultural yields. However, Carson (1962); Hill (1987) have their thoughts shared with Edward Groth who in his foreword in the book “Pest Management at the Crossroads” by Benbrook (1996) noted that it didn’t take long to recognize that these miracle chemicals had costs and risks as well as benefits. The chemicals were highly toxic to most insect groups with control levels of 98 – 99% or even higher, broad spectrum and persistent thereby becoming unfriendly to the environment.
Currently, control of stored insect pests is mainly achieved by the application of some industrial pesticides including Permethrine; Pirimiphos-methyl, an
20

organophosphosphorus, Carbamates (Kilimo/GTZ 1996; Golob et al., 1999; Golob, 2002) even though this strategy has several shortcomings, economically, technically and ecologically. Insect Growth Regulators (IGR) and Juvenile Hormones (JH) are included in the pesticides groups which are specific and have minimal disruptive effects on the environment. JH– if applied to full-grown larva, disturbs the process of metamorphosis and the insect dies as a deformed pupa/adult (Berry, 1985; Chapman, 1998). Nonetheless IGRs are not as specific as JH but they interfere with cuticle formation at the time of ecdysis and hence killing the moulting larva.
Field evidence reveals that, only rarely does chemical application kill all the pests, and that the few which survive during successive generations develop slight genetic differences from the main stock of the insect species which become biotypes usually giving serious problems as they develop resistance to the chemicals (Hill, 1987; Golob, 2002). Incidentally, genetic resistance to pesticides in pest populations and outbreaks of new pest problems when broad-spectrum insecticides remove natural checks and balances, have led to escalating dependence on pesticide use with no real decline in pest-induced crop losses (Benbrook, 1996). It is further urged that if not well monitored, continued additions of chemical pesticides result into general ecological disturbance as well as causing residue in ecosystems (Chapman and Reiss, 2002). As a consequence toxicological experiments have showed that pesticides could cause cancer and birth defects and damage or could interfere with nervous, endocrine, reproductive and immune systems in mammals (Edge and Schauber, 2000; Fischel, 2005).
Socio-economic status in Africa has made the use of synthetic pesticides the lowest among all regions of the world (Sangodoyin, 1993; Abate et. al., 2000). The chemical pesticides are very expensive and most governments have reduced subsidy to farm inputs especially to pesticides (FAO, 1991; Arthur, 1996). Further, at the level of management, misuse of chemicals during application, non-availability when most required and incorrect timing of treatment given the low EIL in storage, aggravate chemical control problems. Based on the later evidence, Benbrook (1996) lamented that many chemical pesticides cost comparatively little to use, in large part, because the risks and social costs associated with their use are not included in their price.
To this end, in Tanzania for example, a full-fledged Tropical Pesticides Research Institute (TPRI) under the Ministry Agriculture and Food Security was established by the Act, 18/79. The purpose of this Act was to institutionalize a system for both research and regulation of pesticides in use in the country. Akhabuhaya (1980) reported that TPRI was charged among other things, to supervise and regulate the manufacture, importation, distribution, sale and use of pesticides and to administer the regulations made under the Act. As urgued by Carson (1962), Akhabuhaya and Lodenius (1988), Metcalf (1980 and1994), Dendy et al. (1991), Hodges (1994), Arthur (1996) among others, any rational decision on the use of chemical pesticides in pest management must be based on the cost–benefit analysis and environmental impact considerations. It is against this background that strategies for minimizing expenditure in pesticide use will be a factor to sufficient food supply, reinvesting of finances obtained from other sectors and last to the reduction of health hazards
21

resulting from unwise applications of the pesticides which– in some cases, are unauthentic.
Biological Control of Insect PestsAnother alternative in IPM is biological control which, in a broad sense, includes all types of control involving the use of natural organisms which have a long history of evolution (Hill, 1987; Rees, 1988; Dick, 1990; Scholler et al., 1997; van Emden, 1999; Neuenschwander et al., 2003). The main attractions of biological control are that it reduces the necessity of using chemical poisons and in its most successful cases gives long-term control from one introduction (Hill, 1987; van Emden, 1999). In this regard, biointensive IPM is advocated in agricultural systems. Benbrook (1996), however, emphasized that expanded reliance on biontensive IPM could work when far-sighted policies are in place from both government and private sector. Biological control is most effective against pests of exotic crops which often do not have their full complement of natural enemies in the introduced locality. On rare occasions, a local predator or parasite will successfully control an introduced pest.
Regarding the use of predators in biological control, the histerid beetle predator Terestriosoma nigrescens Lewis was released and established as a natural enemy for the control of P. truncatus (Horn) in some African countries including Kenya (Giles et al. 1996; Meikle et al., 2002a; 2002b; Holst and Meikle, 2003). Initial studies on the impacts of this entomophagous insect to control the stored product insect pest have concentrated on observing its spread and the effects on loss reduction in experimental maize stores (Rees, 1988; Borgemeister, 2001). It may not be surprising now, however, if T. nigrescens has already been established in more African countries. Entomopathogenic fungi, Beauveris spp was reported to infect various insect pests of stored maize in Kenya (Oduor et al., 2000). The pests include, P. truncatus, S. zeamais, Tribolium spp, Carpophilus spp. In principle, Scholler et al., (1997) report that given the low Economic Injury Level of infested stored crops, Stored Product Protection (SPP) by applying natural enemies should be taken much early during storage
A major limitation to this technology is that most predators are not host-specific and hence not particularly confined to any specific host (Rees, 1985; Rees, 1988; Bottrell et al., 1998). Further, the enemy requires longer period to be effective. It is thus advanced that ecological research on specificity of agents to the pests may allow a wide introduction of more predators; pathogens (fungi, bacteria, viruses); parasites and parasitoids of common insect pests as biological control measures.
Male sterilization and use of pheromones are other biological methods of insect pest control (Kettle, 1992; Hill, 1987). Male sterilization method is effective when applied to restricted populations and also in species where females mate only once and unable to distinguish or discriminate against sterilized males. Attractant pheromones are used in pest population monitoring so that control measures may then be exercised if necessary with precise timing. It should be appreciated moreover that aggregation pheromones could be employed in insect pest behavioural control where insects are induced to fly to inappropriate hosts.
22

Genetic engineering for crop protection may be carried out in countries that have ratified the Cartagena protocol on biosafety, an international law which was negotiated under the Convention on Biological Diversity (CBD). This has basic requirements for member countries to comply when pursuing Genetically Modified Orgarnisms (GMOs) (Nakora, 2005). The principles and procedures of compliance and inspection required for the execution of safely confined field trials (CFTs) of GM crops are comprehensive. Plans on GMOs in many countries are underway and in Tanzania, for instance a National Biotechnology Advisory Committee (NBAC) was established in 2006 under the then Ministry of Science, Technology and Higher Education (MSTHE). The committee is entrusted to the Commission for Science and Technology (COSTECH) which is the national focal point for the biotechnology/biosafety activities in the country. The committee consists of members from various institutions and includes policy makers, government agencies, Research and Development (R&D) institutions and the private sector. Decisions by this body take into account human and environmental safety, public concerns, ethical, and socio-economic factors.
Under genetic engineering technology, many food plants are being genetically engineered to resist pests in field and storage. The commercial success, Bacillus thuringiensis, commonly known as Bt, a bacterium occuring naturally in the soil and can also be easily produced in mass by fermentation on an inexpensive media (Federici, 2007). The insecticidal activity of Bt was first discovered in 1911 and was, however, commercially available in the 1950s. The pathogen causes disease to insect pests and produces crystal proteins that are lethal to insect larvae (Hill, 1987; Cranshaw, 2003). The Bt crystal genes have been transferred into maize, enabling it to manufacture the natural insecticide against insect pests such as corn borers (Cranshaw, 2003; Paalberg, 2006; Yarobe and Quicoy, 2004; Hosea et al., 2005; NewAfrican, 2009). Recently, strains have been produced that affect some dipteran larvae, such as mosquitoes, and larvae of leaf beetles. It is further reported by van Emden (1999); Cranshaw (2003) that these bacteria are the active ingredient in some insecticides and are the only microbial insecticides in widespread use.
Basically, Bt is considered safe to people and non-target species, such as wildlife and that some formulations can be used on essentially all food crops (Hill, 1987; van Emden, 1999; Cranshaw, 2003; Federici, 2007). In recent years, there has been tremendous renewed interest in Bt and several new products have been developed, largely because of the safety associated with the Bt-based insecticides. Genetic engineering in this case makes it possible to locate the gene that produces Bt toxin proteins inhibitors of insect digestive enzymes and transfer the gene into crop plants.
Following developments in GMO, the TPRI cautioned that there should be a close monitoring in the development and testing of any genetically engineered products and scientific advices concerning their safety should be provided according to LEAT, (2004). It was, however, lamented by Hosea and Muruke (2007) among others, that although there is still some ambivalence about the long-term effects of GM foods, it may be advanced that many consumers in East Africa without their knowledge are
23

probably already consuming these products imported from countries which had made Bt maize trials.
It is further advanced that, such a situation may be possible because in Africa there are no laws at present which require food containers to have labels detailing the way their ingredients have been made and, as a result, there is no way that consumers can know what exactly they are consuming. Transgenic maize and cotton containing the gene for Bt toxin were widely planted for the first time in 1996 and by 2004 such crops had been planted on some 50 million acres worldwide (Dent, 2000; Hosea et al., 2005). It is further reported that in the United States over 70% of the cotton planted and 40% of the maize planted is with transgenic varieties (Hosea and Muruke, 2006).
The main advantages of biological control of insect pests according to Hill (1987) evolved around the absence of toxic effects. The bottom line is that no development of resistance by the pests, no residuals of poisons in the environment, no build-up of toxins in food chains, it is mostly selective therefore no killing of beneficial organisms, permanence of successful control and also it is self-propagating and self-perpetuating and hence self-adjusting (Scholler et al., 1997; van Emden, 1999). Despite the importance of biological control there can arise shortcomings, for example, most predators used to attack pests and vectors are not host-specific hence could attack beneficial organisms (van Emden, 1999). The genetically manipulated parasites or pathogens also when misused may result into disasters. In this regard, concern is usually expressed over the dual-use nature of biological agents due to the ease with which they could be directed to antagonistic use for biological warfare against crops and animals including humans.
Varietal Resistance in Pest ManagementResistant crop varieties are an aspect of pest control of great importance whereby plant breeding is a very specialized subject in its own rights and hence it is dealt with separately, not just within biological control (Bhatia, 1976; Hill, 1987). Varietal resistance to insect pests was broadly classified by Painter (1951) into three categories which are non-preference, antibiosis and tolerance. In this context, Hill (1987) noted that in stored products, non-preference and/or antibiosis types of crop resistance to insect pest attack has adverse effect on the bionomics of the pest by causing its death or decreasing the rate of its development and reproduction. Russell (1978) noted that the basis of the resistance categories is a function of slight variations in genetic material.
It is emphasized by Bosque-Perez and Schulthess (1998) and van Emden (1999) that host-plant resistance as a pest control method is environmentally safe, economically acceptable to farmers and most compatible with other components in IPM initiatives. Further, Bhatia (1976); Henckes (1992); Rugumamu (2004; 2006a; 2006b) reported the use of insect resistant crop varieties as one of biological components in the IPM which could significantly reduce losses of stored crops. As a contribution to this pest control initiative, varying levels of resistance of some maize varieties to P. truncatus and S. zeamais were determined in the laboratory and in the field farm studies by, among others, Dobie (1974); Howard (1984); Derera et al. (2001); Rugumamu (2005). The findings from these studies indicate significant differences among the maize
24

varieties tested according to statistical methods by Fowler et al. (1999) and Sokal and Rohlf (1998). These results did shed light to the importance of pursuing a search on susceptibility and infestation levels of many more maize varieties developed, grown and stored by smallholder farmers in order to identify resistant varieties to the common insect pests.
Under subsistence food production, however, it has been noted that the availability of resistant varieties has, to some extent, failed to achieve a major impact (Mohamed and Teri, 1989; Hillocks, 1995; Abate et al., 2000). This is so because, first, local varieties were probably most resistant due to co-evolution and selection by farmers over many years; second, farmers in unstable and variable environments plant mixtures of varieties that are more able to respond to erratic rainfall, fluctuations in soil conditions and to pest and disease problems; and, third, breeding physical characteristics in varieties may have a detrimental effect on either palatability or cooking time or both and therefore unacceptable to farmers. However, given the potency of resistant varieties to insect pest control, it is recommended that deliberate effort by policy markers be directed towards dissemination of the knowledge to stakeholders, the smallholder farmers in order to enhance food security and poverty reduction.
The various methodologies currently used for assessing and determining varying resistance of crop varieties to stored insect pests are presented by McCain et al. (1964); Widstrom et al. (1972); Urrelo et al. (1990); Howe, (1971); Dobie, (1974); Rugumamu, (2006b). These scientific innovations are intended to positively contribute to the welfare of the world community by reducing food insecurity and hence poverty and to promote national growth. Different crop varieties are produced in various breeding programmes and it is now known that some grain physical and chemical/nutritional characteristics could affect their susceptibility to insect attack and damage (Dobie, 1977; Bhatia, 1976; Berry, 1985; Gatehouse, 1987; Chapman, 1998 and 2000; Hans-Jorg, 1993; Kostal, 1993; Raikhel and Snigirevskaya, 1998; Aluja et al., 2001; Rugumamu, 2004). The methodologies for screening crops for varietal resistance are in line with the need to monitor the possible misuse of breeding technologies which could lead to mass production and distribution of varieties with poor storage qualities leading to losses of higher magnitude resulting into famine and hence national insecurity.
Application of Traditional Pesticides Farmers’ ingenuity in rural areas has enabled them– through time, to apply indigenous pesticide materials to protect crops (Rugumamu and Mtumbuka, 1998; Rutatora, 1994; Abate et al., 2000; Rugumamu, 2005). It is advanced by Abate et al. (2000) and UNESCO (2002) that pest management practices in traditional African agriculture have a built-in mechanism in the overall crop production systems. It is acknowledged by Rutatora (1994); Elwell and Maas (1996); Rutatora and Mattee (2001); Rugumamu (2003a; 2003b) among others, that the majority of smallholder farmers in most African countries employ only Indigenous Knowledge Systems (IKS) in their agricultural production processes including storage.
25

As stated by Elwell and Maas (1996) and Abate et al. (2000), due to increased applications of chemical insecticides by some communities over the last few decades, some traditional methods of protecting stored seeds and food crops are being forgotten to the extent that some farmers are now unaware that traditional low-cost alternatives do exist. It is however cautioned by Golob (1988); Golob and Hanks (1990) that rampant claims of the effectiveness of traditional grain protectants need further research to establish their efficacy and full potential as well as any possible toxicological hazards associated with their use. The current emphasis upon IPM is, in effect, a reassertion of the need to put traditional good husbandry practices in place as a fundamental component of pest control (Elwell and Maas, 1996; Haines, 1999; Abate et al., 2000).
In some African communities, consultations to traditional priests or healers are another kind of insurance against pests and thieves attack to crops (Local community pers. com). Though not formally propagated some smallholder farmers on consulting these priests are assured through prayers that the cultivated seeds through maturity and storage will be free from all sorts of losses. It is believed that the bottom line is for them to observe certain rules and regulations at all stages in the production system.
Legislative ControlLegislative measures of pest control such as restrictions of movement of produce at entry points at international borders are usually enforced by state agencies as a pest control strategy (Golob, 1988; Kirenga pers.comm.). The programme for example is practiced in Tanzania and is adaptable as a model for other countries in Africa to prevent the exotic insect pest, P. trucatus infestations from spreading to neighbouring countries (FAO, 1995). The strategy, however, is reported to work with limited success given free movement of people and porous borders in this global village.
Way Forward in Stored Products Integrated Pest ManagementBased on the above analysis, it is concluded that development and applications of science and technology in stored insect pest management cannot be overemphasized. It is evident that when wisely used control strategies form components of IPM and the main advantages of various insect pest management technologies have been highlighted for the increased agricultural production. It is, however recommended that extensive and in-depth multidisplinary research is essential in order to eliminate possible dual uses.
Although development of components of IPM was recommended over thirty years ago, the thrust was on the effective uses of various control measures in farm field environments (Dobie, 1977; Hill, 1987). Given the existing situation regarding insect infestations Dick (1988; 1990); Haines (1999); Adda et al. (2002) call for research in the field of IPM that will reduce reliance on only chemical control in farm stores. It is noted, however, that IPM strategies are specific to each pest, climatic conditions and other local factors. It is against this background that IPM requires multidisciplinary research, often years of it to develop successful IPM methods and unlike chemicals, once developed; IPM strategies cannot be packed and sold everywhere.
26

On another front, it is advanced here that instead of IPM “technology transfer” through training and visit (T&V) system, the “farmer first” paradigm of participatory non-formal education led by IPM extensionists in farmer field schools followed by community IPM activities is highly recommended. This approach which would have greater success in achieving IPM implementation emphasizes farmer-training-farmer and research by farmers (Matteson, 2000; Meikle et al., 2002; Scoones and Thompson, 2009). In essence, with well synergized IPM components extended to a storage level, it would result in a total well being of stored crops and the ecosystem in which they grow and by the same token improve food security and the economy of a country. When scientific and technological advances are wisely applied in agricultural production systems in accordance with the knowledge on biological conservation, crop pest management and food security will be significantly promoted.
References Abate, T., van Huis A., Ampofo, J.K.O. (2000), “Pest Management Strategies in
Traditional Agriculture: An African perspective”. Annu. Review of Entomology, 45 : 631-659.
Acland, J.D. (1975), East African Crops. FAO, Longman. Adda, C., Borgemeister, C., Biliwa, A., Meikle, W.G., Markham, R.H. and Poehling
H.M. (2002), “Integrated Pest Management in Post-harvest Maize: a Case Study From the Republic of Togo (West Africa)”. Agriculture, Ecosystems and Environment 93(1-3): 305-321.
Akhabuhaya, J.L. (1980), Pesticides as Soil Polutants. Review Paper Presented at the 4th Annual Meeting of Soil Science Society of East Africa 27-28th October 1980.
Akhabuhaya, J.L. and Lodenius, M. (1988), Pesticides in Tanzania. Helsink. 82 pp.Aluja, M., Diaz-Fleischer, F., Papaja, D. R., Legunes, G., Sirinski, J. (2001), Effect of
Age, Diet, Female Density and Host Resource on Egg Load in Anastrepha ludens and Anastrepha oblique (Diptera: Tephritidae). J. of Insect Physiology, 47 (9): 975 – 988.
Arnason, J.T. and Gale, J. (1992), The Role of Phenolics in Resistance of Maize Grain to the Stored Grain Insects, P. truncatus (Horn) and S. zeamais (Motsch.). J. Stored Prod.Research, 28: 2, 119 – 126.
Arthur, F.H. (1996), Grain Protectants. Current Status and Prospects of the Future (Review). J. Stored Prod. Research, 32, 4 293 – 302.
Bell, R. J. and Watters, F. L. (1982), Environmental Factors Influencing the Development and Rate of increase of Prostephanus truncatus (Horn) (Coleoptera: Bostrichidae) on stored maize. J. of Stored Product Research, 18 : 131 - 142.
Benbrook C. (1996), Pest Management at Crossroad. Consumers Union Washington, USA.
Berry, S.J. (1985), Reproductive Systems. In Blum, M.S. (ed.) Fundamentals of Insect Physiology. John Wiley & Sons.
Bhatia, S. K. (1976), Resistance to Insects in Stored Grains. Tropic. Stored Product Information, 31: 21 – 35.
Bosque-Perez, N. A. and Schulthess F. (1998), Maize: West and Central Africa, in:
27
Polaszek, (Ed). African cereal stem borers: Economic importance, taxonomy, natural enemies and control. CAB International, pp. 11 – 24.
Borgemeister, C. (2001), Biology, Ecology and Biological Control of the Larger Grain Borer, Prostephanus truncatus, an Exotic Pest of Stored Maize and Cassava in Africa. The ESA 2001 Annual Meeting. San Diego, CA. Dec. 9th 2001.
Bottrell, D.G.; Barbosa, P.; Gould, F. (1998), Manipulating Natural Enemies by Plant Variety Selection and Modification: A Realistic Strategy? Annu. Rev. Entomol. 43: 347 –367.
Burtt-Davy, J. (1914), Maize, its History, Cultivation, Handling and Use, With Special Reference to S. Africa. Longmans.
Carson, R. (1962), Silent Spring. Greewich Conn. Chapman, R.F. (1998), The Insects: Structure and Function. Fourth ed. Cambridge
Univ. Press. Chapman, R.F. (2000), Entomology in the Twentieth Century. Annu. Rev. Entomol.
45: 261 – 285. Chapman, J.L. and Reiss, M.J. (1999), Ecology Principles and Application.
Cambridge University Press. Cranshaw, W.S. (2003), Bacillus thuringiensis. Colorado State University Extension-
Hortculture No. 5.556.Dendy, J., Dobie, P., Said, A. and Uronu, B. (1991), Trials to Assess the Effectiveness
of New Synthetic Pheromone Mixtures for Trapping P. truncatus (Horn)(Coleoptera:Bostrichidae) in maize stores. J. Stored Prod. Research, 27(1), 67 – 74.
Dent, D. (2000), Insect Pest Management. CABI International, Wallingford.Derera, J., Pixley, K.V. and Giga, P. D. (2001), Resistance of Maize to Maize Weevil:
I. Antibiosis. African Crop Science J., Vol. 9(2), 431 – 440. de Waal (1997), Famine Crimes: Politics and the Disaster Relief Industry in Africa. Oxford.
Dick, K. M. (1988), A Review of Insect Infestation of Maize in Farm Storage in Africa with Special Reference to the Ecology and Control of Prostephanus truncatus.
ODNRI Bulletin No. 18. Dick, K. L. (1990), Biological Control of LGB in Africa: A Component of Integrated
Pest Management Strategy. In Maikham, R. H. and Herren, H.R.: Biological Control of the LGB. Proc. of IITA/FAO Coordination, Cotonon, Republic of Benin, 1989.
Dobie, P. (1974), The Laboratory Assessment of the Inherent Susceptibility of Maize Varieties to Post-harvest Infestation by Sitophilus zeamais (Motsch.) (Coleoptera:Curculionidae). J. of Stored Product Research, 10 : 183 - 197.
Dobie, P. (1977), The Contribution of the Tropical Stored Products Centre to the Study of Insect Resistance in Stored Maize. Tropical Stored Prod. Information, 34 : 7 - 22.
Edge, W.D. and Schauber, EM. (2000), Factors Affecting Risk Assessment of Small Mammals to Pesticides. Envtal. Toxicol. and Chemistry. Vol. 19, 11, 2735-2741.Elwell, H. and Maas, A. (1996), Natural Pest and Disease Control. Natural Farming
Network, Zimbabwe.
28

FAO, (1991), Special Programme for Pest Control in Africa. Plant Protection Services in Tanzania. A brief review and proposed structure for the 1990s. Rome, Italy.
FAO, (1995), Improving Phytosanitary Conditions in Eastern and Southern African Areas at Risk from the Larger Grain Borer. Report of a National Training Workshop. Harare. February 1995.
FAO, 1996, Food for All. World Food Summit. Rome FAO, (2003), Gender. Key to sustainability and food security. Plan of action: Gender
and development. Rome. Federici, B.A. 2007, Bacteria as a Biological Control Agents for Insects:
Economics, Engineering and Environmental safety. In M. Vurro and J. Gressel (eds) Novel Biotechnologies for Biocontrol Agents Enhancement and Management. 25-51.
Fischel, F.M. 2005, Evaluation of Pesticides for Carcinogenic Potential. UF/IFAS EDIS Publication PI-37. http://edis.ifas.ufl.edu/
Fowler, J., Cohen, L. and Jarvis, P. (1999), Practical Statistics for Field Biology. JohnWiley and Sons.
Gatehouse, A. M. R., Dobie, P., Hodges, R. J., Meik, J. Pusztai, A. and Boulter, D. (1987), Role of Carbohydrates in Insect Resistance in Phaseolus vulgaris. J. of Insect Physiology, 33 (11) : 843 - 850.
Giles, P.H., Hill, M.G., Nang’anyo, F.L.O., Farrel, G, Kibata, G.N. (1996), Release and Establishment of the Predator Teretriosoma nigrescens Lewis for the Biological Control of Prostephanus truncatus (Horn) in Kenya. African Crop Science J., 4, 325 – 337.
Golob, P. (1988), Current Status of the Larger Grain Borer, Prostephanus truncatus (Horn) in Africa. Insect Sci. Application, 9(6), 737-745.
Golob, P. and Hodges, R. J. (1982), Study of an Outbreak of Prostephanus truncatus (Horn) in Tanzania. Rep.G.164, Trop. Prod. Institute. London.
Golob, P. and Hanks, C. (1990), Protection of Farm Stored Maize Against Infestation by Prostephanus truncatus (Horn) and Sitophilus species in Tanzania. J. Stored Prod. Research, 26: 4, 187 – 198.
Golob, P., Marsland, N., Nyambo, B., Mutambuki, K. Moshy, A., Kasalile. E.C., Birkinshaw, L., Day, R. 1999, Coping strategies Employed by Farmers Against
the Larger Grain Borer in East Africa: Preliminary Observations. Proceedings of the 7th Intern. Working Conference on Stored Product Protection, 14-19 October 1998.
Golob, P. (2002), Chemical, Physical and Cultural Control of Prostephanus truncatus. Integr. Pest Management Reviews, 7 (4): 245 – 271.Haines, C.P. (1999), IPM for Food Storage in Developing Countries: 20th century
Aspirations for the 21st Century. Crop Protection, 19, 825 – 830.Hall, D. W. (1970), Handling and Storage of Food Grains in the Tropics and
Subtropical Areas. FAO, Agric. Devt. Paper No. 90. Rome. Hans-Jorg, F. (1993), Yolk Protein Accumulation in Locusta migratoria (R. and F.)
(Orthoptera:Acrididae) Oocytes. International J. of Insect Morphology and Embryology, 22 Nos. 2 - 4.
Henckes, C. (1992), Investigations into Insect Population Dynamics, Damage and Losses of Stored Maize – an approach to IPM on small farms in Tanzania with
29

special reference to Prostephanus truncatus (Horn). Diplomagraringenieur, Technische Universitat Berlin.
Hill, D. S. (1987), Agricultural Insects Pests of theTropics and their Control. Cambridge University Press.
Hillocks, R.J. (1995), Integrated Management of Insect Pests, Diseases and Weeds of Cotton in Africa. Integrated Pest Managt. Review, 1: 31-47.
Hodges, R. J., Dunstan, W. R., Magazini, I. and Golob, P. (1983), An Outbreak of Prostephanus truncatus (Horn) (Coleoptera: Bostrichidae) in East Africa. Protection Ecology, 5 : 183 - 194.
Hodges, R. J. (1994), Recent Advances in the Biology and Control of Prostephanus truncatus (Coleoptera:Bostrichidae). Proc. Of the 6th Intern. Working Conf. on Stored-product protection. Vol. 2. Ed. Highley, E., Wright, E.J., banks, H.J. and Champ, B.R.
Holst, N., Meikle, W.G. (2003), Teretrius nigrescens Against Larger Grain Borer Prostephanus truncatus in African Maize Stores: biological control at work. J. of Applied Ecology 40(2): 307-319.
Hosea, K.M., Msaki, L and Swai, F. (2005), Understanding Genetically Modified Organisms in Tanzania. Print Factory Ltd, Dar es Salaam, Tanzania. 685-12-9.
Hosea, K.M. and Muruke, M.H.S. (2006), Towards Detection of Genetically Modified Maizein Tanzania using a PCR strategy. Proceedings of the 1st National COSTECH Scientific and Technological Conference 24th -26th May 2006 DSM.
Hosea, K.M. and Muruke, M.H.S. (2007), Evidence for Genetically Modified (GM) Maize Contamination of the Consumer Food Market in Tanzania based on PCR and Sequence analysis. Paper Presented at the Second Annual National Science and Technology Conference 23-25 May, 2007, Dar es Salaam
Howard, D. C. (1984), The ability of Prostephanus truncatus to Breed on Different Maize Varieties. Proc. GASGA workshop on LGB - P. truncatus Feb., 1983. Tropical Products Institute, Slough. Publication, GTZ Eschborn, 17-31.
Howe, R.W. (1971), A Parameter for Expressing the Suitability of an Environment for Insect Development. J. Stored Prod. Res. 7, 63 – 65.
Kettle, D.S. (1992), Medical and Veterinary Entomology. CAB International, UK. Kilimo/GTZ (1996), Madawa ya Kilimo – Matumizi, Tahadhari na Athari zake.
Tanzania – German Project for Integrated Pest Management.Kostal, V. (1993), Oogenesis and Oviposition in the Cabbage Root Fly, Delia radicum
(Diptera: Anthamyiidae) influenced by food quality, mating status and host plantdeprivation. European Journal of Entomology, 90: 137 – 147.
LEAT, (2004), Environmental Law Handbook for Businesses. LEAT Publications. Lupatu, M. A. 1980, Kilimo Bora cha Mazao Makuu Tanzania. Tanzania Publ. House. Dar-es-Salaam.
Matteson, P.C. 2000, Insect Pest Management in Tropical Asian Irrigated Rice. Annu. Rev. Entomol. 45: 549-574.
McCain, F.S., Eden, W.G. and Singh, D.N. 1964, A technique for Selecting Rice Weevil Resistance in Corn in the Laboratory. Crop Sci: 4, 109 – 110.
30

Meikle, W.G., Markham, R.H., Nansen, C., Holst, N., Degbey, P., Azoma, K. and Korie, S. (2002 a), Pest Management in Traditional Maize Stores in West Africa: a farmer's perspective. J. of Economic Entomology 95(5): 1079-1088.
Meikle, W.G., D. Rees and Markham, R.H. (2002b), Biological Control of the Larger Grain Borer, Prostephanus truncatus (Horn) (Coleoptera: Bostrichidae). Integrated Pest Management Reviews 7: 123-138.
Metcaf, R.L. (1980), Changing Role of Insecticides in Crop Protection. Annual Rev. Entomology 25, 219 – 256.
Mohamed, R.A., Teri, R.A. (1989), Farmers’ Strategies of Insect Pest and DiseasesManagement in Small-scale bean Production Systems in Mgeta, Tanzania. Insect Sci. Application. 10: 821-825.
Nakora, H. (2005), Tanzania’s TPRI Jumps on GM Bandwagon. Seed Quest News Section.
Neuenschwender, P., Borgemeister, C., Landewald, J. (2003), Biological Control in IPM Systems in Africa. CABI Publishing, Wallingford.
NewAfrica (2009), GM Food, Is it Good for Africa? An IC Publication.Oduor, G.I., Smith, S.M., Chandi, E.A., Karanja, L.W., Agano, J.O., Moore, D.
(2000), Occurrence of beauveria bassiana on insect pests of stored maize in Kenya. J. Stored Prod. Research. 36;2, 177 – 185.
Okiwelu, S. N., Adu, O. O. and Okonkwo, V. N. (1987), The Effect of Sitophilus zeamais (Motsch.) (Coleoptera:Curculionidae) on the Quality and Viability of Stored Maize in Nigeria. Insect Sci. Application. 8(3), 379 - 384.
Paalberg, R. (2006), Are genetically Modified Crops a Commercial Risk for Africa? International Journal of Technology and Globalization Vol. 2: 81-92
Painter, R.H. (1951), Insect Resistance in Crop Plants. MacMillan: New York.Pantenius, C. U. (1987), Storage Losses in Traditional Maize Granaries in Togo. Insect
Sci. Application. 9 (6), 725 - 735. Raikhel, A. S. and Snigirevskaya, E. S. (1998), Vitellogenesis. In: Microscopic
Anatomy of Invertebrates. Volume IIC, Insecta. Rees, H. H. (1977), Insect Biochemistry. Chapman and Hall.Rees, D.P. (1985), Life History of T. nigrescens (Lewis) (Coleoptera:Histeridae) and
its Ability to Suppress Populations of Prostephanus truncatus (Horn) (Coleoptera: Bostrichidae. J. Stored Prod. Research 21, 115 – 118.
Rees, D.P. (1988), Laboratory Studies on the Predation by Teriosoma negrescens (Lewis) (Coleoptera:Histeridae) on Prostephanus truncatus (Horn) (Coleoptera: Bostrichidae) infesting maize cobs in the presence of other maize pests. J. Stored Prod. Research, 23, 191 – 195.
Rugumamu, C.P. and Mtumbuka, E.N. (1989), Efficacy of Indigenous Materials to Insect Pests of Household Stored Crops: A strategy for food security in Tanzania. Research report, Sida/SAREC, University of Dar es Salaam.
Rugumamu, C. P. (2003a), Insect Infestation of Maize, Zea mays (L.) in Indigenous Storage Structures in Morogoro Region, Tanzania. Tanz. J. Sci. Vol. 29:2, 1 – 10.
Rugumamu, C.P. (2003b), Efficacy of Indigenous Pesticides in the Management of Bean Bruchids inTanzania. In: Bertillesen, P., Mihanjo, E. and Muller J. (ed) 2004. Indigenous Technologies in Tanzania – From Past to Present. Aalborg. University and Ndanda-Peramiho Benedictine Publications.
31

Rugumamu, C. P. (2004), Effect of Maize Varieties on the Management of Prostephanus truncatus (Horn) (Coleoptera: Bostrichidae). Uniswa Research J. Agric. Sci. Technology Vol.7: 2, 119 – 125.
Rugumamu, C. P. (2005), Management of Insect Pest Infestations in Farm Stored maize, Zea mays (L.) in Tanzania: A Contribution to Integrated Pest management. Sida-SAREC Research Report, University of Dar es Salaam.
Rugumamu, C. P. (2006a), Application of Vitellogenin in the Management of Prostephanus truncatus (Horn) (Coleoptera:Bostrichidae) in Stored Maize in Tanzania: A Strategy for Growth and Reduction of Poverty. Paper presented at the First COSTECH Scientific and Technological Conference. Dar es Salaam 24th – 26th May 2006.
Rugumamu, C. P. (2006b), Varietal Role in the Management of the Larger Grain Borer, Prostephanus truncatus (Horn) in Stored Maize. Tanz. J. Sci. Vol. 32 (2): 14-21.
Russel, G. E. (1978), Plant Breeding for Pest and Disease Resistance. Butterworths,London.
Rutatora, D.F. (1994), The Role of Indigenous Knowledge in Improving and Sustaining Agricultural Development in Tanzania: An Overview. In Rutatora, D.F., Kajembe, G.C. and Neke, S.M. (eds.) 1994. Indigenous Knowledge and Sustainable Development. Proceedings of a National Conference, SUA, Morogoro, Tanzania. 144 – 157.
Rutatora, D.F. and Mattee A.Z. (2001), Towards a Farmer-centred Extension Service: the Case of Uluguru Mountain Agricultural Development Project, (UMADEP), Morogoro, Tanzania. South African J. of Agricultural Extension, Vol. 30, 89-103.
Sangodoyin, A.Y. (1993), Field Evaluation of the Possible Impact of Some Pesticides on the Soil and Water Environment in Nigeria. Experimental Agric. 29: 227-232.
Scholler, M. Prozell, S., Al-Kirshi, A.G. and Reichmuth, C. (1997), Towards Biological Control as a Major Component of Integrated Pest Management in Stored Product Protection. J. Stored Prod. Research, 33, (1) 81–97.
Scoones, I. and Thompson, J. (2009), Farmer First Revisited: Innovation for agricultural research and development. Practical Action Publishing Ltd.
Sokal, R. R. and Rohlf, F. J. (1998), Biometry. 4th Edn. W. H. Freeman, New York. Throne, J.E. (1994), Life History of Immature Maize Weevils (Coleoptera:
Curculionidae) on Corn Stored at Constant Temperatures and R.Hs. in the Laboratory. Envital. Ecolology, 23(6), 1459-1471.
UNESCO, (2002), Local and Indigenous Knowledge Systems (LINKS). www.unesco.org
URT (United Republic of Tanzania) (1996), The National Science and Technology Policy.
URT (United Republic of Tanzania) (2005), National Strategy for Growth and Reduction of Poverty.
Urrelo, R. Wright, V.F., Mills, R.B. and Hober, E.K. (1990), An Abbreviated Procedure to Determine the resistance of maize to Sitophilus zeamais (Motsch.)(Coleoptera:Curculionidae). J. Stored Prod. Research, 26, No. 2, 97 – 100.
van Emden, H. F. (1999), Pest Control. Cambridge University Press.
32

Widstrom, N.W., Redlinger, L.M. and Wiser, W.J. (1972), Appraisal of Methods for Measuring Corn Kernel Resistance to Sitophilus zeamais. J. Econ. Entomology 65, 790 – 792.
Yorobe, J. M and Quicoy, C.B (2004), Economic impact of Bt Corn’ Impact assessment of Bt Cotton in Phillipines, Terminal Report, International Service for the Acquisition of Agribiotech Applications (ISAAA), Ithaca, NY.
Flower Colour Inheritance in Nicotiana Alata (Solanaceae) and its use as a Genetic Marker for Gene
Flow Studies
Margaret Mollel1 and Teklehaimanot Hailesesalssie2
1National Plant Genetic Resources Centre, P. O. Box 3024, Arusha Tanzania
2Department of Biology, Addis Ababa University, P. O. Box 3434, Addis Ababa Ethiopia
Corresponding Author’s E-mail: [email protected]
Abstract: In Nicotiana alata, flower colour inheritance has followed Mendelian inheritance with dark colours being dominant over lighter colours. Reciprocal crosses concluded the absence of the cytoplasm involvement in the determination of flower colour. The backcross confirmed the dominant nature of red as the backcross between any F1 to the red parent produced only red flowers. On the other hand when light coloured morphs were the parents, the offspring segregated in a ratio of 1:1 confirming the monogenic recessive inheritance of light colours. The exception for the above patterns of inheritance was when the F1 of the lime green x pink was crossed with the pink pollen donor and produced red purple offspring. Flower colour in Nicotiana alata, could be used as an easily interpreted morphological marker in most morphs.
Key words: Flower colour, inheritance, morphological marker, Nicotiana alata
INTRODUCTION
33

Gene flow and the subsequent hybridization and introgression of genes from cultivated and genetically modified (GM) crops into the gene pools of wild relatives has been documented in crops such as rice, rapeseed and maize. There is a concern about gene flow from GM crops to their close relatives because the transfer of transgenes could bring about unintended effects in natural ecosystems (Colwell et al., 1985; Ellstrand & Hoffman, 1990; Snow & Palma, 1997; Whitton et al., 1997). Therefore, studies of gene flow are important in both conservation genetics (reviewed in Wan et al., 2004) and ecological risk assessment of GM crops (Ellstrand, 1999; Ellstrand, 2003; Luby & McNicol, 1995; Snow et al., 2003).
Molecular markers, such as microsatellites and RFLPs, can be used for measuring genetic variation, gene flow and hybridization between populations and in determining paternity (Arias & Reiseberg, 1994; Jorgensen & Andersen, 1994; Morris et al., 1996; Paul et al., 1995). Molecular markers are widely used in genetic analysis because they are considered to be objective measures of variation as they concern the DNA molecule itself. They are not subject to environmental influences and tests can be carried out at any stage during plant development. However, they require complex equipment, expensive consumables and technical expertise (Khan & Spoor, 2001; Vicente & Fulton, 2003). Morphological markers can therefore be used as an alternative depending on the biological question under investigation. The advantage of morphological markers over molecular markers is that they do not require sophisticated equipment and provide a direct measurement of the phenotype (Vicente & Fulton, 2003). Morphological traits, such as flower, seed or seed-coat colours can be used as efficient genetic markers if they have simple inheritance (Cruzan, 1998). Flower colour has been used as a morphological marker for genetic studies in many species because of the ease of visual identification (Clarke et al., 2004; Kazan et al., 1993; Kumar et al., 2000).
Flower colour is either monogenically or polygenically inherited depending on the plant species. In several species such as Brasicca napus, B. rapa and Leucaena, flower colour is monogenically inherited (Chen & Heneen, 1990; Simioni et al., 1998; Rahman, 2001). In other species, however, flower colour appears to be determined by many genes, each with a small effect. For example, in Petunia over 30 genes are found to be involved in colour expression (Nieuwhof et al., 1990). Epistatic interactions between two or more genes, cytoplasmic effects and environmental factors may also play an important role (Pahlavani et al., 2004).
In Nicotiana alata (Link and Otto), a widely grown ornamental plant occurring in white, red, pink, purple, green and yellow flower colour can be used as a morphological marker. However, the genetics of flower colour inheritance in N. alata, has not been extensively studied although in the related species N. langsdorffii and N. sanderae several genes are known to be involved (Smith, 1937). Our objectives were 1) to understand the mode of inheritance of flower colour in five different colour morphs (genotypes) of N. alata. 2) Identify flower colours that have monogenic inheritance which could be used as markers in studies of gene flow and hybridization in this species.
MATERIAL AND METHODS
34
We used five morphs (genotypes) of Nicotiana alata which differed in flower colour. The colours were white, lime green, pink, purple and red. Plants from true breeding lines of each morph were obtained from Åbergs trädgård, a nursery in southern Sweden. The plants were kept in the green house using ordinary potting soil and treated under ordinary agronomic conditions. The temperature in the greenhouse was kept constant at 23oC, with a light and a dark cycles of 12 hrs.
In the early summer of 2003 we performed controlled crosses between the colour morphs making a total of 20 cross combination including reciprocals (Table 1). For each cross combination we pollinated three flowers on each of the 20 recipient plants.
Flowers of the recipient parents were emasculated and bagged before anthesis, and after pollination flowers were again bagged to prevent contamination with pollen from undesired morphs. To determine the flower colour of the offspring, three capsules from each pollinated plant were taken and five seeds from each were grown in pots in the greenhouse. To avoid subjectivity, we scored flower colour using the Royal Horticultural Colour Chart (2001). To verify the genotype of the F1
and determine the number of genes that control flower colour from the segregation ratio, a backcross test was performed (Table 2). Backcrosses were made between F1s and both parents. Three crosses were made with each of the 20 F1 cross combinations, which gave us a total of 60 crosses. Twenty seeds from each capsule were sown in September 2004 for flower colour scoring.
Table1: Flower colour and number of F1 generation resulting from crosses among the five colour morphs
First crosses and reciprocals (♀ x ♂)
F1 Colour Chart Code N
White x RedRed x White
Red purple Red purple
61B61B
1515
White x PurplePurple x White
Red purple Red purple
67A67B
1515
White x Pink Pink x White
Red purple Red purple
73A73A
1515
White x Lime greenLime green x White
Yellow green Yellow green
145D145B
1515
Red x PurplePurple x Red
RedRed
45C45C
1515
Red x Pink Pink x Red
Red Red purple
53CN57A
1515
Red x Lime greenLime green x Red
RedRed
45B45B
1515
Purple x PinkPink x Purple
Red purple Red purple
60B, 67A60B, 67A
8, 78, 7
Purple x Lime greenLime green x Purple
RedRed
53A53A
1511
Lime green x PinkPink x Lime green
Red purple, RedRed purple
N57C, 53A61B, 60A
6, 69, 6
RESULTS AND DISCUSSION
35
In this study we found that most flower colours in N. alata follow Mendelian inheritance and are controlled by a single locus with dark colours being dominant over lighter colours. Red flower colour was dominant over all colours, while white was recessive to all. Nineteen out of 20 monohybrid crosses produced either red or red purple flowers (Table1). There were differences in the intensities of flower colour between crosses of red x pink and lime green x pink and their reciprocals. However, they were within the same colour category and were grouped together for statistical analysis. The crosses between white and lime green yielded yellow green flowers (Table 1).
Since the reciprocal F1 crosses yielded the same results as the first crosses, it can be concluded that the cytoplasm is not involved in determination of flower colour in N. alata. The backcross confirmed the dominant nature of red as the backcross between any F1 to the red parent produced only red flowers. However, when the parents were recessive (light coloured) the offspring segregated in a ratio of 1:1 confirming the monogenic recessive inheritance of light colours in N. alata (Table 2). These results suggest that the F1s were heterozygous and that the allele’s segregated during gamete formation as expected. Similar results have been reported of the dominant nature of violet flower colour over very light violet colour in Vigna sinensis (Hanchinal & Goud, 1978; Jindla & Singh, 1970). The exception for the above patterns of inheritance in our study was when the F1 of the lime green x pink was crossed with the pink pollen donor and produced red purple offspring (Table 1 and 2). This ambiguous result could be due to the interaction between the pink and lime green colours as both were recessive when crossed with darker colours.
Table 2: Observed and expected ratios of flower colour segregation in backcross populations with chi-square values
BackcrossF1 x Parents Observed Expected Ratio X2 P value
(White x Red) x Red 1W 58R 58R
Red x White) x White 26W 33R 29.5W 29.5R 1:1 0.83 0.5(White x Purple) x Purple 50P 50PP(Purple x White) x White 18W 21R 19.5W 19.5PP 1:1 0.23 0.9(White x Pink) x Pink 1W 44R 45PK(Pink x white) x White 21W 29RP 25W 25PK 1:1 1.28 0.5(White x Lime green) x Lime green
59LG 59LG
(Lime green x White) x White 33W 24LG 28.5W 28.5LG 1:1 1.42 0.5(Purple x Red) x Red 52R 52R(Red x Purple) x Purple 27R 33PP 30R 30PP 1:1 0.60 0.1(Pink x Red) x Red 56R 56R(Red x pink) x Pink 25R 35PK 30R 30PK 1:1 1.60 0.1(Lime green x Red) x Red 22R 22R(Red x lime green) x Lime green
32R 27LG 29.5R 29.5LG 1:1 0.42 0.5
(Purple x Pink) x Pink 53RP 53PP(Pink x Purple) x Purple 23PP 19RP 21PP 21PK 1:1 0.38 0.5(Lime green x Purple) x Purple 60PP 60PP(Purple x Lime green) x Lime green
31RP 29LG 30PP 30LG 1:1 0.07 0.5
(Lime green x Pink) x Pink 45RP 22.5LG
22.5LG
(Pink x Lime green) x Lime green 32R 28LG 30LG 30PK 1:1 0.26 0.5
36

(W= white, R= red, LG = lime green, PK = pink, PP = purple, RP = red purple)
According to our study, flower colour in Nicotiana alata, can be used as an easily interpreted morphological marker in the following cross combinations: red x white, red x lime green, lime green x white and pink x white. Some other crosses such as purple x pink and lime green x pink are not recommended because of the ambiguous results.
AKNOWLEDGEMENTSWe wish to thank Io Skogsmyr and Stephan Andersson for interesting discussions and valuable comments on the manuscript. This work was sponsored by Sida/SAREC through the Stockholm Environment Institute (SEI) and the East African Regional Programme and Research Network for Biotechnology, Biosafety and Biotechnology Policy Development (BIO-EARN).
References
Arias, D.M., and Reiseberg, L.H. (1994), "Gene flow between cultivated and wild Sunflowers". Theoretical Applied Genetics, 89: 655 - 660.
Chen, B.Y., and Heneen, W.K. (1990), "Independent Inheritance of Flower Colour and Male-fertility Restorer Characters in Brassica napus. Plant Breedin"g, 104: 81 - 84.
Clarke, H.J., Khan, T.N., Siddique, K.H.M. (2004), "Pollen Selection for Chilling Tolerance at Hybridisation Leads to Improved Chickpea Cultivars". Euphytica, 139, 65 - 74.
Colwell, R.K., Norse, E.A., Pimentel, D., Sharples, P.E., and Simberloff, D. (1985), Genetic Engineering in Agriculture". Science, 229: 111- 112.
Cruzan, M.B. (1998), Genetic markers in plant evolutionary ecology. Ecology, 79: 400 - 412.
Ellstrand, N.C. (2003), Dangerous liaisons? When Cultivated Plants Mate with their Wild Relatives. Johns Hopkins University Press, 244pp.
Ellstrand, N.C., Prentice, H., and Hancock, J.F. (1999), "Gene Flow and Introgression from Domesticated Plants into their Wild Relatives". Annual Review of Ecology and Systematics, 30: 539 - 563.
Ellstrand, N.C., and Hoffman, C.A. (1990), "Hybridisation as an Avenue for Escape of Engineered genes. Bio-Science", 40: 438 - 442.
Hanchinal, R.R., and Goud, J.V. (1978), "Inheritance in Vigna. Indian Journal of Genetics" 38, 339 - 342.
Jindla, L.N., and Singh, K.B. (1970), "Inheritance of Flower Colour, Leaf Shape and Pod Length in Cowpea (Vigna Sinensis L.)". Indian Journal of Heredity, 2: 45 - 49.
Jorgensen, R.B., and Andersen, B. (1994), "Spontaneous Hybridisation between Oilseed rape (Brassica napus) and Weedy B. Campestris (Brassicaceae): A
37
risk of Growing Genetically Modified Oil Seed Rape". American Journal of Botany, 81:1620 - 1626.
Kazan, K.F Muehlbauer, J., Weeden, N.W., and Ladizinsky, G. (1993), "Inheritance and Linkage Relationships of Morphological and Isozyme Loci in Chickpea. Theoretical and Applied Genetics, 86: 417- 426.
Khan S and Spoor, W. (2001), Use of Molecular Markers as a Quality Control in Plant Tissue Culture". Pakistan Journal of Biological Sciences, 4: 479 - 482.
Kumar J.N. Vijayalakshmi, V.S., and Rao, T.N. (2000), Inheritance of flower colour in Chickpea. The Journal of Heredity, 91: 415 - 417.
Luby, L., and McNicol, R.J. (1995), "Gene flow from Cultivated to Wild Raspberries in Scotland: Developing a Basis for risk Assessment for Testing and Deployment of Transgenic Cultivars". Theoretical and Applied Genetic, 90: 1133 - 1137.
Morris, W.F. Kareiva, P.M., and Raymer, P.L. (1996), "Do Barren Zones and Pollen Traps Reduce Gene Escape from Transgenic Crops"? Ecological Applications, 4: 157 - 165.
Nieuwhof, M, Eijk, J.P., Garretsen, G., and Eikelboom, W. (1990), "Inheritance of Flower Colour in Relation to Inheritance of Flower Pigments in Tulip (Tulipa L.)". Journal of Genetics and Breeding, 44: 277-280.
Pahlavani, M.H., Mirlohi, A.F., and Saeidi, G. (2004), "Inheritance of Flower Colour and Spininess in Safflower (Carthamus Tinctorius L.)". Journal of Heredity, 95: 265 - 267.
Paul, E.M., Capiau, K., Jacobs, M., and Dunwell, J.M. (1995), "A Study of Gene Dispersal via Pollen in Nicotiana Tabacum using Introduced Genetic Markers". Journal of Applied Ecology , 32: 875 - 882.
Rahman, M.H. (2001), "Inheritance of Petal Colour and its Independent Segregation from seed colour in Brassica Rapa". Plant Breeding, 120: 197 - 200.
Rieseberg, L.H., Kim, M.J., and Seiler, G.J. (1999), "Introgression between the Cultivated Sunflower and sympatric Wild Relative, Helianthus petiolaris (Asteraceae)". International Journal of Plant Science, 160: 102 - 108.
Simioni, C., Schifino-Wittman, M.T., and Paim, N. R. (1998), "A Model for Flower Colour Inheritance in Leucaena (Leguminosae)". Genetics and Molecular Biology, 21: 365 -368.
Smith, H.H. (1937), "Inheritance of Corolla Colour in the Cross Nicotiana Langsdorffii by Nicotiana Sanderae". Genetics, 22: 347 - 361.
Snow, A.A., and Palma, P,M. (1997), "Commercialization of Transgenic Plants: Potential Ecological Risks. Bio-Science", 47: 86 - 96.
Snow, A.A Pilson, D., Rieseberg, L.H, Paulsen, M.J., Pleskac, N., Reagon, M. R., Wolf, D.E., and Selbo, S. M. (2003), "A Bt Transgene Reduces Herbivory and Enhances Fecundity in Wild Sunflower". Ecological Applications, 13: 279 - 286.
The Royal Horticultural Society (2001). R.H.S. Colour Chart. The Royal Horticultural Society, London.
Vicente, M.C., and Fulton, T. (2003), Using Molecular Marker Technology in Sudies on Plant Genetic Diversity. IPGRI and Cornell University New York
38

Wan, Q.H Wu H., Fujihara, T., and Fang, S.G. (2004), "Which Genetic Markers for which Conservation Genetic Issues?" Electrophoresi,s, 25: 2165 - 2176.
Whitton, J.D., Wolf, E., Arias, D.M, Snow, A.A., and Rieseberg, L.H. (1997). "The Persistence of Cultivar Alleles in wild Populations of Sunflowers five Generations after Hybridisation". Theoretical and Applied Genetics, 95: 33 - 40.
Reproductive Performance, Mineral and Body Condition Status of Smallholder Dairy Cattle in
Rungwe District, Tanzania
A. A. Gimbi1, A. E. Kimambo2, N. L. Kanuya3, L. A. Mtenga2, G. H. Laswai2 and J. Madsen4
1Department of Life Sciences, Open University of Tanzania,P. O. Box 23409, Dar es Salaam Tanzania.
2Department of Animal Science and Production, Sokoine University of Agriculture,P.O Box 3004 Morogoro Tanzania.
3Department of Veterinary Surgery and Theriogenology, Sokoine University of Agriculture,
P.O. Box 3020, Morogoro Tanzania.4Department of Animal Science and Health,
Royal Veterinary and Agricultural University Veterinary Grønnegaardsvej 2,DK-1870, Fredreriksberg C, Denmark.
For correspondence: Email: [email protected] and [email protected]
Abstract: A study was conducted in Rungwe district-Tanzania, aimed at establishing causes for suboptimal reproductive performance (RP) of dairy cows and heifers kept by smallholder farmers and investigate on possible interventions. Phase I of the study involved a survey to identify reproductive status of the animals. Monitoring was done in phase II, to assess the mineral, body weight (Bwt), body condition score (BCS) and RP of the animals. It was observed in phase I that breeding by natural mating (hand mating) and zero grazing were practised by all
39

the respondents. Drying up of pregnant cows was done 1-3 months prior to calving without steaming up. Supplementary feeds varied in composition and amount and the supply varied with availability of ingredients. The observed average calving interval (CI) was 526.5 ± 133.7 days (range 365 – 1095 days and coefficient of variation (CV) was 25%. This was longer (P<0.05) than expected CI (375 days).
During monitoring phase calcium (Ca) and copper (Cu) deficiencies were observed, where mean plasma Ca and Cu concentrations were 6.9 ± 1.1 mg/dl (CV = 16%) and 0.5 ± 0.2 µg/ml (CV = 40%), respectively. Mean phosphorus level was 7.2 ± 2.0 mg/dl (CV = 28%). Mean Bwt and BCS were 342.1 ± 66.8 kg (CV = 20%) and 1.8 ± 0.5 (CV = 28%), respectively. Cyclicity resumed after 90 days postpartum in 86% of the animals and first visual oestrus was observed 142.9 ± 29.2 days post partum (range 59 – 164 days and CV = 20%). Suboptimal RP was indicated in the initial survey and confirmed in phase II. It was suggested that supplementation of the deficient minerals starting 1 month precalving to 3 months post calving and energy for 2 months before and after calving could improve the RP.
INTRODUCTIONRungwe district belongs to Southern Highlands Zone (SHZ) of Tanzania where increase in dairy herd has been low compared to projected numbers and long calving interval (CI) has been suspected to be a contributing factor (Mwakyembe, 1996). Elsewhere, negative energy balance and mineral deficiencies and/or imbalances have been indicated to contribute to poor reproductive performance (RP) and among minerals, Ca, P and Cu deficiencies have been shown to adversely influence the RP of cattle (Call et al., 1986; Manickam and Balagopal, 1993; Garcia-Bojalil et al., 1998). The objective of the present study was to establish causes for suboptimal RP in dairy cattle in the district and propose possible interventions.
MATERIALS AND METHODSStudy areaRungwe district has an area of 2,211 km2 located between longitudes 330 20' E and 340 00'E and latitudes 8050'S and 9020'S. It’s altitude varies from 1,000m to 2,958m. Annual precipitation of 1700mm to 2400mm is distributed almost throughout the year except for September and October. Average temperature is between 230C and 250C.
Phase I - Survey to identify reproductive status of the animalsA cross sectional study design was used with multistage, purposive sampling followed, to obtain 3 divisions, and 2 wards from each division depending on the availability of dairy cattle keepers and accessibility. Two villages were randomly selected from each of the selected wards and 6 farmers were selected from each of the villages depending on their availability and willingness to participate in the study. The selected divisions with wards in parentheses were Pakati (Masoko and Mpuguso), Tukuyu (Bagamoyo and Bulyaga) and Ukukwe (Kyimo and Kiwira). Participatory Rural Appraisal technique was used for data collection.
40

Means, ranges and standard deviations were calculated and Chi-square test was used to compare the observed and expected CI using SPSS 9.0 for windows (Copyrightã SPSS Inc, 1989-1999).
Phase II - Monitoring of animals’ mineral, body conditions and reproductive performance statusResearch design and samplingA longitudinal monitoring experiment with multistage, purposive sampling was set where the same 3 divisions were selected as in phase I. Afterwards, 3 wards were selected from each of the 3 divisions depending on availability of dairy cattle keepers and accessibility. One village and 3 farmers were then selected from each of the selected wards and villages, respectively. The farmers were selected depending on their availability, having a cow or heifer that was about 7 months pregnant and willingness to participate in the study. A sample of 27 animals (7 months pregnant) was then obtained from the farmers (one animal per farmer). Oestrus detection and hand-mating the animals were performed and recorded by farmers. The animals’ identity, breed and parity were recorded.
Samples and measured parametersMilk and blood samples were collected between March and June, 2002. Milk samples were collected once every 5 days from 14 to 90 days post calving
for determination of progesterone concentration. Milk samples were also collected when heat signs were observed on days different from the days scheduled for sampling.
Blood samples for determination of Ca, P and Cu concentrations, were collected monthly (starting about 60 days precalving to 90 days post calving) by jugular venipuncture using 5ml EDTA vacutainer tubes (BD Vacutainer Systems, Plymouth, UK). The samples were centrifuged at 2000 revolutions per minute for 15 minutes to obtain plasma that was kept frozen at –200C until when laboratory analyses were carried out.
Individual body weights were estimated monthly by measurement of heart girth circumference with a weigh band.
Body condition scoring was done monthly (scale of 0-5 with half scores in between).
Laboratory analysesStandard radioimmunoassay (RIA) was used to determine progesterone level. An increase in progesterone concentration after calving above 1 ng/ml or more for 2 consecutive sampling days was considered an indication that ovulation had taken place (Terqui et al. 1982).
Calcium and P concentrations were determined by spectrophotometer method (Kessler and Wolfman, 1964) while Cu concentration was determined by atomic absorption spectrophotometric technique (Paynter, 1987).
41
Calculations of reproductive parameters The interval between calving and observation of first visual oestrus was
calculated from records and confirmed by RIA of milk progesterone.
Days to start of postpartum cyclicity were determined by RIA of milk progesterone.
Oestrus detection rate was calculated as the proportion of visible heats recorded by farmers expressed as a percent of those cows registered as being in oestrus by use of milk progesterone assay.
Statistical analysisThe computer program, SPSS 9.0 for windows (Copyrightã SPSS Inc, 1989-1999) was used to calculate means, ranges and standard deviations.
RESULTS
Phase I - Survey to identify reproductive status of the animals1. System of rearing cattle, drying off and supplementary feeding of dairy cattle in Rungwe District
Most respondents (94.4%) practised indoor rearing of the animals (zero grazing), where grasses were cut and carried to feed the animals (Table 1.0). Table 1: Rearing system, dry period and supplementation of cattle as reported
by farmers in Rungwe districtDivision
Rearing system N Overall Tukuyu N Ukukwe N Pakati NZero grazing 68 94.4% 95.8% 23 95.8% 23 91.7% 22Mixed 4 5.6% 4.2% 1 4.2% 1 8.3% 2
PC1 Drying offYes 59 100% 100% 19 100% 22 100% 18No 0 0% 0% 0 0% 0 0% 0
Dry period length (months) 59
2.1±0.3(1-3)
2.1±0.3(2-3) 19
2.1±0.3(2-3) 21
2.0±0.4(1-3) 19
Provision of supplementYes 68 94.4% 100% 24 95.8% 23 87.5% 21No 4 5.6% 0% 0 4.2% 1 12.5% 3
PC supplementation (C-2)2
Yes 10 16.4% 23.8% 5 14.3% 3 10.5% 2No 51 83.6% 76.2% 16 85.7% 18 89.5% 17
3PP supplementationYes 59 100% 100% 20 100% 21 100% 18No 0 0% 0% 0 0% 0 0% 0
Supplementation rate (kg/day) 58
1.9±0.4(1-3)
2.0±0.4(1.5-3.0) 20
1.9±0.3(1.5-2.5) 20
1.7±0.4(1.0-2.5) 18
42

Days concentrate supplemented per month 58
19.2±5.0(10-30)
21.7±4.8(10-30) 20
18.4±5.1(7-28) 20
17.3±4.4(10-28) 18
Mineral mix supplementation rate (g/day) 54
23.8±13.4(10-70)
25.5±15.4(10-70) 19
24.5±12.8(10-50) 18
21.1±11.8(10-40) 17
Days minerals supplemented per month 58
13.7±7.0(0-30)
17.9±5.9(8-30) 20
15.2±5.6(5-28) 20
7.4±5.1(0-15) 18
1PC = Precalving, 2C-2 = 2 months precalving, 3PP = Postpartum
The remaining farmers practised a mixed system (semi-outdoor), where animals were occasionally tethered during certain periods of a day and/or whole day. All interviewed farmers dried off their pregnant animals for 1 to 3 months before calving. However, there was no deliberate effort of steaming up such animals, although 16.4% of respondents would supplement them during this period.
Most respondents (94.4%) across the divisions provided supplementary feeding subject to availability of concentrate and largely limited to lactating cows (Table 1.0). On average, farmers could afford to feed 1.9 kg of concentrate per day for 19.2 days in a month. Home made concentrates of varying physical and chemical composition, and amounts of ingredients were used for supplementary feeding though the most common ingredients were hominy meal, sunflower seed cake and commercial minerals. The most commonly used mineral mix was Super Maclick®
(Coopers Kenya Ltd). The supplement composition varied from a concentrate including all the named ingredients to only hominy meal. About 23.8 g/day of mineral mix were included in the concentrate for an average of 13.7 days in a month.
Supplementary feeding was rarely given according to level of production or stage of lactation. When available, amount of concentrate offered ranged between 1 and 3 kg per day divided between morning and evening milking sessions.
2. Dairy cattle breeding and reproductive performanceAll interviewed farmers practised year round breeding of cattle using natural mating (hand mating) method. Findings during group discussions showed that farmers had broad knowledge on oestrus detection obtained through courses organised by non-governmental organisations’ projects, government extension field staff and fellow farmers. The method used for oestrus detection was by visual observation of signs of oestrus. Farmers observed their animals for oestrus signs at least twice a day. Generally, farmers kept records, which included age at first heat and dates of heat, service and calving.
The CI varied between 365 and 1095 days with an overall mean of 526 days across the divisions (Table 2). This was significantly (P<0.05) longer than the range of 375 to 390 days that is expected in a well-managed herd.
Table 2: Means (± SD) for reproductive performance indices
43

DivisionN Overall N Tukuyu N Ukukwe N Pakati
Age at puberty (months)
59 20.5±1.0(16.8-25-5)
21 20.1±1.8(16.8-23.0)
21 20.3±1.8(17.0-23.5)
17 21.3±1.8(17.0-25.5)
Age at first mating (months)
58 21.5±1.8(17.5-26.2)
20 21.1±1.7(17.5-23-7)
21 21.2±1.8(17.5-24.5)
17 22.3±1.6(19.5-26.2)
Age at first calving (months)
58 30.8±1.8(26.8-35.5)
20 30.4±1.7(26.8-33.0)
21 30.5±1.8(26.8-33.8)
17 31.6±1.6(28.8-35.5)
Calving interval (days)
56 526±123(365-1095)
20 495.3±81.0(395-675)
21 500±75.9(365-615)
15 603.4±183.0(380-1095)
Note: Numbers in parentheses indicate the range for a given mean
Phase II - Monitoring of animals’ mineral, body conditions and reproductive performance status.
Calcium levels showed fastest decrease from one month precalving to one month postcalving (Figure 1). Copper values showed a decrease one month precalving and after one month to three months postcalving. Phosphorus levels showed steepest decrease for one month after calving. Body weight increased two months before calving then declined a month before and after calving. There was a slight decrease in body weight between the first and second months after calving followed by an increase towards the third month. A similar trend was shown by the BCS.
Heat detection rate was 66%. Cyclicity started after 90 days postpartum in 86% of the animals and the first visual oestrus was observed 142.9 ± 29.2 days post partum (range 59 – 164 days).
Figure 1: Plasma Ca, P and Cu concentrations, body weight and body condition score trends between 2 months prepartum (C-2) and 3 months postpartum (C+3)
44
DISCUSSION AND CONCLUSIONReproductive performance of smallholder dairy cattle in Rungwe as indicated by CI (526.5 ± 133.7 days) was poor compared to the expected value of 360-390 days (Roberts, 1971). In the present study, the start of ovarian cyclic activity was beyond 90 days after calving and first visual oestrus of 142.9 ± 29.2 days were late, indicative of suboptimal RP of the animals. In dairy cattle cyclicity resumes 14 to 21 days postpartum (Yavas and Walton, 2000) and interval from parturition to first observed oestrus varies from 30 to 76 days (Roberts, 1971).
In the present study, the mean BCS of 1.9 at calving implied low energy intake as it was far below the recommended value of 3.5 (McDowell, 1994). Low energy and minerals intake (about 23.8 g/day of mineral mix included in the concentrate for an average of 13.7 days in a month) might have significantly contributed to the poor RP because precalving steaming up of animals was not normally done, supplementary feeding was rarely given according to level of production or stage of lactation and mineral supplementation was not regular. Additionally, farmers in Rungwe district provided improper forage combinations and offered feeds at low dry matter intake below the recommended rate of 3% of live weight (Mussa, 1998).In the present study, plasma Ca and Cu levels were below the reference values throughout the four months' study period, and indicated nutritional deficiencies for the two minerals. Plasma Ca and P concentrations of > 10 mg/dl and > 6 mg/dl, respectively indicate high levels of the minerals (McDonald et al., 1997) whereas Cu concentrations < 1 µg/ml are indicative of low Cu levels in plasma (Blood and Radostits, 1989). Suppressed oestrus has been observed in cows grazing on Cu deficient pastures (Underwood, 1977). Copper supplement also, reduces conception interval and matings per conception (Manickam and Balagopal, 1993). The observed decrease in the minerals starting one month prior to calving suggests the appropriate period when strategic intervention can be carried out.
The mean BCS of 1.9 at calving was below 3.5, a value recommended by McDowell (1994). The decrease in BCS from 2 months prior to calving to 2 months postcalving and the loss of weight 1 month before calving until 2 months after calving could serve as a guide to determine the appropriate time to strategically supplement the animals with locally available energy feeds in order to attain the recommended BCS in an effort to improve the RP. Energy balance plays a major role in initiation of ovulatory ovarian cycles in postpartum dairy cattle (Canfield and Butler, 1991).
It is concluded from this study that the RP in the smallholder dairy cattle in Rungwe district is suboptimal and the animals suffer from Ca and Cu deficiencies. Supplementation of the deficient minerals starting 1 month precalving to 3 months post calving could shorten the period from calving to resumption of cyclicity as well as first observed oestrus. In addition, energy supplementation for a period of 2 months before and postcalving could promote early initiation of ovulatory ovarian cycles and early first observed oestrus postpartum. There is therefore a need of testing the two components of the strategy so that more comprehensive
45

recommendations on how to improve the RP of the smallholder dairy cattle in Rungwe district could be given.
ReferencesBlood, D. C. and Radostits, O. M. (1989). Veterinary Medicine. A Textbook of
Diseases of Cattle, Sheep, Pigs and Horses. 7th ed., Bailliere Tindal, London. pp 1172.
Call, J. W., Butcher, J.E., Shupe, J. L., Blake, J. T.and Olson, A. E. (1986). “Dietary Phosphorus for Beef Cows”. American Journal of Veterianry Research. 47, 475-481.
Canfield, R. W. and Butler, W. R. (1991). “Energy Balance, First Ovulation and the Effects of Naloxone on LH Secretion in Early Postpartum Dairy Cows”. Journal of Animal Science. 69, 740-746.
Garcia-Bojalil, C. M., Staples, C. R., Risco, C. A., Savio, J. D. and Thatcher, W. W. (1998). “Protein Degradability and Calcium Salts of long-chain fatty acids in the Diets of Lactating Dairy Cows: Reproductive Responses”. Journal of Dairy Science. 81, 1385-1395.
Kessler, G and Wolfman, M. (1964). “An automated Procedure for the Determination of Calcium and Phosphorus”. Clinical Chemistry. 10, 521-531.
Manickam, R. and Balagopal, R. (1993). Influence of Copper and Vitamin A in the Reproductive Performance of Dairy Cows. Journal of Dairying, Foods and Home Sciences. 12, 3-4, 153-155
McDonald, P., Edwards, R. A. and Greenhalgh, J. F. D. (1997). Animal Nutrition. 4th ed. Longman Scientific and Technical. pp 92-96.
McDowell, R. E. (1994). Dairying with Improved Breeds in Warm Climates, Kinnic Publishers, USA.
Mussa, H. M. (1998). “Small Holder Dairy Production Feed Budgeting Strategy in the Southern Highlands of Tanzania. A case study of Rungwe and Mbozi Districts”. Msc. Dissertation. Sokoine University of Agriculture, Tanzania.
Mwakyembe (1996). “Economics of Small Scale Dairy Farming: Iringa and Mbeya Regions, Tanzania”. Report 2 submitted to Chief Technical Advisor, SHDDP, Iringa, Tanzania.
Paynter, D. I. (1987). The diagnosis of copper deficiency. In: Copper in Animals and Man, Vol. 1. Howell, J. C. and Gawthorne, J. M. (eds.). Press Inclusion, Boca, Raton, Florida. pp 101-119.
Roberts, S. J. (1971). Veterinary obstetrics and genital diseases (Theriogenology). 2nd edition, Edward Brothers, Inc. Ann Arbor, Michigan. pp 376.
Terqui, M., Chupin, D., Gathier, D., Perez, N., Pelot, J. and Maule’on, P. (1982). “Influence of Management and Nutrition on Postpartum Endocrine Functions and Ovarian Activity in Cows”. In: Factors Influencing Fertility in the postpartum cow. Karg and Schallenberger (eds). Martinus Nijhoff Publishers. The Hague. 384-408.
Underwood, E. J.(ed) (1977). Trace Element in Human and Animal Nutrition. 4th ed. Academic Press, New York. pp 50-150.
Yavas, Y. and Walton, J. S. (2000). “Postpartum Acyclicity in Suckled Beef Cows. A Review”. Theriogenology. 54, 25-55.
46
Natural Forest Regeneration, Stocking Structure and Uses of Tree Species: The Case of Munene Forest Reserve in Bukoba Rural District, North Western
Tanzania
D. B. FungamezaFaculty of Science, Technology and Environmental Studies
The Open University of Tanzania,P. O. Box 21745, Dar Es Salaam,
TanzaniaEmail: [email protected]
Abstract: Systematic sampling of circular plots was undertaken in Munene forest reserve to assess the status of natural forest regeneration, tree density, basal area and tree volume per hectare, timber species present and the uses of tree species by adjacent villagers. Moreover participatory rural appraisal methods were used in data collection. Secondary data supplemented the information gathered. Descriptive statistics and percentages were generated using MS Excel spread sheet programme. Quantitative and qualitative data were analyzed using Statistical Package for Social Sciences programmes and content analysis respectively. Results indicated that the reserve contained 24,884 regenerants per hectare. Manilkara obovata was the most prevalent (19.6%) and Podocarpus falcatus (East African yellow wood) the least dominant (0.3%) species. Number of stems per hectare averaged 823 (SE = 22.28) and were from 68 different species and 27 families. Their distribution followed the reversed J-shape curve. Mean basal area and tree
47

volume were 21 (SE = 0.91) m2ha-1 and 217 (SE = 12.94) m3ha-1 respectively. Timber species M. obovata and P. falcatus accounted for 8.1% and 1.6% of total tree volume respectively, the rest of the trees were neither utilized as timber nor considered marketable species in the study area. However the non-marketable species such as Cleistanthus polystachus, M. obovata, Pseudospondias microcarpa and Syzygium guineense were used elsewhere as timber in Tanzania and Kenya. M. obovata was not harvested due to its hardness and P. falcatus was the only species logged illegally due to its decorative timber. Less than 13% of respondents used various forest products which ranged from firewood to local medicine for treating syphilis, gonorrhea, pneumonia, rheumatism and snakebites. It was concluded that the forest contained two known timber species with P. falcatus in danger of extinction. It is proposed that local community be involved in conservation of the forest and the suitability of other species for timber is investigated.
Key words: Natural forest regeneration, stocking structure, Manilkara obovata, Podocarpus falcatus, Munene forest reserve of Tanzania
INTRODUCTIONThere is limited knowledge on the condition of natural regeneration, species composition and structure of many tropical forests in Africa (Godoy 1992, Wending et al., 2003). Many African countries lack reliable data that could be used in planning and implementing community based forest management (Hitimana et al. 2004). Moreover these countries set very little budgets for forestry activities (Kajembe et al., 2004). The forest owners are interested in knowing which trees grow within their forests, how much species are marketable and how to set up management and utilization plans (Lamprecht, 1989). The forest owners can be the Government, the community or private people. The value of any forest is determined by its growing trees or stocks. Variables of forest stocks are the counts on natural regeneration, number of tree stems, basal area in square meters, and volume in cubic meter per hectare and per species (Lamprecht 1989, Kiyiapi 2000, Hitimana et al., 2004).
Natural forest regeneration and standing stocks in tropical forests have been studied in Latin America (Lamprecht 1989; Killeen et al., 1998; Marin et al. 2005, Ruschel et al. 2005), South East Asia (Whitmore 1975, Kaduvul and Parthasarathy 1999) and East and Southern Africa (Wending et al. 2003, Hitimana et al. 2004, Kajembe et al., 2004, Boudreau et al., 2005). Natural forest regeneration comes from seedlings, vegetative sprouts, and root suckers (Pardo et al., 2005). The recruitment of young plants passes through seedling, sapling and maturity growth phases. Some authors include saplings into natural regeneration and others do not. According to Newton (2007) seedlings are small trees originating from seeds; sprouts are stems from cut trees or roots; and saplings are young trees less than 10cm diameter breast height (dbh) and taller than 1.3m; and adult trees as those with dbh of 10cm or more. In this study natural forest regeneration was arbitrary chosen to represent seedlings between 0.3 and 1.3m height and originating from the seeds.
The structure of a forest consists of diameter size distribution of individual tree species or a community (Davis and Johnson 1987, Philip 1994). The number of
48

trees or basal area per hectare represents the spatial distribution of individual tree species within the forest and distribution of different species (Kaduvul and Parthasarathy, 1999). Diameter size distributions are used in management to plot forest stocks (Davis and Johnson, 1987). Uneven-aged forests normally show a reverse J diameter class distribution with many young and few old tree species (Lamprecht 1989, Hitimana et al. 2004, Boudreau et al., 2005).
Natural forest regeneration and structure of standing stocks of forests in Tanzania is not well documented. Few reports exist from the forests of the Eastern Arc Mountains in Morogoro, Coast and Tanga Regions (Luoga et al., 2002; Wending et al., 2003, Kajembe et al., 2004). These regions are well connected with road networks. Data on the condition of the forests in peripheral regions such as Kagera, Kigoma and Rukwa are lacking. Therefore the researcher saw the need to fill in the gap in knowledge by conducting research in Munene forest reserve (F. R.) in Bukoba Rural District of Kagera Region. So far no study has been undertaken to determine the condition of resources available in the forest reserves in Bukoba Rural District.
The high demand for timber–especially Podocarpus falcatus for production of high quality furniture’s, has lead to loggers harvesting only this species from Munene F. R. The species is preferred by the markets not only in Bukoba but also in neighboring Uganda because of its attractive yellow wood. Local and international loggers go into the forest reserve at night with hurricane lamps and illegally harvest this tree. Thus the illegal harvesting of P. falcatus only was seen as a problem which threatened its existence. Also adjacent villagers were illegally harvesting some forest products. There was a need to conserve the forest and curb the illegal harvesting of P. falcatus by involving local communities living within the vicinity. Before this could be achieved, data on the natural forest regeneration, tree density, forest structure and uses of various species by local community were needed.
The objectives of the study were to: Evaluate the regeneration present in the forest reserve by species Examine the stocking structure of the reserve per species Assess the potential of the forest to supply timber on commercial basis Explore the types of resources collected from the reserve by villagers Come up with recommendations on how adjacent communities could be
involved in the management of the forest reserve
MATERIALS AND METHODSStudy areaMunene F. R. was chosen as a study site because adjacent villagers were excluded from collecting forest products by local government but continued harvesting its products without permission. Bukoba District Council also wanted to start issuing licenses for commercial timber exploitation in this reserve and therefore wished to know exactly the resources available in the forest. The reserve lies 20km west of Bukoba town, along Kyaka–Mutukula road, between latitudes 31o and 31o81’East and longitudes 1o14’ and 1o 20’South of Equator on an almost flat terrain. River
49

Ngono flows through this forest. Surrounding villages are Buchurago and Bulembo in the south, Bugorora in the north, Rugaze and Ishozi in the east.
Sampling Design and IntensitySampling of the forest reserveA systematic sampling design was used. There is a relationship between the size of the forest, the number of sample plots and sampling intensity as shown in the following formula (FAO, 2000):
N = Area * Sampling Intensity Plot size x 100
Whereby N = Number of sample plotsArea = acreage of entire forest (= 2,326 hectares in this study)Plot size = size in m2 (= 500m2 in this study) Sampling intensity = 0.5% of area (it was chosen arbitrary)
Two hundred thirty three sample plots were laid on 24 transects drawn on the 1:50,000 topographic map at 300 meters intervals for the entire forest reserve. The first circular plot of 500m2 was established on first transect 100m inside the forest in order to avoid edge effects. A circular subplot of 12.57m 2 was established within the main plot and was used for counting regeneration. Subsequent plots were located on the transect lines using meridian compass and rope chain. The inventory team was made of foresters and three elderly male persons selected among villagers. The three villagers helped in the identification of tree species in local language.
Sampling of households and key informantsSampling was carried out in Buchurago, Rugaze and Bugorora villages. In each village 30 heads of households were selected systematically by counting every seventh household from a list available at the village’s government register. Households were then identified physically. A snowball or chain sampling was used for key informants (local government officials, forest extension officers, timber loggers and sellers, local carpenters, traditional healers and elderly people).
DATA COLLECTIONFrom the forest reserveIn each sample plot data was collected on the following variables: Diameter breast height of all trees with 5cm and above, measured using calipers
and diameter tapes for larger trees Height of a tree closest to the plot center, assessed using Suunto hypsometer Local names and uses of tree species (timber, firewood, poles, medicine etc).
Natural regeneration was assessed by counting the number of individuals per species of all trees between 0.3 and 1.3m height. Samples of unknown tree species were identified at Lushoto Herbarium.
From the households and key informantsSemi structured questionnaire was administered to 90 heads of selected households in three selected villages. Focus group discussions, interviews with key informants
50

were also carried out. The questions focused on places where they collected firewood, poles and wood used in the carpentry, and which tree species they used for what purposes. If the tree species was used for treating various diseases traditional healers were further asked about types of plant parts used, type of diseases treated, and how the medicine was applied. Interviews were conducted in Kiswahili. Secondary data was obtained from lavailable iterature.
Data AnalysisFirst, the checklist of trees and shrub species was prepared for the entire forest reserve. Secondly, each species was given the code number for subsequent calculation. Since only sample trees were measured for total height, a height-diameter relationship was first established and then the equation developed and used to estimate the height of trees which were not measured. The height-diameter equation developed for Munene forest reserve was: Ht = 2.247 x Dbh0.629
Where: Ht = total tree height in metersDbh = diameter at breast height in centimetersR2 = coefficient of determination, = 0.76 (No. of observation = 165,
Standard Error = 1.27)
Similar height-diameter equations were developed and used by Kajembe et al. (2004) for the forests in Morogoro Region.
Tree’s density in terms of number of stems per hectare, basal area (G) in m 2 per hectare and volume (V) in m3 per hectare were computed using standard mensuration formulae. Single tree volumes were calculated using the general volume formula: Vi = f*g*hi (Philip, 1994).Where Vi = tree volume in m3
.f = tree form factor (form factor of 0.5 was used; Malimbwi and Mgeni 1991)
.g = tree basal area in m2
.hi = total height of ith tree in meters
All the computed parameters were separated into 8 diameter classes namely 5-10, 11-20, 21-30, 31- 40, 41- 50, 51- 60, 61-70 and >71 cm. Descriptive statistics and percentages were generated using MS Excel programme. Statistical Package for Social Science (SPSS) version 11.5 was used in analyzing semi-structured questionnaire while data collected from focus group discussions and interviews with key informants was analyzed qualitatively (content analysis).
RESULTS AND DISCUSSIONCounts on Natural Forest RegenerationTable 1 presents the list of regenerating tree species counted in the reserve. There were 24,884 seedlings per hectare from 68 different species and 27 families. Nine most dominant trees in the natural regeneration were Manilkara obovata, (19.6%, ranked no. 1), Chionanthus mildbraedii, (18.6%), Ficus thornningii, (9.4%), Laptaulus daphnoides, (9.1%), Lasianthus kilimandscharica, (8.3%), Cleistanthus polystachyus, (6.6%) Baphiopsis parviflora, (6.3%), Unknown (4.9%) and Baphia
51

macrocalyx (4.1%, ranked no. 9). From this list only M. obovata was known as timber species. Another timber species found was Podocarpus latifolius but was rare with only 0.3% (ranked no. 19).
Data from other forests in Morogoro, Tanzania indicated natural regenerations of between 4,000 and 10,000 seedlings ha-1 (Ministry of Natural Resources and Tourism (MNRT) 2002) which were lower than the 24,884 observed in this study. Elsewhere in the Far East, Whitmore (1975) found in the Dipterocarpus rain forests 24,000 seedlings per hectare which is almost within the range of this study. But in Venezuela rainforest Lamprecht (1989) counted 34,752 to 72,000 seedlings (0.3 and 1.3m height) per hectare. The Venezuela values are higher than the ones found in Munene F. R. probably due to differences in climate, soils and elevation. Other factors which influence regeneration are light requirements, seasonality, dispersal mechanism of seeds and wildlife feeding on seedlings (Pardos et al., 2005), amount of seeds produced (Greene et al., 1999) and viability (Nathan and Casagrandi 2004). Factors responsible for low abundance P. falcatus are not yet known.
Table 1: Number of regenerating tree seedlings (0.3 – 1.3m height) per hectare in Munene F. R
Botanical name Local name No. ha-1 % Rank
Manilkara obovata (Sab.et G. Don) J. H. Memsl.
Enkunya 4,884 19.6 1
Chinoanthus mildbraedii (Gilb. Et Schell) Tsream
Omuwa 4,626 18.6 2
Ficus thonningii Blume Omukunyu 2,341 9.4 3Laptaulus daphnoides Benth. Omulyangabi 2,251 9.1 4Lusianthus kilimandscharica K. Schumacher Omushekela 2,074 8.3 5Cleistanthus polystachus Planch. Omwiziti 1,648 6.6 6Baphiopsis parviflora Benth. Omutoko 1,579 6.3 7Not known Omutukuzana 1,227 4.9 8Baphia macrocalyx Harms Enkobakoba 1,020 4.1 9Albizzia glaberrima (Schum. et Thornn) Benth. Omuyenzeyenze 624 2.5 10Afrosersalisia cerasifera (Welw.) A. Chev. Omukaraito 559 2.3 11Strychnos mitis E. Moore Omwandiyo 443 1.8 12Not known Olungamkoma 267 1.1 13Euphorbia sp. Omukonyi 241 1.0 14Ouratea densiflora De Wild et Th. Durand Omunyaibabi 237 0.9 15Not known Omushunguti 155 0.6 16Macaranga monandra Muell. Arg. Omushekwanyonyi 95 0.4 17Antidesma venosum Tul. Omutuwa 82 0.3 18Podocarpus falcatus Mird. Omusenenezi 69 0.3 19Other species* 466 1.8 20
*Included 25 trees species such as Teclea nobilis, Blighia unijugata, Grewia conocarpa, Bersama abyssinica, Sclopia zegheri, Treculia africana, Vitex buchanananii, Bleischmiedia ugandensi, Phoenix reclinata, Maesopsis emenii, Syphonia globulifera, Rytigynia uhligii etc.
Stocking structureNumber of stems
52

The average number of stems per hectare was 823 (SE = 22.27). This value was less than the 988 and 1161 stems ha-1 reported for the East Usambara and Uluguru Mountains in Tanzania respectively (Munishi et al., 2004). Malimbwi and Mgeni (1991) found in Mazumbai forest reserve in Lushoto tree density of only 401 stems and Kajembe et al. (2004) measured in the North Mamiwa-Kisara forest reserve in Morogoro region 665 stems per hectare which were less than the 823 stems found in this study. Site and climatic conditions as well as human activities influence the number of stems in a given forest (Hitimana et al. 2004, Kajembe et al. 2004).
The distribution of the number of stems per hectare in the forest followed the reversed J-shape (Fig 1) typical for uneven-aged forests (Lamprecht; 1989, Malimbwi and Mgeni; 1991, Hitimana et al., 2004, Kajembe et al., 2004). This type of distribution indicates that the proportion of trees in small diameter classes is higher than those in big diameter classes (Kaduvul and Parthasarathy, 1999; Luoga et al., 2002; Hitimana et al. 2004, Marin et al. 2005).
Figure 2: Tree diameter class distribution in Munene Forest Reserve
Basal area and wood volumeMean basal area was 21 0.91 m2ha-1 and was almost similar to that of 22.4m2
reported by Kajembe et al., (2004) and by the MNRT (2002) for rain forests in Morogoro region in Tanzania. Hitimana et al., (2004) also found basal area of 21.0m2ha-1 in Mt. Elgon forest of Kenya. In contrast to these observations, Malimbwi and Mgeni (1991) and Munishi et al., (2004) measured higher basal areas of 52, 83 and 104m2 for forests in Lushoto, Uluguru and East Usambara Mountains in that order. The difference observed in basal area between Munene F. R and three sites might be due to soils, climate and differences in altitudes as well as human influences.
Tree height averaged 12.3m. Mean diameter breast height was 15.9cm. These variables were used in computing basal area and tree volume per hectare. Figure 2 shows distribution of basal area and volume per hectare of the forest. The mean
0
100
200
300
400
500
1 2 3 4 5 6 7 8
Dbh Classes
Num
ber o
f ste
ms
ha-1
53
volume was 217 12.94 m3ha-1. This value was similar to the ones reported for rain forests in Morogoro (MNRT 2002, Kajembe et al. 2004). Results from Transmara forests in Kenya indicated wood volumes of between 350 to 450m 3 per hectare (Kiyiapi 2000) and those from tropical rainforests in Venezuela showed values between 343 and 569m3ha-1 (Lamprecht 1989). The Kenyan and Venezuela values are higher than the 217m3 observed in this study probably due to soil types, rainfall and elevation.
Figure 3: Distribution of basal area and volume in Munene Forest Reserve
Table 2: Distribution of tree species in terms of volume in Munene Forest Reserve
Name of tree species % Proportion RankBaphia macrocalyx Harms 17.0 1Ficus thonningii Blume 15.3 2Cleistanthus polystachus Planch. 15.2 3Manilkara obovata (Sab. Et G. Don) J. H. Memsel. 08.1 4Pseudospondias microcarpa (A. Rich) Engl. 05.2 5Syphonia globulifera L. f. 03.9 6Syzygium guineense Willd. D. C. 03.0 7Baphiopsis parviflora Benth. 02.6 8Albizia glaberrima (Schum. et Thornn) Benth. 02.4 9Laptaulus daphnoides Benth 02.4 10Unknown 01.9 11Afrosersalisia cerasifera (Welw.) A. Chev. 01.7 12Podocarpus falcuttus Mird. 01.6 13Other species* 19.7 14*Included 50 species such as Bleischmiedia ugandensis, Macaranga monandra, Chionanthus mildebraedii, Strychnos mitis, Treculia africana, Lusianthus kilimandscharica, Parinari excelsia etc.
0
10
20
30
40
50
1 2 3 4 5 6 7 8
Dbh Classes
Volu
me
& B
asal
area
ha-1 G
V
54

(G = Basal area in m2 per hectare, V = tree volume in m3 per hectare)Table 2 presents the dominant tree species in terms of volume. B. macrocalyx was the most dominant (17%, ranked no. 1) and P. falcatus the least dominant (1.6%, ranked no. 13) species. The first 10 species contributed about 75% of the total volume. Out of these species only M. obovata (8.1%), was used as timber during the British colonial rule. M. obovata was not cut due to its hardness but it was used in Kenya for timber (Kiyiapi 2000). The rest of dominant species had no market value. East African yellow wood (P. falcatus) which was a preferred timber species contributed only 1.6% on the total volume. Therefore the species has little potential of supplying timber to the markets on sustainable basis. It should be left as potential mother tree crop that produces seeds for natural regeneration. Research is required to find out timber properties of other dominant trees which are used by local villagers in carpentry. Elsewhere within Tanzania Cleistanthus polystachus, Pseudospondias microcarpa and Syzygium guineense are used as timber. These species if used could raise the value of the reserve to 32.9 % of the volume. Therefore raising awareness on their use will be required.
Sources of firewood, building poles and wood for village carpentryAbout 87.2% of respondents do not depend on the forest reserve for supply of firewood, building poles and wood for local carpentry. They got these commodities from their farms and public lands. Only up to 12.8% gathered these commodities from the reserve (Table 3).
Table 3: Sources of firewood, building poles and wood for carpentry in three villages adjacent to Munene Forest Reserve (% of respondents, N= 90 Households)
Name of Village
Firewood Building poles Wood for Village Carpentry
Reserve Public Farm Reserve Public Farm Reserve Public Farm
Rugaze 18.2 59.6 22. 7.5 14.3 78.2 10.5 71.4 18.1
Buchurago 06.9 52.4 40.7 5.5 10.6 83.9 15.6 65.2 19.2
Bugorora 8.5 65.7 25.5 4.3 16.7 79.3 12.4 55.6 32.0
Mean 11.2 59.2 29.6 5.7 13.9 80.4 12.8 60.1 23.1
Use of tree species from the forest by adjacent villagersFocus group discussions and discussions with key informants indicated that 27 out of the 68 species were used for firewood, 20 for carpentry, 13 for medicine, 12 for building poles and 8 species for fruits (Table 4). The preferred timber species in decreasing order of importance were P. falcatus, M. eminii, P. excelsia, Diospyros abyssinica and S. zeyheri. These species were rare in the forest.
Traditional healers used leaves, backs and roots of different species to treat various diseases. They mixed roots of Albizia gummifera, Erythrina abyssinica, and Senna didymobotrya in the treatment of malaria. Boiled roots, bark and leaves of Antidesma venosum, E. abyssinica, S. didymobotrya, and Zanthoxylum chalybeum were used in treatment of snake bites. Boiled roots and leaves of E. abyssinica, V.
55

buchananii, and S. didymobotrya cured gonorrhea and syphilis. Boiled roots of A. venosum and extracts of twigs of Bersama abyssinica were reported to cure hook and roundworms. Mixture of roots and leaves of T. mobilis and bark of Rauvolfia caffra treated pneumonia and rheumatism. Crushed pods of A. gummifera and powdered leaves, twigs and roots of A. venosum treated stomach pains. Local medicine was very important in the three villages because dispensaries were far away and lacked regular supply of medicine.
Studies carried out in East Usambara (Hamilton and Bensted-Smith, 1989), Shinyanga (Dery and Otsyina 2000), Babati (Otieno et al., 2001), Morogoro (Wilfred el al. 2006) and Udzungwa (Kitula 2007) in Tanzania indicated that 34 – 49.3% of all identified species were used in traditional medicine. In this study 19.1% of tree species were used in traditional medicine. These species represented valuable genetic resources which need conservation. Debarking and cutting of the roots for the purpose of getting local medicine may lead to extinction of some species which do not produce root suckers. The ingredients and efficacy of medicinal tree plants is not yet known; therefore will require more research.
Fruits were collected from the tree species such as B. ugandensis, M. obovata, P. excelsa, Pseudospondias microcarpa, S. zeyheri, Syzygium guineensee, Tetrapleura teraptera and Vitex buchananii. The use of wild fruits by indigenous people has also been reported in East Africa (Ngulube 1995, Wilfred et al., 2006). The harvesting of fruits normally posed no threat to the existence of the forest reserve. Table 4: Uses of tree species of Munue F. R. as reported by key informants
and villagers surrounding the forestBotanical name English and Haya name
(in parenthesis)Reported uses
Albizia gummifera (J. F. Gmel.) L. A. Sm (Mimos.)
Peacock flower(Omuyenzeyenze)
Cp, Fi, Ut, Fo, root treat malaria, pods treat stomach pains, bark cure skin diseases
Albizia glaberima Benth.(Mimosaceae)
White nongo(Omuyenzeyenze)
Cp, Fi, Fo
Antidesma venosum Tul.(Euphorbiaceae)
Tassel berry(Engarobakama)
Fi, Tl, Fr, chewed roots cure snake bite, roots cure liver complaints & abdominal pains, boiled roots cure hookworms
Apodytes dimidiata E. ex Arn (Icacinaceae)
White pear, pear wood(Omunywamaizi)
Cp, Fi
Bersama abyssinica Fresen(Melianthaceaae)
Winged bersama(Omutukuzanyana)
Cp, Fi, Ca, Ut, leaves cure colds, twigs treat dysentery, roots cure epilepsy
Beilschmiedia ugandensis Rendl. (Lauraceae)
Not available(Omwasha)
Fi, Dc, Fr
Botanical name English and Haya name (in parenthesis)
Reported uses
Blighia unijugata Baker(Sapindaceae)
Not available(Omuwowa)
Cp, Fi, Po, pounded roots treat fever
Diospyros abyssinica F. White (Ebenaceae)
African ebony(Engusha)
Cp, Fi, Ca
Erythrina abyssinica D. C.(Papilionaceae)
Red hot poker tree(Omulinzi)
Fi, Ut, Mo, Dr, boiled bark & roots cure gonorrhea, malaria, syphilis & snake bites
56

Ficus thonningii Blume(Moraceae)
Strangler fig(Omutoma)
Rt, bark treat influenza, roots & bark induce lactation
Ficus ovata Vahl(Moraceae)
Not available(Omuselele)
Poles, bark for making cloth
Grewia conocarpa K. Schumacher (Tiliaceae)
Not known(Omushwiga)
Cp, Fi, Tl, Ca, Fo
Maesopsis eminii Engl.(Rhamnaceae)
Not knownOmuhumula
Cp, Fi, Po, Fo
Macaranga monandra Muell.Arg. (Euphorbiaceae)
Not known(Omushekwanyonyi)
Fi
Macaranga schweinfurthii Pax (Euphorbiaceae)
Not known(Omutangalala)
Fi
Manilkara obovata (Sabine et G. Don) J. H. Memsl.(Sapotaceae)
Milk berry(Enkunya)
Cp, Fi, Po, Tl, Bo, Ca, Fr
Markhamia lutea (Benth.) Schumacher (Bignon.)
Not available(Omushambya)
Cp, Fi, Po, Tl, chewed young shoots & leaves treat throat diseases
Phoenix reclinata Jacq.(Aracaceae)
Wild date palm(Omukindu)
Pw, leaves for roofing, basketry & making mats
Podocarpus falcatus Mird.(Podocarpaceae)
E. African yellow wood(Omusenenezi)
Ti, Fi, Po, Tl, Ut
Pseudospondias microcarpa (A. Rich.) Engl. (Anacardiaceae)
Not available(Omuziru)
Fi, Fr, Mo, St, Wt, Dc,
Rauvolfia caffra Sond.(Apocynaceae)
Quinine tree(Omutengo)
Cp, Fi, Ut, bark cure rheumatism & pneumonia, roots & stems against ascaries
Rauvolfia vomitoria Afzel.(Apocynaceae)
Not available(Omunyabusinde)
Fi
Sapium ellipticum (Krauss) Pax (Euphorbiaceae)
Not available(Omushasha)
Fi, Tl, roots cure coughs
Scolopia zeyheri (Nees.) Harv. (Flacourtiaceae)
Thorn pear(Omuwawa, Omukenge)
Cp, Fi, Po, Tl, Sp, Fr , Fo
Senna didymobotrya (Fressen) Irwin et Barley(Caesalpiniaceae)
Candle bush(Omukyora)
Fi, leaves, stems & roots cure skin diseases in cattle, boiled leaves & roots cure gonorrhea, measles & malaria
Strychnos mitis E. Moore(Loganiaceae)
Not available(Omwandiyo)
Cp, Po, Fi
Botanical name English and Haya name (in parenthesis)
Reported uses
Syzygium guineense Willd D. C. (Myrtaceae)
Water berry tree(Omuchwezi)
Cp, Fi, Po, Tl, Ca, Fr, Fo
Teclea mobilis Del(Rutaceae)
Not available(Omuzo)
Cp, Fi, Po, Tl leaves treat fever, roots & leaves cure pneumonia & rheumatism
Tetrapleura teraptera Taub. (Mimosaceae)
Not available(Omuyenzeyenze)
Cp, Fi, Fr,
Treculia africana Decne.(Moraceae)
Wild jack fruit(Omuzinda, Omunonoba)
Cp, Fi, Fr
Vitex buchananii Bak. Ex Gurke (Verbenaceae)
Not available(Omuunda)
Carpentry, firewood, poles, fruits, fodder, roots cure venereal diseases
Zanthoxylum chalybeum(Rutaceae)
Knob wood(Entareyelungu)
Fi, Po, Dr, Cp, Ca, Sp, Mo, St, leaves cure kwashiorkor and snakebites, bark is drunk against malaria and dizziness
Fi = Firewood, Cp = carpentry, Po = poles, Dr = drums, Ca = carving, Fr = fruits, Fo = fodder, Sp = spoons, Mo = mortars, St = stools, Tl = tool handles, Ut =
57

utensils, Wt = water troughs, Dc = dug out canoes, Ti = timber, Pw = Palm wine, Bo = boles, Rt = ritual tree
CONCLUSIONS Natural forest regeneration was 24,844 seedlings per hectare. M. obovata was the most dominant species (ranked no. 1). P. falcatus was rarely represented (ranked no.19). In terms of volume, M. obovata (ranked no. 4) was amongst the first five dominant species. P. falcatus was also sparsely present (ranked no. 13) and was in high demand due to its decorative wood. The forest was dominated (first 10 ranked) by tree species which had no market value. These results suggest that the forest can not supply the market with P. falcatus on sustainable basis. There is a danger of P. falcatus species getting extinct if the forest will be opened for commercial harvesting. This species should be conserved and ways of improving its regeneration be further investigated. Also other suitable timber species should be explored. Species such as C. polystachus, M. obovata, P. microcarpa and S. guineense are used as timber elsewhere in Tanzania and Kenya.
Less than 13% of adjacent villagers rely on the forest reserve for forest products. The use of tree species in the traditional medicine is very common and traditional healers possess wide knowledge. They boil roots and leaves of E. abyssinica, S. didymobotrya, and V. buchananii and use the mixture in the treatment of syphilis and gonorrhea. There is a need to control access to the forest reserve and regulate harvesting of the resources before it is too late. Villagers in the vicinity can participate under the framework of community based forest management. This policy was formulated in 1998 (MNRT 1998) and most of the foresters are still not conversant with it. They still think of protecting the forests against the destructive villagers. The villagers on their side perceived the forest reserve as government property and as such they had no say on its management.
The government has failed to manage forest reserves due to financial constraints and insufficient manpower. It is expected that through a new policy of co-management the government will incur low costs if villagers manage the forest. The involvement of the local communities in conservation of forest reserve will increase their motivation because their roles in the management will be legally binding and therefore recognized by government. Using incentive schemes and appropriate legal framework, the villagers might become effective managers. Foresters will become technical advisors only and therefore policing will not be needed (Kajembe et al., 2006).
ReferencesBoudreau, S., Lawes, M. J., Piper, S. E., and L. J. Phadima (2005). “Subsistence
harvesting of pole-size understorey species from Ongoye forest reserve, South Africa: Species preference, harvesting intensity and social correlates”. For. Ecol. Manage Vol. 216, No. 1-3: 149-165
Davis, L. S., Johnson, K. N. (1987). Forest Management. Third Ed. McGraw-Hill, New York
58

Dery B. B. and R. Otsyina (2000). “Indigenous knowledge and priotization of medicinqal trees for domestication in Shinyanga Region of Tanzania”. In: A. B. Temu, et al. (Eds): Off Forest Tree Resources of Africa, pp 242 – 253
FAO, (2000) Review and Improvement of Data Related to Wood Production in Botswana. FAO, Rome. http://www.fao.org/DOCREP?003/06745EX6745 E03 .htm
Greene, D. F., Zasada, J. C., Sioris, L., Kneeshaw, D., Morin, H., Charron, I., and Simard, M. J. (1999). “A Review of Regeneration of Boreal Forest Trees”. Can. J. For. Res. 29, 824-839
Godoy, R. (1992), “Some Organizing Principles in Evaluation of Tropical Forests”. For. Ecol. Manage. 50: 171-180
Hamilton, A. C. and R. Bensted-Smith (1989). Forest Conservation in East Usambara Mountains Tanzania. IUCN Tropical Forestry Programme, Switzerland.
Hitimana, J., Kiyiapi, J. L., J. T. Njunge (2004). “Forest structure characteristics in disturbed and undisturbed sites of Mt. Elgon Lower Montane Forest, western Kenya”. Forest Ecol. Manage. 194: 269-291
Kaduvul, K. and N. Parthasarathy (1999). “Structure and composition of woody species in tropical semi evergreen forest of Kalrayan hills, Eastern Ghats, India”. Trop. Ecol., 40: 247-260
Kajembe, G. C., Nduwamungu, J., E. J. Luoga (2006). “The impact of community based forest management and joint forest management on the forest resource base and local people’s livelihoods: Case studies from Tanzania”. Commons southern Africa occasional paper series No. 8
Kajembe, G. C., Nduwamungu, J., Luoga, E. J., Malimbwi, R. E., Njana, R. J. (2004). “The impact of human utilization of catchment forest resource base. A case of North Mamia Kisara catchment forest reserve, Kilosa Disrtict, Tanzania”. Journal of Tanzania Association of Foresters Vol. 10:1-13
Killeen, T. J., Jardim, A., Mamani, F., and N. Rojas (1998). “Diversity, composition and structure of tropical semideciduous forest in the Chiquitania region of Santa Cruz, Bolivia”. Journal of Tropical Ecology 14: 803-827
Kitula, R. A. (2007). “Use of medicinal plants for human health in Udzungwa Mountains Forests: A case study of New Dabaga Ulongambi Forest Reserve, Tanzania”. J. Ethnomedicine 3:7
Kiyiapi, J. L. (2000). “Tree Resources Assessment, Athropogenic Influences and Monitoring Strategies in Medium to Low Agricultural Areas: Some Examples from Tharaka Central and Transmara Disctricts Kenya”. In: A. B. Temu, et al. (Eds): Off Forest Tree Resources of Africa, pg 22 - 43
Lamprecht, H. (1989). Silviculture in the Tropics: Tropical Forest Ecosystems and their Tree Species – Possibilities and Methods on for the Longterm Utilization. Eschborn
Luoga, E. J., Witkowski, E. T. F., and Balkwill, K. (2002). “Harvested and standing wood stocks in protected and communal miombo woodlands of eastern Tanzania”. For. Ecol. and Manage. 164: 15-30
Malimbwi, R. E. and Mgeni, A. S. M (1991). “Preliminary results in the permanent sample plot programme at Mazumbai Forest Reserve”. In: Temu, P. S and Malimbwi, R. E (Eds): Multi product inventory of Tropical Mixed forests;
59

Proceedings of the 14 IUFRO Internatinal Conference at Arusha 5-9 August 1991. Pp 48 – 50
Ministry of Natural Resources and Tourism (1998). National Forestry Policy. Government Printer, Dar es Salaam
Ministry of Natural Resources and Tourism (2002). Forest Inventory Report for the Kimboza Forest Reserve in Morogoro, Tanzania. Forconsult, Faculty of Forestry and Nature Consrvation, Sokoine University of Agriculture. 35pp
Munishi, P. K. T., Maliondo, S. M., Temu, R. P. C., and Msanya, B. M. (2004). “The potential of Afromontane rain forests to mitigate carbon emissions in Tanzania”. Journal of Tanzania Association of Foresters Vol. 10: 14-25
Nathan, R. and Casagrandi R. (2004). “A simple mechanistic model of seed dispersal predation and plant establishment: Janzen-Connel and beyond”. J. Ecol. 92(5) 733-746
Newton, A. C. (2007). Forest Ecology and Conservation: a Handbook of Techniques. Oxford, New York, Oxford University Press, 443pp
Ngulube, M. R. (1995). “Indigenous fruit trees in Southern Africa. Potential of Uacapa kirkiana”. Agroforestry Today 7(3): 14-16
Otieno, J. N., Kajembe, G. C., Malimbwi, R. E., & J. Nduwawamungu (2001). “The contribution of herbal medicine to the welfare of local communities. A case of Babati District, Arusha Tanzania”. Tanzania Journal of Population Studies and Development 8(1): 1-10
Pardos, M., j. R. del Castillo, I. Canellas and G. Montero (2005). “Ecophysiology of natural regeneration of forest stands in Spain”. Invest Agrar: Sist Recur For 14(3), 434-445
Philip, M. S. (1994). Measuring Trees and Forests. 2nd Edition. CAB International, Oxon, UK 310pp
Ruschel, A. R., Guerra, M. P., Moerschbacher, B. M. and R. O. Nodari (2005). “Valuation and characterization of timber species in remnants of the Alto Uruguay River ecosystem, Southhern Brazil”. Forest Ecology and Management, Vol. 217 (1): 103-116
Wending, H., Pohjonen, V., Johannson, S., Nashanda, M., Katingula, M. I. L., Luukkanen. O. (2003). “Species diversity, forest structure and species composition in Tanzanian tropical forests”. For. Ecol. Manage. Vol. 174, No. 1-3: 11-24
Whitmore, T. C. (1975). Tropical Rainforest of the Far East. OxfordWilfred, P., Madoffe, S. S., Luoga, E. J. (2006). “Indigenous Plant Species and Use
Values in Uluguru Mountains, Morogoro”, Tanzania. Journal of East African Natural History 95(2): 235-240
60

Evaluation of Mosquito Traps for Sampling Man-biting Mosquitoes in Rufiji District, Tanzania
1E.S.P. Kigadye, 2G. Nkwengulila 3S. Magesa, 4S. Abdullah1Faculty of Science, Technology and Environmental Studies;
The Open University Tanzania, P.O. Box 23409, Dar es Salaam, Tanzania.
2Department of Zoology and Wildlife Conservation, University of Dar es Salaam,
P. O. Box 35064, Dar es Salaam, Tanzania.3National Institute for Medical Research,
P.O. Box 81, Muheza, Tanzania4Ifakara Health Institute,
P.O. Box 78373, Dar es Salaam, Tanzania.Correspondence E-mail: [email protected]
61

Abstract: The sampling efficiency of CDC light traps relative to human biting catches, in estimating the abundance of mosquitoes caught and their Plasmodium falciparum infection rate was evaluated in the Rufiji District between October 2001 and September 2004. CDC Light trap catches for calibration with human-biting catches were carried out on the same night as human-biting catches over a period of one year. Overall light traps captured 51% of the total catch (Anopheles. gambiae sensu lato. 61%, An. funetus 68% and Culex species. 38%). Light traps recorded significantly higher rates in mosquito density (p < 0.05). There was no correlation in the number of mosquitoes collected by the two methods (An. gambiae s.l. p = 0.2525; An. funestus, p = 0.75; Culex sp. p = 0.3739). The ratios and the geometric mean of the two sampling methods did not differ significantly (r=0.005). Unfed An. gambiae s.l. and An. funestus mosquitoes were more abundant in light traps than in the human biting catches (p < 0.0001) while Culex species mosquitoes where more abundant in human biting catches. There was a significant difference in the P. falciparum sporozoite rate between the two collection methods (p < 0.05). Light traps recorded higher sporozoite rates than human biting rates for both An. gambiae s.l. (p < 0.05) and An. funestus (p < 0.0001). Sampling efficiency of the two mosquito collection methods regarding entomological parameters responsible for malaria transmission is discussed. The present validates the use of light traps as an alternative for human biting catches to estimate the Entomological Inoculation Rates and Vectorial Capicity in malaria transmitting mosquitoes in the study area and Tanzania in general.
Key words: Light traps, Human Biting Catches, Mosquitoes, Rufiji, Tanzania.
INTRODUCTIONDetermining the intensity of malaria transmission by mosquito population is a key component of malaria epidemiological studies (Sithiprasasna et al., 2004). The entomological inoculation rate (EIR) and vectorial capacity (VC) are two key indices of malaria transmission. The methods of measuring these parameters usually have involved human collectors who serve as bait for foraging mosquitoes and collect those attempting to feed on themselves (Garret-Jones and Shidrawi, 1969), with this method mosquitoes are caught while engaged in the very act of biting (Service, 1993). Measuring the biting rates of mosquitoes, therefore, constitutes a very important aspect of entomological monitoring for vector control interventions such as insecticides-treated nets (Magbity and Lines, 2002).
Although human biting catches technique has been widely used, there are ethical and practical reasons for minimizing its use (Sithiprasasna et al., 2004). Human biting catches require high level of organization and is expensive in terms of time and manpower (Lines et al., 1991; Davis et al., 1995). Perhaps the most serious problem arises from the occupational hazard that exposes the human collectors to an increased risk of being bitten by malaria infected mosquitoes and other pathogens (Davis et al., 1995).
Alternatives to human-biting catches include the use of pyrethrum spray-catches, windows-traps, pit-traps (Service, 1993), animal-baited traps (Duchemin et al.,
62

2001), electric nets and counter-flow geometry traps (Mboera et al., 2000), odour baited traps (Costantini et al., 1996; Duchemin et al., 2001), and a variety of light traps (Lines et al, 1991; Mboera et al., 1998; Mboera et al., 2000; Sithiprasasna et al., 2004). Whereas these sampling methods may also capture extra mosquitoes, not only those feeding on humans, they eliminate the occupational exposure to infective vectors and reduce the element of human error in capturing biting mosquitoes.
However, before reliance can be placed on an alternative method as a reliable means to evaluate human-biting activity, the relative yield of mosquitoes captured by different methods needs to be evaluated (Davis et al., 1995). The efficacy of these alternative methods to human landing catches varies greatly and in large part they depends on local anopheline species composition (Sithiprasasna et al., 2004). Mbogo et al. (1993) reported that light-traps did not provide an adequate estimate of human-vector contact (Anopheles gambiae Giles sensu lato and Anopheles funestus Giles) in coastal Kenya, whereas Davis et al. (1995) found that light traps provided an effective and sensitive means for measuring human-biting activity with the same species in coastal Tanzania. Clearly, it is necessary to assess the efficacy of candidate traps against human bait collection as means of conducting surveillance for each particular species of vectors in a given region.
Therefore, the objective of the present study was to determine if Centre for Disease Control (CDC) light traps in combination with bed nets, provide comparable or better data to human-biting collections in Rufiji District, an area where anopheline abundance and malaria transmission intensity were demonstrated to be high (Kigadye, 2006).
MATERIALS AND METHODSStudy area Mosquitoes were collected from six wards in the Rufiji District (7.47°8’S, 38.62°39.17’E), located 150 km south east of Dar es Salaam. The District lies below 500 metres above sea level and an annual rainfall range of 800-1000. According to the perception of local people, and data on malaria incidence from health care facilities, malaria is the foremost health problem for both adult and children in Rufiji District (Kigadye, 2006).
Mosquito collection CDC Light trap catches for calibration with human-biting catches were carried out in the same night as human-biting catches. Mosquito catches were carried out in each of the selected households for two consecutive nights’ monthly over a period of a year. Mosquito were caught using standard Centre for Disease Control light traps (CDC, Atlanta, GA) hung from the ceiling at the foot end of the bed with an un-treated net (Mboera et al, 1998). CDC Light traps were operated between 18.00-0600 hours, mosquitoes were collected in the morning.
The nearest compound from the house in which the light traps were set was selected for indoor and outdoor human biting catches. Indoors and outdoors human biting catches were made by a pair field assistants sitting on stools with their trousers and sleeves rolled up (WHO, 1975). Mosquitoes coming to bite the collectors were
63

detected using a flashlight and were aspirated and placed into paper cups. Hourly collections from 18.00 to 06.00 were kept and recorded separately. Collections were conducted for two consecutive days in each cluster totalling 44 nights (i.e. 22 periods of 2 consecutive nights of collection).
Anopheles gambiae complex were separated from other anophelines and culicines using the keys by Gillies and Coetzee (1987), counted and then stored in labeled eppendorf tubes with desiccant (silica gel) for subsequent laboratory processing at Ifakara Health Research and Development Centre (IHRDC).
Processing of mosquito samplesAt the laboratory, all anopheline mosquitoes were identified, counted and classified according to blood-feeding stages (i.e. unfed, blood-fed, and gravid) as described by WHO, 1975. All mosquitoes were then stored in labelled eppendorf tubes with desiccant (silica gel), and later tested for Plasmodium falciparum circumsporozoite antigen by ELISA as described by Wirtz et al., (1987a) at the Ifakara Health Research and Development Centre (IHRDC).
Data analysisAnalysis was performed using SPSS® software version 10 (SPSS, Inc., Chicago, IL). Mosquito counts were log-transformed [ln (x + 1)] to stabilize the variance. The abundance of anophelines caught by the three light traps was compared with the number caught by two human bait catches on the same night by chi-square analysis. The Chi-square analysis was also used to compare blood feeding status and sporozoite rates between the sampling methods. The relative sampling efficiency was measured as the ratio of the number of mosquitoes caught by the light trap (LTC) to the number caught by the human bait (HBC) (Altman and Bland, 1983). To test whether the relative sampling efficiency of light traps was affected by mosquito density, the relative sampling efficiency, calculated as log(LTC + 1) – log(HBC + 1) was plotted against a joint estimate of mosquito abundance calculated as log(LTC +1) + log(HBC +1))/2 (Altman and Bland, 1983). With this method, the significant sampling efficiency of light traps tends to increase or decrease at higher mosquito abundance i.e. it is biased as a means of measuring changes in density. Ethical clearance and informed consentThe study received ethical approval from the Medical Research Coordination Committee of the National Institute for Medical Research, Tanzania (Certificate No. NIMR/HQ/R.Sa/Vol. IX/192). Informed consent was obtained from Local Health Authorities and Village Committees as well as individual house occupants.
RESULTSMosquito abundanceA total of 2103 female mosquitoes were caught by CDC light traps (n = 132) and human-biting catches (n = 44). Species composition and number of mosquitoes captured by light-traps and human biting catches are presented in Table 1. Overall light traps captured (1049) 51% of the total catch (An. gambiae s.l. 61%, An. funetus 68% and Culex sp. 38%). Malaria vectors were most abundant in light traps than in human-biting catches; An. gambiae s.l. (2 = 49.838, df = 1, p < 0001) and An. funestus (2 = 92.296, df = 1, p < 0001). In contrast, culex sp. mosquitoes were more
64

abundant in human biting catches (2 = 67.113, df = 1, p < 0001). When both mosquito species were pooled, the two methods recorded similar abundance of mosquitoes (2 = 0.3268, df = 1, p = 0.5677). There was no correlation between the number of mosquitoes collected by the two methods (An. gambiae s.l. r = 0.02195, df = 44, p < 0.2525; An. funestus, r = -0.06030, df = 44, p = 0.75; Culex sp. r = -0.1747, df = 44, p = 0.3739).
Table 1: Mosquitoes collected by CDC light-trap and human-biting catches in Rufiji District
CDC light trap catches Human-biting catches
Species No.
cap
ture
Met
hod
(%)
Spec
ies (
%)
No.
cap
ture
Met
hod
(%)
Spec
ies (
%)
Tota
l
%An. gambiae s.l. 474 61 44 306 39 30 780 37An. funestus 205 68 19 97 32 9 302 14Culex sp 390 38 36 631 62 61 1021 49Both 1069 51 100 1034 49 100 2103 100
Figure 1 also shows that the vertical scatter of the observations (i.e. variance of the log-ratios) showed little or no relationship to mosquito density. There was no difference between species in relationship between light trap and human biting catches (p > 0.05). The relationship between methods was not influenced by interactions of location and date of collection for An. gambiae s.l. (p > 0.05) or for An. funestus (p > 0.05).
Blood feeding statusTable 2 summarizes the results of the comparison of the abundance of mosquitoes according to the blood feeding status as recorded by CDC light traps and human biting catches. The majority of the female mosquitoes were unfed, with higher rates of unfed among samples captured by light-traps than human biting catches for An. gambiae s.l. (2 = 112.70, df = 1, p < 0.0001), An. funestus (2 = 45.975, df = 1, p < 0.0001), but were similar in Culex sp. (2 = 2.274, df = 1, p = 0.1316). Blood fed mosquitoes were more abundant in human-biting catches than in light-traps for An. gambiae s.l. (2 = 47.485, df = 1, p < 0.0001) and Culex sp. (2 = 8.904, df = 1, p < 0.05), but there were similar rates for An. funestus (2 = 0.7902, df = 1, p = 0.3740). Gravid mosquitoes were captured at a more or less similar rate by both light traps and human-biting collections for An. gambiae s.l. (2 = 3.528, df = 1, p = 0.0603) and An. funestus (2 = 0.07085, df = 1, p = 0.7901). However, for Culex sp. the unfed were captured at a higher rate by human biting catches than light traps (2 = 0.349.21, df = 1, p < 0001).
65
-6
-4
-2
0
2
4
6
0 0.5 1 1.5 2 2.5 3 3.5
(log (LTC+1) + log(HBC+1))/2
log
(LTC
+1) -
log
(HB
C+1
)
Figure 1: The relationship between the relative sampling efficiency of light trap catches: log (LTC + 1) – log (HBC + 1) and mosquito abundance (log (LTC + 1) + log (HBC + 1)/2) in Rufiji District. The solid line is the slope of the regression line (p > 0.05)
Sporozoites rateThe Plasmodium falciparum sporozoite rate of An. gambiae s.l. and An. funestus according to collection method from the Rufiji District are summarized in Table 3. There was a significant difference between the four collection methods for both An. gambiae s.l. and An. funestus (p < 0.05). Light traps recorded higher rates than human biting rates for both An. gambiae s.l. (2 = 6.095, df = 1, p < 0.05) and An. funestus (2 = 106.04, df = 1, p < 0.0001).
Table 2: Mosquito blood feeding status according to collection method, Rufiji DistrictSpecies An.gambiae s.l.
Mosquito abdominal stages % (number)Unfed Fed Gravid Total
CDC Light trap 92(435) 5(26) 3(13) 474Human biting catches 74 (227) 20(60) 6(19) 306
An. funestusLight trap 95 (194) 2(4) 3(7) 205
66
Human biting catches 73(71) 21(20) 6(6) 97Culex sp.
Light trap 86(335) 12(48) 2(7) 390Human biting catches 74(465) 16(101) 10(65) 631
Both speciesLight trap 90(964) 7(78) 3(27) 1069Human biting catches 75(763) 16(181) 9(90) 1034
Table 3 Plasmodium falciparum infection rates for An. gambiae s.l. and An. funestus captured by CDC light traps and human biting collections in Rufiji District
% positive (n) by ELISAAn. gambiae s.l. An. funestus Both
Light traps 3.5 (663) 3.0 (93) 3.0 (756)Human bait 2.48 (563) 1.63 (61) 2.4 (624)
DISCUSSIONThere is no documented study that has evaluated CDC lights with the standard human-biting catches as a method for sampling mosquitoes in south-eastern Tanzania. Lines et al., (1991) in northern-eastern Tanzania and Davis et al., (1995) in coastal Tanzania concluded that CDC light traps could be used to monitor population densities of An. gambiae complex and An. funestus. The present study concludes by suggesting that light-traps may be appropriate alternatives to human-biting collections in Rufiji District south- eastern Tanzania. However, there are many limitations associated with the traditional methods of sampling malaria vectors. Such limitations can only be overcome if the behaviour of the vectors– particularly the variation in the attractiveness of individual person to mosquitoes, are well understood (Mboera, 2005). Mosquito traps that incorporates human body odour would be environmental friendly and they may provide an alternative approach to the human biting catches (Mboera, 2005).
The results of the present study showed that light traps caught larger numbers of female mosquitoes of both the malaria vectors (An. gambiae complex and An. funestus) and the non-malaria vector (Culex sp.) than human biting catches performed on the same night. These results indicate that light-traps may be a sensitive means to estimate human-biting activity of the malaria vectors An. gambiae complex and An. funestus as well as non-malaria vectors such as Culex sp. These observations confirm the findings of Lines et al., (1991) and Davis et al., (1995) in coastal Tanzania, Constantini et al. (1998) in Burkina Faso and Magbity et al., (2002) in Sierra Leone, but are contrary to reports by Mbogo et al., (1993). Furthermore, the number of female anopheline captured did not correlate significantly with those obtained from human biting catches. The absence of clear relationship between human biting catches and light trap in the present study was attributed to relatively low mosquito densities. Smith (1995) reported similar findings.
67

The ratio between light traps and human biting catches observed in the present study varied independently of changes in mosquito density. Hence light traps and human-biting catches were not biased in their sampling of anopheline and culicine mosquitoes. On several occasions and locations, a wide range of densities of An. gambiae s.l., An. funestus and Culex sp. were encountered. This is good evidence that the relative sampling efficiency of light traps and human-biting catches observed in the present study was similar for the three mosquito species. Several studies have reported differences in sampling ratios between light traps and human-biting catches (Hii et al., 2000). Therefore, the results indicate that there was no significant tendency for the ratio human-biting catches/light traps to increase with increasing mosquito abundance.
The results of the present study indicate that unfed mosquitoes comprised the majority of those captured by light-traps, and that, human-biting catches collected more blood-fed mosquitoes than light-traps. These observations strongly corroborate those by Mbogo et al., (1993) in coastal Kenya and Davis et al., (1995) in coastal Tanzania. Therefore, the use of light-traps in conjunction with bed-nets decreased the number of blood-fed mosquitoes as > 70% of the mosquitoes were unfed and presumably were trapped while host-seeking. Although it is possible that blood-fed mosquitoes caught by light traps fed outdoors but were resting indoors when captured, it remains that a greater proportion of blood-fed mosquitoes captured by both methods tested positive for human immunoglobulin, suggesting that these mosquitoes could feed equally both outdoors and indoors. In addition, it has been observed that Anopheles mosquitoes require two to three blood meals before eggs can be produced (Lymo and Takken, 1993).
Results showed that P. falciparum sporozoites rate among the anophelines captured by light traps were 1.5-2-fold higher than that from human-biting catches. Hence, these results corroborate reports from Kilifi, Kenya by Mbogo et al. (1993), and Davis et al. (1995) at Bagamoyo, Tanzania. Davis et al. (1995) argued that the difference in sporozoites rate between collection methods resulted from the differential attraction to light-traps of mosquitoes with different abdominal conditions. The higher infection rates in light trap collections were attributed to a higher proportion of gravid females (Davis et al., 1995). There is a good possibility that light traps attracted a substantial proportion of the indoor-resting populations, which have higher parity rates and higher infection rates than host seeking mosquitoes (Petrarca et al., 1991). Therefore, it is likely that gravid mosquitoes, with their higher sporozoite rates, were attracted to the light-trap and captured while attempting to exit the house during the oviposition flight (Service, 1970). These results seem to suggest that an evaluation of the sporozoites rate among unfed anophelines captured by light-traps may provide a more precise EIR and malaria transmission estimates than those from human-biting catches. However, human biting catches remains the golden standard method in estimating mosquito density and EIR. This is particularly important as there are ethical and practical reasons for minimizing the use of human biting catches (Sithiprasasna et al., 2004).
68

Light traps recorded significantly larger numbers in terms of mosquito abundance, abdominal condition and sporozoites rates than human biting catches and other techniques in Rufiji district. It is, therefore, reasonable, to suggest that light traps might be used as an alternative to human biting catches for evaluating human-biting activity and malaria transmission during future studies on interventions for malaria in Rufiji district.
ACKNOWLEDGEMENTSThe authors wish to thank The Open University of Tanzania (OUT), the National Institute for Medical Research (NIMR) and the Ifakara Health Research and Development Centre (IHRDC) for financial and material support.
ReferencesAltman, D.G. & Bland, J.M. (1983) “Measurements in medicine: the analysis of
method comparison studies”. Statistician 32, 307-317. Constantini, C., Gibson, G., Sagnon, N., Della-Torre, A., Brady, J., & Coluzzi, M.
(1996) “Mosquito response to carbon dioxide in a West African Sudan savanna village”. Medical Veterinary Entomology 10, 220-227.
Costantini, C., Sagnon, N.F., Merzagora, L., & Coluzzi, M. (1998) “Relationship to human-biting collections and influence of light and bed nets in CDC light-trap catches of West African malaria vectors”. Bulletin of Entomological Research 88, 503-511.
Duchemin, J.B., Tsy, J.M., Rabararison, P., Roux, J., Coluzzi, M. & Costantin, C. (2001) “Zoophily of Anopheles arabiensis and an. An. gambiae in Madagascar demonstrated by odour-baited entry traps”. Medical Veterinary Entomology 15, 50-57.
Davis, J.R., Hall, T., Chee, E.M., Majala, A., Minjas, J. & Shiff, C.J. (1995) “Comparison of sampling anopheleine mosquitoes by light-trap and human-bait collections indoors at Bagamoyo, Tanzania”. Medical Veterinary Entomology 9, 249-255.
Garret-Jones, C. & Shidrawi, G.R. (1969) “Malaria vectorial capacity of a population of Anopheles gambiae”. Bulletin of World Health Organization 40, 531-545.
Kigadye, E.S.P. (2006) “Diversity, Abundance and Vectorial Capacity of Anopheline Mosquitoes and the risk for malaria in the Rufiji District, Tanzania”. Ph.D. Thesis. University of Dar es Salaam. 204pp.
Lines, J.D., Curtis, F.C., Wilkes, T.J. & Njunwa K.J. (1991) “Monitoring human-biting mosquitoes (Diptera: Culicidae) in Tanzania with light traps hung beside mosquito nets”. Bulletin of Entomological Research 81, 77-84.
Magbity, E.B. & Lines, J.D. (2002) “Spatial and temporal distribution of Anopheles gambiaes.l. (Diptera: Culicidae) in two Tanzanian villages: implication for designing mosquito sampling routines”. Bulletin of Entomological Research 92, 483-488.
Mboera, L.E.G., Kihonda, J., Braks. M.A.H. & Knols, B.G.J. (1998) “Short report: influence of Center for Disease Control light traps position, relative to a man-baited bed net, on catches of Anopheles gambiae and Culex quinquefasciatus in Tanzania”. American Journal of Tropical Medicine and Hygiene 59, 595-596.
69
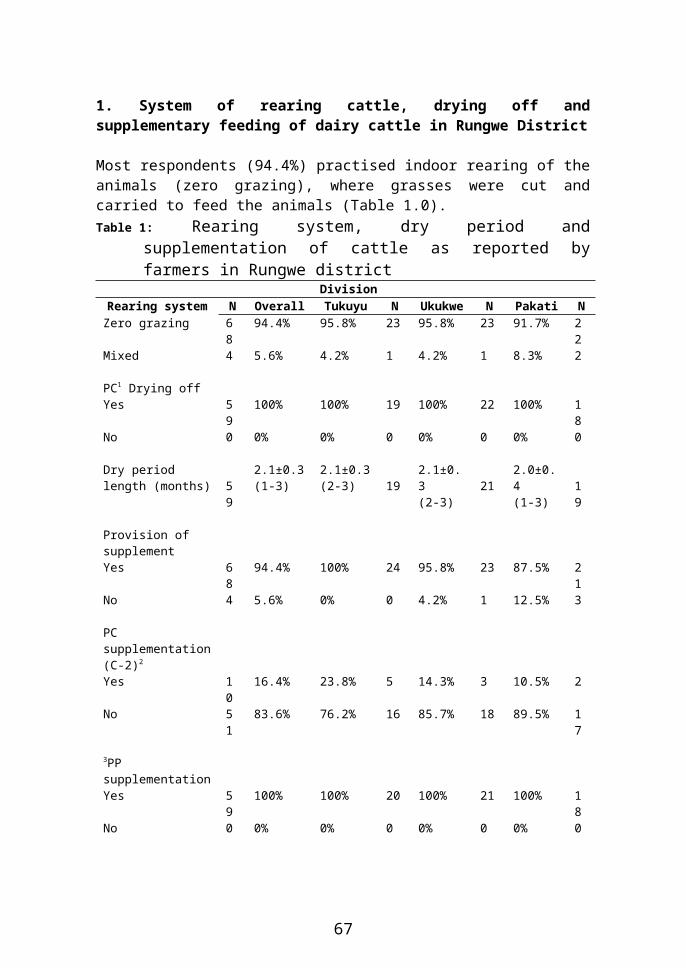
Mboera, L.E.G., Knols, B.G.J. Braks M.A.H. & Takken, W. (2000) “Comparison of carbon dioxide-baited trapping system for sampling outdoor mosquito population in Tanzania”. Medical Veterinary Entomology 14, 257-263.
Mboera, L.E.G., Kamugisha, M.L., Malima, R.C., Mushi, A.K., Msuya, F.H., Massawe, T. & Kitua, A.Y. (2002) “Malaria prevalence and health-seeking behavior among communities of the lowlands and highlands of Gonja, Same District, north-eastern Tanzania”. Tanzania Health Research Bulletin 4, 47-53.
Mboera, L.E.G. (2005) “Sampling techniques for adult Afrotropical malaria vectors and their reliability in the estimation of entomological inoculation rate”. Tanzania Health Research Bulletin 7, 117-124.
Mbogo, C.N., Glass, G.E., Forster, D., Kabiru, E.W., Githure, J.L., Ouma, J.H. & Beier, C.J. (1993) “Evaluation of light traps for sampling mosquitoes in Kilifi, Kenya”. Journal of American Mosquito Control Association 9, 260-263.
Petrarca, V., Beier, J.C., Onyango, F., Koros, J., Asiago, C., Koech, D.K. & Roberts, C.R. (1991) “Species composition of the Anopheles gambiae complex (Diptera: Culicidae) at two sites in western Kenya”. Journal of Medical Entomology 28, 307-313.
Service, M.W. (1970) “A critical review of procedures for sampling populations of adult mosquitoes”. Bulletin of Entomological Research 67, 343-382.
Service, M. (1993) Mosquito Ecology: Field Sampling Methods. Applied Science Publishers, London, 583pp.
Sithiprasasna, R., Jaichapor, B., Chanaimongkol, S., Khongtak, P., Lealsirivattanakul, T., Iiang-Trong, S., Burkett, D.A., Perich, M.J., Wirtz, R.A. & Coleman R.E. (2004) “Evaluation of candidate traps as tools for conducting surveillance for Anopheles mosquitoes in a malaria–endemic area in western Thailand”. Journal of Medical Entomology 41, 151-157.
Smith, T. (1995) “Proportionality between light trap catches and biting densities of malaria vectors”. Journal of American Mosquito Control Association 11, 377-378.
Wirtz, R.A., Burkort, J.R., Graves, P.M. & Andre, R.G. (1987a) “Field evaluation of enzyme linked immunosorbent assay for Plasmodium falciparum and Plasmodium vivax sporozoites in mosquitoes (Diptera: Culicidae) from Papua New Guinea”. Journal of Medical Entomology 24, 433-437.
WHO (1995) Vector control for malaria and other mosquito-borne diseases. Technical Report Series 857. World Health Organization. Geneva.
Heavy Metal Levels in Drinking Water: Mining Area vis-à-vis Poorly Planned City in Tanzania
I.A. Tarimo1 and J. A. Saria2
Faculty of Science, Technology and Environmental Studies, The Open University of Tanzania, P. O. Box 23409, Dar es Salaam,
70
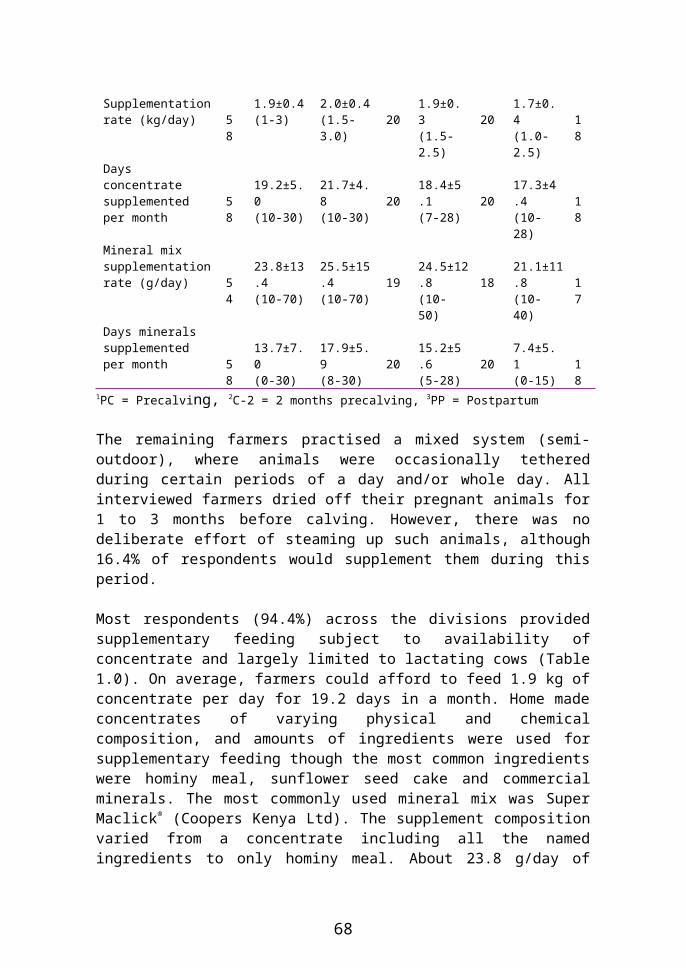
Tanzania
Abstract: Water quality was determined in Block B tanzanite mining area, residential areas closer to mining site and within Dar es Salaam city for comparison. Water samples were analysed for Cd, Cu, Pb, Zn, Mn, Fe, pH, TDS and EC. The concentration (ppm) of heavy metals at Block B were Cd (0.25 ± 0.10), Pb (0.71 ± 0.33), Zn (8.49 ± 0.01) and Mn (11.38 ± 0.56) while TDS was 5028.02 ± 21.44 , which is approximately twice than acceptable value by WHO. Most of these metals could be attributed to decay; decomposition and leaching of old used materials in the mining sites. Weathering and erosion of bed rocks could be another source. Generally, the concentration of heavy metals at Dar es Salaam tap water supply system were higher than level detected at residential areas (Mererani village), which is about 20 km from mining site. The disposal of untreated waste products and age of pipes could be the source of these metals in water systems.
Key words: Heavy metals; Mining sites; Mererani; Block B, Tanzanite, Dar es Salaam.
INTRODUCTIONGlobally, heavy metal contamination to water has become a major challenge. They are regarded as serious pollutants of aquatic ecosystems because of their environmental persistence, toxicity, bio-accumulation and bio-magnifications in the food chain (Vall and Lorenzo, 2000; Gochfeld, 2003). Though they are present at low concentration in aquatic ecosystem, the deposits of anthropogenic origin have raised their concentration, creating environmental problems in lakes, rivers, streams as well as households. Some of these pollutants are directly discharged into environment or water bodies by industrial plants and municipal sewage. Other potential source of pollutants are human activities such as mining and agricultural activities (Kishe and Machiwa, 2003; Ahmet, et al., 2006).
Tanzania, is blessed of having big fresh water sources like the lakes, rivers and springs. The contamination of these water bodies is very common from the discharge of untreated or partially treated industrial waste, disposal of domestic or sewage drainage. One major concern that requires attention is the contamination due to mining industry. The mining activities discharge untreated effluents to the water bodies leading to health risk to consumers. Durkin and Herrmann (1994), in their assessment on the environmental protection concluded that “problems related to mining waste may be rated as second only to global warming and stratospheric ozone depletion in terms of ecosystem risk. The release to the environment of mining water can result in profound, generally irreversible destruction of ecosystem”. It has been established that about 250,000 persons are involved in small scale mining activities in Tanzania (Straaten, 2000). Therefore, intake of pollutants like heavy metals have damaging effects on human beings and other animals, since there is no mechanism for their elimination (Bahemuka and Mubofu, 1999).
Like many other African countries, Tanzania is experiencing impact of environmental degradation. Dar es Salaam city for example, has witnessed a significant increase in population and industrial activities. These have led to
71

conversion of open spaces into industrial and residential areas (Machiwa, 1992). The effects have resulted into uncontrolled disposal of domestic and industrial waste and put constraint on access clean water. The Dar es Salaam water infrastructure was constructed in the 1950s when the city population was about 78,000 (Mwakalila, 2007). In 2005, the population was about 3.5 million people with the same distribution system (Mwakalila, 2007). The poor supply of water is hampering health care providers' efforts to maintain normal services and has already led to an increase in the number of cases of cholera and other diseases. The city needs more water than what the plants were initially set to produce. According to a Government official at least 52 cases of cholera have been reported in part of Dar es Salaam city this year.
Piped water supply system in Dar es Salaam city is too old to meet the demand of its population. That has lead to a loss of more than 40% of water produced by the piped supply system (Saria, and Mbogo, 2000). Even with the boreholes that have more recently been drilled in various parts of the city contributing an additional 27,000 m3/day (Kjellen, 2000) still the piped supplies are overwhelmed. Currently Upper Ruvu supplies as only 270,000 m3/day while the demand is about 400,000 m3/day (Mwandosya and Meena, 1998). As a result water rationing is a common phenomenon in Dar es Salaam city. Dahi and Jens (1992) indicated that trash and soil may siphon in water supply pipes especially when the pressure is very low. The sub-terrain sometimes is infected with sewage water from sewage leaking systems and from thousands of latrines, septic tanks, and cess pits in the city. Also the tertiary distribution pipes in Dar es Salaam city are generally in bad state of repair with inexpedient levels of leakages and unnecessary losses of pressure. As observed by Dahi and Jens (1992), the pipes are often laid in the immediate vicinity of pit-latrines, and stagnant pools are seen in many areas due to lack of draining facility. In addition to this, the increase in city population is likely to increase exponentially the toxic metal pollution.
Due to continuous discharge of large untreated effluents from industrial activities, sewage and agricultural runoff, the water in Dar es Salaam city seems to pose high risks to human health. However, like many other African cities, Dar es Salaam lacks consistent and reliable data on the water quality (Davies, 1996). Like mining waste effluents, house-hold and city sewage effluents require the application of specially or custom designed waste water treatment plants which are rarely available in developing countries.
In this paper, the contamination of heavy metals in water obtained from Mererani tanzanite mining site in Manyara region was investigated. Heavy metal contamination in water sample from residential area (Mererani village) was also determined. The background concentration values for heavy metals in water were analyzed from Kilimanjaro International Airport which is about 22 km east of the mining site. For more comparison heavy metal analysis in piped water supply system at Dar es Salaam city was done.
MATERIAL AND METHODSSampling area
72

Samples were collected from Mererani (03º87' S and 36º55' E) and Dar es Salaam city (6°48’E and 39°17’S). Mererani has a population of about 200,000, where the unique precious stone tanzanite is mined (Figure 1). Block B which is designated for small miners is closer to Mererani village which is about 6 km from mining site. Kilimanjaro International Airport (KIA) is about 22 km from Mererani mining site. KIA was included as a control assumed it is pristine site.
Dar es Salaam city is commercial city located on the middle eastern of Tanzania, covers about 1590.5 km2 with a population of about 4 million people (Figure 2). It is a socio-economic, commercial, industrial and educational hub of Tanzania.
Figure 1: Map of Mererani Mining Area
73
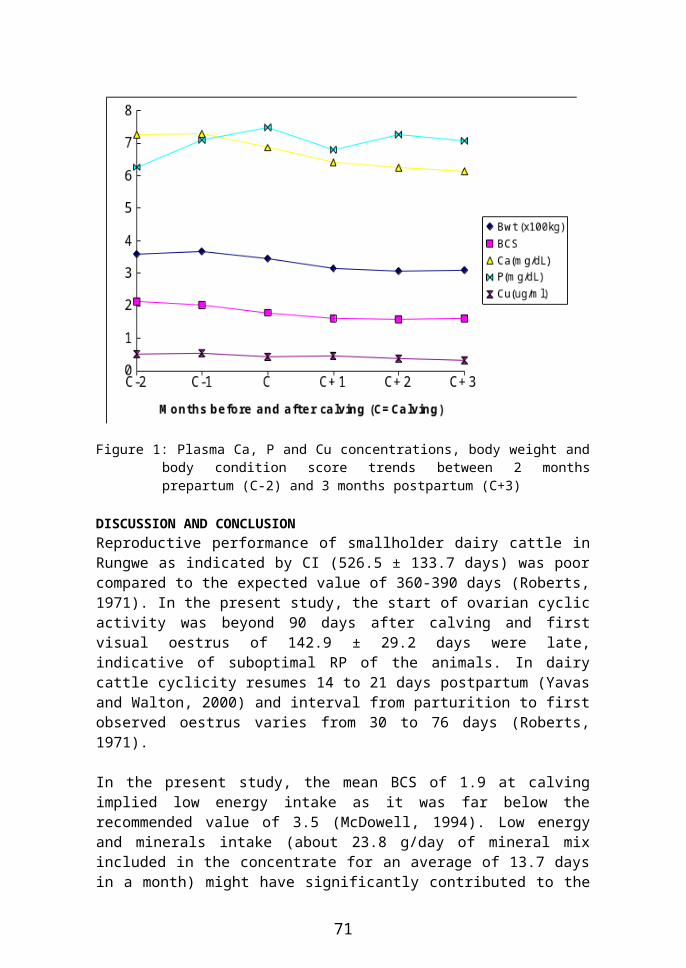
Figure 2: Map of Tanzania Showing Dar es Salaam City With Three Municipalities
Sample Collection and AnalysisWater samples (500 mL) were collected from three different locations of Mererani mining site. Five samples of ground water were sampled from Block B. Forty two shallow well samples were collected from Mererani village and nine samples were collected from Kilimanjaro International Airport. In Dar es Salaam city, seven samples from tap water were collected randomly from each municipality (Temeke, Ilala and Kinondoni), making a total 21 water samples. Physical chemical parameters (pH, conductivity and TDS) were measured “in situ” on site using Perkin-Elmer (1983) standard procedure. Samples for heavy metal analysis were collected in a 1.5 M nitric acid washed polyethylene bottles. The bottles were cleaned three times with distilled water. Sampling procedure was done according to procedure described in Standard Methods for the Examination of Water and Wastewater (APHA, 2000). Immediately after sampling the samples were preserved by the addition of a few drops of concentrated nitric acid. Then samples were transferred in anicebox and processed within 18 – 24 hours.
The Atomic Spectrophotometer (AAS) DeterminationThe water sample was aspirated into the instrument after all necessary set-up and standardization procedures. All metals were determined by Atomic Absorption Spectrophotometer (AAS), Pelkin-Elmer AA700. The instrument was calibrated with standard chemical solutions prepared from commercially available chemicals
74

(Merck, Germany). For analytical quality assurance, the result of each metal was corrected by subtracting the value from the blank. Analytical blanks were run in the similar way as that of the samples and the concentrations were determined using the standard solutions prepared in the same matrix. After every five sample readings, standards were run to make sure that the obtained results were within range. Other AAS conditions employed in these determinations are summarized in Table 1.
Table 1: Standard AAS Conditions for measuring the Heavy MetalsElement Wavelength
(nm)Slit width
(nm)Lamp Current
(mA)Detection
LimitCd 228.8 0.7 4 0.001Cu 324.7 0.7 15 0.001Pb 283.3 0.7 10 0.01Mn 279.5 0.2 5 0.02Fe 248.3 0.2 30 0.004Zn 213.9 0.7 15 0.01
RESULTS Table 2 indicates that mine pit (Block B) has the highest concentration of heavy metals than other sampling sites, followed by Mererani village which is only about 6 km from the mining site. Samples from KIA detected lower concentrations compared to those from mining site and residential area (Mererani village). With exception of Cu and Zn all the levels of analyzed heavy metals were higher than the maximum acceptable limit in water by WHO (1998) and Tanzanian Bureau of Standard (TBS, 2004).
Table 2: Average metal concentration from selected mining Site (Mean concentration ± S.D in ppm)
Metal Block B Mererani KIA WHO (max. limit)
TBS (max. limit)
Cd 0.25 ± 0.10 0.05 ± 0.01 b.d. 0.05 0.05
Cu 0.19 ± 0.02 0.17 ± 0.10 0.02 ± 0.01 1.50 3.00
Pb 0.71± 0.33 0.08 ± 0.01 b.d. 0.10 0.05
Zn 8.49 ± 0.01 0.02 ± 0.02 b.d. 15.00 15.00
Mn 11.38 ± 0.56 b.d. b.d. 0.50 0.50
Fe 7.52 ± 0.40 0.13 ± 0.01 6.08 ± 0.70 1.00 1.00
pH 6.72 ± 12.02 6.82 ± 4.01 6.77 ± 2.30 6.50-9.50 6.50-9.50
TDS (mg/l) 5028.02 ± 21.44 693.53 ± 13.47 1131.00 ± 34.90 500 1000
EC (μS/cm) 7040 ± 16.37 1480 ± 22.68 2020 ± 34.89 1000 2000
b.d. means below detection limit; EC Electrical conductivity
The levels of Cd at Mererani mining pit is 5 times higher than the WHO and TBS maximum limit, while the residential area (Mererani village) is within the maximum acceptable limit. This is contrary to metals like Mn, which is 23 times higher at mining pit but it is below detection limit at residential areas. Lead concentration at mining pit is 7 times than WHO limit, while at KIA it is lower than maximum acceptable levels by TBS.
75

Physical chemical water parameters determined were pH, TDS and conductivity. The pH levels of water sample at the mining sites were acidic ranging from 6.72 ± 12.02 – 6.82 ± 4.01. Conductivity ranges from 1480 ± 22.68 μS/cm – 7040 ± 16.37 μS/cm where highest level detected at mining site followed by KIA and the lowest was at residential area.
Dar es Salaam City tap water supply system, heavy metals levels were below maximum acceptable limit by WHO or TBS (Table 2). The physical chemical parameters also were below the maximum acceptable levels by WHO or TBS. However, pH, TDS and Conductivity levels were in the order of Kinondoni > Temeke > Ilala.
Table 3: Heavy metal concentration from water piped Dar es Salaam Municipalities (Mean concentration ± S.D in ppm)
Metal Kinondoni Ilala Temeke WHO TBS
Cd b.d. b.d. b.d. 0.05 0.05
Cu 0.05 ± 0.03 0.06 ± 0.02 0.03 ± 0.04 1.50 3.00
Pb b.d. b.d b.d 0.10 0.05
Zn 0.13 ± 0.12 0.070 ± 0.05 0.36 ± 0.02 15.00 15.00
Mn 0.20 ± 0.01 0.21± 0.02 0.15 ± 0.20 0.50 0.50
Fe 0.55 ± 0.34 0.62± 0.02 0.49 ± 0.04 1.00 1.00
pH 8.28 ± 0.54 7.69 ± 0.71 8.10 ± 9.06 6.50-8.50 6.50-9.20
TDS (mg/l) 315 ± 56.06 95 ± 13.03 215 ± 43.03 500 1000
EC (μS/cm) 650 ± 67.03 200 ± 42.04 360 ± 21.03 1000 2000
DISCUSSIONSamples from Mererani tanzanite mining indicated that the highest concentration of heavy metals can be arranged in the order of Mining pit (Block B) > residential area (Mererani village) > KIA. The concentration of metal like Cd, which was detected to be 0.25 ± 0.10 ppm at Block B decreased to 0.05 ± 0.01 ppm at residential area and then below detection limit at Kilimanjaro International Airport. The spatial distribution of heavy metals like this Cd using digital elevation model (DEM) using 2D and 3D models is shown in Figure 3.
76

0.00
0.04
0.08
0.12
0.16
0.20
0.24
0.28
L e gen dM in e B lo c k sR e side ntia l a re a s
S ca le
Con
cent
ratio
n
1
2
3
4
5
6
7
8
9
1 0
11
1 2
1 3
S c ale
Con
cent
rati
on
L e g e n dM in e B lo ck sR e sid e n tia l a rea s
Figure 3: Contour map and DEM showing average concentration of Cd and Zn in Water
Figure 3 shows the concentration of these two metals is decreasing down stream to the residential area. Other metals determined in the mining site seem to follow the same trend as this of Cd and Zn. The concentration of heavy metals shown in Table 1 in the mining site was comparable with those established earlier by other researchers at Lupa gold mining Table 3 (Mnali, 2001).
Table 3: Comparison of Concentration of Heavy metals in Block B with previous study (ppm) Mining Site Metal
Metal Cd Cu Pb Zn Mn FeLupa Gold mining site 0.03 30.00 0.50 n.d. n.d. n.d.Block B tanzanite site 0.25 0.19 0.71 8.49 11.38 7.52
Source: Mnali, S. R. (2001), Tanz. J. Science, 27A, 2001.The increased concentration of Pb and Cd in water samples is a clear indication of leaching of discarded batteries, explosives, cables and metal scraps used during blasting. Also host rocks at Mererani site has been determined earlier by other researchers to be rich in these metals as shown in Table 4 (Malisa, 2002). They can contribute significantly to the levels of these heavy metals in drinking water through weathering and erosion processes.
Domestic and atmospheric deposition may be the major source of the high level of Pb. The presence of Pb may be attributable to the use of leaded petrol and diesel in mining automobile engines and batteries (Irene, 2007). The dissolved metal ions result into elevation of the conductivity and total dissolved solids of water samples. The free metal ions are co-precipitated with the low mobile of metals in acidic conditions (Irene, 2007, Appelo and Postma, 1999). The dissolution of metals was also enhanced by the low pH of the water and the mining site which was indicated to be in acidic condition.
77
Table 4: Heavy metal concentration in rocks at Mererani mining site (mg/kg)Rock Ag As Co Cr Cu Ni Pb Zn
A 4.0 1.9 40.0 165.0 42.0 130.0 10.1 200.0B 6.0 205.0 220.0 160.0 50.0 64.0 44.0 70.0C 5.0 0.9 33.0 90.0 20.0 36.0 n.d. 60.0D 4.0 1.3 7.0 90.0 44.0 430.0 15.0 410.0E 0.4 2.3 5.9 80.0 60.0 1560.0 4.0 1900.0F 3.3 1.7 12.8 19.0 18.6 42.0 4.0 36.0G 1.2 1.7 13.0 180.0 20.0 790.0 2.0 940.0
A= Pelitic gneisses; B = Psammitic gneisses; C = Pegmatites; D = Hydrothermal altered E = iron reach rock; F = Carbonate- gypsum; G = Carbonate-rich Source: Malisa, E. P. (2002), J. Sci 29 (1), 2003.
The concentration of heavy metals sampled from Dar es Salaam city was below the acceptable levels by WHO (1998) and TBS (2004). When compared with levels from residential sites at mining site, the concentration in Dar es Salaam municipalities were higher except Cd, Cu and Pb. Example Zn level sampled at Temeke municipality was eighteen times higher than level detected at Mererani village. Iron level at Dar es Salaam municipalities was approximately four times higher than those detected at Mererani village. The high level of metals in supply water system at Dar es Salaam city was not surprising. This is due to industrial and municipal untreated influent discharged into the environment. In some cases, the disposal of untreated sewage has reported to contribute significantly to the level of heavy metals in the aquatic environment (Martin and Ryan, 1982). We can compare levels detected at Kilimanjaro International Airport which is assumed to be pristine and the levels detected at poorly planned city of Dar es Salaam. Except Fe (6.08 ± 0.70 ppm) probably came from corrosion of water pipe, and Cu (0.02 ± 0.01 ppm) below the acceptable levels by WHO (1998) and TBS (2004), other heavy metals were not detected at KIA. In the physical chemical water parameters, high pH in Dar City and the low conductivity decrease the solubility and mobility of heavy metal ions resulting low TDS in the water.
CONCLUSIONMererani water samples were found to have high concentration of heavy metals relative to WHO (1998) and TBS (2004) acceptable levels suggesting anthropogenic sources. High levels of these metals could be attributed to decay, decomposition and leaching of discarded batteries, old metal scraps and explosives remaining in the mining sites. Weathering and erosion of bedrocks could be another source of heavy metals in water at Mererani. The contamination of water at mining site contributes significantly to the contamination of water in residential areas. These elements may have relatively high toxicity effects in the environment and health hazards to human beings. Dar es Salaam residents are not safe in terms of heavy metal contamination compared to other planned areas. The major source of piped water supplied in the city is domestic and municipal siphoned in damaged water pipe as a result of poor sewage and waste management.
78
RECOMMENDATIONSSince water is basic to human beings, regular inspection of water systems is needed to avoid supply contaminated water to the public. The laws regulating these waters must be reviewed with time and strictly enforced. There is every reason to develop health education and to disseminate it to the public for awareness of waste water treatment and waste management. This could raise awareness of people on the advent effects of untreated effluent and waste on the environment and hence to water supply and food chain in the ecosystems.
ACKNOWLEDGEMENTWe highly acknowledge Sida-SAREC for funding this work. We also acknowledge The Open University of Tanzania and University of Dar es Salaam for facilitating this work which was done smoothly and for allowing us to instruments at their laboratory.
ReferencesAhmet, D.; Yilmaz, F.; Tuna, A. and Nedim, O. (2006), “Heavy Metal in Water,
Sediment and Tissues of Leuciscus cephalus from a Stream in Southern Western Turkey”, Chemosphere, 63, 1451 – 1458.
APHA (2000), Standard Methods for the Examination of Water and Waste Water, 20th ed. Washngton, DC; USA.
Appelo, C. A. and Postima, D. (1999), Geochemistry, Ground Water Pollution, A. A. Balkema, Rotterdam Netherlands pp 188 – 183.
Bahemuka, T. E. and Mubofu, E. B. (1999), “Heavy Metals in Edible Vegetables Grown Along the Sites of the Sinza and msimbazi Rivers in Dar es Salaam, Tanzania”, J. Food Chemistry, 66, 63 – 66.
Dahi, E. and Jens, T. (1992), Levels and Mechanism of Contamination of Drinking Water in Dar es Salaam: Selected Fields on Hygienic Drinking water Quality in Tropics, Centre for Developing Countries, Technical University of Denmark.
Davies, T. C. (1996), “Chemistry and Pollution of Natural Waters in Western Kenya”, J. Afr. Earth Sci. 23 (4), 547 – 563.
Durkin, T. V. and Herrmann, J. G. (1994), “Focusing on the Problems of Mining Waste; An Introduction to Acid Mine Drainage. Managing Environmental Problems at Inactive and Abandoned Metal Mine Sites”. EPA Seminar Publication Number EPA/625/R-95/007.
Gochfeld, M., (2003), “Cases of Mercury Exposure, Bioavailability, and Adsorption”. Ecotoxicol. Environ. Safety 56, 174 – 179.
Irene, A. T. (2007), “Heavy Metals Pollution in Waters from Mining Activities in Mererani, North-Eastern Tanzania”, M. Sc.Thesis, Faculty of Science, Geology Department, University of Dar es Salaam, Tanzania.
Kishe, M. A. and Machiwa, J. F. (2003), “Distribution of Heavy Metals in Sediments of Mwanza Gulf of lake Victoria”, Tanzania Environment International 28, 619 – 625.
Kjellen, M. (2000), “Complementary Water Systems in Dar es Salaam, Tanzania: Case of Water Vending”, International Journal of water Resource development, 16 (1),143 - 154.
79

Machiwa, J. F. (1992), “Heavy Metal Content in Coastal Sediments of Dar es Salaam Tanzania”, Environ. Int. 18: 409 – 415.
Malisa, E. P. (2002), “Trace Elements Characterization of Hydrothermally Deposited Tanzanite and Green Grossular in the Mirerani-Lelatema Shear Zone, Northeast Tanzania”, J. Sci. 29 (1), 2003.
Martin, G. and Ryall, C. A. (1982), Pollution Threat of Heavy Metals in Aquatic Environment, Elseiver Science, New York.
Mnali, S. R. (2001), “Assessment of Heavy Metal Pollution in the Lupa Gold Field”, Tanz. J. Science, 27A, 2001.
Mwandosya, M. J. and Meena, H. E. (1998), Dar es Salaam Water Demand: An end-use Perspective, The Center for Energy, Environment, Science and Technology (CEEST), Dar es Salaam.
Mwakalila, S. (2007), “Residents’ Perceptions of Institutional Performance in Water Supply in Dar es Salaam”, J. Phy. and Chem. of Earth 32,1285 – 1290.
Saria, J.A. and Mbogo, S. “Water Quality and Health in the Face of a Water Supply Crisis in the City of Dar es Salaam, Tanzania”. Regional Workshop/Conference on Trace Elements 24th – 30th March 2002, Nairobi- Kenya.
Straaten, P. (2000), “Mercury Contamination Associated with Small Scale Gold Mining in Tanzania and Zimbabwe”, The Science of the total Environment 259 (1-3), 105 – 113.
TBS (2004), Tanzania Bureau of Standards Drinking (portable) Water Samples-Specification.
Valls, M. and Lorenzo, V. D. (2002), “Exploiting the Genetic and Biochemical Capacities of Bacteria for the Remediation of Heavy Metal Pollution”. FEMS Microbiol. Rev. 26, 327 – 338.
WHO (1998) “ Guidelines for Drinking Water Quality” 2nd ed. Addendum to Vol. 2. Health Criteria and other Supporting Information. Geneva, World Health Organization.
80

Characteristics and uses of Solar Home Systems in Selected Uzn-Electrified Rural Villages in Muleba
District, TanzaniaD. P. Ikwaba
The Open University of Tanzania, Faculty of Science, Technology and Environmental Studies,
P.O.Box 23409, Dar Es Salaam,
Tanzania.E-mail addresses: [email protected] or [email protected]
Abstract: The use of solar electricity in un-electrified remote villages is widely recommended as a more viable alternative to grid electricity in these areas. However, despite a large body of literature on the impacts of solar electricity in remote areas, the use of solar electricity in un-electrified rural villages in Tanzania has not been in practice as much as it should have been due to lack of qualified solar electrical technicians which in turns results into Solar Home Systems (SHSs) failure. Technical failures often lead to high cost for users, disappointment with the solar electricity technology and a strong negative altitude about solar electricity technology. Preventing avoidable technical problems is therefore one of the main driving forces behind activities to enhance widespread and quality solar electricity in un-electrified rural areas. This paper investigated the status of all SHSs in Karambi, Kasharunga and Kyebitembe wards (Muleba district), their uses as well as system performance, limitations and problems. Results indicate that about 88% of all SHSs were performing as expected and households were happy with their systems.
Key words: Un-electrified remote village, solar home system, solar electricity, Photovoltaic, households
INTRODUCTIONModern societies strongly depend on reliable, affordable and sustainable electricity supplies for their development. Definitely, electricity is an obligatory input in the process of economic, social and industrial development of any society. Indeed, the availability of electricity is directly related to the living standard of any community (Kivaisi, 1999). Despite of this fact, many people in Tanzania have no electricity as only about 10% and 2% of the population in the urban and rural areas, respectively, are connected to grid electricity (TNBS, 2000). It has also been reported that extending grid electricity to many rural villages in Tanzania would not be economically viable in the near future and in some villages not practically possible due to low capital returns and sparsely population (Mwhihava and Mbise, 2003). There are little prospects that financial resources will become available and economic viability will encourage the national electric utility (Tanzania Electric Supply Company Limited, TANESCO), to undertake electrification of the remote rural areas in the foreseeable future. In fact, it has been reported that the privatisation of TANESCO had slowed down the expansion of electricity
81

distribution in rural areas as the decisions of the investors are normally made based on the return on capital rather than on political considerations (AFRODAD, 2007). This suggests that 98% of the rural communities in Tanzania will continue to live without grid electricity for several decades; a situation that not only deteriorates the development process but also hinders poverty alleviation.
Therefore, the only possibility of getting electricity in un-electrified rural areas in Tanzania is through the use of Solar Home System (SHS). A SHS is a small autonomous energy station, powered by a Photovoltaic (PV) module, that provides electricity for basic services such as lighting, radio, television and operation of small appliances in rural households found in sparsely populated areas and far away from the electricity grid (Scheutzlich et al., 2001; Diessen, 2008). The system consists of a PV module which converts the solar radiation into electricity; rechargeable battery which stores the generated energy for use in the night and during cloudy days; charge controller which controls the charging of the battery; low consuming appliances (light bulbs, radio and TV), switches, interconnecting wires and PV mounting rack (Roberts, 1991). It may also include an alternative current (AC) inverter, circuit breaker (to prevent the cabling from overloading) or a generator as a backup energy source (Roberts, 1991; Foster et al., 2010). A typical SHS for rural applications is shown in Figure 1 (TASEA, 2005).
Depending on income levels, technical and components availability, most of the SHSs found in the rural areas can be grouped into four categories as follows (Diessen, 2008): Small SHSs for lighting and radio only,
Figure 1: The basic SHS components for rural households (TASEA, 2005). Note: DC means direct current which is unidirectional flow of electric charge from the PV module.
DC Load AC Load
InverterBattery
Charge Controller
PV module
82

Medium sized SHSs for the basic energy needs like lighting the house, radio and a black and white TV,
Large SHSs (double the size of the medium system) for lighting a large house, radio and coloured TV,
Extra large SHSs (the same as large SHS) but in this case any electrical appliance can be connected. This is perceived as more luxurious as it resembles grid electricity.
Solar electricity to un-electrified remote villages has significant impact on the standard of living of rural communities. Some of the benefits associated with solar electricity in rural areas are summarized in Figure 2.
Figure 2: Multi-sectoral linkages of PV electricity influence on quality of life in off-grid rural communities (Obeng and Evers, 2009).
Despite of these advantages, solar electricity in un-electrified rural villages has not been in use as much as it should have been due to high initial cost and lack of qualified solar technicians (Derrick, 2000; Kassenga, 2008). However, taking into consideration of the energy expenditures for lighting and entertainments only, it can
83
be seen that affordability is not the main problem in most rural areas in Tanzania (Paul, 2010). The main barrier to widespread of solar electricity technology in most rural areas in developing countries is embedded in attitudes toward solar electricity (Derrick, 2000; Söker, 2007). The arguments such as ‘it does not work’, ‘the technology is too complicated’, ‘it is not appropriate’, ‘I don’t know about the technology’ etc, are militate against the use of solar electricity. This lack of acceptability is attributed to a great extent to poor system reliability which is due lack of qualified solar technicians, particularly in remote areas (Van der Plas and Hankins, 1998; Mulugetta et al., 2000; Gustavsson, 2004; Nieuwenhout et al., 2004). Technical failures often lead to high cost for users, disappointment with the solar electricity and to negative altitude about solar electricity technology. Preventing avoidable technical problems is therefore one of the main driving forces behind activities to enhance widespread and quality solar electricity in un-electrified rural areas.
This paper investigated the status of all SHSs in Karambi, Kasharunga and Kyebitembe wards, their uses as well as system performance, limitations and problems. It was anticipated that there was a need to obtain technical insight on the status of the installed SHSs on the surveyed wards as this will add valuable information on the improvement of the system’s reliability. The improved reliability would simulate households withnot SHS to confidently invest in solar electricity technology and hence improvement in their living standard.
GEOGRAPHICAL LOCATION AND ENERGY SOURCES IN THE SURVEYED WARDSFigure 3 is a map illustrating the geographical location of the surveyed area. Karambi, Kasharunga and Kyebitembe are among the 31 wards of Muleba district in Kagera region, North-western corner of Tanzania (Kagera region report, 2003). As shown in Figure 3, Muleba district borders in Bukoba Urban the north by and Bukoba Rural districts, Biharamulo district, to the south and to the east by Lake Victoria. To the west is Karagwe district. In 2002, the district had a population of 386,328, of which about 12% were from the surveyed wards (TNBS, 2002). Geographically, Muleba is the remotest district from the administrative headquarters (Dar es Salaam).
The households in Karambi, Kasharunga and Kyebitembe wards use many different sources of energy for their lighting and entertainments energy requirements. These include kerosene, diesel, candles, wood sticks lead-acid batteries and dry batteries. The choice of a particular energy source depends strongly on the income level of the household. While the other wards such as Kishanda, Nshamba and Muleba Urban are served with national grid electricity generated from Uganda, Karambi, Kasharunga and Kyebitembe wards had no electricity (United Republic of Tanzania Parliament Records, 2007). The only hope for people in these wards to enjoy the ‘fruits’ of electricity is through SHSs.
84

Figure 3: Map of Muleba district (Kagera region) showing the study wards (Kagera region report, 2003).
METHODOLOGYSample PopulationAs indicated in Figure 3, this study was conducted in three wards: Karambi, Kasharunga and Kyebitembe, targeting all households with solar electricity. In order to establish if there was any relationship between owning a SHS and income or education level, neighbours to the SHSs respondents were also included in the survey. The households with a SHS were identified using three different methods: One was through a directive from the ward executive officer who knew the house with solar electricity (25%). The second was through SHS owners or local
85

informers who knew of the systems nearby (62.5%). The third was location of systems at random by sighting them – a house with a TV antenna in un-electrified village had a high probability of having a SHS (12.5%). The last two methods are basically random, although the latter favoured the locations close to the road and densely populated village centres.
Primary Data CollectionTo collect the required information efficiently from the target groups, a 25 item questionnaire consisting of four sections relating to the research objectives was developed. Instructions were given to each section and questions of the questionnaire. A pilot study was carried out in order to assess the problems and ambiguities with the questions, items and the general layout of the questionnaire. The participants in the pilot study (whose characteristics were similar to the study sample) reported a few minor difficulties that resulted in minor alterations before the final draft of the questionnaire was completed. The questionnaire included closed questions, open-ended comment questions and ranking typee questions.
In addition to questionnaire method, an interview was conducted with selected respondents to obtain further information on the research objectives. Three different questionnaires, each consisting of three sections, were used for each group. While the basic structure and some few questions of each questionnaire was the same, special questions were asked for each group which was not relevant to the other group. A pilot study was also carried out on the interview pre-structure questions and there was no difficulty observed.
Secondary Data CollectionIn addition to the study findings, relevant reports from various PV stakeholders, publications and internet search were used to provide secondary data.
ProcedureA total of 112 questionnaire packages were distributed to all the targeted groups. Of which 16 and 96 were distributed to the households with and without SHSs, respectively. Each questionnaire package was accompanied by a letter explaining the general aims of the study and the respondent was asked to return a questionnaire with all questions full completed. Table 1 shows the number of returned questionnaires by wards and sex.
WardHouseholds with SHSs Households without SHSs
Male respondents
Female respondents Total Male
respondentsFemale
respondents Total
Karambi 7(43.7)
2(12.5)
9(56.2)
44(51.2)
10(11.6)
54(62.8)
Kasharunga 3(18.8)
0(0.0)
3(18.8)
12(14.0)
2(2.3)
14(16.3)
Kyebitembe 4(25.0)
0(0.0)
4(25.0)
15(17.4)
3(3.5)
18(20.9)
Total 14(87.5)
2(12.5)
16(100)
71(82.6)
15(17.4)
86(100)
86
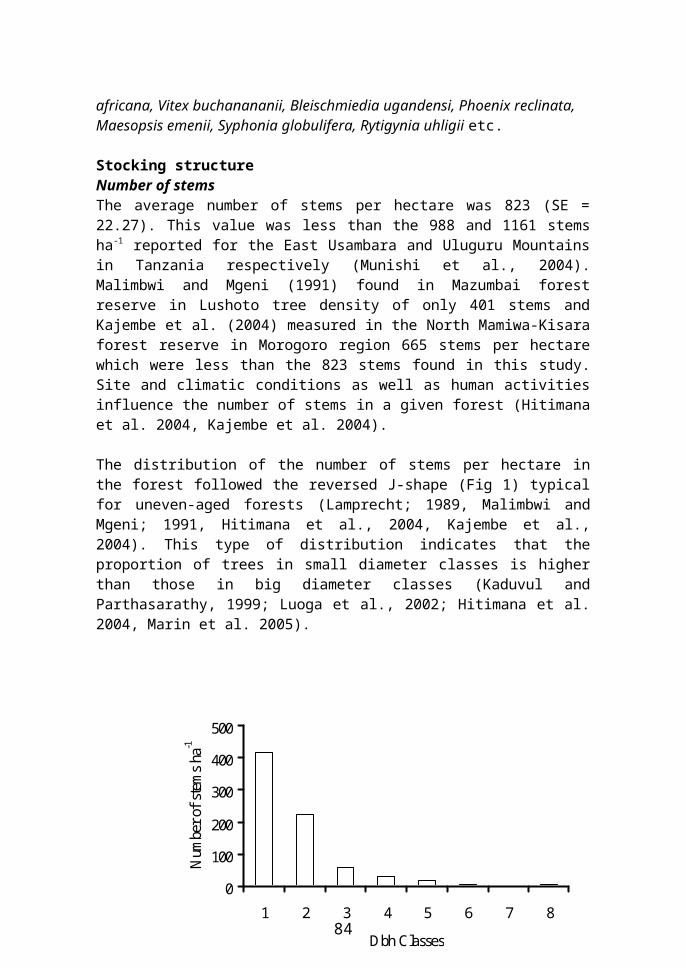
Table 1: The number of surveyed respondents by wards and sex. Note that figures in parentheses show the percentage of respondents with respect to the total respondents in each group.
In addition to the questionnaires, all households with SHSs and three households without SHSs from each ward were interviewed. A pre-structured questionnaire was used for the interviews. During the interview visit to the households with SHSs, the author also examined the physical appearance of the SHSs, structure mounting, mounting place, direction, electrical wiring and the general status of the SHS.
Data AnalysisAt the component level, the status of a well-designed SHS was quantified by determining if all the necessary components are available and each component was working as expected from the theory. Besides this status indicator, another characteristic indicator that was used to quantify the system was the size and type of the PV module. The size of the PV module provides the information on electrical energy expected from the system while the type of the PV module indicates the overall performance efficiency of the PV module. Furthermore, atitude towards solar electricity from households with SHSs was used to assess acceptability of the solar electricity technology in the surveyed wards. This was done by asking the respondents to indicate whether they were satisfied with their solar system or not. This type of question, however, is notoriously difficult to interpret, because in some cultures it is not common to forgive open criticism. Therefore, an indirect question that linked with the household’s satisfaction was added to the questionnaire. For example, households with solar electricity were asked to indicate if they would recommend the solar electricity technology to others.
RESULTS AND DISCUSSIONSStatus of Households with and without Solar Home SystemsSince the level of income and education influence the ability and desire to acquire new technologies (Ali, 2002), one of the specific objectives was to investigate the differences in income and education levels between households with and without SHSs. As the level of income was extremely difficulty to determine due to multiple income sources and many people obtaining erratically/seasonally (depending on the time of the year), the difference between the two groups was examined using income sources such as paid employment (teachers, soldiers, civil services, medical doctors, laboratory technicians, pastors, etc), farming and business activities. As shown in Figure 4, most of the SHS owners had both paid employment (38%) and farming activities (56%). In addition, some of the SHS owners were businessmen (25%). In the business group, each person had different business activities such as hotels, bars, shops, music halls, car transports or selling agricultural products (coffee, maize, beans or cassava). On the other hand, most non-SHS owners were both small scale farmers (90%) and had paid employment (30.3%). Only 6.7% of respondents without SHSs indicated that they had business activities. It can also be noted from Figure 4 that, like most rural areas in developing countries, other activities (22.5%) such as day labour, home-based activities and fishing form a significant part of the income generation for unemployed households.
87

0
20
40
60
80
100N
o. o
f re
spon
dent
s (%
)
Paidemployment
Agriculture Business Unemployed Others
Income sources
Households with SHSHouseholds without SHS
Figure 4: Comparison of income sources for households with and without solar home systems.
The households that owned SHSs generally had higher educational levels compared with those without SHSs as shown in Figure 5. In households that owned SHS, all the heads of the households had education level between primary/middle school and university degree. However, the majority of people in this group had either secondary certificate, diploma (43.8%) or university degree (31.3%). Only 25% of the heads of the households had primary school education. On the other hand, none of the households without SHS had university degree and the majority (61.6%) had primary school education. Only 32.6% had secondary school education. As illustrated in Figure 5, about 6% of the heads of the households without SHSs indicated that they never attended formal education although 60% were able to read and write. It was learnt that those who could read and write attended Adult Education commonly know as Kisomo cha Elimu ya Watu Wazima. This informal education was introduced in Tanzania by Mwalimu Nyerere in the late-1960s to wipe out illiteracy (Mbunda, 1972).
88

0
10
20
30
40
50
60
70N
o. o
f res
pond
ents
(%)
Never attendedformal education
Primary/middleschool
Secondary/diploma University degreeand above
Education level
Households with SHSHouseholds without SHS
Figure 5: Comparison of education level for heads of households with and without SHSs.
From this result it can be concluded that early adaptors of solar electricity in these wards fall into households with higher incomes and higher education levels. A similar result has been reported by Ali (2002) who found that income and education level influenced significantly the purchasing ability of SHSs in rural villages in Bangladesh.
Characteristics of Solar Home System Components in the Study WardsThe PV ModuleAll the households and institutional that owned SHSs had only one system and these systems were purchased with cash as credit is not available in these wards. As illustrated in Figure 6, most of the owners reported that they purchased a particular type and size of the PV module due to availability and cheaper price (75%) whilst about 6% said it was due to module reputations. None indicated that it was due to the load demands of their energy requirements. Only 19% said they didn’t know the reason as they were not there during purchasing stage. These were the respondents from SHSs owned by institutional.
89
0
20
40
60
80
No.
of r
espo
nden
ts (%
)
Avalability Cheaper price Reputations I don't know
Reasons
Figure 6: Reasons for SHS owners to purchase the size and types of PV modules.
Figure 7 shows the size of the PV module purchased by each household. As expected, the typical size of the PV module owned by the rural households tends to be small, ranging from to 70 W. As shown in Figure 7, 25% of the SHS owners reported that they owned 20 W PV modules while those who owned 50 W and 70 W were about 31% and 19%, respectively. On the other hand, about 13% reported that they didn’t know the size of their PV module while the sizes of the PV owned by institutions (13%) were more than 100 W. This finding is consistent with other recent similar study on size and ownership patterns (Voravate et al., 2000). Most of the PV modules (88%) consisted of amorphous silicon whilst the rest were mono-crystalline silicon. The reason for higher amorphous silicon PV modules was probably due to its lower cost and product availability. The other reason could be due to small power demand for the village households (amorphous PV modules have lower conversion efficiency compared to the other types of modules such as crystalline or mono-crystalline).
90

70 W18.8%
More than 100 W12.5%
I don't know12.5%
< 20 w31.2%
50 W25.0%
Figure 7: Size of the PV module owned by the households and institutional.
The major factor limiting the performance of amorphous silicon PV modules is the light-induced degradation since most modules degrade about 12–20% before reaching a steady state (Markvart and Luis, 2005). Although some PV company such as Zara Solar Ltd claimed to be purchasing the amorphous silicon modules only from reputable manufacturers who offer a warranty on their products (Parpia, 2007), there is still a problem in Tanzania with many small electrical shops offering cheap, low quality amorphous silicon modules which look exactly like the well known brands. These types of PV module tend to fail after a short time and jeopardize the acceptability of solar electricity technology in rural areas.
Charge ControllerFigure 8 illustrates some of the major components found in the SHS (except the PV module, appliances and connection wires). It can be seen that about 19% of the SHSs did not have charge controller, a situation which can cause deep discharge and overcharging. While the risk of overcharge is relatively small with small PV modules, the major concern seem to be the deep discharge of the batteries because lack of charge controller leads to battery deep cycling due to sulfation. The problem of overcharging was not expected to happen since the matching of the PV module to battery in virtually all cases was poor, with seriously undersized modules.
91

Charge controller81.3%
AC inverter37.5%
Storage battery87.5%
Figure 8: Number of SHSs with storage battery, charge controller and DC/AC inverter.
Storage BatteryThe majority of the SHSs (87.5%) had storage battery as shown in Figure 8 and those without energy storage (12.5%) were mainly used during the day time when sunshine was available. It was found that these types of SHSs were mainly used for mobile phone charging and entertainment activities (radio-cassette). On a SHS lifetime basis, storage batteries constitute the highest contribution to the life-cycle cost. Most of the serious problems with SHSs are battery related and sometimes depends on the quality of the battery. However, the quality of the battery is difficult to assess from the outside. User behaviour is as important to the lifetime as the initial product quality. In the surveyed SHSs, it was observed that 75% of the batteries had open circuit voltages. This suggests that users drained their batteries as much as they could while hardly allow the battery to be fully charged.
In one of the households, the owner reported that he had purchased the PV module about three years ago and the first storage battery was deep cycle battery. It was learnt that when the battery expired it was replaced by automotive battery. If the charge controller is not re-set to match the charge/discharge characteristics of a new battery, replacing dissimilar battery may result into deep discharge, reducing the battery service lifetime.
DC/AC InverterWhile the uses of battery storages and charge controllers were common among the surveyed SHSs, the use of DC/AC inverters was limited to few households. As shown in Figure 8, about 38% of the respondents in the three wards indicated that their system had an AC inverter. Limited use of inverters may be associated with
92
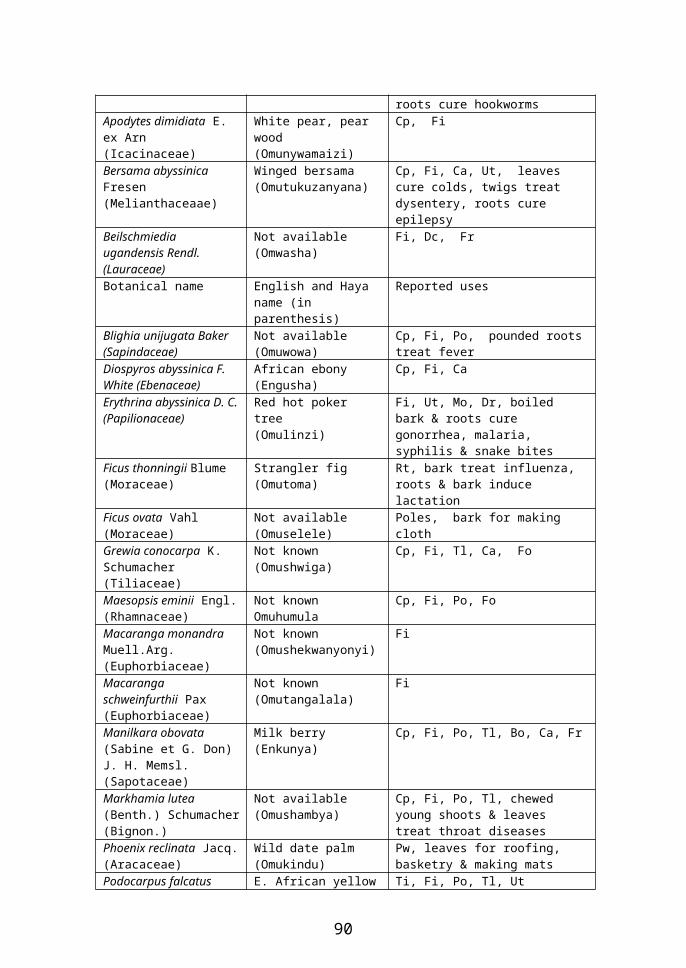
the type of electrical appliances used in rural areas, its cost as well as lack of qualified solar technicians.
PV Module InstallationAbout 69% of all the surveyed SHSs had pole mounted modules (Figure 10) while 19% were mounted on houseroofs as shown in Figure 9. Both house-roof and pole mountings do not allow changes in module orientation once fitted. It was also observed that about 13% practiced ‘basking’ their loose modules in the sun during the day and taking them indoors at night. Basking was predominantly practiced with low cost systems not procured with mounting hardware. In these cases it is unlikely that both orientation and tilt could be regularly optimised and at ground level the risk of shading and dust would be obstacles to efficient energy capture by the modules. The risk of breakage is also high due to the accessible position of the modules and the daily indoor/outdoor movement. However, the risk of being stolen was miminmized.
Figure 9: Roof-house PV module mounting.
Error in installation was also observed in one PV module, as shown in Figure 10, where part of the PV module was shaded during the day. PV module shading leads to incomplete battery charging and sulfation of the battery plates which results into pre-mature battery failure (Lynch, 2006). In additional, the use of too small wire sections, inappropriate fixing of wires on the walls, lack of connection boxes and twisting of wires instead of using switches were also found in about 19% of the surveyed SHSs. Low quality of installation leads to unnecessary losses in system functionality.
PV module
93
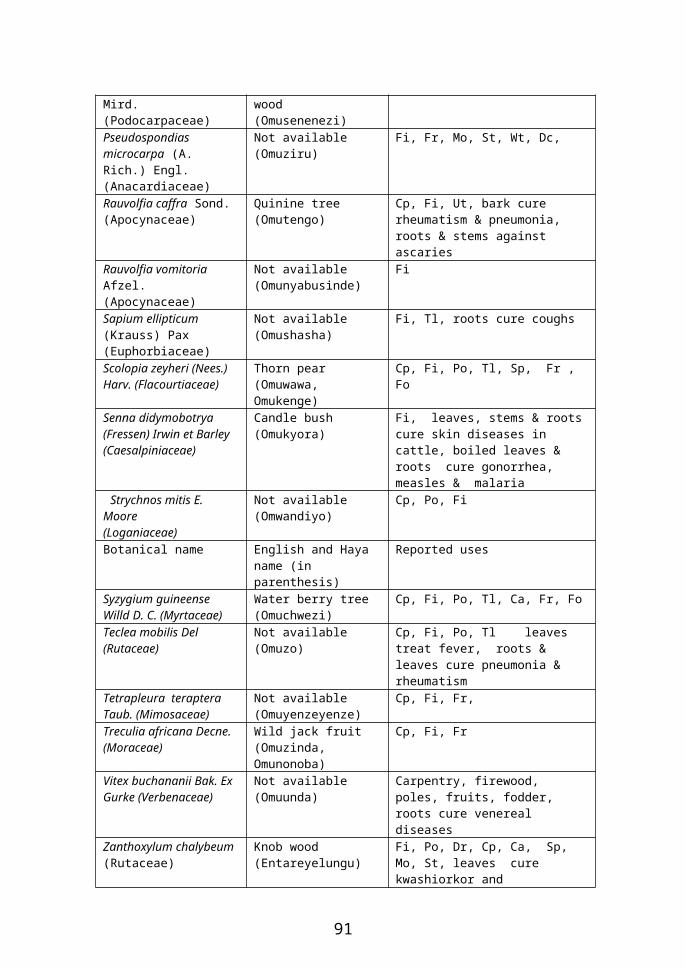
Figure 10: Wrong installation place of the PV module
Types of Lighting LampsMost of the SHS owners reported that they used compact spiral fluorescent lamps (56%) while those who used tubular fluorescent lamps and incandescent light bulbs were about 19% and 25%, respectively. Utilizing tubular fluorescent lamps in SHS provides substantially higher lighting levels than would be possible with either compact spiral or incandescent light bulbs. Spiral fluorescent lamp has slightly reduced efficiency compared to tubular due to the excessively thick layer of phosphor on the lower side of the twist (Roberts, 1991). The higher number of households using compact spiral fluorescent lamps was probably due to its cheaper price and availability.
Other ObservationsUnusual SHSOne household was found to have a second hand PV module for light and entertainment purposes, which the owner claimed he purchased from someone (in town) who stopped using it after acquiring grid electricity. From its appearance, the module was of a poor quality and had no charge controller, thus the frequency with which the battery must be replaced and therefore the cost of the SHS is increased. The discoloration in the module and the corroded wires were the evidence of degradation. The SHS had an automotive battery which was inappropriate. The module was installed on an eastward-facing roof slope rather than facing the south as recommended (Roberts, 1991). The module was mounted directly on the metal
Shaded part
94

roof rather than on a mounting structure that would allow air circulation to cool the PV module and improve its performance. The system was installed without basic safety considerations such as electrical grounding or a compartment to protect family members from accidents with the battery. The owner reported that the system could only light two bulbs and a small radio cassette. This system certainly failed to meet the norms and standards expected of a well designed quality SHS. This unique system illustrates, on one hand the importance of electricity in rural areas, and on the other hand the importance of local solar technicians in successful implementation of PV electricity in rural communities.
Thieves of PV ModulesOne household reported that previously his PV module was stolen. When he purchased the replacement, he used antitheft nuts. Another owner said he normally patrols the PV module during night while two households used ‘basking’ their modules. All these methods, however, are not permanent solutions to this problem. Alarms to the PV module could be a best solution, but this will add cost to the system. The problem could be completely eliminated if all the households had SHSs or the wards are electrified by grid electricity.
Solar Electricity Uses and BenefitsSolar Electricity UsesAs solar electricity has many applications as illustrated in Figure 2, the study intended to find out the main uses of the solar electricity in the surveyed wards. To assist in understanding this, the questionnaire included a question asking the household to indicate the uses of their SHSs. The question had four options: for home uses only, for home and business uses, used in business premises only and used for social services (school, dispensary, churches and telecommunication centers). As illustrated in Figure 11, the majority of the SHSs (68%) were purchased for home purposes only whilst 19% were used in social services (dispensary: 6.3%, churches: 6.3% and telecommunication center: 6.3%). Only 13% reported that their SHSs were used for both business and home activities whilst none of the SHS was used for business only. The reason for none existence of SHSs that were used for business activity only was probably due to the fact that all business activities (such as mobile phone charging, light and entertainment in business premises) took place in houses where the owners lived. In these wards, the households using SHSs for business purposes had no separate houses for business activities.
95

Home and business13%
Social services19%
Home only68%
Figure 11: Uses of solar home systems in the surveyed wards
Benefit of Solar ElectricityAll households with the SHS were asked to rank the perceived benefits of their SHS from a list of possible benefits. The list included: Increased quality of life due to improved light, Increased study hours, specifically for students, Increased access to entertainments and information (radio, TV and mobile
phone), Increased working hours after dark, Increased income generation like mobile phone charging and barber shops, Reduced workload for women and children due to reducing needs for cleaning
kerosene lamps and lighting wood sticks collections, Increased working and walking flexibility in house after dark, and Increased security in the homestead during night.
As shown Fn figure 12, all households considered solar electricity as having resulted in improvements in their quality of life (due to improved light) and reduction of workload for women and children (due to fewer hours spent in collecting wood-statics for lighting). About 94% of the households also strongly agree that solar electricity increased their access to entertainments (through radio-cassette, and TV football and other sporting programs) and information (through mobile phone, radio and TV). However, majority of the respondents (75%) disagreed with the statement that solar electricity increased their income generation. Although PV electricity was not directly used for productive purposes, the author strongly believes that it definitely served to boost business in shops, bars, restaurants, motels and mobile phone charging.
96

0% 20% 40% 60% 80% 100%
Number of respondents
Figure 12 Benefits of solar electricty in the surveyed wards.
Increasing quality of life
Entertainments and information
Increasing study hours
Increasing working time
Increasing income generation
Increasing security
Flexibility at night
Reducing workload for women
Sola
r el
ectr
ity b
enef
its Strongly agreeAgreeNeutral DisagreeStrongly disadgree
It is also shown in Figure 12 that majority of the respondents agreed that solar electricity increased study hours (87.5%), increased walking flexibility in the house (87.5%) and increased working hours after dark (75%). However, most of the households disagree with the statement that solar electricity increased their home security (81.25%). The disagreement probably was due to the fact that solar electricity was normal used for only few hours (approximately four hours) and most households had no outside light.
During the interview, the owners of SHS were also asked to discuss in depth some of the SHS benefits which were not captured in the research questionnaire. In this discussion, teachers indicated that they were able to mark students’ home-works and prepare lesson plans during night due to availability of brighter light. In some cases, teachers who had SHSs introduced night classes (tuition). The author considers this as an opportunity for rural students to acquire the same education quality as those living in urban areas. However, the service requires tuition fee, of which parents/guardians could not meet on a daily basis given their low income levels.
One negative effect of solar electricity was reported in one family where a mother complained that she had difficulties of getting her children to study once they had the SHS, because they preferred to sit with the rest of the household members and play cards or watch TV.
System Performance, Limitations and ProblemsSolar Home System Performance
97
Assessing the effectiveness of SHSs is one of the most critical issues not only to the SHS owners but also for the acceptability of the households willing to acquire the new technology. In this research the issue of satisfactions and limitations of the SHSs were examined. Respondents were asked to give their opinion about the performance of their systems. The result (Fåigure 13) shows that more than 88% were satisfied with the performance of their systems while about 6% reported that their system was performing fairly. Due to satisfaction, about 94% of the SHS owners indicated that they would recommend the uses of solar electricity to other households without solar electricity. However, one household indicated that the system was performing very low and therefore he was disappointed. Poor performance for his system was due to poor design and installation as well as the quality of the PV module.
Very high88%
Very low6%
Fear6%
Figure 13: Perception of the SHS owners about performance of their SHSs
Limitations of the Solar ElectricityA disadvantage noted by all the households was the fact that the SHS does not work when there prolonged rain fall and that the system sometimes goes off unexpectedly because it lacks a meter to indicate the presence of energy or remaining energy. For the households whose SHSs had no energy storage, lack of electricity during raining days and heavy cloudy days were expected. Some of the women thought that after obtaining solar electricity they will no longer spend time collecting firewood for cooking and lighting and therefore SHS would relieve them from physical exhaustion. However, this was not the case, since solar electricity is not suitable for cooking and during raining seasons they had to depend on other energy sources for lighting and entertainments.
The fact that the SHS cannot power a small refrigerator was also considered a serious limitation, as this appliance was vey much needed in the three wards. The wards (Karambi, Kasharunga and Kyebitembe) are very close to Lake Victoria and
98

Buringi and therefore some villagers are fishermen both for domestic and commercial purposes. They would like to have a refrigerator to preserve their fish.
Solar Home System ProblemsDuring the interview, the owners of the SHSs were asked if they had any problem with their systems. About 19% reported that their systems had had problems and the main cause of faults in these systems was found to be lack of maintenance. Water loss from batteries occurs rapidly due to the hot and humid climate. The owners reported that it was difficult to get repairs as there were no repair shops near the surveyed wards. The repair shops were located in Bukoba Urban (far way from most of the villages) and technicians are not normally available when they were needed because they were very few. On the other hand, all the households reported that they were not trained even for simple maintenance such water level in the battery and dust clearness on the PV module. The author believes that lack of qualified solar technicians was the main reason as to why there were few SHSs in the surveyed wards.
CONCLUSIONSIn this paper, characteristics, uses, benefits, performance and limitations of the SHSs in the surveyed wards have been presented. Result indicates that installations were of good quality with about 69% of all the surveyed PV modules in pole mounted structure while about 18% were house-roof mounted. However, in some systems, error in placing the PV module (shadowing) and slopping were observed. Unusual SHS was also observed in one household in which the module was mounted directly on the metal roof rather than on a mounting structure that would allow air circulation to cool the PV module and improve its performance.
Most of the households owned small SHS ranging from 10 W to 70 W while large systems were owned by institutional. At the time of this survey, most of the PV modules were working perfect except one system which was performing below its expectation due to degradation and poor designing. Owing to low cost and availability, most of the PV modules (88%) were amorphous silicon whilst the rest were mono-crystalline silicon.
The majority of the SHSs had storage battery and those without energy storage were mainly used during the day time when sunshine was available mainly for mobile phone charging and entertainments purposes (radio-cassette). About 19% and 62% of the SHSs did not have charge controller and DC/AC inverter, respectively. Limited use of inverters was associated with the type of electrical appliances used in rural villages and its cost as well as the availability of skillfully qualified solar electrical technicians.
The main use of solar electricity in the surveyed wards was for lighting purpose whilst access to news and information from TV and radio was ranked the second. Despite the fact that solar electricity was not frequently used for productive purposes, it definitely served to boost business in shops, restaurant, mobile phone charging and motels.
99

Most of the SHS owners indicated that they were satisfied with the performance of their systems while few (about 6%) reported that their systems wwere performing fairly. Due to satisfaction, about 94% of the SHS owners indicated that they would recommend the uses of solar electricity technology to other households without electricity.
Few systems had problems related to charger controllers and inverters and the owners needed to call the technicians for system repairing. However, there were no repair shops near the surveyed wards. The repair shops were located in the main town, far away from most of the village, and technicians are not normally available when they were needed because they were very few. The author believes that this a main reason as to why there were few SHSs in the surveyed wards. Therefore, efforts must be devoted in training skillfully qualified solar electrical technicians.
ACKNOWLEDGEMENTSThis work was sponsored by the Open University of Tanzania through Small Research Grants scheme.
ReferencesAFRODAD (African Forum and Network on Debt and Development), (2007)
“Tanzania’s Experience with Privatisation Policies: A Case Study”, AFRODAD, Harare, Zimbabwe, available at: http://www.afrodad.org/ downloads/Tanzani.pdf, accessed on 3rd April 2009.
Ali, M.E. (2002) ‘Energy Consumption Pattern in Rural Bangladesh – the Opportunity for New Zealand: A Household Survey’, Discussion Paper No. 02.10 – October 2002, Massey University, New Zealand.
Derrick, A. (2000) ‘Institutional Barriers in Developing Renewable Energy Projects and Markets’, A Paper presented at the CTI Joint Industry Seminar on Technology Transfer, March 2000, San Salvador, El- Salvador.
Diessen, T.V. (2008) “Design of a Solar Home System for Rural Cambodia”, MSc. Thesis, Delft University of Technology, Netherland, available at: http://picosol.nl/files/stud-tom-van-diessen-development-solar-home-system.pdf, accessed on 18th May 2009.
Foster, R., Ghassemi, M. and Cost, A. (2010) ‘Solar Energy: Renewable Energy and the Environment’, Taylor and Francis Group, New York, USA.
Gustavsson, M. (2004) ‘Impact of Solar Electric Services on Lifestyles: Experiences from Zambia’, Journal of Energy in Southern Africa, Vol. 15, No. 1, 12–25.
Kagera Region Report, (2003) “Kagera Region Report Socio-economic Profile”, Dar es Salaam and Bukoba; National Bureau of Statistics and Kagera Regional Commissioner’s Office.
Kassenga, G.R. (2008) “The Status and Constraints of Solar Photovoltaic Energy Development in Tanzania”, Energy Sources, Part B: Economics, Planning, and Policy, Vol. 3, No. 4, 420–432.
100
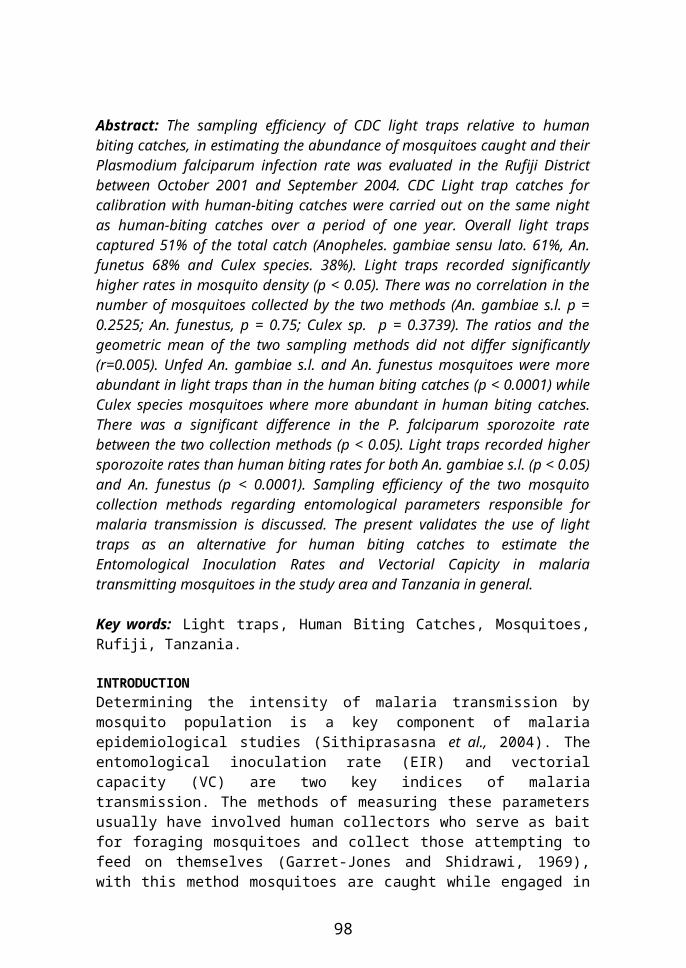
Kivaisi, R.T. (1999) “Photovoltaic Technology for Rural Populations”, Proceedings of the Conference on Basic Sciences for Development in Eastern and Southern Africa, Arusha, Tanzania, 78–87.
Lynch, A., Greacen, C., Tavaranan, S. and Bjarnegard, F. (2006) “Threatened Sustainability: The Uncertainty Future of Thailand’s Solar Home Systems”, Border Green Energy Team, Thailand.
Markvart, T. and Luis, C. (2005) “Solar Cells: Materials Manufacture and Operation”, ISBN-10: 18567174573 ISBN-13: 9782856274572, Elsevier, Oxford, UK.
Mbunda, A. (1972) “Adult Education in Tanzania: Life – Long Process for Nation Development”, A Paper presented at Interdisciplinary Symposium on Life – Long Education, September 25 – October 2, Paris, France.
Mulugetta, Y., Nhete, T. and Jackson, T. (2000) “Photovoltaics in Zimbabwe: Lessons from the GEF Solar Project”, Energy Policy, Vol. 28, No. 14, 1069–1080.
Mwahiva, N.C.X. and Mbise, H.A. (2003) “Status of Power Sector Reforms and Promotion of Renewable Energy and Energy Efficiency in Tanzania”, A Paper presented at the Eastern Africa Renewable Energy and Efficiency Partnership Regional Consultation Meeting, 9–10 June, Nairobi, Kenya.
Nieuwenhout, F., de Villers, T., Mate, N. and Aguilera, M.E. (2004) “Reliability of PV Stand-alone Systems for Rural Electrification: Tackling the Quality in Solar Rural Electrification (TaQSoIRe) – Target Action-C”, Contract No. NNE5/2002/98, European Commission, Brussels, Belgium.
Obeng, G.Y. and Evers, H.D. (2009) “Solar PV Rural Electrification and Energy-Poverty: A Review and Conceptual Framework with Reference to Ghana”, Department of Political and Cultural Change Center for Development Research, University of Bonn, ZEF Working Paper, No. 36, 1–18.
Parpia, M.A. (2007), “Providing Affordable Solar Systems in Northern Tanzania”, Zara Solar Ltd, Tanzania, available at: http://www.ashdenawards.org/files/ reports/Zara_2007_Technical_report.pdf, accessed on 8th May 2010.
Paul, D.I. (2010) “Sizing Photovoltaic Systems: A Barrier to Solar Electricity in Tanzania – Case Study of Muleba District”, Unpublished.
Roberts, S. (1991) “Solar Electricity: A practical Guide to Design and Installing Small Photovoltaic Systems”, Prentice Hall Europe, London, UK.
Scheutzlich, T., Klinghammer, W., Scholand, M., Wisniwsky, S. and Pertz, K. (2001) “Financing of Solar Home Systems in Developing Countries: The Role of Financing in the Dissemination Process”, Division 44, Environmental, Management, Water and Transport, GTZ, Germany.
Söker, M. (2007) “Renewable Energy and the Clean Development Mechanism: Potential, Barriers and Ways Forward–A Guide for Policy-Makers”, Federal Ministry for the Environment, Nature Conservation and Nuclear Safety, Public Relations Division, Berlin, Germany.
TASEA (Tanzania Solar Energy Association), (2005) “Lighting the Way for Solar Energy”; Proposed Tax Reforms on Renewable Energy and Energy Efficiency Technologies, Submitted to the Ministry of Finance, available at:
101

http://www.solarmwanza.org/downloadables/tasea.pdf, accessed on 12th June 2008.
TNBS (Tanzania National Bureau of Statistics), (2000) “Household Budget Survey 2000/01, Fact Sheet”, available at: http://www.tanzaniahivaids.info/ documents/Other%20Resource%20Documents/Household%20Budget%20Factsheet.pdf, accessed on 17th June 2008.
TNBS (Tanzania National Bureau of Statistics), (2002) “United Republic of Tanzania National Census, Village Statistics–Kagrea (Muleba District Population)”, available at :http://www.nbs.go.tz/index.php?option=com_ phocadownload&view=category&id=88:village-stat&Itemid=106, accessed on 10th January 2009.
United Republic of Tanzania Parliament Records, (2007) “Answers to Principal Question number 127, Session number 9, 9th November 2007”, Tanzania Parliament, Data Vision International (T) Ltd, available at:
http://www.parliament.go.tz/bunge/parl_question.php?pageNum_quest=1&totalRows_quest=6&memberid=1003, accessed on 6th
January 2008.Van der Plas, R.J. and Hankins, M. (1998) “Solar electricity in Africa: A Reality”,
Energy Policy, Vol. 26, No. 4, 295–305.Voravate, T., Barnes, D. and Bogach, S. (2000) “Assessing Markets for Renewable
Energy in Rural Areas of Northwestern China”, Vol. 1, World Bank Technical Paper, World Bank, Washington, USA.
102

Guide for AuthorsScope Huria Jounal is an international journal that publishes original research papers of academic interest (theoretical, applied and general), targetingtertiary institutions and researchers and is therefore hospitable to scholarly writing on a veriety of academic topics. The types of contribution range from original research papers, review articles and technical notes.
Submission of ManuscriptsManuscripts must be submitted with a cover letter stating that all authors (in case of multiple authors) agree with the content and approve of its submission to the journal. Only materials that have never been published or being submitted for publication elsewhere will be considered. All submissions will be critically peer-reviewed by at least two anonymous reviewers who will be looking for originality, relevance, clarity, appropriateness of the methods, validity of data, reasonability of the conclusion and support from data.
Manuscripts that are written in clear and grammatical English should be submitted in both electronic and hard copy to:
Editor-in-ChiefHuria JournalThe Open University of TanzaniaP. O. Box 23409Dar es SalaamTANZANIA
Tel: 255+ (022) 2668820 (022) 2668445
Fax: 255+ (022) 2668759e-mail: [email protected]
There are no submission fees or page charges.
The Editorial Board reserves the right to accept or reject any manuscript and also reserves the right to edit the manuscripts as it sees fit. Authors may be contacted for clarification when necessary.
Manuscript PreparationPage set-up of the manuscripts should be on A4 or 8.5” x 11 “paper, typed double-spaced (24-26 lines per page), with margins of at least one inch – left and right, and one and half inch margin – top and bottom.
Depending on the areas of specialization, manuscripts should be arranged in the order of: title page, abstract (structured summary) including up to six key words, main text, acknowledgements, references, tables figures, and figure legends.
103

In case of science/experimental-based submissions, the order should be: title page, abstract, introduction, materials and methods, results, discussion, acknowledgements, references, figure legends, tables, and illustrations. Under this category, results and discussion sections may be combined if appropriate.
Title PageThis page must include the following information: The title of the manuscript which shouldbe concise, specific, informatiove
and clear. The names (spelled out in full) of the author(s) of the manuscript including
their corresponding affiliation(s) should be indicated immediately below the title.
A complete mailing address (including the e-mail) of the person to whom all correspondence regarding the manuscript should be addressed and must also be indicated.
AbstractThe first page following the title page should contain an abstract. Abstract should contain up to 250 words mainly of the object and main finding of the paper. Three to five key words representing concepts of thepaper may be written at the end of the abstract.
Main TextIn the main text, the introduction part should describe the objective of the reported work and provide relevant background information. In the case where there is a section for materials and methods, this part should identify the population, area of study, procedure employed and any other relevant input to the realization of the study. The results section should explain all the important findings and provide information about the reliability of the results. Here, the use of tables and figures is allowed, but the use of text to emphasize important points is encouraged. For the discussion, it should describe the implications of the findings any conclusions based on the findings.
Abbreviations in the body of the paper should be used after having been initially explained. If statistical analysis is applicable, it is important that the procedure is carried out following appropriate methods.
ReferencesAll references to books, monographs, articles, and statistical sources must be identified at appropriate point in text by author’s last name and publication year. The use of author’s name, year of publicaitona and pagination in text citations remains optional, but not really encouraged. When author’s name is in text, cite (Williams, 2005). With dual authorship, give both names; for three or more, use et
104
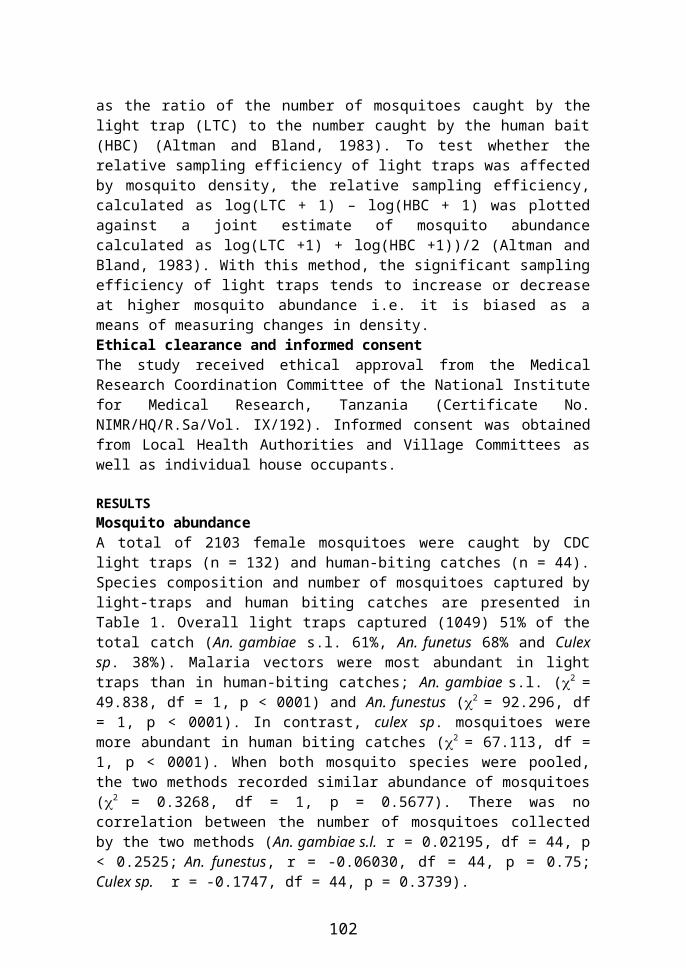
al., With more than one reference to an author in one year, distinguish themby use of letter (a, b) attached to publication year (2006a). For instance, (Agnes, 2000a; 2000b). Enclose a series of references within one pair of parenthesis, separated by semicolons, e.g., {Cornelia, 2001; Emmanuel, 2003; Juma et al., 2004; Pembe and Owino, 2005}.
On the page of references, list all items alphabetically by author and, within author, by publication year. Examples of common references follow.
Print, M. (2000), Curriculum Development and design. Allen and Uwin, London;
Hellen, S., Joyce, K., and John, R. (2005), Schooling in Capitalist America. New York: Basic Books. p. 99;
Holleran, E.A., Karki, S., Holzbaur, E.L.F. (1998), :The Role of the Dynactin Complex” in Intracellular Motility. In Jeon, K.W. (Ed.) International Review of Cytology. Vol. 182. Academic Press, San Diego, pp. 69-109;
Gao, S., McGarry M., Latham, K.E., Wilmut, I. (2003), Cloning of Mice by Nuclear Transfer. Cloning stem Cells, 5: 287-294;
Tanzania Bureau of Statistics (2002), Country Census data Book. Dar es Salaam: Government Printing Office.
FootnotesThey should be kept to a minimum. Two or more consecutive references to the same source should, where possible, be grouped in the same note; the reader should be able to follow the article without referring to the notes.
105