joint research centre - tuv.com · satellite-based estimates of the influence of solar spectrum...
TRANSCRIPT

www.jrc.ec.europa.eu
Serving society
Stimulating innovation
Supporting legislation
Joint Research Centre
The European Commission’s in-house science service

Satellite-based estimates of the Influence of Solar Spectrum
Variations on PV Performance
Thomas Huld1, Ana Gracia Amillo1, Jörg Trentmann2 1European Commission, Joint Research Centre, Ispra
2Deutscher Wetterdienst, Offenbach, Germany
2
4th PV Performance Modelling and Monitoring Workshop Köln, Germany, 22-23 October 2015

Overview of presentation
1. Calculation of the influence of spectral variations of PV power
2. Estimates of spectrally resolved solar irradiance from geostationary satellite data, methods and input data
3. Results and discussion, lots of maps
4. Conclusions
3
4th PV Performance Modelling and Monitoring Workshop Köln, Germany, 22-23 October 2015

Calculating the influence of spectrum
Given the spectral response of a subcell l of a PV device (SR), the
short-circuit current can be written as:
𝐼𝑠𝑐,𝑙 = 𝑘 𝑆𝑅𝑙(𝜆)𝐺𝜆𝑑𝜆
where k is a proportionality factor and Gλ is the spectrally resolved
irradiance.
At each point in time we define a spectral correction factor: Cs,l for
subcell l:
𝐶𝑠,𝑙 = 𝑆𝑅𝑙(𝜆)𝐺𝜆𝑑𝜆
𝑆𝑅𝑙(𝜆)𝐺𝜆,𝑆𝑇𝐶𝑑𝜆
𝐺𝜆,𝑆𝑇𝐶𝑑𝜆
𝐺𝜆𝑑𝜆
Here, Gλ,STC is the STC spectrally resolved irradiance.
4
4th PV Performance Modelling and Monitoring Workshop Köln, Germany, 22-23 October 2015

Calculating the influence of spectrum
The overall spectral mismatch of the device can then be
𝑀𝑀 = 𝐶𝑠,𝑙𝐺𝑗𝑁𝑗=1
𝐺𝑗𝑁𝑗=1
In this calculation Cs,l is the spectral correction
factor for the subcell that is current-limiting at
hour j.
5
4th PV Performance Modelling and Monitoring Workshop Köln, Germany, 22-23 October 2015

Spectral response curves
6
Normalized spectral response curves for 5 different modules, measured at the ESTI laboratory
4th PV Performance Modelling and Monitoring Workshop Köln, Germany, 22-23 October 2015

Satellite-based spectral irradiance
Spectrally resolved irradiance data have been calculated using the SPECMAGIC algorithm developed by Deutscher Wetterdienst and the University of Oldenburg.
Cloud effects are calculated from METEOSAT images using
a Heliosat-type method. This is then used by SPECMAGIC together with data on aerosols, water vapour and ozone to calculate global and direct irradiance in 24 spectral bands between 300nm and 2200nm.
7
4th PV Performance Modelling and Monitoring Workshop Köln, Germany, 22-23 October 2015

Satellite-based spectral irradiance
SPECMAGIC has been used to process 30 years of METEOSAT data to generate the CMSAF SARAH data set. Hourly global and direct irradiance values are freely available through the CM SAF web site:
www.cmsaf.eu
SARAH version 2 will feature various improvements and also provide spectrally resolved irradiance data
8
4th PV Performance Modelling and Monitoring Workshop, 22-23 October 2015

Data sources
• Spectral irradiation data calculated from satellite by the CMSAF collaboration (www.cmsaf.eu) and JRC Ispra
• Hourly time resolution
• Spatial resolution around 3-5km
• Temperature and wind speed data from ECMWF (www.ecmwf.int) operational forecast data • 3-hourly time resolution, linear interpolation to hourly values
• Spatial resolution 0.125° latitude/longitude
• Module power measurements mainly by the ESTI Laboratory
All calculations shown use one year of data, with modules
at 20°inclination (equator-facing).
9
4th PV Performance Modelling and Monitoring Workshop Köln, Germany, 22-23 October 2015

Annual global in-plane irradiation
10
Total for 2011, kWh/m2
4th PV Performance Modelling and Monitoring Workshop Köln, Germany, 22-23 October 2015

Module performance ratio
The Module Performance Ratio (MPR) is the ratio of actual module energy output to the output if the module always had the efficiency measured under Standard Test Conditions. It can be expressed as:
Here Htot is the total in-plane irradiation (kWh/m2) and Etot is the total module energy output during the same period (kWh)
11
)/(1000 totstctot HPEMPR
4th PV Performance Modelling and Monitoring Workshop Köln, Germany, 22-23 October 2015

Overall MPR, c-Si modules
12
Annual average MPR, c-Si module, including AOI, spectral effects, temperature and wind speed
4th PV Performance Modelling and Monitoring Workshop Köln, Germany, 22-23 October 2015

Spectral effects, c-Si module
Annual percentage
change in MPR
due to spectral
effects, c-Si
modules
13
4th PV Performance Modelling and Monitoring Workshop Köln, Germany, 22-23 October 2015
Low H2O?
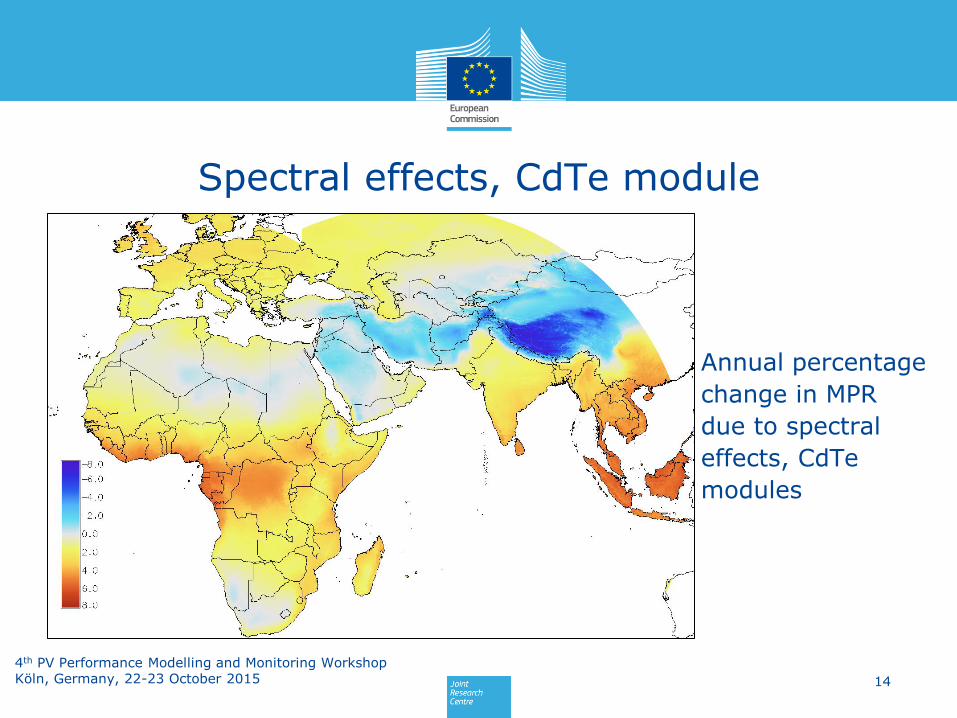
Spectral effects, CdTe module
Annual percentage
change in MPR
due to spectral
effects, CdTe
modules
14
4th PV Performance Modelling and Monitoring Workshop Köln, Germany, 22-23 October 2015

Multi-junction PV technologies
Multi-junction PV cells/modules have a more complicated response
to spectral variations since the current of the whole cell/module is
determined by the junction or subcell with the lowest current.
15
4th PV Performance Modelling and Monitoring Workshop Köln, Germany, 22-23 October 2015

Multijunction response curves
16
4th PV Performance Modelling and Monitoring Workshop Köln, Germany, 22-23 October 2015
Under STC, top cell is
current-limiting, ratio of
Isc is 0.87:1
Under STC, middle cell is
current-limiting, ratio of
Isc is 0.87:0.83:1
Tandem a-Si module Triple-junction III-V cell
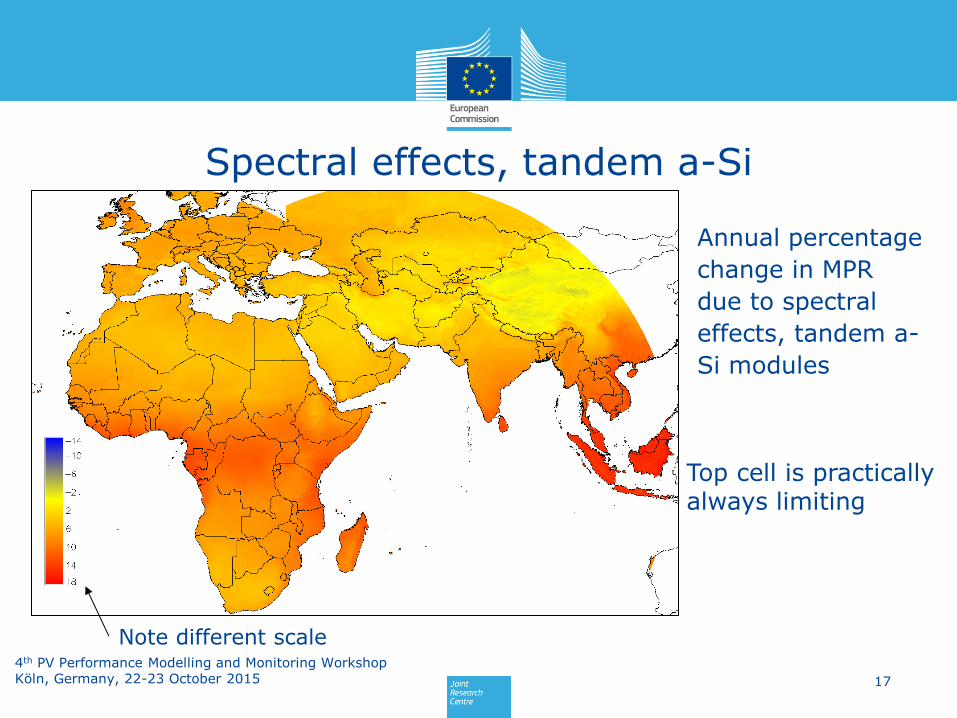
Spectral effects, tandem a-Si
Annual percentage
change in MPR
due to spectral
effects, tandem a-
Si modules
17
4th PV Performance Modelling and Monitoring Workshop Köln, Germany, 22-23 October 2015
Top cell is practically always limiting
Note different scale

Spectral effects, III-V concentrator cell
Annual percentage
change in MPR
due to spectral
effects, III-V
concentrator cell
under DNI
18
4th PV Performance Modelling and Monitoring Workshop Köln, Germany, 22-23 October 2015

Spectral effects, III-V concentrator cell
Percentage of
energy delivered
when top cell is
limiting
19
4th PV Performance Modelling and Monitoring Workshop Köln, Germany, 22-23 October 2015

Conclusions
• Satellite-derived spectral irradiance data can be used to
estimate the spectral effects on PV performance over large
geographical regions
• Results in some extreme climates have not been properly
validated, in particular the cold dry climates at high elevation
• PV technologies with narrow blue-dominated SR have the
highest positive spectral effect in tropical regions with high
diffuse content
• The spectral effects of multi-junction cells seem to depend
strongly on which subcell tends to be current-limiting. More
studies are under way.
20
4th PV Performance Modelling and Monitoring Workshop Köln, Germany, 22-23 October 2015

Thank you for your patience!
21
4th PV Performance Modelling and Monitoring Workshop Köln, Germany, 22-23 October 2015

References Müller R., Behrendt T., Hammer A., Kemper A. A new Algorithm for the
Satellite-based Retrieval of Solar Surface Irradiance in Spectral Bands.
Remote Sensing, 4, 622-647 (2012)
[2] Gracia Amillo A., Huld T., Vourlioti P., Müller R., Norton M. Application of
Satellite-Based Spectrally-Resolved Solar Radiation Data to PV
Performance Studies. Energies, 8, 3455-3488 (2015)
[3] Müller R., Pfeifroth U., Träger-Chatterjee C., Trentmann J., Cremer R.
Digging the METEOSAT treasure – 3 decades of solar surface radiation.
Remote Sensing, 7, 8067-8101 (2015)
[4] Vourlioti P., Huld T., Gracia Amillo A., Norton M. Geospatial mapping of
spectral mismatch of multi-junction photovoltaic modules using satellite-
retreived spectral irradiance data. Proc. 31st EUPVSEC, Hamburg,
Germany (2015)
22
4th PV Performance Modelling and Monitoring Workshop Köln, Germany, 22-23 October 2015