jome, (journal of metals electronic edition), december...
TRANSCRIPT

11
Visualization of Hook and Oscillation Mark Formation Mechanism in
Ultra-Low Carbon Steel Slabs During Continuous Casting
Joydeep Sengupta1 and Brian G. Thomas2
1Senior Researcher, Dofasco Research & Development
1390 Burlington Street East, Hamilton, ON L8N3J5 Canada
2Department of Mechanical Science and Engineering, University of Illinois at Urbana-Champaign,
1206 West Green Street, Urbana, IL 61801USA
ABSTRACT
Oscillation marks accompanied by sub-surface hooks routinely appear on the surface of continuously cast steel
slabs, and are especially severe in ultra- low carbon steel. This paper presents a new detailed mechanism for
their formation, which has been developed by combining existing theoretical modeling results, experimental
observations, and analyses based on optical and scanning electron microscopy. Hooks form by solidification
and dendritic growth at the liquid meniscus during the negative strip period. Oscillation marks are generated
when molten steel partially overflows over the frozen meniscus shortly afterwards and incompletely fills in the
gap before solidifying. The results are presented in the form of a graphical animation that allows easy
visualization of the various events occurring near the meniscus that lead to the formation of these defects.
BACKGROUND
The surface quality of continuous-cast steel slabs is greatly affected by oscillation marks[1, 2] and sub-surface
hook[3] formation, which lead to cracks and slivers in the final rolled product. Oscillation marks are transverse
depressions (Figure 1(a)) running around the strand perimeter that form during each vertical oscillation of the
mold. Periodic mold oscillation is needed to prevent sticking of the solidifying shell to the mold walls.
Providing a “negative strip time” period in each oscillation cycle, when the mold moves downward faster than
the casting speed also encourages infiltration of the mold slag into the gap between the mold wall and steel shell.
A “hook” is a distinct sub-surface microstructural feature[4-6] that often accompanies an oscillation mark,
depending on the steel grade and casting conditions[7]. Hooks increase in severity with decreasing carbon
content, slow oscillation, and low casting speed. Hooks tend to entrap mold slag, floating inclusions and gas
bubbles that often lead to surface defects such as slivers and blisters[8, 9] during subsequent rolling processes.
Examples of typical “curved hook” and “straight hook” shapes are shown (shaded in blue) in Figures 1(b) and
JOMe, (Journal of Metals – electronic edition), December, 2006,

12
1(c), respectively[4, 5]. In extreme cases, the entire slab surface must be ground[10] to remove oscillation marks,
hooks and associated defects completely, leading to higher cost and lower productivity and yield.
Hooks and oscillation marks form due to many complex interacting physical phenomena that vary with time
near the meniscus where the molten steel surface meets the mold wall, as illustrated in Figure 2. Pressure
fluctuations in the liquid slag channel due to mold oscillation alter the meniscus shape. The turbulent flow
patterns in the mold cavity bring liquid to the meniscus region with varying amounts of transient momentum
and superheat. Heat is conducted from the solidification front to the mold through the steel shell, and liquid and
re-solidified slag layers. The meniscus region might solidify, depending on the local superheat of the liquid, the
availability of nuclei sites, the ease of nucleation and growth, and alloy properties such as freezing range. The
mold or slag rim may interact with the meniscus and shell during the negative strip period, especially if it is
large. Rapid changes in temperature gradient may cause thermal distortion of the shell tip, which depend on the
steel mechanical properties, and the extent of level fluctuations relative to the shell tip. These events together
determine the shape and size of sub-surface hooks and their corresponding oscillation marks.
HOOK AND OSCILLATION MARK FORMATION MECHANISMS
Many different conflicting mechanisms for the formation of oscillation marks and hooks have been proposed in
the past. They can be grouped into three general categories:
1) Discontinued shell growth – based mechanisms[11-13]: Sticking to the mold wall during initial solidification
disrupts steel shell growth. Subsequent solidification heals the disjointed shell edges, creating an oscillation
mark.
2) Shell bending and overflow – based mechanisms[3, 14-16]: The initial shell tip is forced to deform and bend
away from the mold surface during the negative strip period. The causes of bending include viscoplastic thermal
deformation[14], sudden level drop [15, 17], and mechanical interaction between the slag rim and shell tip[3].
Subsequent overflow of liquid steel over the curved shell surface during positive strip period simultaneously
creates a hook and oscillation mark. This mechanism is illustrated in Figure 3(a)[16].
3) Meniscus solidification and overflow – based mechanisms[1, 7, 18-20]: The curved meniscus solidifies during
the negative strip period. Subsequent overflow over this frozen meniscus during the positive strip period forms
the hook, and its associated oscillation mark. This mechanism is shown in Figure 3(b)[1].
The first group of mechanisms is likely to occur during billet casting with oil lubrication, where the steel shell
can directly contact and stick to the bare mold surface. However, during continuous casting with mold powder,
a stable layer of liquid and re-solidified slag is usually present between the steel shell and mold surface,
preventing direct shell-mold contact. Additionally, there is no evidence of hot tearing or welding in the
JOMe, (Journal of Metals – electronic edition), December, 2006,

13
micrographs presented in Figure 1. This mechanism therefore is not responsible for hook-type oscillation mark
formation, at least for the ultra-low carbon steel slab samples of interest in this work.
The second group of mechanisms includes two independent theories for hook formation prior to overflow:
mechanical bending of the initial shell tip or thermal distortion. Bending seems unlikely because mechanical
forces transmitted through the liquid layer would be too small to bend the steel into the exact shape of a frozen
meniscus. Such large strains would likely fracture the shell tip anyway. The fragile hook is susceptible to hot
tearing, as brittle fracture of a semi-solid metal needs only ~1% strain[21]. Indeed, Sengupta et al.[5, 6] observed a
separated hook tip near a truncated hook [6].
Thermal distortion of the shell tip was studied using a coupled thermal-stress model by Thomas and Zhu [15],
who modeled a sudden level drop that exposed the inner edge of the shell to lower temperature. A shell tip
deformation of ~1.65 mm was predicted for a severe level drop of ~20 mm, which occurs only rarely in an
automated casting machine. Further work [17] with this model has shown that the thermal distortion is much
lower for more common but smaller (within +/-10 mm[22]) level fluctuations, as shown in Figure 4. The
maximum distortion of the shell was found to be only ~0.46 mm for a large level drop of 16 mm for 0.4 s.
Although the shape of the shell tip is consistent with the hook shape near the surface, shown in Figure 1(c), this
mechanism alone cannot explain the deep hooks (up to ~2.5 mm[10]) in Figure 1(b), that accompanied every one
of a series of oscillation marks in ultra- low carbon steel slabs [10]. This particular steel grade is well known to
exhibit large hooks [23, 24], while oscillation marks are deepest in peritectic steels.
The third mechanism, meniscus freezing and overflow, is supported by recent metallographic investigations
conducted on specially etched ultra- low carbon steel samples by Sengupta et al. [6], which clearly revealed
dendrites originating from several different nucleation sites located on or near the line of hook origin (see
Figure 1(b)). This line was confirmed to be the instantaneous shape of the frozen meniscus, based on a
reasonable match between measured curved hook shapes and the meniscus shape predicted by Bikerma n’s
equation[25, 26] . Thus, meniscus freezing is responsible at least for the formation of curved hooks in ultra-low
carbon steel.
Recent experiments with a mold simulator by Badri et al.[27, 28] revealed a consistent rise in heat flow into the
mold near the meniscus region only during each negative strip period. The oscillation marks align with peaks in
the heat flux curves, as shown in Figure 5, for an ultra- low carbon steel slab. This contradicts most previous
mechanisms.
JOMe, (Journal of Metals – electronic edition), December, 2006,

14
A sharp drop in the thickness of the channel between the solidified shell and the mold wall was observed during
the negative strip period by Tsutsumi et al.[29], as shown in Figure 6(a). These researchers conducted
experiments on a Sn-Pb alloy (metal) and stearic acid (slag) system to observe oscillation marks and mold
powder infiltration behavior. In addition, a sudden rise in tracer velocity was measured in the stearic acid slag
channel during the positive strip period, as indicated in Figure 6(b).
The rest of this paper describes in detail a new mechanism of how hooks and oscillation marks form, which is
consistent with these experimental observations. Increased understanding is achieved by creating real time and
slow-motion “intelligent” animations of the meniscus region during the oscillation cycle.
METHODOLOGY
Previous hook and oscillation mark formation mechanisms have been presented only in a schematic format, e.g.
Figure 3(a) and (b) that obscures the real events. To address these issues, this work combines existing
modeling results, experimental measurements, and plant observations together to construct an animation to
illustrate events at the meniscus as accurately as possible. Specifically, the time-dependent positions of the
mold, slag rim, solidifying shell and meniscus are graphically tracked to visualize the formation of oscillation
mark no. 1 in Figure 7. This figure shows three consecutive hook-type oscillation marks observed on an ultra-
low carbon steel slab cast at POSCO Gwangyang Works, South Korea.[10] They are separated by ~ 8mm, which
is very close to the theoretical “pitch” of casting speed divided by oscillation frequency. The alloy composition
and casting details are given in Table I. The variation of mold and shell velocity with time during the
oscillation period is shown in Figure 8(a), which reveals the negative and positive strip periods. The
corresponding positions relative to the top liquid surface (i.e. in the laboratory frame of reference) are shown in
Figure 8(b).
Each frame in the animation was created by systematically plotting the positions of the mold, meniscus, slag
rim, solid shell, mold slag channel, hooks and oscillation marks in x-z Cartesian space. The x-direction
represents distance through the slab thickness, measured from x=0 at the mold wall. The z-direction represents
vertical distance along the strand/slab length. The first frame is shown in Figure 9, and corresponds to time, t =
0 s in Figure 8(b). The z = 0 line indicates the mold position midway between oscillations and at t = 0,
coincides with the far-field metal level in the mold, which is assumed to remain unperturbed at all times.
At t = 0, the mold acceleration is zero, as its mean position (z = 0) matches the far- field metal level. Thus, the
positive pressure in the slag channel during the negative strip period from the previous cycle is assumed to be
JOMe, (Journal of Metals – electronic edition), December, 2006,

15
completely released by the time the mold reaches the start of the next cycle. Thus, in the absence of surface
waves and inertial forces, the meniscus shape in the first frame is at equilibrium, determined solely by the
balance of surface tension and ferrostatic pressure forces given by Bikerman’s equation[25, 30]. In calculating this
shape, a surface tension of 1.6 N/m was chosen[31], corresponding to the sulfur content of 0.01 % (Table I), and
the steel density was assumed be 7000 kg/m3 at 1560 °C.
The position of the solid slag rim was extrapolated from the isothermal line at the solidification temperature of
the slag in the temperature distribution computed by Takeuchi et al.[32]. Taking into account the differences in
slag melting temperature (1130 °C[32] vs. 1145 °C at POSCO[33]) and superheat (20 °C[32] vs. 32 °C at
POSCO[33]), the position of the solid slag rim during the plant trial was adjusted upward in constructing Figure
9.
The thicknesses of the liquid and re-solidified slag layers separating the shell and mold surfaces were computed
using a one-dimensional finite-difference model, CON1D[34] for the conditions of the plant trial (Table I).
Computed thicknesses of 0.22 mm and 0.34 mm for liquid and solid slag layers were used in the “results”
frames. The profile of the left edge of the slab including the oscillation marks and the hook shapes were traced
from Figure 7. The thickness profile of the solid steel shell along the mold was also taken from computations
with CON1D. The shell thickness at the bottom of the figure (~18 mm below the shell tip) is ~1.3 mm. In this
way, Figure 9 was constructed by assembling together realistic data from many sources.
Each frame of the animation of events that form OM no. 1 was constructed by altering the preceding frame
using logical scientific principles and the following constraints. The mold position is taken from Figure 8(b).
The solid slag rim was assumed to be attached to the mold wall (no-slip condition), so its profile shifts with
time accordingly. The oscillation marks and hooks move down the left edge of the solid shell at the casting
speed. The shell thickness profile is constant with time, except at the shell tip and opposite the hooks.
The meniscus shape changes due to pressure changes during the positive and negative strip periods. Dynamic
effects near the meniscus that force its shape to deviate from the equilibrium shape during an oscillation cycle
were first observed by Tanaka and Takatani[35], on a silicon oil-water interface inside an oscillating acrylic mold.
The meniscus flattens due to the positive pressure in the slag channel during the negative strip period and bulges
outwards due to the negative pressure in the slag channel during the positive strip period. Thus, movement of
the solid slag rim was assumed to vary the slag pressure, and distort the meniscus appropriately. The
instantaneous shape of the meniscus becomes the line of hook origin for OM no. 1 when it freezes. The hook
JOMe, (Journal of Metals – electronic edition), December, 2006,

16
growth from this line then evolves into hook shell thickness. As the shell moves downwards, OM no. 1 and its
hook form and grow, while OM no. 3 gradually moves out of the frame of this Cartesian space.
In total, 36 “results” frames were constructed in Microsoft PowerPoint 2003, to illustrate the phenomena
occurring at the meniscus region during one oscillation cycle, in steps of 0.01 s for a total time of 0.345 s. The
process of logically creating the figures while satisfying the many constraints revealed the specific events
leading to the formation of a hook and oscillation mark. Frame numbers 1 through 36 were exported to a vector-
graphics-based program such as Deneba Canvas 9.0 to create Graphics Interchange Format (GIF) files that
were finally stitched together to produce a movie in Audio Video Interleave format (AVI) using RAD Video
ToolsTM.
ANIMATION OF NEW MECHANISM
Hook and oscillation mark formation can be viewed in real time in Animation 1(a). In real time, the events
occur too fast to see clearly. Therefore, a slow-motion version (1/10th speed with high-resolution) is presented
in Animation 1(b), where the events occurring during each oscillation cycle can be studied more easily. A low-
resolution version of this animation has also been presented in Animation 1(c) to enable faster downloading
from the website.
The animations reveal how the mold moves upward together with the slag rim during the positive strip period
between 0 to 0.110 s (see Figure 8(b)). Thus, the gap between the far- field top-surface metal level and the solid
slag rim gradually opens up, creating negative pressure on the curved meniscus. The meniscus bulges upward
from its equilibrium shape, due to the combined effects of this negative pressure and the inertia imparted by the
upward mold movement. The negative pressure draws liquid slag into the gap, thereby initiating mold slag
consumption during this time. The rate of suction gradually decreases as the mold approaches its maximum
height of +2.938 mm at 0.090 s. As the mold velocity decreases, the negative pressure is gradually neutralized
by the slag inflow.
Eventually, the mold reaches its highest point and moves downward with increasing velocity, overtaking the
speed of the solid shell after 0.110 s. This begins the negative strip period. The slag rim moving down with the
mold builds up positive pressure near the meniscus, which pumps liquid slag out of the gap. Some of this liquid
slag is pumped into the channel between the mold and shell. This contributes to mold slag consumption during
this negative strip time and tends to push the shell slightly away from the mold. This lubrication effect
facilitates smooth withdrawal of the solid shell from the mold, which is why the mold is oscillated.
JOMe, (Journal of Metals – electronic edition), December, 2006,

17
The first crucial event in the formation of Hook no. 1 is meniscus freezing, which starts at 0.120 s and
dictates the ultimate shape of this hook. This particular frame is shown in Figure 10(a) for the benefit of closer
analysis. As the frozen meniscus travels downwards with the casting velocity, the liquid meniscus continues to
freeze (i.e. dendrites grow from the line of origin into the liquid steel, extending the hook). Until t = 0.140 s,
the meniscus of heavy molten steel supported above the (new) shell tip is precariously balanced by surface
tension.
This unstable situation soon triggers the second crucial event: the liquid steel overflows. Overflow occurs when
inertial forces instantaneously exceed surface tension forces, as shown in Figure 10(b). Although possible at
any time during the cycle, this seems most likely shortly after the beginning of the negative strip period. The
heavier liquid steel naturally falls into the interfacial channel, displaces some of the liquid mold slag, and melts
through some of the solid mold slag layer. This brings undercooled liquid steel closer to the mold wall during
the negative strip period. The heat transfer rate increases during this time due to the gradually decreasing
thickness of the mold slag layer that separates the mold and the molten steel. The heat transfer rate is largest
while the steel is still liquid, before solidification produces a surface roughness and solid layer that slows down
heat transfer. This mechanism is consistent with experimental observations by Badri et al that the maximum
heat flux occurs during the negative strip time [27, 28]. It also explains the shape of the slab surface, which is
observed to bulge towards the mold wall just above the oscillation mark [5].
The start of the overflow obviously dictates the maximum possible length of the hook. The contact angle stays
constant as liquid flows over the top of the hook. The rapid heating of the cold side of the shell tip would also
cause thermal expansion, slightly increasing hook curvature due to thermal distortion. The overflowing liquid
is also likely to carry mold slag droplets, gas bubbles, inclusions, and other contaminants collected near the
meniscus, which become entrapped just above the oscillation mark and hook, leading to defects.
For a short time, the colder hook is able to grow rapidly in both directions away from its line of origin. As the
hook reheats, solidification naturally slows down, allowing inter-dendritic liquid and contaminants such as mold
powder to concentrate between the gradually coarsening dendrite arms [6]. Very soon, the hook growth stops.
This explains the microstructural observations of Sengupta [6].
During the overflow event, small inertial forces may fracture the tip from the hook by brittle hot tearing. This
third crucial step in the mechanism, shown in Figure 10(c), renders the typical truncated shape of the hook, as
shown in Figure 1(b). This explains the fractured hook tip observed by Sengupta [5, 6]. Alternatively, the
fractured tip is carried away by the incoming liquid steel and gradually melts, as shown in the animation.
JOMe, (Journal of Metals – electronic edition), December, 2006,

18
The positive strip time period begins just before the mold reaches its lowest position in the oscillation cycle, i.e.
-2.944 mm at 0.260 s. As the mold moves upwards, the gap above the new metal meniscus that had been closing
during negative strip starts to open up. The direction of slag flow reverses as the positive pressure is released.
As the mold gains upward speed, the intake of slag into the gap increases, and mold powder consumption
continues to rise. Additionally, the meniscus shape is pulled up. This process also facilitates the beginning of
conventional shell growth next to the mold, which is the fourth and final crucial event.
The oscillation mark accompanying Hook no. 1 is created at this time, as the overflowing liquid steel
incompletely fills the bottom of the interfacial gap. The extent of the penetration of liquid steel into filling the
interfacial gap and re-melting the solid slag layer determines the final shape of the upper side of the oscillation
mark. The liquid slag trapped during this event accounts for most of the slag consumption. The sudden rise in
tracer velocity observed by Tsutsumi et al.[29] corresponds to the extra slag that is drawn in to refill the
expanding gap region caused by the rise of the slag rim and mold during positive strip.
Normal solidification continues until 0.345s, which ends the complete mold oscillation cycle. The first (Figure
9) and the last (Figure 10(d)) frames are the same, except that hooks 1 and 2 in the latter replace hooks 2 and 3
in the former. The animation runs continuously as all of the events described above are repeated periodically,
producing a hook and oscillation mark during each mold oscillation cycle.
Obviously, chaotic events such as metal level fluctuations may occur at any time during the oscillation cycle,
and will alter the shapes of the resulting oscillation marks and hooks. These events can also create additional
oscillation marks/surface depressions or alter their spacing, as seen in Figure 5, by triggering the overflow
event at a different time during the cycle. Each overflow event naturally can create at most one hook.
After forming, the hook and its associated oscillation mark move down the mold at the casting speed. Hook nos.
1 and 2 stick out past the solidification front into the liquid. This allows the dendrites in the hook to further
coarsen, before the shell eventually catches up, embeds the hooks, and solidification continues past. In addition
to this, inclusions and argon bubbles circulating in liquid steel pool (refer to Figure 2) near the meniscus and
~15 mm below (for this case) can be easily entrapped by these protruding hooks.
The events depicted in the animation clearly reveals the salient features of the new mechanism for hook and
oscillation marks presented in this work. Further details and justification of the new mechanism a re presented
elsewhere[4-6].
JOMe, (Journal of Metals – electronic edition), December, 2006,

19
CONCLUSIONS
This paper reveals the details of a new mechanism for the formation of hooks and oscillation marks during
continuous casting of ultra- low carbon steel, with the aid of an animation generated from a series of carefully
constructed schematics. These schematics simultaneously satisfy separate pieces of knowledge from several
different sources. The animation presented in this paper allows easy visualization of the crucial events that
govern formation of the as-cast surface and its associated features, which include hooks, oscillation marks, and
other defects. This new fundamental understanding should ultimately lead to practices that will minimize or
eliminate these surface defects.
ACKNOWLEDGEMENTS
The authors wish to thank the Natural Sciences and Engineering Research Council of Canada, the National
Science Foundation (Grant DMI-04-23794) and the Continuous Casting Consortium at the University of Illinois
at Urbana-Champaign for support of this project.
REFERENCES
1. Takeuchi, E. and J.K. Brimacombe, "The formation of oscillation marks in the continuous casting of steel slabs," Metallurgical Transactions B, Vol. 15B, 1984, 493-509.
2. Takeuchi, E. and J.K. Brimacombe, "Effect of oscillation-mark formation on the surface quality of continuously cast steel slabs," Metallurgical Transactions B, Vol. 16B, 1985, 605-625.
3. Emi, T., H. Nakato, Y. Iida, K. Emoto, R. Tachibana, T. Imai and H. Bada, "Influence of physical and chemical properties of mold powders on the solidification and occurrence of surface defects of strand cast slabs," Proceedings of National Open Hearth and Basic Oxygen Steel Conference, Vol. 61, 1978,
350-361. 4. Shin, H.-J., B.G. Thomas, G.G. Lee, J.M. Park, C.H. Lee and S.H. Kim, "Analysis of Hook Formation
Mechanism in Ultra Low Carbon Steel using CON1D Heat Flow - Solidification Model," Materials Science & Technology 2004, (New Orleans, LA, Sept. 26-29, 2004), TMS, Warrendale, PA, Vol. II, 2004, 11-26.
5. Sengupta, J., B.G. Thomas, H.J. Shin, G.G. Lee and S.H. Kim, "Mechanism of Hook Formation during Continuous Casting of Ultra-low Carbon Steel Slabs," Metallurgical and Materials Transactions A, Vol.
37A (5), 2006, 1597-1611. 6. Sengupta, J., H.-J. Shin, B. G. Thomas and S.-H. Kim, "Micrograph Evidence of Meniscus
Solidification and Sub-Surface Microstructure Evolution in Continuous-Cast Ultra-Low Carbon Steels,"
Acta Materialia, Vol. 54 (4), 2006, 1165-1173. 7. Bo, K., G. Cheng, J. Wu, P. Zhao and J. Wang, "Mechanism of oscillation mark formation in continuous
casting of steel," Journal of University of Science and Technology Beijing, Vol. 7(3), 2000, 189-92. 8. Schmidt, K.D., F. Friedel, K. Imlau, W. Jager and K.T. Muller, "Consequent improvement of surface
quality by systematic analysis of slabs," Steel Research International, Vol. 74(11-12), 2003, 659-666.
9. Birat, J.-P., M. Larrecq, J.-Y. Lamant and J. Petegnief, "The continuous casting mold: A basic tool for surface quality and strand productivity," Steelmaking Conference Proceedings, Vol. 74, 1991, 39-40.
10. Shin, H.-J., B.G. Thomas, G.-G. Lee, J.-M. Park, C.-H. Lee and S.-H. Kim, "Analysis of hook formation mechanism in ultra-low carbon steel using CON1D heat flow-solidification model," MS&T 2004
JOMe, (Journal of Metals – electronic edition), December, 2006,

20
Conference Proceedings, (New Orleans, LA), The Association for Iron and Steel Technology (AIST) and TMS, Warrendale, PA, 2004, 11-26.
11. Szekeres, E.S., "Overview of mold oscillation in continuous casting," Iron and Steel Engineer, Vol. 73(7), 1996, 29-37.
12. Sato, R., "Powder fluxes for ingot making and continuous casting," Proceedings of National Open Hearth and Basic Oxygen Steel Conference, Vol. 62, 1979, 48-67.
13. Savage, J. and W.H. Pritchard, "Problem of rupture of billet in continuous casting of steel," Iron and
Steel, Vol. 27(14), 1954, 649-652. 14. Schwerdtfeger, K. and H. Sha, "Depth of Oscillation Marks Forming in Continuous Casting of Steel,"
Metall. Mater. Trans. B, Vol. 31B (4), 2000, 813-826. 15. Thomas, B.G. and H. Zhu, "Thermal Distortion of Solidifying Shell Near Meniscus in Continuous
Casting of Steel," JIM/TMS Solidfication Science and Processing Conference, (Honolulu, HI, Dec. 13-
15, 1995), 1995, 197-208. 16. Tomono, H., "Elements of oscillation mark formation and their effect on transverse fine cracks in
continuous casting of steel," Ph.D. Thesis, Federal Institute of Technology, 1979. 17. Sengupta, J. and B.G. Thomas, "Effect of a Sudden Level Fluctuation on Hook Formation During
Continuous Casting of Ultra-Low Carbon Steel Slabs," in Modeling of Casting, Welding, and Advanced
Solidification Processes XI (MCWASP XI) Conference, M.B. C.Z. Gandin, and J.E. Allision, ed., (Opio, France, May 28-June 2, 2006), 2006, 727-236.
18. Saucedo, I.G., "Early solidification during the continuous casting of steel," Steelmaking Conference Proceedings, 1991, 43-53.
19. Yamamura, H., Y. Mizukami and K. Misawa, "Formation of solidified hook- like structure at the
subsurface in ultra low carbon steel," ISIJ International (Supplement), Vol. 36, 1996, S223-226. 20. Putz, O., O. Breitfeld and S. Rodl, "Investigations of flow conditions and solidification in continuous
casting moulds by advanced simulation techniques," Steel Research, Vol. 74(11-12), 2003, 686-692. 21. Mizukami, H., A. Yamanaka and T. Watanabe, "High Temperature Deformation Behavior of Peritectic
Carbon Steel during Solidification," ISIJ International, Vol. 42(9), 2002, 964-973.
22. Lai, W., M. Milone and I.V. Samarasekera, 83rd Steelmaking Conference Proceedings, (Warrendale, PA), ISS-AIME, Vol. 83, 2000, 261-274.
23. Kitano*, Y., "Improvement of slab surface quality of ultra- low carbon steel," Tetsu-To-Hagane, Vol. 80, 1994, T165-168.
24. Suzuki, M., "Initial solidification behaviour of ultra low carbon steel," CAMP-ISIJ, Vol. 11, 1998, 42-44.
25. Bikerman, J.J., Physical Surfaces, Academic Press, Inc., New York, 1970. 26. Jimbo, I. and A.W. Cramb, "Calculations of the effect o f chemistry and geometry on free surface
curvature during casting of steels," Iron & Steelmaker, Vol. 20(6), 1993, 55-63. 27. Badri, A., T.T. Natarajan, C.C. Snyder, K.D. Powers, F.J. Mannion and A. Cramb, "A Mold Simulator
for the Continuous Casting of Steel: Part I. The Development of a Simulator," Metallurgical & Materials
Transactions B, Vol. 36B, 2005, 355-371. 28. Badri, A., T.T. Natarajan, C.C. Snyder, K.D. Powers, F.J. Mannion, M. Byrne and A. Cramb, "A Mold
Simulator for COntinuous Casting of Steel: Part II. The Formation of Oscillation Marks during the Continuous Casting of Low Carbon Steel," Metallurgical & Materials Transactions B, Vol. 36B, 2005, 373-383.
29. Tsutsumi, K., J. Ohtake and M. Hino, "Inflow behavior observation of molten mold powder between mold and solidified shell by continuous casting simulator using Sn-Pb alloy and stearic acid," ISIJ
International, Vol. 40, 2000, 601-608. 30. Fredriksson, H. and J. Elfsberg, "Thoughts about the initial solidification process during continuous
casting of steel," Scandinavian Journal of Metallurgy, Vol. 31, 2002, 292-297.
31. Lee, J. and K. Morita, "Evaluation of surface tension and adsorption for liquid Fe-S alloys," ISIJ International, Vol. 42(6), 2002, 588-594.
32. Takeuchi, S., Y. Miki, S. Itoyama, K. Kobayashi, K. Sorimachi and T. Sakuraya, "Control of oscillation mark formation during continuous casting," Steelmaking Conference Proceedings, 1991, 37-41.
JOMe, (Journal of Metals – electronic edition), December, 2006,

21
33. Shin, H.-J., G.-G. Lee, W.-Y. Choi, S.-M. Kang, J.-H. Park, S.-H. Kim and B.G. Thomas, "Effect of mold oscillation on powder consumption and hook formation in ultra- low carbon steel slabs," AISTech
2004 Iron & Steel Technology Conference Proceedings Vol II, (Nashville, TN, September 2004), The Association for Iron & Steel Technology (AIST), Warrendale, PA, 2004, 1157-1170.
34. Meng, Y. and B.G. Thomas, "Modeling Transient Slag Layer Phenomena in the Shell/Mold Gap in Continuous Casting of Steel," Metallurgical & Materials Transactions B, Vol. 34B, 2003, 707-725.
35. Tanaka, T. and K. Takatani, "Hydrodynamics of molten powder in the vicinity of meniscus in
continuous casting," CAMP-ISIJ, Vol. 2, 1989, 1263.
JOMe, (Journal of Metals – electronic edition), December, 2006,
22
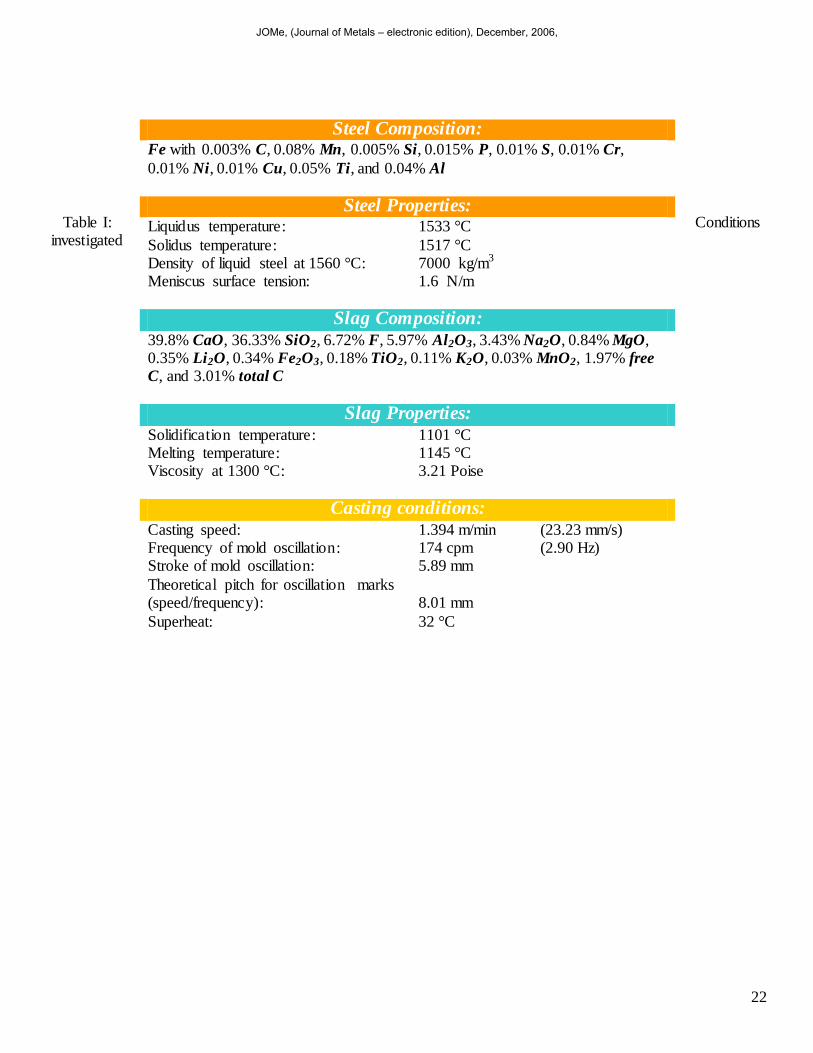
Table I: Conditions investigated
Steel Composition: Fe with 0.003% C, 0.08% Mn, 0.005% Si, 0.015% P, 0.01% S, 0.01% Cr,
0.01% Ni, 0.01% Cu, 0.05% Ti, and 0.04% Al
Steel Properties: Liquidus temperature: 1533 °C
Solidus temperature: 1517 °C Density of liquid steel at 1560 °C: 7000 kg/m3 Meniscus surface tension: 1.6 N/m
Slag Composition: 39.8% CaO, 36.33% SiO2, 6.72% F, 5.97% Al2O3, 3.43% Na2O, 0.84% MgO, 0.35% Li2O, 0.34% Fe2O3, 0.18% TiO2, 0.11% K2O, 0.03% MnO2, 1.97% free C, and 3.01% total C
Slag Properties:
Solidification temperature: 1101 °C Melting temperature: 1145 °C Viscosity at 1300 °C: 3.21 Poise
Casting conditions: Casting speed: 1.394 m/min (23.23 mm/s)
Frequency of mold oscillation: 174 cpm (2.90 Hz) Stroke of mold oscillation: 5.89 mm
Theoretical pitch for oscillation marks (speed/frequency):
8.01 mm
Superheat: 32 °C
JOMe, (Journal of Metals – electronic edition), December, 2006,

23
Figure 1 – (a) Photograph of oscillation marks (OM) on the surface of an ultra-low steel slab, and optical micrographs showing distinctly different features of (b) curved and (c) straight hooks adjacent to OMs[5,6].
Scale
10 mm 0 Scale
1 mm 0
Oscillation
mark (OM)
Location of
transverse crack
(along OM)
Pitch of OM
Entrapped
bubble/
inclusion
(a)
(b)
(c)
“Curved”
hook
“Straight”
hook
OM
OM
Line of
hook origin
JOMe, (Journal of Metals – electronic edition), December, 2006,

24
Figure 2 – Complex phenomena occurring inside a continuous caster mold (right) influence initial solidification in the meniscus region (left).
LIQUID
FLUX
MOLTEN
STEEL POOL
SOLID
FLUX
1
2
4
MENISCUS
ARGON
BUBBLES
Metal entry
from nozzle
1 mm
MENISCUS REGION
COPPER
MOLD
STEEL
SHELL
5
OM
HOOK
3
LIQUID
FLUX
MOLTEN
STEEL POOL
SOLID
FLUX
1
2
4
MENISCUS
ARGON
BUBBLES
Metal entry
from nozzle
1 mm
MENISCUS REGION
COPPER
MOLD
STEEL
SHELL
5
OM
HOOK
3Change in meniscus shape
Delivery of local superheat
Heat transport
Meniscus freezing
Deformation of shell tip
1
2
3
4
5
JOMe, (Journal of Metals – electronic edition), December, 2006,

25
Figure 3 – Based on contemporary mechanisms, hooks can form either by (a) shell distortion[16] or (b) meniscus
freezing[1] during negative strip; followed by meniscus overflow during positive strip creating an OM.
Shell distortion
during negative
strip
Liquid steel
overflow during
positive strip
Hook OM
Meniscus
freezing during
negative strip
Liquid steel
overflow during
positive strip
Hook OM
(a)
(b)
JOMe, (Journal of Metals – electronic edition), December, 2006,

26
Figure 4 - Shell distortion for different magnitudes of level fluctuation (2 – 16 mm) and normal solidification
for ultra-low carbon steel predicted by a 2-D coupled thermal stress model [17].
0 1 2
z(m
m)
0
5
10
15
20
25
30
0 1 20 1 20 1 2
1500
1450
1400
1350
1300
1250
1200
1150
1100
1050
1000
0 1 20 1 2
2mm
level
drop
5 mm
level
drop
8 mm
level
drop
10 mm
level
drop
16 mm
level
drop
- 0.09 mm - 0.09 mm
No level
fluctuation
Shell
thickness
= 1.74 mm
- 0.02 mm - 0.02 mm +0.07 mm +0.07 mm +0.23 mm +0.23 mm +0.36 mm +0.36 mm +0.46 mm +0.46 mm
0 1 2
1500
1450
1400
1350
1300
1250
1200
1150
1100
1050
1000
Temperature (oC)
JOMe, (Journal of Metals – electronic edition), December, 2006,

27
Figure 5 – Consistent rise in heat flow into the mold near the meniscus during each negative strip period line up
with its associated oscillation mark, as reported by Badri et al.[27]
Oscillation marks on an ultra-low carbon
steel slab
Periodic rise in heat transfer during
negative strip
JOMe, (Journal of Metals – electronic edition), December, 2006,

28
Figure 6 – Plots showing (a) variation of distance from solidified shell to mold wall (ys) with time, and (b)
tracer and mold velocities with time measured by Tsutsumi et al.[28]
(b)
Sudden rise in tracer
velocity during positive strip period (tp) caused by creation of additional space
in tracer channel due to formation of an oscillation
mark
Sudden decrease in ys during negative strip
period caused by liquid steel overflow over a
hook and subsequent
solidification
(a)
JOMe, (Journal of Metals – electronic edition), December, 2006,

29
Figure 7 - Three consecutive hook-type oscillation marks in an ultra low carbon steel slab.
Solid and dotted lines (left) outline the slab surface and hook shapes respectively, which were transferred to Frame 1 in Figure 8[5,6].
8 m
m8 m
m
Hook #3
Hook #2
Hook #1
OM
OM
OM
Sla
b s
urf
ace
Cast
direction
MICROGRAPHTRACE8 m
m8 m
m
Hook #3
Hook #2
Hook #1
OM
OM
OM
Sla
b s
urf
ace
Cast
direction
MICROGRAPHTRACE
JOMe, (Journal of Metals – electronic edition), December, 2006,

30
-90
-80
-70
-60
-50
-40
-30
-20
-10
0
10
20
30
40
50
60
70
80
90
0 0.05 0.1 0.15 0.2 0.25 0.3 0.35
Time (s)
Vel
ocit
y (
mm
/s)
Shell
Oscillating mold
(a)
NEGATIVE
STRIP
-24
-22
-20
-18
-16
-14
-12
-10
-8
-6
-4
-2
0
2
4
6
0 0.05 0.1 0.15 0.2 0.25 0.3 0.35
Time (s)
z (m
m)
Mold position w.r.t
meniscus level
OM#2 position w.r.t.
meniscus level
Meniscus level
z = 0 mm
LABORATORY FRAME
Casting speed = 23.23 mm/s (1.394 m/min)
Stroke = 5.89 mm
Frequency = 2.90 cps (174 cpm)
NEGATIVE
STRIP
(b)
JOMe, (Journal of Metals – electronic edition), December, 2006,

31
Figure 8 – (a) The variation of mold and shell velocity with time and the negative strip period for the operating conditions used to produce the slab shown in Figure 6, and (b) the positions of the mold and OM no. 2 w.r.t. the
far field meniscus (laboratory frame of reference).
Fig. 9 - Positions of meniscus, solid shell, hooks, OMs, slag rim & mold at time t = 0 s; (Frame 1).
-24
-22
-20
-18
-16
-14
-12
-10
-8
-6
-4
-2
0
2
4
0 2 4 6 8 10 12 14 16
Time: 00.000 s
Meniscus: +00.000 mm
Mold: +00.000 mm
OM No. 1: Not present
OM No. 2: -12.400 mm
OM No. 3: -20.400 mm
Distance across slab width (mm)
Dis
tan
ce a
lon
g m
old
len
gth
(m
m)
LIQUID STEEL
LIQUID SLAG
SOLID
SLAG
MOLD
STEEL
SHELL
MENISCUS
Mold
position
from
Fig. 7(b)
Hook at
base of
OM #2
Hook at
base of
OM #3
Equilibrium meniscus shape
from Bikerman eqn. [24]
Far-field metal level
Interface shape computed
by S. Takeuchi et al. [32]
Adjusted shape
Shell thickness predicted by CON1D [33]
Thickness
predicted
by CON1D
Liquidus isotherm predicted
by CON1D [33]
Solidus isotherm
JOMe, (Journal of Metals – electronic edition), December, 2006,

32
Animation 1 – Formation and movement of hooks and oscillation marks (a) in real time (315 KB), (b) in slowed down high-resolution (41 MB), and (c) in slowed-down low-resolution (942 KB) for downloading.
The movies can be viewed using Windows Media PlayerTM or QuickTime PlayerTM by clicking on the
hyperlinked static images.
(a) (b) -24
-22
-20
-18
-16
-14
-12
-10
-8
-6
-4
-2
0
2
4
0 2 4 6 8 10 12 14 16
Time: 00.000 s
Meniscus: +00.000 mm
Mold: +00.000 mm
OM No. 1: Not present
OM No. 2: -12.400 mm
OM No. 3: -20.400 mm
Distance along slab width (mm)
Dis
tan
ce a
lon
g m
old
len
gth
(m
m)
LIQUID STEEL
LIQUID SLAG
SOLID
SLAG
MOLD
STEEL
SHELL
MENISCUS
-24
-22
-20
-18
-16
-14
-12
-10
-8
-6
-4
-2
0
2
4
0 2 4 6 8 10 12 14 16
Time: 00.000 s
Meniscus: +00.000 mm
Mold: +00.000 mm
OM No. 1: Not present
OM No. 2: -12.400 mm
OM No. 3: -20.400 mm
Distance along slab width (mm)
Dis
tan
ce a
lon
g m
old
len
gth
(m
m)
LIQUID STEEL
LIQUID SLAG
SOLID
SLAG
MOLD
STEEL
SHELL
MENISCUS
(c)
JOMe, (Journal of Metals – electronic edition), December, 2006,

33
-24
-22
-20
-18
-16
-14
-12
-10
-8
-6
-4
-2
0
2
4
0 2 4 6 8 10 12 14 16
Time: 00.120 s
Meniscus: +00.000 mm
Mold: +02.404 mm
OM No. 1: -07.188 mm
OM No. 2: -15.188 mm
OM No. 3: -23.188 mm
SOLID
SLAG
LIQUID SLAG
LIQUID STEEL
STEEL
SHELL
Dis
tan
ce a
lon
g m
old
len
gth
(m
m)
MOLD
Distance across slab width (mm)
Liquid flux squeezed
out of the gap
Meniscus freezes from shell tip into
under-cooled liquid forming line of
hook origin
Liquid flux squeezed into the channel
between the mold and shell
-24
-22
-20
-18
-16
-14
-12
-10
-8
-6
-4
-2
0
2
4
0 2 4 6 8 10 12 14 16
Time: 00.140 s
Meniscus: +00.000 mm
Mold: +01.640 mm
OM No. 1: -07.653 mm
OM No. 2: -15.653 mm
OM No. 3: -23.653 mm
SOLID
SLAG
LIQUID SLAG
LIQUID STEEL
STEEL
SHELL
Dis
tan
ce a
lon
g m
old
len
gth
(m
m)
MOLD
Distance across slab width (mm)
Meniscus above the shell tip is
delicately balanced, starts to
bulge out, and overflows
Growth of dendrites below the line of
hook origin causes hook thickness to
increase & creates the curved shape
-24
-22
-20
-18
-16
-14
-12
-10
-8
-6
-4
-2
0
2
4
0 2 4 6 8 10 12 14 16
Time: 00.230 s
Meniscus: +00.000 mm
Mold: -02.255 mm
OM No. 1: -09.743 mm
OM No. 2: -17.743 mm
OM No. 3: -25.743 mm
SOLID
SLAG
LIQUID SLAG
LIQUID STEEL
STEEL
SHELL
Dis
tan
ce a
lon
g m
old
len
gth
(m
m)
MOLD
Distance across slab width (mm)
Growth of hook slows down as liquid
gains superheat due to fluid flow.
Formation of hook is completed and
hook tip fractures & melts away.
-24
-22
-20
-18
-16
-14
-12
-10
-8
-6
-4
-2
0
2
4
0 2 4 6 8 10 12 14 16
Time: 00.345 s
Meniscus: +00.000 mm
Mold: +00.000 mm
OM No. 1: -12.400 mm
OM No. 2: -20.400 mm
OM No. 3: Not present
SOLID
SLAG
LIQUID SLAG
LIQUID STEEL
STEEL
SHELL
Dis
tan
ce a
lon
g m
old
len
gth
(m
m)
MOLD
Distance along slab width (mm)
Slag rim returns to
its original position
Meniscus position regains
its equilibrium shape
Growth of new shell above the
hook creates new oscillation mark
Hook at
base of
OM #1
Hook at
base of
OM #2
(a) (b)
(c) (d)
JOMe, (Journal of Metals – electronic edition), December, 2006,

34
Figure 10 - Frames that depict crucial events in the formation of a hook and OM: (a) meniscus freezing,
(b) meniscus overflow, (c) hook tip fracture, and (d) OM formation after new shell growth.
JOMe, (Journal of Metals – electronic edition), December, 2006,