joshua angrist, philip oreopoulos, and tyler williams
TRANSCRIPT

NBER WORKING PAPER SERIES
WHEN OPPORTUNITY KNOCKS, WHO ANSWERS? NEW EVIDENCE ON COLLEGEACHIEVEMENT AWARDS
Joshua AngristPhilip Oreopoulos
Tyler Williams
Working Paper 16643http://www.nber.org/papers/w16643
NATIONAL BUREAU OF ECONOMIC RESEARCH1050 Massachusetts Avenue
Cambridge, MA 02138December 2010
Our thanks to the Higher Education Quality Council of Ontario and to the Spencer Foundation forfunding this work. Thanks also go to participants in the MIT Labor Lunch, the Harvard Labor EconomicsWorkshop, and the MIT Labor/Public Finance Workshop for helpful comments. The views expressedherein are those of the authors and do not necessarily reflect the views of the National Bureau of EconomicResearch.
NBER working papers are circulated for discussion and comment purposes. They have not been peer-reviewed or been subject to the review by the NBER Board of Directors that accompanies officialNBER publications.
© 2010 by Joshua Angrist, Philip Oreopoulos, and Tyler Williams. All rights reserved. Short sectionsof text, not to exceed two paragraphs, may be quoted without explicit permission provided that fullcredit, including © notice, is given to the source.
When Opportunity Knocks, Who Answers? New Evidence on College Achievement AwardsJoshua Angrist, Philip Oreopoulos, and Tyler WilliamsNBER Working Paper No. 16643December 2010JEL No. I21,I22,I28,J24
ABSTRACT
We evaluate the effects of academic achievement awards for first and second-year college studentson a Canadian commuter campus. The award scheme offered linear cash incentives for course gradesabove 70. Awards were paid every term. Program participants also had access to peer advising byupperclassmen. Program engagement appears to have been high but overall treatment effects weresmall. The intervention increased the number of courses graded above 70 and points earned above70 for second-year students, but there was no significant effect on overall GPA. Results are somewhatstronger for a subsample that correctly described the program rules. We argue that these results fitin with an emerging picture of mostly modest effects for cash award programs of this type at the post-secondarylevel.
Joshua AngristDepartment of EconomicsMIT, E52-35350 Memorial DriveCambridge, MA 02142-1347and [email protected]
Philip OreopoulosDepartment of EconomicsUniversity of Toronto150 St. George StreetToronto, ON M5S 3G7CANADAand [email protected]
Tyler WilliamsDepartment of EconomicsMIT, E52-35450 Memorial DriveCambridge, MA [email protected]

I. Introduction
As many as 40 percent of U.S. and 30 percent of Canadian undergraduates have yet to
finish college six years after matriculating (National Center for Education Statistics, 2010,
Grayson and Grayson, 2003). These delays, which are typically due to a failure to meet academic
degree requirements, may be both privately and socially costly. Struggling students pay a higher
cost in foregone earnings, while those who fail to complete a degree program forgo the benefit of
any possible “sheepskin effects.” Time on campus is also subsidized in public colleges and
universities, so repeated course failures and long completion times are costly for taxpayers.
In an effort to boost their student’ grades, most universities deploy an array of support
services. There is little credible evidence that these efforts justify their cost. A randomized trial
discussed by Scrivener and Weiss (2009) finds that campus support services generate small
improvements in grades and reduce student attrition, but Angrist, Lang, and Oreopoulos (2009)
and MacDonald, Bernstein, and Price (2009) find virtually no effect from remedial services. Part
of the problem seems to be that take-up rates for most services are low. On the other hand, results
from recent evaluations by Scrivener, Sommo, and Collado (2009) and Bettinger and Long
(2009) suggest mandatory remedial services can benefit college freshman at risk of dropping out.
In a parallel effort, motivated in part by the mixed results for support services alone,
researchers and policy-makers have experimented with financial incentives for college
achievement. Merit scholarships for high achievers have long been a feature of college life, but
most merit scholarship recipients are, by definition, students who could be expected to do
reasonably well with or without scholarship support. Financial awards for weaker students have
traditionally been need-based, and performance-based awards for weak students are a relatively
new development. In a series of randomized trials, Angrist et al. (2009), Cha and Patel (2010),
MacDonald et al. (2009), and Barrow et al. (2010) studied the impact of large merit scholarships
tied to college GPA thresholds in the B-C grade range. These studies find that merit scholarships
had positive effects on academic performance, especially when combined with extra academic
support services. However, these improvements were short-lived and concentrated in subgroups,
so that the overall effects are modest.1
1 Georgia Hope and a host of similar state programs award scholarships to students with a high school GPA of B or
better (see, e.g., Dynarski, 2004). See also Garibaldi et al. (2007), who report faster degree completion by Italian women in response to gradually increasing tuition payments and Leuven, Oosterbeek, and van der Klaauw (2003), who find mixed effects of small financial incentives for Dutch university students.

3
Randomized trials and quasi-experimental evaluations of financial incentives have been
more encouraging for elementary and secondary students than for college students. Here too,
however, student responses often appear to be limited to subgroups of the population under
study. Studies showing substantial positive effects on elementary and secondary school students
include Angrist et al. (2002), Henry and Rubinstein (2002), Kremer, Miguel, and Thornton
(2009), Angrist and Lavy (2009), Deardon et al. (2009), Dee (2009), and Pallais (2009). Other
recent experimental studies have generated less reason for optimism about the promise of
incentives in schools: the randomized trials described by Bettinger (2008), Sharma (2010), and
Fryer (2010) show little effect of an array of awards on achievement for elementary and middle
school students in a wide variety of settings, and Rodriguez-Planas (2010) reports negative long-
run effects of financial incentives for high school men.
This paper reports on the “Opportunity Knocks” (OK) experiment, an award program
piloted at a large Canadian commuter university. The setting is similar to non-flagship campuses
in American state systems. First and second-year students who applied for financial aid were
offered the chance to participate in the program. Those who agreed were randomly assigned to
treatment and control groups. Treated students earned $100 for each class in which they attained
a grade of 70 or better and an additional $20 for each percentage point above 70 percent. A
student with a full-course load scoring 75 in every course qualified for $2,000 over the course of
the school year (10 ($100 + (5 20))). Randomly assigned peer advisors, upper-class students
who had been trained to provide advice about study strategies, time management, and university
bureaucracy, also contacted participants. The OK program structure was developed in view of the
results from an earlier evaluation on a similar campus, the Student Achievement and Retention
(STAR) project (Angrist, et al., 2009). STAR offered three interventions, the most successful of
which combined financial incentives with academic support services. In the hopes of boosting
motivation further, the OK award threshold was chosen to be attainable for most students
(subject to a budget constraint). We opted for a partially linear payout scheme on theoretical
grounds (see, e.g., Holmstrom and Milgrom, 1987).
OK awards were generous; high achievers could earn up to $700 per class. Almost 90
percent of OK participants had some kind of interaction with peer advisors and/or the program
web site. On balance, however, the experimental results were disappointing. Second year
students who were offered incentives earned about 13 percent more than expected based on the

4
distribution of control-group grades, suggesting the program had an incentive effect. The
strongest effects appear around the award threshold, where the number of payment-qualifying
courses increased, especially among students who appeared to understand the program well. But
these gains did not translate into substantially and significantly higher GPAs. There is also little
evidence of any impact on academic outcomes measured one year later.
The following section describes the OK campus setting, program rules, and our random-
assignment research design. Section III covers descriptive statistics and reports on indicators of
program engagement. Section IV discusses the experimental results, which show that treated
second year students earned more in award payments than would have been expected in the
absence of an incentive effect. OK also increased the number of second-year courses graded
above 70 and grade points earned above 70, but these effects were not large enough to generate a
significant increase in students’ overall GPAs. Section V reports on participants’ impressions of
the program as revealed in post-program surveys. The paper concludes in Section VI.
II. Background and Research Design
OK was implemented on an Ontario commuter campus affiliated with a large public
university in the fall of 2008. The six-year completion rate on this campus is about 73 percent.
There are about 2,500 students in an entering class. In late summer of 2008, we invited 1,056
first years and 1,073 second years to participate in OK. Eligible students are those who had
requested financial aid, had an email address, had a high school GPA recorded in the university
administrative information system, and had enrolled for at least 1.5 credits (half of a full load) in
the fall semester. Invitees who completed the intake survey and gave consent were eligible for
random assignment. Of the 1,271 students who completed the survey and were eligible, 400 were
treated. Treatment assignment was stratified by year (first and second) and sex, with 100 in each
group. Within sex-year cells, assignment was stratified by high school GPA quartile, with 25 in
each group (the analysis below controls for strata).
The OK intervention combined incentives with academic support services. This was
motivated by the fact that a combination of incentives and services appeared to be especially
effective in the earlier STAR evaluation, which ran in a similar setting. The services delivered
through STAR were more elaborate and expensive, however. STAR included the opportunity to
participate in facilitated study groups as well as email-based peer mentoring, while OK services

5
consisted of email-based peer-mentoring only. We opted for email because the take-up rate for
facilitated study groups was low. Also, because a number of STAR participants saw the awards
as essentially out of reach, OK award rates were designed to be much higher. OK awards were
also paid out more frequently, in this case, every term. Unlike STAR, the OK population
consisted only of students that had applied for financial aid prior to the start of the school year.
This was partly in response to political constraints but it also seemed likely that the aid
population might be most responsive to the opportunity to earn additional awards.
OK participants earned $100 for each class in which they received a 70 percent grade,
and an additional $20 for each percentage point above 70.2 For example, a student who earned a
75 in each of five classes over one semester (five classes constitute a full load) would have
received 5 × (100 + (5 × 20)) = $1,000. We focused on grades near 70 because anything worse is
typically seen as unsatisfactory and because awards for lower levels of achievement are likely to
be prohibitively expensive (a GPA of at least C- is required for graduation; this translates to a
percentage grade in the low 60s). In an effort to gauge our subjects’ understanding of program
rules, we asked those eligible for random assignment to apply the award formula to hypothetical
grades. Most calculated the award values correctly (those who responded incorrectly received a
clarification by email).
The services component of OK matched all treated students with (trained and paid) same-
sex peer advisors. Peer advisors were enthusiastic upper-year students or recent graduates with
good grades. Each peer advisor covered 50 participants. Advisors emailed advisees once every
two to three weeks, whether or not the advisees responded. These emails offered advice on
upcoming academic events and workshops and guidance relevant for key periods in the academic
calendar, such as midterms and finals. Advisors also provided information about OK
scholarships, including reminders of the scholarship calculation and payment schedules.
Advisors invited their clients to turn to them for help with any academic or personal issues that
seemed relevant to academic success.
III. Descriptive Statistics and Program Response
The data for this study come primarily from the university records containing information
2 Payoffs were doubled and issued in the spring for year-long courses.

6
on applicants, enrolled students, and course grades. We supplemented this with data from a
baseline survey used to identify the population eligible for random assignment, as well as more
descriptive focus-group style information collected from a few subjects after the experiment.
Table 1, which presents descriptive statistics, shows that OK participants were mostly
college students of traditional age. Control group students had average grades around 82 percent
in high school. Less than half of the control group spoke English as a first language, reflecting
the relatively high proportion of immigrants on the OK host campus. About half of control group
parents graduated from a postsecondary institution (44 percent of mothers and 53 percent of
fathers), while nearly 80 percent of parents graduated from high school, a figure comparable to
the Canadian average for college student parents. Table 1 also documents the fact that random
assignment successfully balanced the background characteristics of those in the treatment and
control groups (as evidenced by insignificant effects in the “Treatment Difference” columns).
Although not documented in the table, student course selection as measured by difficulty or
subject area is also well balanced between treatment and control groups (random assignment
occurred after students had pre-registered for courses).
The OK intake survey, included in the packet describing the program to those eligible for
random assignment, included two questions meant to gauge subjects’ understanding of program
award rules. The first asked students to calculate the award amount for one class, and the second
asked them to calculate the total award amount from five classes. Two-thirds of the students
answered the second question correctly, and over 80 percent answered the first question
correctly, facts also documented in Table 1. In the program analysis, we look at treatment effects
for the entire sample and for those who answered the second assessment question correctly to see
if those who understood the scholarship formula also had a stronger program response.
Student involvement with OK was high. This can be seen in Table 2, which shows that
about 73 percent of treated students checked their scholarship earnings on the program website.
Women were nine points more likely to check than men. Only 38 percent of treated participants
sent an email to their assigned peer advisor in the fall, but this number increased to 50 percent in
the spring. By years end, 70 percent had emailed an advisor at least once over the course of the
year. First year students and women were more likely to contact advisors than were second year
students and men. At least eighty-six percent of treated students made some kind of program
contact: they emailed a peer advisor, checked scholarship earnings, or emailed program staff.

7
Following a presentation of intention-to-treat effects, we discuss two-stage least squares (2SLS)
estimates of treatment effects using a dummy for any program contact as the endogenous
variable. The idea here is that subjects who made no contact of any kind are unlikely to have
been affected by treatment, so any impact must driven by the subpopulation that did make
contact. 2SLS estimates the effect of treatment on the treated in this case.
IV. Program Effects
A. Main Findings
A natural starting point for our analysis is a comparison of the amount earned by the
experimental group with the earnings that students in the control group would have been entitled
to had they been in the program. A large program effect should be reflected in larger-than
expected earnings, where expected earnings are measured using the grade distribution in the
control sample. 3 Our estimates of earnings and other effects come from regressions like this one:
yij = αj + βTi + δ’Xi + εij, (1)
where yij is the outcome for student i in stratum j, the αj are strata effects, Ti is a treatment
assignment indicator, and Xi is a vector of additional controls.4 Causal effects of the OK
program are captured by β. Since treatment is randomly assigned, covariates are unnecessary to
reduce omitted variables bias in the estimated treatment effects. Models with covariates may,
however, generate more precise estimates.
The OK program had no impact on earnings for first-year men and women, a result that
can be seen in columns 1, 4, and 7 of Table 3. On the other hand, there is some evidence of
higher-than-expected earnings for second-year treated students, especially second-year men. The
estimated effect on second year men in the spring term, reported in column 5, is a significant 170
dollars. Estimates over the course of the year are about 255 dollars for men and 180 dollars for
all second years. Both of these estimates are at least marginally significant and amount to 15-20
percent of a standard deviation of hypothetical control group earnings.5
3 Ashenfelter and Plant (1990) use a similar hypothetical payment outcome to measure the labor supply effects of
exposure to a negative income tax. 4 Additional controls include parental education, an indicator for English mother tongue, and indicators for
students who answered scholarship formula questions correctly. 5 Restricting the fall and spring samples to be the same as the full-year sample generates effects for the full year
equal to the sum of the fall and spring effects. Estimated effects for the full year need not equal the sum (or average) of the two semester effects because the full-year sample differs slightly from the sample for either semester alone.

8
The question of whether the OK program caused more complex distributional shifts in
hypothetical earnings is explored in Figure 1, which shows treatment and control earnings
distributions in separate panels by sex and year. The only (marginally) significant distributional
contrast in the figure is for second year men (using a Kolmogorov-Smirnov test). On the other
hand, the contrast by treatment status for second year women looks similar to that for men. For
both men and women, treatment seems to have shifted second year earnings from below a level
around 1,500 to more than 1,500 dollars. The shift emerges roughly one hundred dollars above
mean earnings for controls.
The evidence for an effect on average grades (measured on a 0-100 scale) and GPA is
weaker than that for earnings. The grades results appear in Table 4a and the GPA results appear
in Table 4b. Average grades for second-year men increased by about 2.5 percentage points in the
spring but this estimate is only marginally significant, and it’s the only significant result in the
table. The corresponding GPA effect amounts to about 0.27 GPA points, an estimate significant at
the 5 percent level.6
The earnings gains documented in Table 3 are necessarily explained by increases in the
number of courses graded at least 70 and grade points over 70. Table 5 reports full-year program
effects on each of these components of the scholarship award formula. Panel A shows effects on
the number of courses in which a student earned a grade of at least 70. Treatment appears to have
increased the number of over-70 grades awarded to second year men by almost a full course. The
number of over-70 courses increases by about half a course for all second years. These estimates
are reasonably precise. On the other hand, the estimated effects on grade points earned over 70
are not estimated very precisely. The only (marginally) significant point gain is for all second
years, an effect of 6.2 percentage points. It’s also worth noting, however, that the magnitudes
come out such that effects on total earnings are equally distributed between a threshold effect at
70 and awards for points over 70.
We looked for additional evidence of effects concentrated around the award threshold.
The results of this investigation are reported in Figure 2 in the form of treatment effects on
indicators for grade>c, where c runs from 60-80 (these plots also show the control grade
distribution). This investigation uncovers no evidence of an increased likelihood of crossing any
6 GPA is not a linear transformation of average grades, so we expect slight differences in results. Effects on GPA
should be more similar to effects on earnings, since GPA also jumps at 70 percent.

9
threshold for first years. Treatment appears to have increased the likelihood second-year women
earned a grade of 72-74, a series of effects concentrated around the minimum award threshold.
Effects concentrated around the threshold may be evidence of strategic grade-seeking behavior
on the part of treated students. For example, students who earned a 69 may have made a special
effort (through negotiation or extra work) to clear 70. On the other hand, treatment appears to
have boosted the grades of second-year men over a wide interval running from 60-75 percent.
This pattern of effects weighs against a purely strategic view of the incentive response, at least
among men.
Although most students appeared to understand the OK program rules and award
formula, a non-trivial minority did not. Those who misunderstood the formula linking grades and
awards seem less likely to have been motivated by the awards. We therefore report estimates for
a sample restricted to participants who correctly applied the OK earnings formula to an example
in the baseline survey. Two-thirds of the sample evaluated the example correctly. Estimates
limited to this sample are reported in Table 6, which shows full-year estimates for the same
dependent variables covered by Tables 3 through 5.
Estimates in the restricted sample show larger program effects on earnings than the
estimates computed using the full sample. Specifically, earnings gains are estimated to have been
370 for second year men and 245 for all second years, both significant at the 5 percent level. On
the other hand, neither GPA nor grade effects are significantly different from zero. The apparent
difference in findings for grades and earnings is explained by the last two rows of Table 6, which
reports estimates for the components of the award formula in the restricted sample. These
estimates show reasonably clear effects on the number of courses above 70 with weaker effects
on points earned above. The shift in grades around the 70 percent threshold was apparently
inadequate to boost overall GPA by a statistically significant amount.
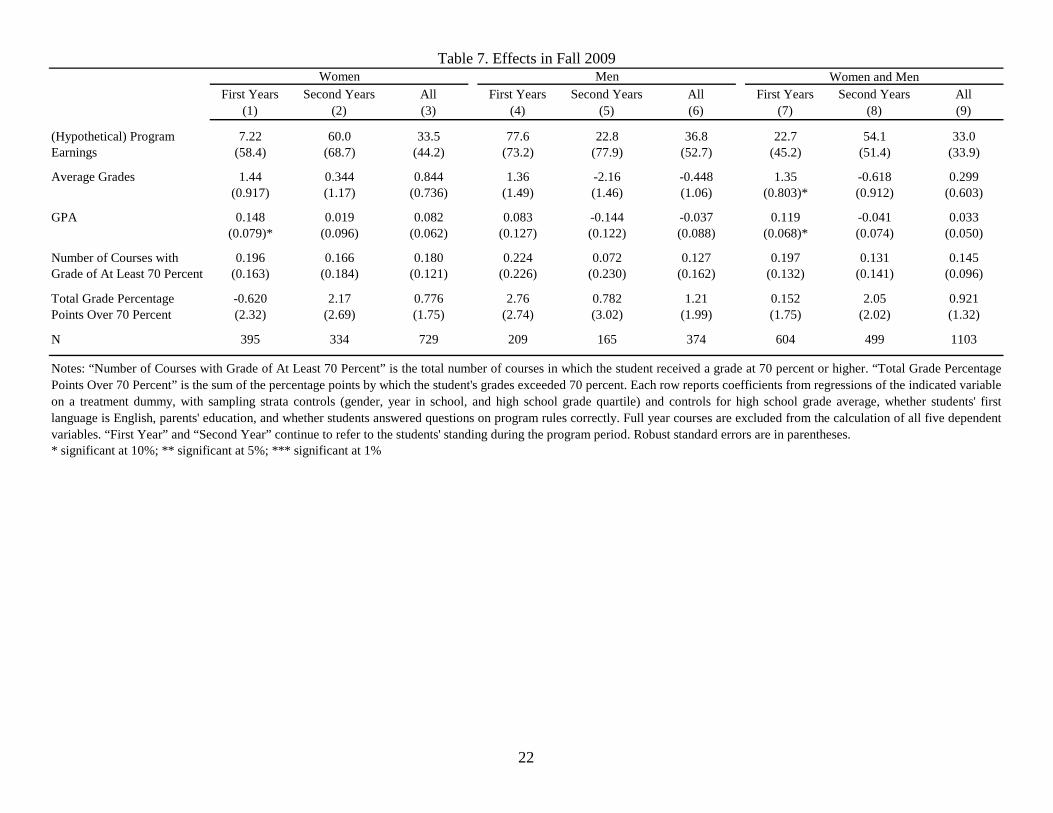
Given the modest program effects observed during the treatment period, it seems unlikely
that OK boosted achievement substantially in the longer-run. This conjecture is confirmed in
Table 7, which reports full-sample treatment effects for fall 2009 (the semester after the program
ended). The results in Table 7 show marginally significant positive effects on average grades and
GPA for first year women and in the pooled sample of first years (who are second years in the
post-treatment period), but these effects are small. The post-program outcomes also offer a
specification test for the analysis above, since we would not expect to see threshold effects

10
around 70 percent in the post-program period. There is no evidence of a treatment effect on the
number of fall 2009 courses graded at or above 70 percent.7
B. Additional Results
We might expect OK incentives to be more powerful for financially constrained students.
But treatment effects come out similar in subgroups defined by expected financial aid and
whether students expressed concerns about funding. Effects are somewhat larger in the
subsample of students whose parents had not been to college than among those with college-
educated parents, but the gap by parents’ schooling is not large or precisely estimated.
The effects of program assignment reported in Tables 3 to 7 are diluted by non-
compliance, that is, by the fact that some of those assigned to treatment did not really participate
in the program. It’s therefore worth estimating the effect of treatment on participants. The
decision to engage with the program is not randomly assigned; this is a choice made by those
offered the opportunity to participate. However, we can use the randomly assigned offer of OK
treatment as an instrument for program take-up. By virtue of random assignment the OK offer is
unrelated to characteristics of eligible students. The OK offer is also highly correlated with
participation status: As shown in Table 2, 86 percent of those offered OK were engaged in some
way, while no one in the control group had access to OK awards or services. The overall first
stage effect of OK offers on participation is therefore around 0.86. Moreover, because no one in
the control group participated, 2SLS estimates in this case capture the effect of participation on
program participants, as described in Angrist and Pischke (2009, Section 4.4.3). Effects on
program participants are of interest because they give a kind of theoretical upper bound on
program effects for this particular intervention. These estimates tell us how much achievement
was boosted for those who responded to incentives in some measurable way.
The first stage effect of OK offers on participation rates is between 0.84 and 0.9 in the
full sample and between 0.86 and 0.92 in the subsample that appears to have understood OK
program rules. The first-stage estimates appear in the first row of each panel in Table 8, which
also reports 2SLS estimates of the effect of participation on participants. Adjusting reduced-form
offer effects (i.e., the estimates of program effects reported in Tables 3-6) for non-compliance
7 Roughly 100 program participants dropped out between the first and second years. Dropout rates were similar in
the treatment and control groups.

11
necessarily leads to somewhat larger treatment effects, in this case larger by about 10-20 percent.
The most impressive effects in Table 8 are for the number of courses in which students
earned a grade above 70. Here, effects on second years in the full sample are on the order of two-
thirds of a course, while the gains among those who understood the program well amount to
almost a full course (an estimate of 0.91 with a standard error of 0.33, reported at the bottom of
column 8). The last column of Table 8 shows a marginally significant effect on the number of
courses in which students earned at least 70 among all students who understood the program well
(i.e., pooling men and women, and first and second years). The effect for all men is also
significant at the 5 percent level in this sample, with a marginally significant impact on second-
year women. A robust and substantial impact on hypothetical earnings and points above 70 also
emerges from the 2SLS estimates in Panel B. At the same time, neither the earnings effects nor
the increase in the number of courses graded above 70 translated into higher overall average
grades among participants.
V. Student Impressions
The OK sign-up survey asked students to predict their average grades in two scenarios,
one as an OK participant and one as a non-participant. To encourage a thoughtful response to this
question, we offered those who answered the opportunity to win a $500 prize to be given to the
student whose predictions came closest to the mark. About 60 percent predicted the same grade
either way and the average predicted effect on grades was about 2.2 points. This is considerably
larger than most of the effects reported in Tables 6 and 8. It also seems noteworthy that those
who predicted a positive response do not appear to have responded more strongly than those who
predicted no effect.
After the program ended, we asked students who predicted no effect in the intake survey
why they had expected this. Of the 226 emails sent to treated participants predicting no effect,
only 34 responded. Most of these respondents said they were planning to do as well as possible
either way. For example, one said: “Before starting courses, I had already decided that I would
do my best. And so, I felt a scholarship would be an added motivation, but fundamentally it came
down to my own ability and commitment.” Two thought the award was too remote, commenting:
“I predicted the program would have no effect because it provides a long-term reward for regular
short-term behavior (daily intense studying).” Only 3 respondents said the incentives were too

12
small. One said OK was “not too catchy and/or something worth dying for.” Another mentioned
the 70 percent threshold: “I believe the cash reward for each course was not high enough per
percentage point above 70 percent. If the cash reward was perhaps 30 or 40 dollars per percent
point above 70 percent, I would've worked even harder.”
We also surveyed a random sample of 50 students from the treatment group at the end of
the school year (May 13, 2009), offering $25 movie gift certificates to those who responded.
Among the 30 respondents to this survey, 27 said the scholarships motivated them. Some thought
the program was very effective. For example, one respondent commented: “Every time I began
to lose interest in a particular course, I would remind myself that I just need to well . . . keep with
it; the rewards will be tremendous. A scholarship is one such reward . . . and it sure is helpful, as
it lifts a lot of the financial burdens I’m faced with when it comes to paying tuition & other fees.”
Others saw the program was somewhat effective, as in this comment: “This scholarship did
affect my motivation to study at some point . . .” Respondents often cited concerns about tuition
and fees as a motivating factor that boosted their interest in OK.
Half of the post-program treated respondents felt the program led them to study more,
though some felt their opportunity for more study time was limited. This comment was typical:
“The program made me study more, but not much. I usually follow my schedule between work
and school. So the amount of time I could have spent on study is somehow limited.” Others felt
the program helped them focus on schoolwork: “As someone who gets sidetracked easily, I kept
it in mind that staying focused would pay off in more than one way, and so yes, it did affect the
amount of time I devoted to studying”. Another said, “I think what’s great about the program is
that when you feel like you’re beginning to procrastinate, you think about the outcome of this
program and want to get back to studying.” On the other hand, one second year student reporting
feeling somewhat demoralized by OK: “I did abnormally poor this year compared to my usual
standards and it just so happened to coincide with Opportunity Knocks. The money reminder just
kind of made me feel ‘worse’ about myself.”
Among those who responded to the post-program follow-up survey, almost all felt the
program improved their academic performance. Some appreciated the opportunity to earn
scholarships for good but not necessarily outstanding grades: “Personally, I don’t find that [the
university] offers as many scholarship opportunities as other [universities], so I think it was
rewarding to know that my academic performance was acknowledged and rewarded.” Some felt

13
they increased performance out of financial concerns: “[E]specially now with the economic
downfall, it is extremely difficult to muster up the finances to help pay for tuition without relying
on OSAP [financial aid]. I kind of looked at Opportunity Knocks as my employer who gives me
more money the better I performed in my studies.” One student volunteered the view that the
program would have a long-lasting effect on him/her: “The program had significantly improved
my grades! And I cannot wait to see what I can accomplish next year.”
Everyone we contacted afterwards reported that they received peer advisor e-mails about
once or twice a month. All but one of the respondents said the advisor e-mails were helpful. One
noted, “I think the advisor made good decisions between sending us important reminders and
information without being redundant. It was especially important to receive the e-mails about the
scholarship money quickly after marks were sent in.” Another said, “I find it very useful that
someone was actually helping me through school.” All but one respondent felt the program was
worth continuing. Virtually everyone seemed grateful for having being selected for OK. One
respondent closed with this endorsement:
The OK Program has been an essential part of my student experience, and in many ways crucial to my academic performance. I think that having a peer advisor as opposed to just the regular counselors working in the University is very important. With all the stress that universities cause their students – financially or otherwise, it's really nice to know there is a program like Opportunity Knocks to help students every step of the way.
Overall, this feedback leaves us feeling that most treated students were aware of and engaged
with OK, and that a large minority expected some benefit. Others who thought the program
would have little effect seem to feel this way because they were already anxious to succeed and
willing to devote time to their studies.
VI. Summary and Conclusions
The OK program was popular with participants: sign-up rates and program engagement
were high, and in follow-up focus group interviews many program participants were enthusiastic
about the experience. At the same time, overall program effects on achievement were modest.
Treated second-year students earned more in OK scholarship money than we would have
expected based on the control-group grade distribution, increased the number of courses in which
they earned a grade of 70, and gained a few grade points above 70. This localized response to the

14
large program incentive to earn a grade of 70 percent did not translate into a substantial boost in
overall achievement, but it was noticeably stronger in the subsample of students who appear to
have understood the award scheme well.
The past decade has seen a growing number of randomized evaluations of pay-for-
performance schemes for students at various levels. Table 9 summarizes studies using
randomized designs to look at financial incentives in college.8 A number of these studies show
effects on credits earned in response to incentives for course completion and grade thresholds
(Barrow et al., 2010, Cha and Patel, 2010, and MacDonald et al., 2009). These results, along
with the findings in Angrist et al. (2009) and those reported here, suggest that students react to
threshold targets more strongly than to marginal incentives beyond the initial target. Incentives
also seem to be more effective when combined with academic support services. Overall,
however, the picture that emerges from the research summarized in Table 9 is one of mostly
modest effects. In particular, overall GPA seems largely unaffected except in some subgroups,
and Angrist et al. (2009) is the only randomized evaluation to date to find college achievement
effects persisting into the post-treatment period. It’s also worth noting that the OK demonstration
failed to replicate the strong positive results for women seen in the earlier experiment.
One explanation for the muted effectiveness of merit scholarships may be that poor
performing students have trouble developing effective study strategies. For example, Israeli high
school students have easy access to test-focused remedial study sessions in public school, a fact
that may explain some of the stronger Angrist and Lavy (2009) results on achievement awards
for high school girls. Fryer (2010) similarly argues that incentives for learning (in his case,
reading books) look more promising than pay for performance on achievement tests. These
intriguing results come from elementary and secondary school settings. Investigation of the
merits of as-yet-untried recipes combining learning incentives with academic support schemes
seems a worthy priority for future research on college achievement.
8 The studies listed in this table use random assignment to evaluate financial incentives for college students. This
list is the result of a citation search (that is, citing studies we were previously aware of) and a keyword search (for “experiment, incentives, college”) using Google Scholar.

15
Control Mean
(1)
Treatment Difference
(2)
ControlMean
(3)
Treatment Difference
(4)
ControlMean
(5)
Treatment Difference
(6)
ControlMean
(7)
Treatment Difference
(8)
ControlMean
(9)
Treatment Difference
(10)
Age 18.2 -0.105 19.2 0.011 18.4 0.014 19.2 0.069 18.7 -0.012[0.608] (0.056)* [0.514] (0.056) [0.815] (0.104) [0.460] (0.070) [0.757] (0.036)
High school 82.8 0.145 82.4 0.302 82.3 -0.344 82.1 -0.387 82.5 -0.024grade average [6.56] (0.238) [6.19] (0.217) [6.44] (0.310) [6.73] (0.338) [6.44] (0.134)
1st language 0.404 0.057 0.426 -0.046 0.479 -0.060 0.333 0.097 0.416 0.009is English [0.491] (0.056) [0.495] (0.057) [0.501] (0.065) [0.474] (0.069) [0.493] (0.031)
Mother a college 0.395 0.065 0.477 -0.016 0.479 0.050 0.424 -0.034 0.439 0.020graduate [0.490] (0.056) [0.500] (0.058) [0.501] (0.065) [0.497] (0.070) [0.496] (0.031)
Father a college 0.479 0.051 0.581 0.009 0.603 0.047 0.475 0.105 0.532 0.049graduate [0.500] (0.057) [0.494] (0.058) [0.491] (0.063) [0.502] (0.071) [0.499] (0.031)
Correctly answered harder 0.616 0.022 0.690 -0.010 0.719 -0.080 0.697 0.002 0.666 -0.014question on scholarship formula [0.487] (0.053) [0.464] (0.054) [0.451] (0.061) [0.462] (0.065) [0.472] (0.029)
Controls who would have earned 0.883 0.968 0.908 0.978 0.923some scholarship money [0.322] [0.177] [0.289] [0.148] [0.266]
Hypothetical earnings 1,240 1,390 1,430 1,400 1,330for controls [1,220] [1,090] [1,230] [1,270] [1,190]
Observations
F test for joint significance
* significant at 10%; ** significant at 5%; *** significant at 1%
Table 1. Descriptive Statistics and Covariate Balance by Gender and YearWomen Men
Whole SampleFirst Years Second Years First Years Second Years
1271
1.11 0.453 0.858 1.43 0.515
449 377 246 199
{0.797}
Notes: “Control Mean” columns report averages and standard deviations for variables in the left-most column, within the relevant gender-year subgroup. "TreatmentDifference" columns report coefficients from regressions of each variable in the left-most column on a treatment dummy, with sampling strata controls (gender, year inschool, and high school grade quartile). The last row presents within-column F tests of joint significance of all the treatment differences. Standard deviations for thecontrol group are in square brackets, robust standard errors are in parentheses, and p values for F tests are in curly braces. Some respondents did not answer the parents'education questions. They are coded as a separate category (“missing”) and therefore are not coded as high school or college graduates.
{0.355} {0.843} {0.525} {0.198}

16
Contact TypeFirst Years
(1)Second Years
(2)All(3)
First Years(4)
Second Years(5)
All(6)
First Years(7)
Second Years(8)
All(9)
Emailed advisor (Fall) 0.450 0.390 0.420 0.410 0.270 0.340 0.430 0.330 0.380
Emailed advisor (Spring) 0.520 0.440 0.480 0.660 0.380 0.520 0.590 0.410 0.500
Emailed advisor (Fall and Spring) 0.790 0.700 0.745 0.750 0.560 0.655 0.770 0.630 0.700
Checked scholarship earnings online 0.760 0.780 0.770 0.650 0.710 0.680 0.705 0.745 0.725
Emailed the program website 0.270 0.320 0.295 0.250 0.300 0.275 0.260 0.310 0.285
Any contact 0.900 0.870 0.885 0.840 0.840 0.840 0.870 0.855 0.863
Observations 100 100 200 100 100 200 200 200 400
Notes: This table shows the proportion making the indicated form of program-related contact.
Table 2. Fraction of Treated Students Making Program-Related Contact by Gender and YearWomen Men Women and Men

17
First Years(1)
Second Years(2)
All(3)
First Years(4)
Second Years(5)
All(6)
First Years(7)
Second Years(8)
All(9)
Control Mean 645 695 667 770 744 760 682 707 693[657] [589] [628] [670] [642] [658] [663] [602] [637]
Treatment Effect -18.8 99.7 39.9 33.9 49.2 11.9 -5.73 72.0 28.0(53.1) (60.9) (39.9) (69.8) (73.1) (51.3) (41.9) (45.9) (31.1)
N 444 374 818 246 195 441 690 569 1259
Control Mean 589 711 640 644 655 649 605 696 642[608] [598] [606] [600] [683] [633] [606] [622] [614]
Treatment Effect -57.6 24.7 -19.1 -20.0 170 35.5 -52.5 77.3 4.47(49.4) (66.4) (39.6) (59.5) (80.7)** (49.4) (37.6) (51.0) (30.8)
N 441 340 781 242 183 425 683 523 1206
Control Mean 1,240 1,390 1,300 1,430 1,400 1,420 1,290 1,390 1,330[1,220] [1,090] [1,170] [1,230] [1,270] [1,240] [1,230] [1,140] [1,190]
Treatment Effect -80.2 165 33.0 7.01 255 54.8 -64.3 180 41.1(95.3) (121) (74.1) (121) (144)* (95.2) (74.3) (91.3)** (58.2)
N 441 339 780 242 181 423 683 520 1203
* significant at 10%; ** significant at 5%; *** significant at 1%
Panel A. Fall
Panel B. Spring
Panel C. Full Year
Notes: “Control Mean” rows list averages and standard deviations of program earnings, within the relevant gender-year subgroup. “Treatment Effect” rows report coefficientsfrom regressions of program earnings on a treatment dummy, with sampling strata controls (gender, year in school, and high school grade quartile) and controls for highschool grade average, whether students' first language is English, parents' education, and whether students answered questions on program rules correctly. Control earningsare hypothetical; treated earnings are actual. Full year courses are double-weighted in the earnings calculation. The sample used for the full year estimates includes studentswith grades in fall and spring. The fall analysis omits full year courses. If we restrict the fall and spring samples to be the same as the full year sample, then the effects for thefull year are the sum of the fall and spring effects (this is also true in later tables). Robust standard errors are in parentheses; standard deviations are in square brackets.
Table 3. Effects on (Hypothetical) Program EarningsWomen Men Women and Men

18
First Years(1)
Second Years(2)
All(3)
First Years(4)
Second Years(5)
All(6)
First Years(7)
Second Years(8)
All(9)
Control Mean 68.1 71.0 69.4 70.7 72.4 71.4 68.9 71.4 70.0[11.6] [8.40] [10.4] [10.9] [8.39] [10.0] [11.4] [8.41] [10.3]
Treatment Effect 0.424 0.420 0.461 0.452 -0.520 -0.496 0.236 0.064 0.076(0.945) (0.947) (0.662) (1.18) (1.07) (0.827) (0.740) (0.694) (0.515)
N 444 374 818 246 195 441 690 569 1259
Control Mean 67.4 71.2 68.9 68.8 70.0 69.3 67.8 70.8 69.0[11.3] [9.02] [10.5] [11.2] [10.6] [10.9] [11.2] [9.46] [10.6]
Treatment Effect -0.814 -0.118 -0.471 -0.971 2.54 0.106 -0.966 0.727 -0.225(1.16) (1.13) (0.801) (1.56) (1.41)* (1.03) (0.901) (0.901) (0.634)
N 441 340 781 242 183 425 683 523 1206
Control Mean 67.9 71.1 69.2 69.9 71.5 70.5 68.4 71.2 69.6[10.7] [7.77] [9.69] [10.3] [8.59] [9.70] [10.6] [7.99] [9.70]
Treatment Effect -0.323 0.470 0.076 -0.233 1.17 -0.146 -0.458 0.614 -0.025(0.958) (0.932) (0.662) (1.21) (1.09) (0.840) (0.745) (0.719) (0.522)
N 441 339 780 242 181 423 683 520 1203
* significant at 10%; ** significant at 5%; *** significant at 1%
Panel A. Fall
Panel B. Spring
Panel C. Full Year
Notes: “Control Mean” rows list averages and standard deviations of average grades, within the relevant gender-year subgroup. “Treatment Effect” rows report coefficientsfrom regressions of average grades on a treatment dummy, with sampling strata controls (year in school, and high school grade quartile) and controls for high school gradeaverage, whether students' first language is English, parents' education, and whether students answered questions on program rules correctly. Average grades are on a 100point scale. Full year courses are double-weighted in the average grade calculation. The sample used for the full year estimates includes students with grades in fall andspring. The fall analysis omits full year courses. Robust standard errors are in parentheses; standard deviations are in square brackets.
Table 4a. Effects on Average GradesWomen Men Women and Men

19
First Years(1)
Second Years(2)
All(3)
First Years(4)
Second Years(5)
All(6)
First Years(7)
Second Years(8)
All(9)
Control Mean 2.39 2.64 2.50 2.61 2.75 2.66 2.46 2.67 2.55[0.982] [0.765] [0.900] [0.920] [0.743] [0.856] [0.968] [0.760] [0.890]
Treatment Effect 0.021 0.046 0.038 0.046 -0.039 -0.034 0.014 0.015 0.009(0.079) (0.081) (0.056) (0.103) (0.098) (0.073) (0.063) (0.061) (0.044)
N 444 374 818 246 195 441 690 569 1259
Control Mean 2.34 2.64 2.47 2.47 2.54 2.50 2.38 2.61 2.48[0.916] [0.783] [0.875] [0.935] [0.880] [0.912] [0.922] [0.810] [0.885]
Treatment Effect -0.049 0.018 -0.016 -0.003 0.266 0.071 -0.037 0.102 0.022(0.081) (0.090) (0.059) (0.106) (0.119)** (0.079) (0.064) (0.073) (0.048)
N 441 340 781 242 183 425 683 523 1206
Control Mean 2.37 2.64 2.49 2.55 2.67 2.59 2.42 2.65 2.52[0.895] [0.689] [0.825] [0.870] [0.739] [0.822] [0.890] [0.702] [0.825]
Treatment Effect -0.021 0.055 0.018 0.019 0.126 0.021 -0.019 0.075 0.019(0.073) (0.079) (0.053) (0.096) (0.097) (0.070) (0.058) (0.061) (0.042)
N 441 339 780 242 181 423 683 520 1203
* significant at 10%; ** significant at 5%; *** significant at 1%
Panel A. Fall
Panel B. Spring
Panel C. Full Year
Notes: “Control Mean” rows list averages and standard deviations of GPA, within the relevant gender-year subgroup. “Treatment Effect” rows report coefficients fromregressions of GPA on a treatment dummy, with sampling strata controls (year in school, and high school grade quartile) and controls for high school grade average, whetherstudents' first language is English, parents' education, and whether students answered questions on program rules correctly. GPA is on a four point scale. The sample used forthe full year estimates includes students with grades in fall and spring. The fall analysis omits full year courses. Robust standard errors are in parentheses; standard deviationsare in square brackets.
Table 4b. Effects on GPAWomen Men Women and Men

20
First Years(1)
Second Years(2)
All(3)
First Years(4)
Second Years(5)
All(6)
First Years(7)
Second Years(8)
All(9)
Control Mean 4.58 5.22 4.85 5.18 5.01 5.11 4.75 5.16 4.92[3.35] [2.84] [3.16] [3.17] [2.96] [3.08] [3.30] [2.87] [3.14]
Treatment Effect -0.034 0.422 0.185 0.128 0.954 0.338 -0.010 0.572 0.239(0.260) (0.335) (0.205) (0.356) (0.405)** (0.268) (0.208) (0.252)** (0.161)
N 441 339 780 242 181 423 683 520 1203
Control Mean 38.9 43.3 40.8 45.5 45.0 45.3 40.9 43.8 42.1[46.2] [42.1] [44.5] [47.4] [50.4] [48.5] [46.6] [44.4] [45.7]
Treatment Effect -3.84 6.16 0.726 -0.290 7.98 1.05 -3.17 6.15 0.861(3.76) (4.64) (2.88) (4.57) (5.49) (3.62) (2.87) (3.52)* (2.25)
N 441 339 780 242 181 423 683 520 1203
* significant at 10%; ** significant at 5%; *** significant at 1%
Panel A. Number of Courses with Grade of At Least 70 Percent
Panel B. Total Grade Percentage Points Over 70 Percent
Notes: The dependent variable in Panel A is the total number of courses in which the student received a grade at 70 percent or higher over both semesters. In Panel B, thedependent variable is the sum of the percentage points by which the student's grades exceeded 70 percent. “Control Mean” rows list averages and standard deviations, withinthe relevant gender-year subgroup. “Treatment Effect” rows report coefficients from regressions on a treatment dummy, with sampling strata controls (gender, year in school,and high school grade quartile) and controls for high school grade average, whether students' first language is English, parents' education, and whether students answeredquestions on program rules correctly. Full year courses are double-weighted in the calculation of both dependent variables. The sample used to make this table includesstudents with grades in fall and spring. Robust standard errors are in parentheses; standard deviations are in square brackets.
Table 5. Effects on Components of the OK Scholarship FormulaWomen Men Women and Men

21
First Years(1)
Second Years(2)
All(3)
First Years(4)
Second Years(5)
All(6)
First Years(7)
Second Years(8)
All(9)
(Hypothetical) Program -218 219 -9.32 102 370 160 -80.4 245 63.7Earnings (130)* (155) (101) (144) (172)** (111) (97.2) (114)** (74.8)
Average Grades -1.23 0.999 -0.161 0.839 1.73 0.754 -0.351 1.03 0.219(1.10) (1.12) (0.779) (1.51) (1.31) (1.00) (0.913) (0.879) (0.634)
GPA -0.107 0.112 -0.002 0.123 0.167 0.103 -0.008 0.117 0.044(0.088) (0.095) (0.064) (0.118) (0.117) (0.083) (0.072) (0.074) (0.052)
Number of Courses with -0.339 0.715 0.165 0.429 1.19 0.637 -0.008 0.813 0.353Grade of At Least 70 Percent (0.333) (0.410)* (0.264) (0.431) (0.497)** (0.323)** (0.265) (0.309)*** (0.203)*
Total Grade Percentage -9.21 7.38 -1.29 2.97 12.6 4.82 -3.98 8.19 1.42Points Over 70 Percent (5.25)* (5.98) (3.96) (5.37) (6.49)* (4.19) (3.81) (4.37)* (2.91)
N 274 236 510 166 127 293 440 363 803
* significant at 10%; ** significant at 5%; *** significant at 1%
Notes: “Number of Courses with Grade of At Least 70 Percent” is the total number of courses in which the student received a grade at 70 percent or higher. “Total Grade PercentagePoints Over 70 Percent” is the sum of the percentage points by which the student's grades exceeded 70 percent. Each row reports coefficients from regressions of the indicated variableon a treatment dummy, with sampling strata controls (gender, year in school, and high school grade quartile) and controls for high school grade average, whether students' firstlanguage is English, parents' education, and whether students answered questions on program rules correctly. Full year courses are double-weighted in the calculation of the dependentvariables. The sample used to make this table includes students with grades in fall and spring. Robust standard errors are in parentheses.
Table 6. Full Year Effects (Students Who Calculated Awards Correctly)Women Men Women and Men
22
First Years(1)
Second Years(2)
All(3)
First Years(4)
Second Years(5)
All(6)
First Years(7)
Second Years(8)
All(9)
(Hypothetical) Program 7.22 60.0 33.5 77.6 22.8 36.8 22.7 54.1 33.0Earnings (58.4) (68.7) (44.2) (73.2) (77.9) (52.7) (45.2) (51.4) (33.9)
Average Grades 1.44 0.344 0.844 1.36 -2.16 -0.448 1.35 -0.618 0.299(0.917) (1.17) (0.736) (1.49) (1.46) (1.06) (0.803)* (0.912) (0.603)
GPA 0.148 0.019 0.082 0.083 -0.144 -0.037 0.119 -0.041 0.033(0.079)* (0.096) (0.062) (0.127) (0.122) (0.088) (0.068)* (0.074) (0.050)
Number of Courses with 0.196 0.166 0.180 0.224 0.072 0.127 0.197 0.131 0.145Grade of At Least 70 Percent (0.163) (0.184) (0.121) (0.226) (0.230) (0.162) (0.132) (0.141) (0.096)
Total Grade Percentage -0.620 2.17 0.776 2.76 0.782 1.21 0.152 2.05 0.921Points Over 70 Percent (2.32) (2.69) (1.75) (2.74) (3.02) (1.99) (1.75) (2.02) (1.32)
N 395 334 729 209 165 374 604 499 1103
* significant at 10%; ** significant at 5%; *** significant at 1%
Notes: “Number of Courses with Grade of At Least 70 Percent” is the total number of courses in which the student received a grade at 70 percent or higher. “Total Grade PercentagePoints Over 70 Percent” is the sum of the percentage points by which the student's grades exceeded 70 percent. Each row reports coefficients from regressions of the indicated variableon a treatment dummy, with sampling strata controls (gender, year in school, and high school grade quartile) and controls for high school grade average, whether students' firstlanguage is English, parents' education, and whether students answered questions on program rules correctly. Full year courses are excluded from the calculation of all five dependentvariables. “First Year” and “Second Year” continue to refer to the students' standing during the program period. Robust standard errors are in parentheses.
Table 7. Effects in Fall 2009Women Men Women and Men

23
First Years(1)
Second Years(2)
All(3)
First Years(4)
Second Years(5)
All(6)
First Years(7)
Second Years(8)
All(9)
First Stage (Any Contact) 0.901 0.891 0.897 0.844 0.874 0.858 0.876 0.882 0.878(0.029)*** (0.032)*** (0.022)*** (0.037)*** (0.035)*** (0.025)*** (0.023)*** (0.024)*** (0.017)***
Second Stages:(Hypothetical) Program -89.0 186 36.8 8.31 292 63.9 -73.4 204 46.8 Earnings (104) (131) (81.3) (139) (156)* (108) (83.6) (101)** (65.4)
Average Grades -0.359 0.527 0.084 -0.276 1.34 -0.171 -0.523 0.696 -0.029(1.05) (1.02) (0.727) (1.38) (1.18) (0.956) (0.840) (0.795) (0.587)
GPA -0.023 0.062 0.020 0.023 0.144 0.024 -0.022 0.084 0.021(0.079) (0.086) (0.058) (0.110) (0.105) (0.080) (0.065) (0.068) (0.047)
Number of Courses with -0.037 0.473 0.206 0.152 1.09 0.394 -0.011 0.648 0.272Grade of At Least 70 Percent (0.283) (0.362) (0.225) (0.407) (0.437)** (0.304) (0.234) (0.277)** (0.180)
Total Grade Percentage -4.27 6.92 0.809 -0.344 9.14 1.22 -3.62 6.97 0.981Points Over 70 Percent (4.11) (5.05) (3.16) (5.23) (5.96) (4.12) (3.24) (3.89)* (2.53)
N 441 339 780 242 181 423 683 520 1203
First Stage (Any Contact) 0.922 0.907 0.915 0.863 0.900 0.875 0.896 0.895 0.895(0.033)*** (0.035)*** (0.024)*** (0.043)*** (0.037)*** (0.030)*** (0.027)*** (0.028)*** (0.019)***
Second Stages:(Hypothetical) Program -237 241 -10.2 119 411 183 -89.8 274 71.2 Earnings (139)* (164) (108) (158) (178)** (123) (106) (123)** (82.0)
Average Grades -1.34 1.10 -0.176 0.972 1.92 0.862 -0.392 1.15 0.245(1.16) (1.19) (0.835) (1.66) (1.35) (1.10) (0.997) (0.950) (0.696)
GPA -0.116 0.123 -0.002 0.143 0.186 0.117 -0.008 0.130 0.049(0.094) (0.101) (0.069) (0.129) (0.120) (0.091) (0.079) (0.080) (0.057)
Number of Courses with -0.368 0.788 0.181 0.497 1.32 0.729 -0.009 0.908 0.394Grade of At Least 70 Percent (0.353) (0.432)* (0.282) (0.475) (0.511)** (0.356)** (0.289) (0.332)*** (0.222)*
Total Grade Percentage -9.99 8.13 -1.41 3.45 14.0 5.51 -4.44 9.15 1.59Points Over 70 Percent (5.58)* (6.34) (4.25) (5.91) (6.71)** (4.62) (4.16) (4.73)* (3.19)
N 274 236 510 166 127 293 440 363 803
* significant at 10%; ** significant at 5%; *** significant at 1%
Notes: “First Stage (Any Contact)” rows report coefficients from a regression of a dummy variable equal to one if the student made any program-related contact (see Table 2) on atreatment dummy. “Second Stage” rows report coefficients from IV regressions, instrumenting for the program contact dummy with the treatment dummy. All regressions also includesampling strata controls (gender, year in school, and high school grade quartile) and controls for high school grade average, whether students' first language is English, parents'education, and whether students answered questions on program rules correctly. Full year courses are double-weighted in the calculation of second stage dependent variables. Thesample used to make this table includes students with grades in fall and spring. Standard errors are in parentheses.
Panel A. Full Sample
Panel B. Students Who Calculated Awards Correctly
Table 8. IV Estimates for ParticipantsWomen Men Women and Men

24
Study Sample Treatment Outcome All Men Women(1) (2) (3) (4) (5) (6) (7)
1. GPA 0.01 -0.110 0.086(0.066) (0.103) (0.084)[1.81] [1.908] 1.728
Credits earned -0.012 -0.157 0.084(0.064) (0.106) (0.082)[2.363] [2.45] [2.988]
Incentives and support services GPA 0.210 0.084 0.267(0.092)** (0.162) (0.117)**
1.805 1.908 1.728
Credits earned 0.092 -0.196 0.269(0.087) [.015] (0.108)**[2.363] [2.45] [2.988]
2. GPA -0.019 0.019 -0.021(0.058) (0.096) (0.073)[2.42] [2.55] [2.37]
Courses with grade of at least 70 percent -0.010 0.128 -0.034
(0.208) (0.356) (0.260)[4.75] [5.18] [4.58]
GPA 0.075 0.126 0.055(0.061) (0.097) (0.079)[2.65] [2.67] [2.64]
Courses with grade of at least 70 percent 0.572 0.954 0.422
(0.252)** (0.405)** (0.335)[5.16] [5.01] [5.22]
3. GPA 0.068(0.104)[2.171]
Credits earned 3.345(0.849)***
[7.623]
4. Credits attempted 0.5(0.8)
[19.5]
Credits earned 2.0(0.5)***[13.4]
5. Met first year requirement 0.033(0.055)[0.195]
Met first year requirement 0.055(0.058)[0.195]
6. First semester GPA (missing GPAs imputed) 0.08 0.12
p>0.1 p>0.1[2.11] [2.20]
Second semester GPA (missing GPAs imputed) 0.12 0.14
p<0.05** p<0.05**[1.88] [2.04]
Third semester GPA (missing GPAs imputed) 0.01 0.12
p>0.1 p<0.05**[2.01] [2.16]
Notes: The table reports main baseline sample outcomes for grades and credits earned during each program period. Standard errors are in parentheses. Control means are in square brackets.* significant at 10% level. ** significant at 5% level. *** significant at 1% level. See text for sources and more details.
$750 each of three semesters for 1) obtaining 2.0 GPA or higher, 2) eligible to continue in a full program the following semester, and 3) completing at least 12 hours of tutorial, case management, or career workshops
not reported
not reported
$1,000 for C+ to B- first year performance, $5,000 for B+ to A performance (varies by HS grade)
Over 2 semesters and for each semester-long course, $100 for attaining at least 70% and $20 for each percentage point higher than this (full course load = 10 semester courses)
For each of two semesters, $250 for at least half-time enrollment, $250 for C-average or better at end of midterms, and $500 for maintaining C-average, plus optional enhanced college counseling
Angrist, Oreopoulos, and Williams (2010) [Opportunity Knocks]
First year students on financial aid at Canadian commuter university in 2008-2009
First year students at Canadian commuter university in 2005-2006, except for top HS grade quartile
Second year students on financial aid at Canadian commuter university in 2008-2009
Low-income parents beginning community college in Lousiana between 2004 and 2005
Barrow et al. (2010) [Opening Doors Louisiana]
~$1,500 for completion of all first year requirements by start of new academic year
First year economics and business students at the University of Amsterdam in
MacDonald, Bernstein, and Price (2009) [Foundations for Success]
Table 9. Studies of College Achievement Awards
(sample is mostly female)
(sample is mostly female)
At-risk students beginning community college in Ontario, Canada, between 2007 and 2008
not reported
not reported
not reported
~$500 for completion of all first year requirements by start of new academic year
Leuven, Oosterbeek, and van der Klaauw (2005)
not reported
not reported
Effects
Cha and Patel (2010) [Ohio Performance-Based Scholarship Demonstration]
Low-income Ohio college students in 2008 with children and eligible for TANF
$1,800 for earning a grade of C or better in 12 or more credits, or $900 for a C or better in 6 to 11 credits, with payments at end of each semester
Angrist, Lang, and Oreopoulos (2009) [The Student Achievement and Retention Project]

25
Figure 1. Densities of Full Year (Hypothetical) Earnings
0.00000
0.00025
0.00050
0 1000 2000 3000 4000 5000
De
nsi
ty
Earnings (CAD)
First Year Women
KS test p-value: 0.348
0.00000
0.00025
0.00050
0 1000 2000 3000 4000 5000
De
nsi
ty
Earnings (CAD)
Second Year Women
KS test p-value: 0.131
0.00000
0.00025
0.00050
0 1000 2000 3000 4000 5000
De
nsi
ty
Earnings (CAD)
First Year Men
KS test p-value: 0.773
0.00000
0.00025
0.00050
0 1000 2000 3000 4000 5000
De
nsi
ty
Earnings (CAD)
Second Year Men
KS test p-value: 0.108
Treatment Control
Note: The figure plots the smoothed kernel densities of OK program earnings for the full year from fall 2008 through spring 2009. Control earnings are hypothetical; treated earnings are actual. Full-year courses are double-weighted in the earnings calculation. The sample used to make this figure includes students with grades in fall and spring.

26
Table 2. Full Year Effects on Number of Courses Over Grade Thresholds
0.02
0.03
0.04
0.05
0.06
-1
-0.5
0
0.5
1
1.5
60 65 70 75 80
Co
ntro
l den
sity
Co
urs
es
ove
r th
resh
old
Grade threshold
First Year Women
$100 cutoff
0.02
0.03
0.04
0.05
0.06
-1
-0.5
0
0.5
1
1.5
60 65 70 75 80
Co
ntro
l den
sity
Co
urs
es
ove
r th
resh
old
Grade threshold
Second Year Women
$100 cutoff
0.02
0.03
0.04
0.05
0.06
-1
-0.5
0
0.5
1
1.5
60 65 70 75 80
Co
ntro
l den
sity
Co
urs
es
ove
r th
resh
old
Grade threshold
First Year Men
$100 cutoff0.02
0.03
0.04
0.05
0.06
-1
-0.5
0
0.5
1
1.5
60 65 70 75 80
Co
ntro
l den
sity
Co
urs
es
ove
r th
resh
old
Grade threshold
Second Year Men
$100 cutoff
Treatment Effects 95 Percent Confidence Interval Control Grade Distribution
Note: The figure shows treatment effects on the number of courses in which students earned a grade at or above a given threshold, where the thresholds are plotted on the x-axis. Control densities are kernel density plots of grades at the course level using a normal kernel, taking only grades between 60 and 80 percent (inclusive). Treatment effects were estimated using the same models as for Table 3.

27
References Angrist, Joshua, Eric Bettinger, Erik Bloom, Elizabeth King, and Michael Kremer. 2002. “Vouchers for Private Schooling in Columbia: Evidence from a Randomized Natural Experiment.” American Economic Review, 92: 1535-1558. Angrist, Joshua, Daniel Lang, and Philip Oreopoulos. 2009. “Incentives and Services for College Achievement: Evidence from a Randomized Trial.” American Economic Journal: Applied Economics, 1(1): 136-63. Angrist, Joshua D., and Victor Lavy. 2009. “The Effect of High School Matriculation Awards: Evidence from a Randomized Trial.” American Economic Review, 99(4): 1384-1414. Angrist, Joshua D., and Jörn-Steffen Pischke. 2009. Mostly Harmless Econometrics. Princeton, NJ: Princeton University Press. Ashenfelter, Orley, and Mark W. Plant. 1990. “Nonparametric Estimates of the Labor-Supply Effects of Negative Income Tax Programs.” Journal of Labor Economics, 8(1, Part 2: Essays in Honor of Albert Rees): S396-S415. Barrow, Lisa, Lashawn Richburg-Hayes, Cecilia Elena Rouse, and Thomas Brock. 2010. “Paying for Perfomance: The Educational Impacts of a Community College Scholarship Program for Low-Income Adults. Federal Reserve Bank of Chicago Working Paper No. 2009-13. Bettinger, Eric P. 2008. “Paying to Learn: The Effect of Financial Incentives on Elementary School Test Scores.” Program on Education Policy and Governance Working Paper 08-03. Bettinger, Eric P., and Bridget Terry Long. 2009. “Addressing the Needs of Under-Prepared Students in Higher Education: Does College Remediation Work?” Journal of Human Resources, 44(3): 736-771. Cha, Paulette, and Reshma Patel. 2010. “Rewarding Progress, Reducing Debt Early Results from Ohio’s Performance-Based Scholarship Demonstration for Low-Income Parents.” MDRC report, 2010. Deardon, Lorraine, Carl Emmerson, Christine Frayne, and Costas Meghir. 2009. “Conditional Cash Transfers and School Dropout Rates.” Journal of Human Resources, 44(4): 827-857. Dee, Thomas. 2009. “Conditional Cash Penalties in Education: Evidence from the Learnfare Experiment.” NBER Working Paper No. 15126. Dynarski, Susan. 2004. “The New Merit Aid.” In College Choices: The Economics of Where to Go, When to Go, and How to Pay for It, edited by Caroline M. Hoxby, 63-100. Chicago: The University of Chicago Press. Fryer, Roland G., Jr. 2010. “Financial Incentives and Student Achievement: Evidence From Randomized Trials.” NBER Working Paper No. 15898. Garibaldi, Pietro, Francesco Giavazzi, Andrea Ichino, and Enrico Rettore. 2007. “College Cost and Time to Complete a Degree: Evidence from Tuition Discontinuities.” NBER Working Paper No. 12863. Grayson, J.P., and K. Grayson. 2003. “Research on Retention and Attrition,” Report to the Canada Millennium Scholarship Foundation. Henry, Gary T., and Ross Rubinstein. 2002. “Paying for Grades: Impact of Merit-Based Financial Aid on

28
Education Quality.” Journal of Policy Analysis and Management, 21: 93-109. Holmstrom, Bengt, and Paul Milgrom. 1987. “Aggregation and Linearity in the Provision of Intertemporal Incentives.” Econometrica, 55(2): 303-328. Kremer, Michael, Edward Miguel, and Rebecca Thornton. 2009. “Incentives to Learn.” The Review of Economics and Statistics, 91(3): 437-456. Leuven, Edwin, Hessel Oosterbeek, and Bas van der Klaauw. 2003. “The Effect of Financial Rewards on Students' Achievements: Evidence from a Randomized Experiment.” CEPR Discussion Paper No. 3921. MacDonald, Heather, Lawrence Bernstein, and Cristofer Price. 2009. “Foundations for Success: Short-Term Impacts Report.” Report to the Canada Millennium Scholarship Foundation. National Center for Education Statistics. 2010. “The Condition of Education 2010.” Annual report of the National Center for Education Statistics. http://nces.ed.gov/pubsearch/pubsinfo.asp?pubid=2010028. Pallais, Amanda. 2009. “Taking a Chance on College: Is the Tennessee Education Lottery Scholarship Program a Winner?” The Journal of Human Resources, 44(1): 199-222. Rodriguez-Planas, Nuria. 2010. “Longer-Term Impacts of Mentoring, Educational Incentives, and Incentives to Learn: Evidence from a Randomized Trial.” IZA Discussion Paper No. 4754. Scrivener, Susan, Colleen Sommo, and Herbert Collado. 2009. “Getting Back on Track: Effects of a Community College Program for Probationary Students.” MDRC Report, April. Scrivener, Susan, and Michael J. Weiss. 2009. “More Guidance, Better Results? Three-Year Effects of an Enhanced Student Services Program at Two Community Colleges.” MDRC report, August. Sharma, Dhiraj. 2010. “Incentives for Academic Achievement: The Impacts on Exam Grades and Household Behavior of a Randomized Trial in Nepal.” Working Paper.