journal for nature conservation - de økonomiske råd · pdf filejournal for nature...
TRANSCRIPT

Cc
ACa
Cb
Fc
d
e
a
ARRA
KCCDBG
1
ieItth2
mlthpw
h1
Journal for Nature Conservation 29 (2016) 33–44
Contents lists available at ScienceDirect
Journal for Nature Conservation
j o ur nal homepage: www.elsev ier .de / jnc
onserving what, where and how? Cost-efficient measures toonserve biodiversity in Denmark
nders Højgård Petersen a, Niels Strange b,∗, Signe Anthon c, Thomas Bue Bjørner d,arsten Rahbek a,e
University of Copenhagen, Natural History Museum of Denmark, Center for Macroecology, Evolution and Climate, Universitetsparken 15, DK-2100openhagen Ø, DenmarkUniversity of Copenhagen, Department of Food and Resource Economics and Center for Macroecology, Evolution and Climate, Rolighedsvej 23, DK-1958rederiksberg C, DenmarkDanish Ministry of the Environment, Børsgade 4, DK-1215 Copenhagen K, DenmarkDanish Economic Councils, Amaliegade 44, DK-1256 Copenhagen K, DenmarkImperial College London, Silwood Park Campus, Ascot, Berkshire SL5 7PY, UK
r t i c l e i n f o
rticle history:eceived 26 June 2015eceived in revised form 22 October 2015ccepted 23 October 2015
a b s t r a c t
Biodiversity conservation efforts in Europe have traditionally focused on farmland and open nature areassuch as grasslands, heathlands and meadows, while little attention has been devoted to conservationactions in forest. Using detailed information on the geographical distribution of about 900 terrestrialspecies in Denmark we apply systematic conservation planning techniques to identify how to protect
eywords:ost-efficiencyonservation planningenmarkiodiversityap-analysis
biodiversity at the lowest cost to society. The results suggest that conservation actions in forest shouldbe given a higher priority. Thus, three to four times the number of forest species are protected per millionD compared with species living in open land natural areas. Furthermore, a gap analysis finds the currentdesignation of Natura 2000 and other protected areas is skewed toward open land natural areas, andinsufficient to meet the conservation targets on forest species.
© 2015 Elsevier GmbH. All rights reserved.
. Introduction
The rapid degradation and conversion of natural landscapess resulting in an unprecedented loss of biological diversity andcosystem services (Schipper et al., 2008; Butchart et al., 2010).nternationally, more than 175 countries are mandated, as signa-ories to the United Nation’s Convention on Biological Diversity,o prepare National Biodiversity Strategy and Action Plans. The EUas declared the intention to halt the decline of biodiversity before020 (European Commission, 2012).
There is a need to identify conservation strategies which opti-ally balance economic costs and ecological constraints. Different
and uses hold different conservation costs and conservation oppor-unities. For years, the European political emphasis has been on
ow to regulate farmers for halting the biodiversity decline. Onerominent example is the European Common Agricultural Policyhich since the early 1990s has supported agri-environmental∗ Corresponding author. Fax: +45 35331508.E-mail address: [email protected] (N. Strange).
ttp://dx.doi.org/10.1016/j.jnc.2015.10.004617-1381/© 2015 Elsevier GmbH. All rights reserved.
schemes and promoted conservation objectives (Davies, 2004). Thenational funding of biodiversity protection in Denmark reflects thatforests have not reached the same attention in the policy arena.If forest habitats hold a large share of the valuable biodiversity,lack of conservation support for forest areas may lead to loss ofbiodiversity and efficiency in the conservation policies.
The aim of this study is to explore this policy issue identifyingwhere and which conservation efforts are needed to cost-efficientlyprotect a sample of terrestrial species in Denmark. It is alsoinvestigated whether current Danish conservation efforts are cost-efficient by comparing them to the ‘optimal’ conservation effortsfound in the analysis.
The study applies a systematic conservation planning (SCP)approach to identify the most cost-efficient combination of geo-graphically distributed habitats to be protected in order to reacha given level of protection. SCP approaches can support the designof conservation priorities that are more effective than merely ad
hoc approaches (Margules & Pressey, 2000). This is interestingto academia, but spatial conservation prioritizations also appearto be increasingly adopted by practitioners (Groves et al., 2002;Morrison, Loucks, Long, & Wikramanayake, 2009) and the number
3 ature Conservation 29 (2016) 33–44
oiAlcneStgLoasaaEaASc(
setvaanazdwc
2
ccHms
2
DtstEuS
dPdPTtttc
Table 1Habitat types and habitat preferences of species in the analysesa.
Habitat type Area (km2) All species(number)
Threatenedspecies(number)
Total Obligatespecies
Total Obligatespecies
Forest 5000 503 186 81 39Open-land natural area 3900 650 272 139 95Farmland 30,700 240 1 15 0Urban areas 3100 177 6 17 1Total 43,000 899 465 186 135
a The majority of the species are found in forest and/or open land natural areas(888 of all 899 species), while the remaining 11 species are found only in farmland
4 A.H. Petersen et al. / Journal for N
f real-world applications, to both terrestrial and marine systems,s steadily increasing (Moilanen, Wilson, & Possingham, 2009).lthough the SCP approach is still developing to account for eco-
ogical, economic, social, and political uncertainty, it may allowonservation managers to move beyond ad hoc conservation plan-ing and increase the transparency in decision making (Langfordt al., 2011; Ban et al., 2013; Game, Kareiva, & Possingham, 2013).CP studies commonly include information on conservation costso address the cost-efficiency and feasibility of conservation strate-ies (Ando, Camm, Polasky, & Solow, 1998; Naidoo et al., 2006;ewis, Plantinga, Nelson, & Polasky, 2011) and reveal the trade-ffs between costs and provision of biodiversity services as wells other services. Still a challenge remains in managing the tran-ition from planning to applying conservation actions, taking intoccount both costs and benefits of future and presently protectedreas. A number of studies have applied SCP at the national andU scale to evaluate the effectiveness of conservation areas suchs, e.g., Natura 2000 (Maiorano, Falcucci, Garton, & Boitani, 2007;raujo, Alagador, Cabeza, Nogues-Bravo, & Thuiller, 2011; Jantke,chleupner, & Schneider, 2011). However, to our knowledge fewountry studies have analysed and discussed in which habitatsland uses) the conservation efforts are most cost-efficient.
The study adds to current literature by linking costs with con-ervation actions and estimating the cost-efficiency of conservationfforts in different habitats. Even though the analysis is limitedo a national case, the results and discussions are highly rele-ant for ongoing discussions of conservation efforts within the EUnd elsewhere. We use the most comprehensive data set avail-ble to estimate the minimum – and most cost-efficient – efforteeded to conserve Danish terrestrial biodiversity. In a systematicpproach based on the principles of spatial conservation prioriti-ation (Moilanen et al., 2009), we integrate information on speciesistribution, species habitat preferences, and current land use, asell as possible conservation actions and the associated social
osts. Furthermore, the current conservation effort is considered.
. Methods and data
In the presented scenarios we selected the most cost-efficientonservation network (species coverage compared to economicost) using the complementary species richness principle (Pressey,umphries, Margules, Vane-Wright, & Williams, 1993). Hereby thearginal contribution of a given site to the overall species repre-
entation in the conservation network is taken into account.
.1. Species data
We used distributional data for various species groups inenmark compiled for the 633 10 × 10-km UTM grid cells covering
he country. The data record the presence or absence of each of thepecies in each of the grid cells. The data set covers a total of 899errestrial and a few semi-aquatic species breeding in Denmark.1
arlier versions and subsets of this data set have been previouslysed for quantitative biodiversity analyses (Lund & Rahbek 2002;trange, Rahbek, Jepsen, & Lund, 2006a; Larsen et al., 2008, 2009,
1 These are 5 reptile species, 13 amphibians, 181 birds, 48 mammals, 41ragonflies (Odonata), 23 grasshoppers (Orthoptera), 60 true bugs (Heteroptera:entatomidea, Coreoidea, Pyrrhocoridea), 21 click beetles (Coleoptera: Elateri-ae), 248 hoverflies (Diptera: Syrphidae), 58 butterflies (Lepidoptera: Hesperioidea,apilionoidea), 154 large moths (Lepidoptera: Hepialoidea, Cossoidea, Zygaenoidea,ineoidea, Yponomentoidea, Bombycoidea, Geometroidea, Sphingoidea, Notodon-oidea, Noctuoidea), 6 club mosses (Lycopodiaceae) and 35 orchids. The data includehe majority of the Danish species within each group except for the click bee-les, which mainly include species associated with old forest. We excluded vagrant,asual and exotic species from the data set to avoid bias toward those species.
and/or urban areas (1 only in farmland, 6 only in urban areas and the remaining 4in both farmland and urban areas).
2012; Bladt, Strange, Abildtrup, Svenning, & Skov, 2009). The datarepresent the most complete species distribution data in Denmark.The dataset includes several insect groups, all breeding vertebratesand a few groups of vascular plants in DK. Unfortunately, nationalatlas data on the remaining vascular plants, were not available forthis study. The collection of national data on other important tax-onomic groups e.g., bryophytes, lichens, and fungi, is in progressbut found too incomplete for the current analysis. In order toenable separate analysis of threatened species protection, we cre-ated a subset of 186 (of the total 899 species) threatened speciescategorized as ‘Critically Endangered’ (CR), ‘Endangered’ (EN) and‘Vulnerable’ (VU) in the Danish Red Data Book (Wind & Pihl, 2004).
Each species was associated with each of four general habitattypes (forest, open land natural areas, farmland and urban areas)according to the habitat(s) in which they are most commonly found.Open land natural areas are defined as all non-forested habitatslike grassland, heathland, meadows, bogs, salt marches, and sanddunes. This also includes semi-natural grasslands, while farmlandis defined as intensively cultivated areas with associated small scalehabitats only. The information on habitat preference was based onexpert assessments compiled specifically for this study or takenfrom the Danish Red Data Book (Wind & Pihl, 2004). The data aresummarized in Table 1.
A distinction is made between obligate species, which are foundin only one of the four habitat types, and non-obligate species,which are found in more than one habitat type. Because of thelarge number of obligate species (458) in forest and open land,the minimum network required to cover these was identified in apreliminary analyses. It turned out that this network also “automat-ically” covers most of the non-obligate species and species found infarmland and/or urban areas. This means that no or only marginalgains (in terms of cost-efficiency) can be obtained by includingfarmland or urban areas in a general species conservation strategyin Denmark. Therefore, the analyses presented below focus onlyon forest and open land natural areas—and the 888 species foundin these two habitats. The 11 species that are found only in farm-land and/or urban areas are excluded and should be handled in aseparate strategy.
Even though the data set includes large numbers of both for-est and open land natural area species (Table 1) the data may besomewhat skewed toward open land natural area species. Table 2shows that 72% of our 899 species are found in open land nature ascompared to 54% of 8008 species assessed in the Danish Red DataBook, which is a much larger sample of the Danish species pool,estimated at 35,000–40,000 species (excluding microorganisms).However, this is expected to have a minor effect on the overall
results since the two habitats are analysed separately.The predominance of open habitat species in our data is alsoreflected in the species richness across the country, as illustrated

A.H. Petersen et al. / Journal for Nature Conservation 29 (2016) 33–44 35
Table 2Distribution of species among habitat preferences in the data set applied in the present analysis compared to data from the Danish Red Data Book (compilation based onWind and Pihl, 2004).
Proportion of all species (N) found in forest Proportion of all species (N) found inopen land natural areas
Total Obligate Total Obligate
Present data set (N = 899) 56% 21% 72% 30%DK Red Data Book (N = 8008) 64% 36% 54% 23%
F ture (Bf
in
2
bs2mIsI(aPaawte
aawm
ig. 1. Distribution of the species richness in Danmark in forest (A) and open land naarmland is not included in the analysis.
n Fig. 1, but the overall spatial patterns in forest and open landatural areas appear quite similar.
.2. Habitat and Natura 2000 data
The national distribution of the four general habitat types isased on available land cover and land use maps. The 2006 ver-ion of CORINE land cover map (European Environment Agency,007; Stjernholm, 2009) was used as starting point. However, theinimum mapping unit size of 25 ha excludes many smaller areas.
n order to construct a more complete map, two additional dataources are applied: (1) The land use map from the national “Areanformation System” (Danish Ministry of Environment, 2000) and2) the official registration of heathland, grassland, bogs, meadows,nd salt marches in accordance with Section 3 in the Danish Naturerotection Act. Forest and open land natural areas were compileds the sum of relevant habitats in all sources. The remaining landrea was classified as farmland or urban areas. Lakes above 0.25 haere excluded, but smaller lakes were retained as natural parts of
he surrounding habitats. Based on the final GIS-map, the area ofach habitat in each of the 633 grid cells was calculated.
To compare the resulting cost-efficient networks of areas with
reas currently protected, GIS-maps of Danish Natura 2000 sitesnd other protected areas (according to national regulations)ere obtained from the Danish Ministry of Environment (www.iljoeportal.dk). The Natura 2000 sites include Special Protected). Map based on 899 species included in the present analysis. Intensively cultivated
Areas (EC Birds Directive 1976) and Sites of Community Interest(EC Habitats Directive 1992).
2.3. Conservation actions and their cost
A number of specific threats and potential mitigating conser-vation actions were identified from national sources (The DanishBoard of Technology, 2008; Ejrnæs et al., 2011; Rahbek et al., 2012)and from discussions with Danish conservation experts. Subse-quently, the experts assessed which conservation actions wouldsignificantly improve of the survival probabilities of local popula-tions of threatened species within the next couple of decades.
The chosen conservation actions in forest include an immedi-ate stop of forest intervention and drainage in broadleaved forests,allowing for conversion of commercial production forests intounmanaged forests with natural hydrology. Unmanaged forests willincrease the continuity of the forest cover and gradually increasethe amount of dead wood, as well as variation and dynamics withrespect to tree species, age structure and density. Additionally,smaller adjacent areas of coniferous plantation forest are harvestedto provide open areas within the forest, in order to further increasethe habitat diversity. These areas are subsequently left for natu-ral succession and, if needed, future maintenance to prevent the
invasion by shrubs and trees.The actions in open land natural areas comprise three compo-nents: (1) Maintenance of existing natural areas, (2) increased area(expanding the current natural areas), and (3) reduction of nutri-

36 A.H. Petersen et al. / Journal for Nature Conservation 29 (2016) 33–44
F forestn minimc
eclitTlnboi
avc(atadc
csdafin
as the price of farmland, which reflects market’s expectations forfuture earnings of the agricultural production.2 We use land priceat municipality level, which reflects geographical variations in, e.g.,
ig. 2. Applied data and principles of the analysis. Data on species distribution inetworks based on the principle of complementarity. Areas are selected in order toonservation actions and the distribution (area) of the habitats.
nt pollution. Maintenance includes grazing, harvest of hay and/orlearing of scrub, to prevent invasion by shrubs and trees. Openand natural areas in Denmark are typically very fragmented, andncreasing the area is believed to benefit the survival of specieshrough increased ability to maintain viable (meta) populations.he third action includes 250 m buffer zones around each open
and natural area, in which livestock production facilities shouldo longer be permitted. This action reduces the deposition of air-orne nitrogen pollutants (ammonia), which is recognized as onef the major general threats to the biodiversity in open land nature
n Denmark (Ejrnæs et al., 2011).As a general rule the actions must be implemented in the entire
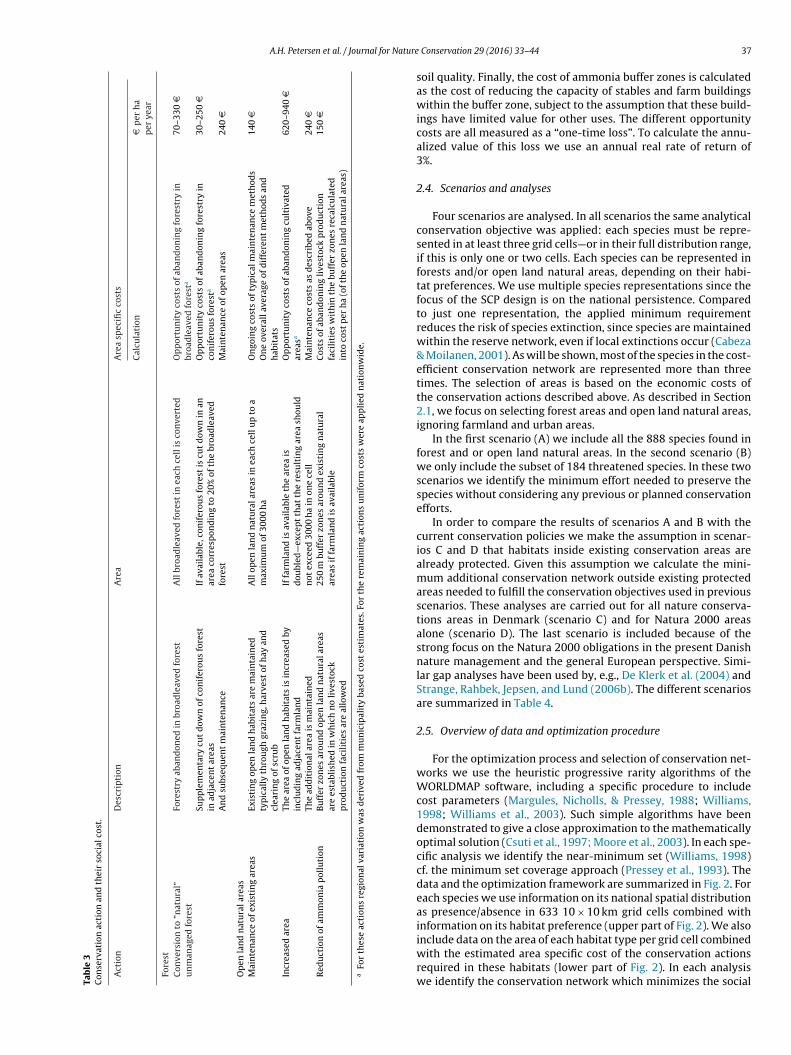
rea of the relevant habitat in the selected cells. However, conser-ation of 3000 ha of each habitat in each cell (=30% of a 10 × 10 kmell) was established as the realistic maximum effort in each cellgap requirement sensu De Klerk, Fjeldså, Blyth, & Burgess (2004)),llowing for other land uses at a local level. The proposed conserva-ion actions are summarised in Table 3. Note that the conservationctions are assumed to be essential in order to preserve the bio-iversity within the sites. The choice and effect of the includedonservation actions are further discussed in Section 5.
The social cost of each of the conservation actions has beenalculated as the annual cost in 2010-price level (measured in con-umer prices). The social cost consists of opportunity costs andirect costs. The opportunity cost is loss of production value of
lternative use of the different areas, i.e., loss of agricultural ororest production. The direct costs are the cost of labor and othernputs used for carrying out maintenance activities on current andew open land natural areas and cleared forest areas. Estimates ofand open land natural areas are used to select areas (grid cells) for conservationize the total cost (social cost) as calculated from the area specific cost of selected
the direct costs are based on Hasler and Schou (2004), Dubgaardet al. (2012), and Hasler et al. (2012), who find only small variationin maintenance cost across the country and various types of openhabitats. Therefore, we apply one average maintenance cost. As theexisting open land natural areas must remain in their current landuse we estimate the conservation cost in these areas as merely themaintenance cost. The maintenance of existing open land naturalareas is subsidized by the EU. In new areas the maintenance mea-sures are the same but the actual cost is higher since they are notsubsidized by the EU (Table 3).
The opportunity costs of lost forest production is based on spa-tial data on tree species, tree age and site classes used in biometricmodels and finally combined with forecasts of prices of wood prod-ucts. The cost of forest production is calculated at municipalitylevel as regional differences in costs of conservation actions shouldbe taken into account when determining the optimal geographi-cal allocation of land conservation. The cost ranges are shown inTable 3.
The costs of increasing open land natural areas are calculated
2 The price of farmland also includes the value of future subsidies to farmlandfrom EU. Normally loss of a subsidy should not be considered a social cost (only atransfer of money from one party to another). However, from a narrow Danish pointof view the loss of a subsidy from EU can be regarded as a social cost. The subsidyto farmland paid by the Danish state is deducted from the farmland price.
A.H. Petersen et al. / Journal for Nature
Tab
le
3C
onse
rvat
ion
acti
on
and
thei
r
soci
al
cost
.
Act
ion
Des
crip
tion
Are
a
Are
a
spec
ific
cost
s
Cal
cula
tion
D
per
ha
per
year
Fore
stC
onve
rsio
n
to
”nat
ura
l”u
nm
anag
ed
fore
stFo
rest
ry
aban
don
ed
in
broa
dle
aved
fore
st
All
broa
dle
aved
fore
st
in
each
cell
is
con
vert
ed
Op
por
tun
ity
cost
s
of
aban
don
ing
fore
stry
inbr
oad
leav
ed
fore
sta
70–3
30
D
Sup
ple
men
tary
cut
dow
n
of
con
ifer
ous
fore
stin
adja
cen
t
area
sA
nd
subs
equ
ent
mai
nte
nan
ce
If
avai
labl
e,
con
ifer
ous
fore
st
is
cut
dow
n
in
anar
ea
corr
esp
ond
ing
to
20%
of
the
broa
dle
aved
fore
st
Op
por
tun
ity
cost
s
of
aban
don
ing
fore
stry
inco
nif
erou
s
fore
sta
Mai
nte
nan
ce
of
open
area
s
30–2
50
D
240
D
Op
en
lan
d
nat
ura
l are
asM
ain
ten
ance
of
exis
tin
g
area
s
Exis
tin
g
open
lan
d
hab
itat
s
are
mai
nta
ined
typ
ical
ly
thro
ugh
graz
ing,
har
vest
of
hay
and
clea
rin
g
of
scru
b
All
open
lan
d
nat
ura
l are
as
in
each
cell
up
to
am
axim
um
of
3000
ha
On
goin
g
cost
s
of
typ
ical
mai
nte
nan
ce
met
hod
sO
ne
over
all a
vera
ge
of
dif
fere
nt
met
hod
s
and
hab
itat
s
140
D
Incr
ease
d
area
The
area
of
open
lan
d
hab
itat
s
is
incr
ease
d
byin
clu
din
g
adja
cen
t
farm
lan
dTh
e
add
itio
nal
area
is
mai
nta
ined
If
farm
lan
d
is
avai
labl
e
the
area
isd
oubl
ed—
exce
pt
that
the
resu
ltin
g
area
shou
ldn
ot
exce
ed
3000
ha
in
one
cell
Op
por
tun
ity
cost
s of
aban
don
ing
cult
ivat
edar
easa
Mai
nte
nan
ce
cost
s
as
des
crib
ed
abov
e
620–
940
D
240
D
Red
uct
ion
of
amm
onia
pol
luti
on
Bu
ffer
zon
es
arou
nd
open
lan
d
nat
ura
l are
asar
e
esta
blis
hed
in
wh
ich
no
live
stoc
kp
rod
uct
ion
faci
liti
es
are
allo
wed
250
m
buff
er
zon
es
arou
nd
exis
tin
g
nat
ura
lar
eas
if
farm
lan
d
is
avai
labl
eC
osts
of
aban
don
ing
live
stoc
k
pro
du
ctio
nfa
cili
ties
wit
hin
the
buff
er
zon
es
reca
lcu
late
din
to
cost
per
ha
(of t
he
open
lan
d
nat
ura
l are
as)
150
D
aFo
r
thes
e
acti
ons
regi
onal
vari
atio
n
was
der
ived
from
mu
nic
ipal
ity
base
d
cost
esti
mat
es. F
or
the
rem
ain
ing
acti
ons
un
ifor
m
cost
s
wer
e
app
lied
nat
ion
wid
e.
Conservation 29 (2016) 33–44 37
soil quality. Finally, the cost of ammonia buffer zones is calculatedas the cost of reducing the capacity of stables and farm buildingswithin the buffer zone, subject to the assumption that these build-ings have limited value for other uses. The different opportunitycosts are all measured as a “one-time loss”. To calculate the annu-alized value of this loss we use an annual real rate of return of3%.
2.4. Scenarios and analyses
Four scenarios are analysed. In all scenarios the same analyticalconservation objective was applied: each species must be repre-sented in at least three grid cells—or in their full distribution range,if this is only one or two cells. Each species can be represented inforests and/or open land natural areas, depending on their habi-tat preferences. We use multiple species representations since thefocus of the SCP design is on the national persistence. Comparedto just one representation, the applied minimum requirementreduces the risk of species extinction, since species are maintainedwithin the reserve network, even if local extinctions occur (Cabeza& Moilanen, 2001). As will be shown, most of the species in the cost-efficient conservation network are represented more than threetimes. The selection of areas is based on the economic costs ofthe conservation actions described above. As described in Section2.1, we focus on selecting forest areas and open land natural areas,ignoring farmland and urban areas.
In the first scenario (A) we include all the 888 species found inforest and or open land natural areas. In the second scenario (B)we only include the subset of 184 threatened species. In these twoscenarios we identify the minimum effort needed to preserve thespecies without considering any previous or planned conservationefforts.
In order to compare the results of scenarios A and B with thecurrent conservation policies we make the assumption in scenar-ios C and D that habitats inside existing conservation areas arealready protected. Given this assumption we calculate the mini-mum additional conservation network outside existing protectedareas needed to fulfill the conservation objectives used in previousscenarios. These analyses are carried out for all nature conserva-tions areas in Denmark (scenario C) and for Natura 2000 areasalone (scenario D). The last scenario is included because of thestrong focus on the Natura 2000 obligations in the present Danishnature management and the general European perspective. Simi-lar gap analyses have been used by, e.g., De Klerk et al. (2004) andStrange, Rahbek, Jepsen, and Lund (2006b). The different scenariosare summarized in Table 4.
2.5. Overview of data and optimization procedure
For the optimization process and selection of conservation net-works we use the heuristic progressive rarity algorithms of theWORLDMAP software, including a specific procedure to includecost parameters (Margules, Nicholls, & Pressey, 1988; Williams,1998; Williams et al., 2003). Such simple algorithms have beendemonstrated to give a close approximation to the mathematicallyoptimal solution (Csuti et al., 1997; Moore et al., 2003). In each spe-cific analysis we identify the near-minimum set (Williams, 1998)cf. the minimum set coverage approach (Pressey et al., 1993). Thedata and the optimization framework are summarized in Fig. 2. Foreach species we use information on its national spatial distributionas presence/absence in 633 10 × 10 km grid cells combined withinformation on its habitat preference (upper part of Fig. 2). We also
include data on the area of each habitat type per grid cell combinedwith the estimated area specific cost of the conservation actionsrequired in these habitats (lower part of Fig. 2). In each analysiswe identify the conservation network which minimizes the social
38 A.H. Petersen et al. / Journal for Nature Conservation 29 (2016) 33–44
Table 4Overview of scenarios.
Scenario A B C D
Species included All (888) Threatened (184) All (888) All (888)Restriction on selection of areas No restriction No restriction Needed area outside Natura 2000
(gap-analysis)Needed area outside protected areas(gap-analysis)
a 3
nly fou
ctrDs(to
3
i(mg
TootcnlldthoHttc
TMl
t
aa
g2ti
F
Species representation 3 3
a Minimum three geographic representations when possible (some species are o
osts of a given analytical objective. Each objective is defined byhe subset of species, the minimum species representation and theequired conservation actions. In the gap analyses (Scenarios C and), priority is given to existing protected areas by setting the con-
ervation cost in these to zero. In this way we maximise the effortarea) inside the protected areas (within the scope of the conserva-ion objective) and simultaneously calculate the additional effortutside the areas needed to meet the conservation objective.
. Results
The minimum cost conservation network from scenario Ancludes areas in 172 grid cells distributed throughout DenmarkFig. 3). In most of these cells conservation actions should be imple-
ented either in forests or in open land natural area, while in 23rid cells both habitats are targeted.
Core results for this conservation network are shown in Table 5.he total area of the network is 125,000 ha before the enlargementf the open land natural areas. After the enlargement the total areaf the network becomes 167,000 ha, which corresponds to 4% ofhe total Danish land area. The total social cost of the suggestedonservation actions is estimated at D 94.9 million per year. Theetwork includes more grid cells selected for conservation in open
and natural areas than in forest areas. In accordance with this, openand natural areas constitute 62% of the total network area. Theifference in terms of costs is even more pronounced as 87% of theotal costs are allocated to open land natural areas, reflecting theigher area specific costs in open land natural areas. The numberf species covered in the open land natural areas is also higher.
owever, a comparison of the number of protected species in thewo habitats with the conservation costs reveals that three to fourimes the number of species are protected per million D in the forestompared with open land nature (Table 4). It is important to note
able 5inimum cost conservation network for all 888 species found in forest and/or open
and natural areas (scenario A).
Forest Open landnature
Total
Number of grid cells 86 109 172d
Initial size of selected areas (1000 ha)a 47 78 125Annual cost of conservation actions (million D ) 12.2 82.7 94.9Number of obligate species protectedb 238 385 458Total number of species protectedc 473c 608c 888Obligate species/annual costs (N/million D ) 19.5 4.7 4.8All species/annual costs (N/million D ) 38.8 7.4 9.4
a For open land habitats one of the conservation actions is to increase the size ofhe natural area. The table shows the size before the enlargement.
b Obligate species here means species found either in forest or in open land naturalreas (not in both), ignoring the fact that some of them are also found in farmlandnd/or urban areas.
c Total number of obligate or non-obligate species represented in at least threerid cells in each habitat (or in their full range size if this is only one or two cells). As15 non-obligate species meet this criterion in both habitats, the sum of species inhe two columns is larger than 888. For 22 species representation in both habitatss needed to fulfill the criterion.
d In 23 of these grid cells both forest and open land natural areas are selected cf.ig. 3.
3
nd in 1 or 2 grid cells).
that these estimates only illustrate the relative difference betweenthe habitats. They cannot be interpreted as the absolute price perspecies conserved because only a small subset of all the terrestrialspecies is included in the analysis. In practice far more than these888 species would be protected in the conservation network. Still,the results strongly suggest that it is cost-efficient to give foresta high conservation priority. This conclusion is strengthened bythe fact that a large proportion of all Danish species, probably themajority, is found in the forest (cf. Table 2).
The conservation areas and costs are described in more detailsin Table 6. It appears that the conservation network includesabout 20% of the total area of broadleaved forests and open landnatural areas in Denmark. It also appears that in the open landnatural areas different conservation actions all contribute substan-tially to the total conservation costs. In accordance with these, theselected areas should be increased by 42,000 ha, reaching a total of120,000 ha of protected open land natural areas in scenario A. Theadditional area for the 250 m ammonium buffer zones around theseareas corresponds to 7% of current farmland area in Denmark.
The chosen conservation objective was that all species shouldbe represented in at least three different grid cells in the selectednetwork except for species that are found in only one or two cells. Inscenario A, 64 species are protected across their entire distributionrange of one, two or three grid cells (Fig. 4). Another 32 speciesare represented in exactly three grid cells, even though they havelarger range sizes (i.e., present in more grid cells). However, themajority of species are protected in more locations and almost twothirds are protected in more than 20 different grid cells. These aretypically rather common and non-threatened species.
The selection of areas in the network is to a large extent deter-mined by the rare species in terms of range size. This is illustrated by
the red grid cells in Fig. 5, which host species that are only found in1–3 grid cells. These cells are irreplaceable as they must be includedin the network in order to fulfill the conservation objective. In con-Table 6Break-down of conservation costs in the mimimum cost conservation network forall 888 species (scenario A).
Conservation actions Annualcosts(million D )
Area(ha) Proportion ofnational area
ForestUnmanaged broadleaved(forestry ban)
9 39,000 21% of broadleavedforest
Cut down of coniferous 2 8000 2% of coniferousforest
Maintenance of cut downareas
2
Open land natureMaintenance of existingareas
12 78,000 20% of open landnatural areas
New areas from farmland 30 42,000 1% of farmland area
Maintenance of new areas 10
Ammonium buffer zones 30 194,000 7% of farmland area
Total 95 361,000

A.H. Petersen et al. / Journal for Nature Conservation 29 (2016) 33–44 39
Fig. 3. Locations of forest and open nature in the minimum cost conservation network for all 888 species (scenario A).
Fig. 5. Flexibility in the minimum cost conservation network for all 888 species (Scenario A). Yellow grid cells are (partly) flexible. They could be replaced by other grid cells,b abitatt
tc
sotoc
ut at a higher social cost. Red cells are irreplaceable with respect to at least one hhis figure legend, the reader is referred to the web version of this article.)
rast, the yellow grid cells can be replaced by one or more otherells, though at a higher overall social cost.
As the majority of the grid cells are irreplaceable, the resultsuggest that there is little flexibility in the choice of areas given thebjective of protecting all species in at least three different loca-
ions. It implies that the species distribution rather than the costsf conservation actions determines which areas to include in theonservation network. The lack of flexibility also has implicationstype (forest or open land nature). (For interpretation of the references to color in
for the choice of policy instruments. We will return to this in thediscussion.
If a conservation network is selected focusing only on the 184threatened species (scenario B), the, number of grid cells and thetotal area needed to meet the conservation goal are lower than in
scenario A as are the social cost. However, the reduction is fairlymodest (Table 7). Thus, the annual social costs of protecting the184 threatened species are D 81.3 million, which corresponds to86% of the costs of the conservation network for all 888 species.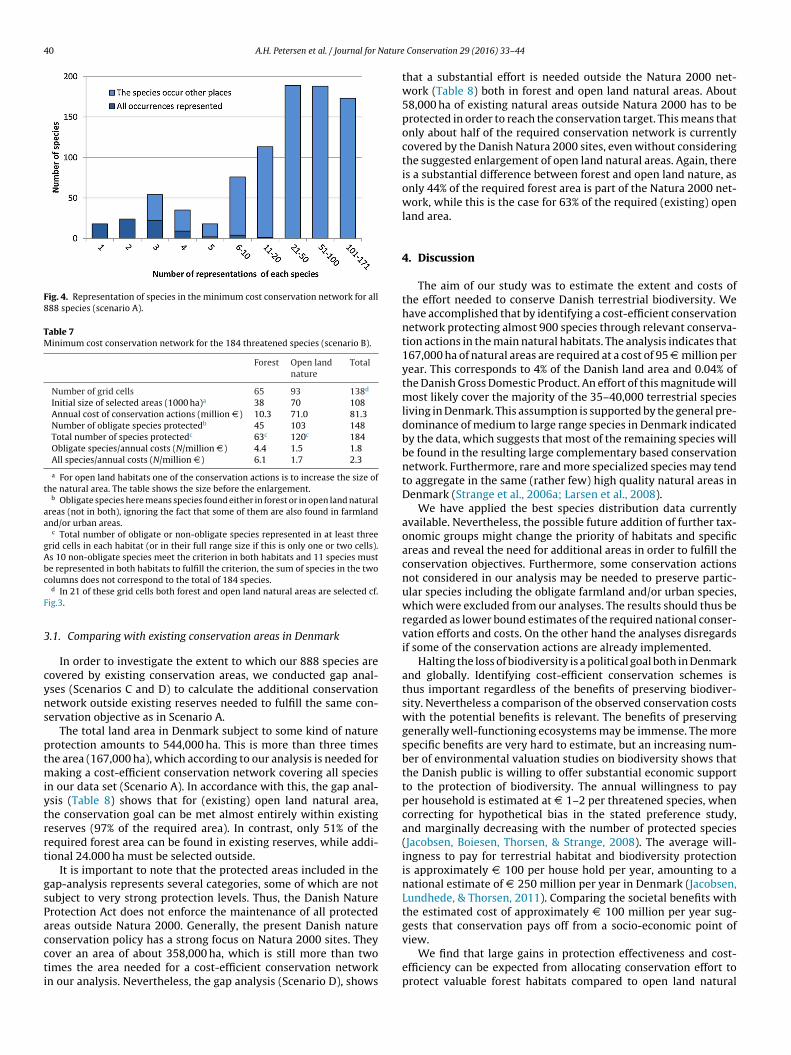
40 A.H. Petersen et al. / Journal for Nature
Fig. 4. Representation of species in the minimum cost conservation network for all888 species (scenario A).
Table 7Minimum cost conservation network for the 184 threatened species (scenario B).
Forest Open landnature
Total
Number of grid cells 65 93 138d
Initial size of selected areas (1000 ha)a 38 70 108Annual cost of conservation actions (million D ) 10.3 71.0 81.3Number of obligate species protectedb 45 103 148Total number of species protectedc 63c 120c 184Obligate species/annual costs (N/million D ) 4.4 1.5 1.8All species/annual costs (N/million D ) 6.1 1.7 2.3
a For open land habitats one of the conservation actions is to increase the size ofthe natural area. The table shows the size before the enlargement.
b Obligate species here means species found either in forest or in open land naturalareas (not in both), ignoring the fact that some of them are also found in farmlandand/or urban areas.
c Total number of obligate or non-obligate species represented in at least threegrid cells in each habitat (or in their full range size if this is only one or two cells).As 10 non-obligate species meet the criterion in both habitats and 11 species mustbe represented in both habitats to fulfill the criterion, the sum of species in the twoc
F
3
cyns
ptmiytrrt
gsPaccti
olumns does not correspond to the total of 184 species.d In 21 of these grid cells both forest and open land natural areas are selected cf.
ig.3.
.1. Comparing with existing conservation areas in Denmark
In order to investigate the extent to which our 888 species areovered by existing conservation areas, we conducted gap anal-ses (Scenarios C and D) to calculate the additional conservationetwork outside existing reserves needed to fulfill the same con-ervation objective as in Scenario A.
The total land area in Denmark subject to some kind of naturerotection amounts to 544,000 ha. This is more than three timeshe area (167,000 ha), which according to our analysis is needed for
aking a cost-efficient conservation network covering all speciesn our data set (Scenario A). In accordance with this, the gap anal-sis (Table 8) shows that for (existing) open land natural area,he conservation goal can be met almost entirely within existingeserves (97% of the required area). In contrast, only 51% of theequired forest area can be found in existing reserves, while addi-ional 24.000 ha must be selected outside.
It is important to note that the protected areas included in theap-analysis represents several categories, some of which are notubject to very strong protection levels. Thus, the Danish Naturerotection Act does not enforce the maintenance of all protectedreas outside Natura 2000. Generally, the present Danish nature
onservation policy has a strong focus on Natura 2000 sites. Theyover an area of about 358,000 ha, which is still more than twoimes the area needed for a cost-efficient conservation networkn our analysis. Nevertheless, the gap analysis (Scenario D), showsConservation 29 (2016) 33–44
that a substantial effort is needed outside the Natura 2000 net-work (Table 8) both in forest and open land natural areas. About58,000 ha of existing natural areas outside Natura 2000 has to beprotected in order to reach the conservation target. This means thatonly about half of the required conservation network is currentlycovered by the Danish Natura 2000 sites, even without consideringthe suggested enlargement of open land natural areas. Again, thereis a substantial difference between forest and open land nature, asonly 44% of the required forest area is part of the Natura 2000 net-work, while this is the case for 63% of the required (existing) openland area.
4. Discussion
The aim of our study was to estimate the extent and costs ofthe effort needed to conserve Danish terrestrial biodiversity. Wehave accomplished that by identifying a cost-efficient conservationnetwork protecting almost 900 species through relevant conserva-tion actions in the main natural habitats. The analysis indicates that167,000 ha of natural areas are required at a cost of 95 D million peryear. This corresponds to 4% of the Danish land area and 0.04% ofthe Danish Gross Domestic Product. An effort of this magnitude willmost likely cover the majority of the 35–40,000 terrestrial speciesliving in Denmark. This assumption is supported by the general pre-dominance of medium to large range species in Denmark indicatedby the data, which suggests that most of the remaining species willbe found in the resulting large complementary based conservationnetwork. Furthermore, rare and more specialized species may tendto aggregate in the same (rather few) high quality natural areas inDenmark (Strange et al., 2006a; Larsen et al., 2008).
We have applied the best species distribution data currentlyavailable. Nevertheless, the possible future addition of further tax-onomic groups might change the priority of habitats and specificareas and reveal the need for additional areas in order to fulfill theconservation objectives. Furthermore, some conservation actionsnot considered in our analysis may be needed to preserve partic-ular species including the obligate farmland and/or urban species,which were excluded from our analyses. The results should thus beregarded as lower bound estimates of the required national conser-vation efforts and costs. On the other hand the analyses disregardsif some of the conservation actions are already implemented.
Halting the loss of biodiversity is a political goal both in Denmarkand globally. Identifying cost-efficient conservation schemes isthus important regardless of the benefits of preserving biodiver-sity. Nevertheless a comparison of the observed conservation costswith the potential benefits is relevant. The benefits of preservinggenerally well-functioning ecosystems may be immense. The morespecific benefits are very hard to estimate, but an increasing num-ber of environmental valuation studies on biodiversity shows thatthe Danish public is willing to offer substantial economic supportto the protection of biodiversity. The annual willingness to payper household is estimated at D 1–2 per threatened species, whencorrecting for hypothetical bias in the stated preference study,and marginally decreasing with the number of protected species(Jacobsen, Boiesen, Thorsen, & Strange, 2008). The average will-ingness to pay for terrestrial habitat and biodiversity protectionis approximately D 100 per house hold per year, amounting to anational estimate of D 250 million per year in Denmark (Jacobsen,Lundhede, & Thorsen, 2011). Comparing the societal benefits withthe estimated cost of approximately D 100 million per year sug-gests that conservation pays off from a socio-economic point of
view.We find that large gains in protection effectiveness and cost-efficiency can be expected from allocating conservation effort toprotect valuable forest habitats compared to open land natural

A.H. Petersen et al. / Journal for Nature Conservation 29 (2016) 33–44 41
Table 8Gap analysis in relation to existing nature conservation areas in Denmark. Additional area needed to cover all 888 species in forest and or open land nature if the effort insideprotected areas is maximizeda. Upper panel: all conservation areas. Lower panel: natura 2000 sites alone.
Habitat Maximized effortinside protected areas Additional effort outside protected areas Total
Area (1000 ha) % of total Area (1000 ha) % of total Area (1000 ha) % of total
All protected areasForest 25 51% 24 49% 50 100%Open land 80 97% 2.7 3.4% 83 100%Total 105 80% 27 20% 132 100%
Natura 2000 sitesForest 22 44% 28 56% 50 100%Open land 51 63% 30 37% 81 100%
largem
acaotEb(aliaet2iatnt2lpdftstarpbtbsth
bcipoEbeiesa
Total 73 56% 58
a Note that the area of the network from the gap analysis does not include the en
reas and buffer zones in agricultural areas. This contrasts to theurrent Danish nature policy as illustrated by our gap-analysesnd the fact that economic support to conservation initiatives inpen land natural areas is significantly higher than initiatives inhe forests. Approximately D 140 million was allocated from theU Rural Development Programme for nature protection in 2012,ut less than 5% of this funding is spent on protected forest areasDanish Economic Councils, 2012). This Programme mainly aimst protecting biodiversity in farmland including semi-natural openand habitats, while financial support for biodiversity conservationn forests largely remain a national issue requiring public financingnd funding from private foundations. Our analyses indicate thatven the designation of Natura 2000 areas in Denmark is biasedoward non-forested habitats. It could be argued that the Natura000 scheme focusses on habitats of European interest and is not
ntended to provide a representative range of sites for conservationt a Member State level. However, the Danish national forest inven-ory has revealed many locations outside the Danish Natura 2000etwork with forest habitat types listed in the EU-Habitats Direc-ive (Johannsen, Nord-Larsen, Riis-Nielsen, Suadicani, & Jørgensen,013); and the share of such areas seems to be higher than for open
and habitat (Ejrnæs,Moeslund, & Bladt, 2014). Our finding is sup-orted by Ejrnæs et al. (2014) who used high resolution presenceata to demonstrate that the number of redlisted species in Danish
orests is higher outside than inside the Natura 2000. They arguehat the relevant habitats outside the Natura 2000 areas tend to bemall and fragmented, which may have disqualified many areas inhe designation process. The protection of forest biodiversity maylso have been given low political priority for historical and culturaleasons. Even intensively managed forests in Denmark are oftenerceived by the general public as “natural areas” less influencedy humans than cultivated agricultural areas. Furthermore, habi-ats like grasslands, heathlands and meadows are often perceivedy the general public as threatened and under pressure from inten-ive agriculture, urban development and invasion by shrubs whilehis is not the case for forest per se, since the forest area actuallyas increased in the last two centuries.
The findings should stimulate a debate on the possible mismatchetween actual priorities and alternative strategies involving largeronservation gains. The observed bias toward non-forested habitatsn Denmark cannot be justified by the EU biodiversity conservationolicies or by the global Convention on Biological Diversity. On thether hand, the funding of agri-environmental schemes under theU Rural Development Programme may have contributed to theias since similar economic support has not been available for for-st conservation. This is problematic as it may constitute a generalssue within the EU Member countries, which reduces both the
ffectiveness and cost-efficiency of current national and EU con-ervation policies. This analysis illustrates the possible gains frombetter integration of policies.
44% 131 100%
ent of open land natural areas.
The objective in Scenario A was to protect all species in the dataset irrespective of red list status. This approach is assumed to reducethe risk that presently non-threatened species will become threat-ened in the future. We also demonstrate that this strategy is onlyabout 20% more costly than the alternative strategy focusing onlyon the threatened species (Scenario B). However, since the networkbased on threatened species also hosts most of the non-threatenedspecies (Petersen, Strange, Anthon, Bjørner, & Rahbek, 2012), thetrue marginal cost for each remaining non-threatened species islarger.
Appropriate estimates of conservation cost are crucial for thedevelopment of efficient protection strategies (Frazee, Cowling,Pressey, Turpie, & Lindenberg, 2003; Naidoo et al., 2006). Wecombine opportunity costs and maintenance costs and provide amore realistic estimate of the implementation cost compared withearlier attempts (Ando et al., 1998; James, Gaston, & Balmford,2001, However, we largely exclude other implementation costssuch as transaction and negotiation costs (Naidoo et al., 2006)and social data relevant for the implementation success (Knight,Cowling, & Campbell, 2006, Knight, Cowling, Difford, & Campbell,2010). Implementation of large-scale conservation actions mayaffect conservation costs. A number of studies have demonstratedthat conservation actions may affect the availability of land, result-ing in increasing land prices and potential acquisition costs. Weignore the dynamic effects of such changes in supply and demand,even though we expect they would most likely increase the pric-ing of land and conservation costs (Phelps, Carrasco, Webb, Koh, &Pascual, 2013).
The present analyses are based on only a few conservationactions chosen to target forest and open land natural areas definedvery broadly. Natural questions would be whether these actionswill actually work and why a broader array of actions is neededin open land nature as compared to the forest? This is important,since the different actions contribute very much to the estimateddifference in cost-efficiency between the two habitats. First of all,the proposed actions were chosen to mitigate important generalthreats in the relevant habitats. Commercial forestry in Denmarkhas for almost two centuries been very intensive, making use ofeven aged monocultures, removal of understory vegetation anddead wood, clearcuttings, soil treatment and pesticides as wellas extensive draining. This practice poses a threat to forest bio-diversity because it inevitably interrupts forest continuity andreduces or eliminates an array of natural habitats. Reduced for-est intervention will benefit a large range of species includingsaproxylic insects and hole-dwelling birds as well as epiphytesand fungi (Friedel, von Oheimb, Dengler, & Härdtle, 2006; Ódoret al., 2006; Brunet, Fritz, & Richnau, 2010; Müller & Bütler 2010;
Lassauce, Paillet, Jactel, & Bouget, 2011; Müller et al., 2013). Thesupplementary clearings of coniferous stands adjacent to andwithin the unmanaged broadleaved areas is assumed provide open
4 ature
svn&2act
lpfbeuf
ahfc(spKeo
ct(e
etafaev(p2ytbbssuoa(c
lsrsFramsmb
2 A.H. Petersen et al. / Journal for N
paces and mixed habitats that will benefit other species likeascular plants and insects dependent on light, temperature orectar resources (Gittings, O’Halloran, Kelly, & Giller, 2006; Naaf
Wulf 2007; Liivamägi, Kuusemets, Kaart, Luig, & Diaz-Forero,014). Accordingly, the proposed change of commercially man-ged production forest into more natural unmanaged forest willertainly improve the persistence of forest biodiversity in the longerm.
In Denmark and other northern temperate areas, most of thearge natural grazers are extinct. In such regions maintenance torevent the invasion by shrubs and trees is most often needed
or preserving non-forested open land nature and the associatediodiversity. Even though the lack of grazers will also affect for-st habitats, much of the forest biodiversity will thrive under morenmanaged conditions. This is why we include maintenance costs
or only a minor part of the selected forest area.The habitat size requirement varies between species. However,
t the general level larger areas of a certain habitat are likely toost larger and more viable populations than smaller areas, and
or species displaying meta-population dynamics increased areaan turn smaller sink populations into larger source populationsHanski & Gilpin, 1991; Hanski, 1999). Therefore, we assume theuggested enlargement of the area of open land natural areas willromote species persistence (Rouget, Cowling, Lombard, Knight, &erley, 2006). Similarly, the proposed conversion of production for-st into unmanaged forest will increase the area and connectivityf critical forest habitats and thus the persistence of populations.
Finally, actions to reduce airborne nutrient pollution was onlyonsidered in open land, because such pollution poses a serioushreat to biodiversity particularly in nutrient poor open habitatsThe Danish Board of Technology, 2008; Ejrnæs et al., 2011; Rahbekt al., 2012).
Some further assumptions of our analyses should be consid-red. As we downscale the area selection from entire grid cells tohe area of relevant habitats, we assume that the species actuallyre present in those habitats. Given the predominance of intensivearmland and urban areas in the remaining land, we believe thisssumption is met in most cases. Another issue is the lack of directvidence that the selected species occurrences represent long-termiable populations. However, it has been shown that for larger areaslike Denmark) species occurrence is a good surrogate variable forersistence, i.e., for viable populations (Araújo, Williams, & Fuller,002, Araújo, Williams, & Turner, 2002). Furthermore, the anal-sis assumes that actions are implemented, which will increasehe probability of species survival. The analyses only distinguishetween forest and non-forested (open land) habitats, which maye seen as an oversimplification. However, for our purpose this isufficient and, very importantly, it is simple. A further division ofpecies on habitats would most likely involve more subjective andncertain assessments. Even if we distinguish between differentpen land habitats this would have minor impacts on the overallllocation results, since Hasler and Schou (2004), Dubgaard et al.2012), and Hasler et al. (2012) found little variation in maintenanceost across habitat types.
Three representations of each species may be considered aow minimum requirement, which in the long run may invoke aignificant risk of national extinction. On the other hand, three rep-esentations ensure that extinction of single populations due totochastic events will not automatically lead to national extinction.urthermore, it may leave some flexibility if societal needs wouldequire an alternative prioritization of conservation areas. Finally,s a result of the near-minimum analysis approach most species are
uch better protected. In scenario A, 92% of all species are repre-ented five times or more. A larger minimum requirement could beore effective in maintaining species over time, but it would also
e more costly. Running the analysis with a minimum requirement
Conservation 29 (2016) 33–44
of five representations shows that approximately 50% more area isneeded to fulfill this objective. Hence, the costs are expected togrow proportionally with the size of the minimum representation,although it will level off at a certain level.
The current conservation planning analysis has focused on thespatial allocation of conservation actions without considering thepolicies or incentives needed to achieve the right actions in theright areas. In the last decades voluntary and flexible economicinstruments have been advocated to promote biodiversity. As anexample of voluntary economic instruments, the OECD (2010) rec-ommended the use of auctions where landowners submit paymentbids on how much they need to be compensated for undertaking agiven biodiversity conservation action on their land.
Economic instruments like auctions are primarily advantageouswhen the flexibility is high; implying that several areas mutuallyreplaceable without compromising the target and to some extentthe cost. The present analysis based on Danish data indicates, how-ever, only little flexibility in the choice of areas. A large fraction ofthe areas must be protected in order to meet the target, becausethey host species with range sizes of three cells or less (Fig. 5).For these areas it is hardly beneficial to use auctions. Basically, thelandowners in question may display monopolistic behavior whenbidding, if the government has announced its intention to preserveall species.
Spatial conservation prioritization techniques have advancedrapidly since the 1980s (Pressey, Whish, Barrett, & Watts, 2002;Moilanen et al., 2009), addressing an increasingly complex andrealistic suite of conservation contexts (Wilson, Carwardine, &Possingham, 2009). However, the application of these tech-niques has been criticized that they remain largely theoretical(Prendergast, Quinn, & Lawton, 1999; Whitten, Holmes, &MacKinnon, 2001; Knight, Driver et al., 2006). The preliminaryresults of this study have been discussed with stakeholders fromthe agricultural and forestry sectors, the World Wildlife Founda-tion and other environmental non-governmental organizations,and members of the Danish Parliament at national workshops. Thistopic appeared to be highly controversial. The forestry sector hasdisputed that forests should be a more important habitat for pro-tection of biodiversity than farmland and open land natural areas.When confronting the forestry sector with the logical steps andassumptions behind the analysis they oppose against it as they fearit will lead to the close down of the forestry sector in Denmark. Interms of economic size and political power the Danish forestry sec-tor is much less important than the agricultural sector. However,our analysis also shows that an increased effort in the forests is notenough. The majority of the conservation investments still needto be allocated to agriculture to protect species in semi-naturalhabitats or to abandon cultivated areas. Interestingly, a numberof Danish political parties referred to our findings in their recentgeneral election campaigns. This illustrates that such structureddecision analysis may play an important role in framing the chal-lenges political decision makers are facing for the future protectionof biodiversity in an extensively managed landscape such as theDanish.
Acknowledgments
We thank the following for kindly providing raw data from theiratlas surveys: H. Baagøe, T.S. Jensen (mammals), K. Fog (reptiles andamphibians), M. Grell and the Danish Ornithological Society (birds),S. Tolsgaard (true bugs), S. Kaaber (moths), O. Martin (click beetles),
M. Stolze (butterflies), M. Holmen (dragon flies), E. Torp and R. Byge-bjerg (hoverflies). We thank the following for updating distributiondata and assessing habitat preferences: L. Iversen (grasshoppersand dragon flies), P.S. Nielsen (butterflies and moths), R. Bygeb-
ature
jB(mSoHdpe
RM
R
A
A
A
A
B
B
B
B
C
C
D
D
D
D
E
E
E
E
F
F
A.H. Petersen et al. / Journal for N
erg (hoverflies), S. Tolsgård (true bugs), O. Martin (click beetles), H.aagøe, M. Elmros, J.D. Møller and H.Vilhelmsen (mammals), K. Fogamphibians and reptiles), P. Wind and H.H. Bruun (orchids and club
osses) and A. Tøttrup and people from the Danish Ornithologicalociety (birds). We also thank all the voluntary data collectors with-ut whom this type of analysis could not be conducted. We thank B.ermansen for GIS analyses and L. A. Hansen and B.I. Rasmussen forata handling and coordination. We thank P. H. Williams for kindlyroviding the WORLDMAP software. Finally, we thank the review-rs for valuable and constructive comments on the manuscript.
AHP, NST, and CR would like to thank the Danish Nationalesearch Foundation for supporting the research at the Center foracroecology, Evolution and Climate.
eferences
ndo, A., Camm, J., Polasky, S., & Solow, A. (1998). Species distributions, landvalues, and efficient conservation. Science, 279, 2126–2128 (80)
raujo, M. B., Alagador, D., Cabeza, M., Nogues-Bravo, D., & Thuiller, W. (2011).Climate change threatens European conservation areas. Ecology Letters, 14,484–492.
raújo, M. B., Williams, P. H., & Fuller, R. J. (2002). Dynamics of extinction and theselection of nature reserves. Proceedings of the Royal Society B: BiologicalSciences, 269, 1971–1980.
raújo, M. B., Williams, P. H., & Turner, A. (2002). A sequential approach tominimise threats within selected conservation areas. Biodiversity andConservation, 11, 1011–1024.
an, N. C., Mills, M., Tam, J., Hicks, C. C., Klain, S., Stoeckl, N., & Chan, K. M. (2013). Asocial–ecological approach to conservation planning: embedding socialconsiderations. Frontiers in Ecology and the Environment, 11, 194–202.
ladt, J., Strange, N., Abildtrup, J., Svenning, J.-C., & Skov, F. (2009). Conservationefficiency of geopolitical coordination in the EU. Journal for NatureConservation, 17, 72–86.
runet, J., Fritz, Ö., & Richnau, G. (2010). Biodiversity in European beech forests—areview with recommendations for sustainable forest management. EcologicalBulletins, 53, 77–94.
utchart, S. H. M., Walpole, M., Collen, B., van Strien, A., Scharlemann, J. P. W.,Almond, R. E. A., & Watson, R. (2010). Global biodiversity: indicators of recentdeclines. Science, 328, 1164–1168.
abeza, M., & Moilanen, A. (2001). Design of reserve networks and the persistenceof biodiversity. Trends in Ecology & Evolution, 16, 242–248.
suti, B., Polasky, S., Williams, P. H., Pressey, R. L., Camm, J. D., Kershaw, M., & Sahr,K. (1997). A comparison of reserve selection algorithms using data onterrestrial vertebrates in Oregon. Biological Conservation, 80, 83–97.
anish Economic Councils (2012). Økonomi og Miljø 2012 (In Danish). DanishEconomic Councils, Copenhagen, Denmark.
anish Ministry of Environment, and E. (2000). Area Information System-AIS.Miljø- og Energiministeriet, Danmarks Miljøundersøgelser.
avies, P. G. G. (2004). The protection of European habitats and species. In P. G. G.Davies (Ed.), European Union Environmental Law—An Introduction to KeySelected Issues (pp. 119–155). England: Ashgate Publishing Limited.
ubgaard A., Jespersen H.M.L., Laugesen F.M., Hasler B., Christensen L.P., MartinsenL., Källstrøm M., Levin G., (2012). Økonomiske analyser af natur-plejemetoder ibeskyttede områder.[Economic analysis of nature protection in protectedareas]. Rapport nr. 211. Fødevareøkonomisk Institut, Københavns Universitet.[In Danish].
jrnæs R., Moeslund J. E., Bladt J. (2014). Analyse om omfang af biodiversitetrepræsenteret i de udpegede Natura 2000 områder på land. Nationalt Centerfor Miljø & Energi, Institut for Bioscience, Aarhus Universitet [In Danish],Aarhus.
jrnæs R., Wiberg-Larsen P., Holm T. E., Josefson A., Strandberg B., Nygaard B.,Andersen L. W., Winding A., Termansen M., Hansen M. D. D., Søndergaard M.,Hansen A. S., Lundsteen S., Baattrup-Pedersen A., Kristensen E., Krogh P. H.,Simonsen V., Hasler B., Levin G. (2011). Danmarks biodiversitet 2010–status,udvikling og trusler (Denmark’ biodiversity 2010–status and threats). Fagligrapport fra DMU nr. 815 (in Danish). National Environmental ResearchInstitute, Aarhus University.
uropean Commission (2012). Our life insurance, our natural capital: an EUbiodiversity strategy to 2020 [WWW Document]. Eur. Comm. Eur. Parliam.Resolut. 20 April 2012 our life Insur. our Nat. Cap. an EU Biodivers. Strateg. to2020. URL http://ec.europa.eu/environment/nature/biodiversity/comm2006/pdf/EP resolution april2012.pdf.
uropean Environment Agency (2007). CLC2006 technical guidelines. EEATechnical report no. 17/2007, Copenhagen. www.eea.europa.eu.
razee, S. R., Cowling, R. M., Pressey, R. L., Turpie, J. K., & Lindenberg, N. (2003).Estimating the costs of conserving a biodiversity hotspot: a case-study of the
Cape Floristic Region, South Africa. Biological Conservation, 112, 275–290.riedel, A., von Oheimb, G., Dengler, J., & Härdtle, W. (2006). Species diversity andspecies composition of epiphytic bryophytes and lichens? A comparison ofmanaged and unmanaged beech forests in NE Germany. Feddes Repertorium,117, 172–185.
Conservation 29 (2016) 33–44 43
Game, E. T., Kareiva, P., & Possingham, H. P. (2013). Six common mistakes inconservation priority setting. Conservation Biology, 27, 480–485.
Gittings, T., O’Halloran, J., Kelly, T., & Giller, P. S. (2006). The contribution of openspaces to the maintenance of hoverfly (Diptera, Syrphidae) biodiversity in Irishplantation forests. Forest Ecology and Management, 237, 290–300.
Groves, C. R., Jensen, D. B., Valutis, L. L., Redford, K. H., Shaffer, M. L., Scott, J. M., &Anderson, M. G. (2002). Planning for biodiversity conservation: Puttingconservation science into practice. Bioscience, 52, 499–512.
Hanski, I. (1999). Metapopulation ecology. Oxford, United Kingdom: OxfordUniversity Press.
Hanski, I., & Gilpin, M. (1991). Metapopulation dynamics: brief history andconceptual domain. Biological Journal of the Linnean Society, 42, 3–16.
Hasler B., Christensen L. P., Martinsen L., Källstrøm M., Levin G., Dubgaard A.,Jespersen H. M. L. (2012). Omkostningerne ved hensigtsmæssig Drift og Pleje afArealer med naturplejebehov indenfor Natura 2000 ogNaturbeskyttelseslovens §3. Teknisk rapport vedr. delprojekt 3 i projektet:Sikring af plejekrævende lysåbne naturtyper i Danmark). Teknisk rapport fraDCE—Nationalt Center for Miljø og Energi nr. 12.
Hasler B., Schou J. S. (2004). Samfundsøkonomisk analyse af sikringen afnaturvenlig drift på §3-arealer og naturskovarealer. [Socio-economic analysisof the management of §3 protected areas and natural forests]. Arbejdsrapportfra DMU nr. 197. Danmarks Miljøundersøgelser.(In Danish).
Jacobsen, J. B., Boiesen, J. H., Thorsen, B. J., & Strange, N. (2008). What’s in a name?The use of quantitative measures versus iconised species when valuingbiodiversity. Environmental and Resource Economics, 39, 247–263.
Jacobsen, J. B., Lundhede, T. H., & Thorsen, B. J. (2011). Valuation of wildlifepopulations above survival. Biodiversity Conservation, 21, 543–563.
James, A., Gaston, K. J., & Balmford, A. (2001). Can we afford to conservebiodiversity? Bioscience, 51, 43.
Jantke, K., Schleupner, C., & Schneider, U. A. (2011). Gap analysis of Europeanwetland species: Priority regions for expanding the Natura 2000 network.Biodiversity Conservation, 20, 581–605.
Johannsen V. K., Nord-Larsen T., Riis-Nielsen T., Suadicani K., Jørgensen B. B.(2013). Skove og Plantager 2012. Skov & Landskab, Frederiksberg, Denmark [InDanish].
De Klerk, H. M., Fjeldså, J., Blyth, S., & Burgess, N. D. (2004). Gaps in the protectedarea network for threatened Afrotropical birds. Biological Conservation, 117,529–537.
Knight, A. T., Cowling, R. M., & Campbell, B. M. (2006). An operational model forimplementing conservation action. Conservation Biology, 20, 408–419.
Knight, A. T., Cowling, R. M., Difford, M., & Campbell, B. M. (2010). Mapping humanand social dimensions of conservation opportunity for the scheduling ofconservation action on private land. Conservation Biology, 24,1348–1358.
Knight, A. T., Driver, A., Cowling, R. M., Maze, K., Desmet, P. G., Lombard, A. T., &Von Hase, A. (2006). Designing systematic conservation assessments thatpromote effective implementation: best practice from South Africa.Conservation Biology, 20, 739–750.
Langford, W. T., Gordon, A., Bastin, L., Bekessy, S. A., White, M. D., & Newell, G.(2011). Raising the bar for systematic conservation planning. Trends in Ecology& Evolution, 26, 634–640.
Larsen, F. W., Bladt, J., Balmford, A., & Rahbek, C. (2012). Birds as biodiversitysurrogates: will supplementing birds with other taxa improve effectiveness?Journal of Applied Ecology, 49, 349–356.
Larsen, F. W., Bladt, J., & Rahbek, C. (2009). Indicator taxa revisited: useful forconservation planning? Diversity and Distributions, 15, 70–79.
Larsen, F. W., Petersen, A. H., Strange, N., Lund, M. P., & Rahbek, C. (2008). Aquantitative analysis of biodiversity and the recreational value of potentialnational parks in Denmark. Environmental Management, 41, 685–695.
Lassauce, A., Paillet, Y., Jactel, H., & Bouget, C. (2011). Deadwood as a surrogate forforest biodiversity: meta-analysis of correlations between deadwood volumeand species richness of saproxylic organisms. Ecological Indicators, 11,1027–1039.
Lewis, D. J., Plantinga, A. J., Nelson, E., & Polasky, S. (2011). The efficiency ofvoluntary incentive policies for preventing biodiversity loss. Resource andEnergy Economics, 33, 192–211.
Liivamägi, A., Kuusemets, V., Kaart, T., Luig, J., & Diaz-Forero, I. (2014). Influence ofhabitat and landscape on butterfly diversity of semi-natural meadows withinforest-dominated landscapes. Journal of Insect Conservation, 18, 1137–1145.
Lund, M. P., & Rahbek, C. (2002). Cross-taxon congruence in complementarity andconservation of temperate biodiversity. Animal Conservation, 5, 163–171.
Maiorano, L., Falcucci, A., Garton, E. O., & Boitani, L. (2007). Contribution of theNatura 2000 network to biodiversity conservation in Italy. ConservationBiology, 21, 1433–1444.
Margules, C. R., Nicholls, A. O., & Pressey, R. L. (1988). Selecting networks ofreserves to maximise biological diversity. Biological Conservation, 43, 63–76.
Margules, C. R., & Pressey, R. L. (2000). Systematic conservation planning. Nature,405, 243–253.
Moilanen, A., Wilson, K. A., & Possingham, H. P. (2009). Spatial conservationprioritisation: quantitative methods and computational tools. Oxford, UK: OxfordUniversity Press.
Moore, J. L., Folkmann, M., Balmford, A., Brooks, T., Burgess, N., Rahbek, C., &Krarup, J. (2003). Heuristic and optimal solutions for set-covering problems inconservation biology RID C-5270-2009. Ecography (Cop.), 26, 595–601.
Morrison, J., Loucks, C., Long, B., & Wikramanayake, E. (2009). Landscape-scalespatial planning at WWF: a variety of approaches. Oryx, 43, 499–507.

4 ature
M
M
N
N
Ó
O
P
P
P
P
P
R
Conservation, 12, 1297–1320.
4 A.H. Petersen et al. / Journal for N
üller, J., Brunet, J., Brin, A., Bouget, C., Brustel, H., Bussler, H., & Gossner, M. M.(2013). Implications from large-scale spatial diversity patterns of saproxylicbeetles for the conservation of European Beech forests. Insect Conservation andDiversity, 6, 162–169.
üller, J., & Bütler, R. (2010). A review of habitat thresholds for dead wood: abaseline for management recommendations in European forests. EuropeanJournal of Forest Research, 129, 981–992.
aidoo, R., Balmford, A., Ferraro, P. J., Polasky, S., Ricketts, T. H., & Rouget, M.(2006). Integrating economic costs into conservation planning. Trends inEcology & Evolution, 21, 681–687.
aaf, T., & Wulf, M. (2007). Effects of gap size, light and herbivory on the herb layervegetation in European beech forest gaps. Forest Ecology and Management, 244,141–149.
dor, P., Heilmann-Clausen, J., Christensen, M., Aude, E., van Dort, K. W., Piltaver, A.,& Grebenc, T. (2006). Diversity of dead wood inhabiting fungi and bryophytesin semi-natural beech forests in Europe. Biological Conservation, 131, 58–71.
ECD. (2010). Paying for biodiversity: enhancing the cost-effectiveness of paymentsfor ecosystem services. OECD Publishing.
etersen A. H., Strange N., Anthon S., Bjørner T. B., Rahbek C. (2012). Bevarelse afbiodiversiteten i Danmark. En analyse af indsats og omkostninger. Workingpaper 2:2012, The Economcic Councils, Copenhagen.
helps, J., Carrasco, L. R., Webb, E. L., Koh, L. P., & Pascual, U. (2013). Agriculturalintensification escalates future conservation costs. Proceedings of the NationalAcademy of Sciences of the United States of America, 110, 7601–7606.
rendergast, J. R., Quinn, R. M., & Lawton, J. H. (1999). The gaps between theory andpractice in selecting nature reserves. Conservation Biology, 13, 484–492.
ressey, R. L., Humphries, C. J., Margules, C. R., Vane-Wright, R. I., & Williams, P. H.(1993). Beyond opportunism: key principles for systematic reserve selection.Trends in ecology & evolution (Personal Edition), 8, 124–128.
ressey, R. L., Whish, G. L., Barrett, T. W., & Watts, M. E. (2002). Effectiveness ofprotected areas in north-eastern New South Wales: recent trends in six
measures. Biological Conservation, 106, 57–69.ahbek, C., Agger, P., Bruun, H. H., Ejrnæs, R., Sand-Jensen, K., Strange, N., &Svenning, J. C. (2012). Danmarks biodiversitets fremtid—de væsentligsteudfordringer og højest prioriterede virkemidler. In H. Meltofte (Ed.), Danmarksnatur frem mod 2020 – Om at stoppe tabet af biologisk mangfoldighed (Denmarks
Conservation 29 (2016) 33–44
nat. toward 2020 – stopping biodivers. loss) (pp. 101–112). Copenhagen,Denmark: Det grønne kontaktudvalg (The Green Contact Working group).
Rouget, M., Cowling, R. M., Lombard, A. T., Knight, A. T., & Kerley, G. I. H. (2006).Designing large-scale conservation corridors for pattern and process.Conservation Biology, 20, 549–561.
Schipper, J., Chanson, J. S., Chiozza, F., Cox, N. A., Hoffmann, M., Katariya, V., &Young, B. E. (2008). The status of the world’s land and marine mammals:diversity, threat, and knowledge. Science, 322, 225–230.
Stjernholm F. (2009). CORINE Land Cover 2006. Final report on interpretation ofCLC2006 in Denmark. National EnvirResearch Notes from NERI No. 257.National Environmental Research Institute, Aarhus University.
Strange, N., Rahbek, C., Jepsen, J. K., & Lund, M. P. (2006a). Using farmland prices toevaluate cost-efficiency of national versus regional reserve selection inDenmark. Biological Conservation, 128, 455–466.
Strange, N., Rahbek, C., Jepsen, J. K., & Lund, M. P. (2006b). Using farmland prices toevaluate cost-efficiency of national versus regional reserve selection inDenmark. Biological Conservation, 128, 455–466.
The Danish Board of Technology. (2008). Biodiversitet 2010-hvordan når vi målene?Katalog over forslag til initiativer. Diskussionsoplæg til internt seminar iFolketingets Miljø- og Planlægningsudvalg den 30. April 2008. (Biodiversity2010-how do we reach the goals-catalog of initiatives). Copenhagen, Denmark:Danish Board of Technology.
Whitten, T., Holmes, D., & MacKinnon, K. (2001). Conservation biology: adisplacement behavior for academia? Conservation Biology, 15, 1–3.
Williams, P. H. (1998). Key sites for conservation: area-selection methods forbiodiversity. In G. M. Mace, A. Balmford, & J. R. Ginsberg (Eds.), Conserv. aChang. world (pp. 211–249). Cambridge University Press.
Williams, P. H., Moore, J. L., Toham, A. K., Brooks, T. M., Strand, H., D’Amico, J., &Rahbek, C. (2003). Integrating biodiversity priorities with conflictingsocio-economic values in the Guinean–Congolian forest region. Biodiversity
Wilson, K. A., Carwardine, J., & Possingham, H. P. (2009). Setting conservationpriorities. Annals of the New York Academy of Sciences, 1162, 237–264.
Wind, P., & Pihl, S. (2004). The Danish red list. Denmark: The NationalEnvironmental Research Institute, Aarhus University.