journal of aerospace and electronic systems, vol… · health management was not considered during...
TRANSCRIPT
JOURNAL OF AEROSPACE AND ELECTRONIC SYSTEMS, VOL. XX, NO. X, MAY XX 1
Optimised Sensor Placement Strategies to ReduceFalse Alarms in Avionic Units
Abstract—The paper investigates the effects of system designon its maintenance requirements. This becomes significantlyimportant when investigating fault alarms that cannot be verified,diagnosed or even duplicated under standard manual inspectionregimes. Modern complex mechanical systems, such as a UAVfuel system, often face a high number of NFF events dueto design limitations associated with testability. This researchidentifies a strategy to optimise system diagnostics by usingextra sensors and tests that can recognise and reduce failureambiguity groups that lead NFF events. It helps indicate how themost appropriate system design can be selected to represent thecumulative replacement costs due to false avionic unit removals,and hence, the overall system life-cycle costs during the designstage.
Index Terms—Health management, testability, false alarms,ambiguity groups, system diagnostics.
I. INTRODUCTION
IN order for systems to be effective, they have to be coherent[1] - this means viewing the system as a “whole”, including
its environment, behavioural patterns and interrelations. Theadoption of availability based contracting has seen significantchanges in how industrial sectors look at the “whole” system.For example, with military aircrafts, governments are drivingchanges in the defence sector given the increase in the totalcost of ownership of these platforms, reducing defence budgetsand the need for a flexible force projection capability [2]. Thisrepresents a significant proportion of the external expenditure.Consequently the Ministry of Defence (MoD) issued theDefence Industrial Strategy in December 2005 - outlining theirrequirements to industry for close partnering and increasedavailability based, product-service package offerings [3]. Suchcontractual agreements transfer risk in the total cost of owner-ship of assets from the operator to the supplier [4], [5]. Suchpractices continue to drive requirements to support a movetowards availability based contracting. With such changingneeds, a system that was originally designed to be coherent,may cease to maintain this characteristic. Therefore, any suchtransformation requires changes within both the operator andsupplier organisations - including changes in the ownershipand management of the supply chain. Although significantprogress has been made to this end, further transformationcontinues and hence delivering a service (maintaining systemeffectiveness) is more important than the quality of service(system optimisation/efficiency).
The aerospace industry needs to drive optimisa-tion/efficiency improvements on to support and maintenanceregimes in order to maximize a return on such contracts [6].Some organisations have taken advantage of this emergingmarket by investing heavily in establishing a global supportnetwork for their civil aerospace gas turbine market [7]. Their
“whole” understanding of their systems has allowed themto drive changes from operator training up to placement ofsensors on their products to collect health data; all to increasethe reliability of the subsystem while enabling a movetowards condition based maintenance rather than a correctivebased support regime. As a result, investment and research inhealth management technologies has increased across variousindustrial sectors - to collect data from platforms that are acombination of on-board and off-board systems. Traditionally,health management was not considered during the designstages of electrical and mechanical systems [8]. Systems werefirst developed and then the health monitoring strategies wereconsidered by adding new sensors and/or tests as required.As both phases were done separately, addition of new sensorsproved to be difficult due to design limitations - in case ofa UAV, there are weight and space constraints [9]. As theindustry became aware of this gap, techniques that integratethe two design phases started to become more prominent[10], [11]. Here, the key enabler for reducing support costsis the collection and timely analysis of the correct data fordiagnostics (detection and isolation) and even prognostics(predicting failures). Given the obvious danger of incorrectsensor placement, collecting incorrect data (and even largequantities of data) which are never analysed due to lack ofresource, there is a challenge in specifying and designinga health management system for safety critical applications[12].
The aim of this paper is to demonstrate that an enhanceddesign process can reduce through-life costs by reducing theNFF event of false removals. It investigates a methodologyto define the impact of adding new sensors to an existingdesign on failures identification and demonstrates that theirconsideration during the design stage could be beneficial toreduce the NFF phenomenon by the reduction of ambiguitygroups and false removals1. The rest of the paper is structuredas follows: Section 2 describes maintenance requirements anddescribes how the NFF phenomena can impact them through-out the life of the system. Section 3 discusses the methodologyused to carry out this research work. This is followed bysections describing the case study (of a representative fuelsystem) that is used to demonstrate the strategy to reduce falsealarms, and developing alternative models for comparison. Thelimitations of the approach is discussed in Section 7. Finally,some conclusions are reached in Section 8 from the precedinganalysis.
1The ambiguity group is a collection of failure mechanisms for whichdiagnostics can detect a fault and can isolate the fault to that collection, yetcannot further isolate the fault to any subset of the collection.

JOURNAL OF AEROSPACE AND ELECTRONIC SYSTEMS, VOL. XX, NO. X, MAY XX 2
II. MAINTENANCE REQUIREMENTS
Given the increase in the product-service oriented mar-ket across many sectors, the market for software tools andstandards to assist in the design and specification of HealthManagement Systems (HMS) is expanding [13]. Khella et al.(2009) identified a core gap whereby the underlying HMSsensors (and their derived data) are not necessarily relateddirectly to maintenance requirements that will utilise the healthinformation [14], [15]. In order to address the issue, thispaper is scoped to utilise a representative fuel system of atypical UAV. While the case study only considered the fuelsystem, a range of stakeholders (such as the pilot/operator,maintenance engineer and fleet manager) provided a number ofcomplex interacting requirements. For simplicity, the authorsonly consider the maintenance engineer requirement - toreduce the unnecessary replacement of Line Replaceable Units(LRU)2 on the UAV, referred to as NFF occurrences. Thispaper describes NFF as the output of a diagnostic process,where the root case of the reported fault was not verified.This is not a complete requirement as it does not quantify therequired level of availability, or the number by which to reducethe NFF occurrences. It is however defined to a sufficient levelof detail to support evaluation of the concept. It also considersthe context of the in scope fuel system only, excluding thewider UAV vehicle systems.
The above requirement was chosen for its conflicting nature- to show the value of the Systems Engineering approachembedded within the concept for resolving them. The conflictin these requirements manifests itself (with the maintenanceengineer removing several potentially faulty components fromthe fuel system) without further fault finding and isolation,in an attempt to reduce the downtime and increase the UAVsoperational availability. This can result in several of the com-ponents returning from the manufacturers’ repair facility withNFF, unnecessarily expending support budget and reducing thenumber of LRU available to hand at the maintenance facility.Alternatively, to correctly detected and isolate the failuredown to the actual component, the maintenance engineer mayrequire a longer maintenance period, reducing the availabilityof the UAV. Considering only the fuel system, the followingrequirement was provided by the participating organisation -Spherea Test and Services - to limit the scope of the casestudy: isolate engine fuel system failures to “x” number ofLRUs. The “x” in the refers to a specific number of LRUs.
A. No Fault Found phenomenon - False alarms
The NFF phenomenon is one of the main problems inmaintenance for the stakeholders. Within the aerospace sector,research on NFF events has gained renewed interest in thepast decade [16]. One significant example is the avionicscomponents where this phenomenon reaches 85% of theirfailures and 90% of the total cost of maintenance [17]. Itseffects are non-negligible because it impacts the system safety
2An LRU is a modular component designed to be replaced quicklyfrom on-site inventory. Thus, restoring system availability, while the re-moved/failed/unserviceable LRU is undergoing maintenance.
and dependability, so it is necessary to limit the NFF conse-quences to satisfy stakeholders. This also demonstrates how aninconsequential event can build up into a strategic concern fororganisations within their competitive environment. Currently,there is a drive towards a more electric aircraft [18], whichindicates a rise in the number of reported NFF events.
When faults occur in a typical maintenance activity, main-tenance personnel are called to find them. Procedurally, theyrely on fault isolation manuals or manufacturer documents. Ifa component is not removed, then it is tagged serviceable. Onthe other hand, if the maintainer removes a component, it issent to depth maintenance for further testing. At depth, if nofault is discovered, concerns are raised on why a serviceablecomponent was removed from service. It is tagged as an NFF.There are three different scenarios which can explain unsuc-cessful fault diagnostics during the repair process:
• The fault cannot be reproduced with the real conditions.The fault is hence considered as “one off” and the systemis declared serviceable. However, the fault reappears laterbecause the origin hasn’t been identified.
• The maintainer decides to replace a unit because heconsiders that it is the main fault’s root. After few testson the new unit, the system is declared serviceable.Nevertheless, the fault reappears so the root was notclearly identified.
• The same fault reoccurs, but the only difference is thatthe fault’s root was not in the unit replaced.
Academic literature also recognises NFF tagged compo-nents as false removals [17], [19], [20]. False alarms can beclassified as a subset of NFF, and indicate, at the system level,of failures when no fault exists, or a call for a maintenanceaction when none was needed. System level false alarms cansend serviceable components for repair; or if the result isquestioned, the predefined system level tests are repeated inorder to gain confidence in the initial conclusions.
III. METHODOLOGY
A key component within the research was the applicationof a robust data collection phase that can effectively capturefailure data from the targeted maintenance chain. Emphasiswas primarily place on gathering information from mainte-nance engineers and related managers, but other personnelin technical support services were also included. A detailedaccount of the all the collaboration channels explored duringthis research work have been described in Khan (2015) [21].
1) Literature review: The state of the art on the NFFphenomena has been published in [16], [22]. These reviewsidentified that currently there are no widely accepted methodsfor guiding or training staff on NFF occurrences, indicatingthe growing gap between the ‘anticipated failures’ capturedduring system design, and the ‘actual failures’ that appear inservice. One key gap identified was the imitations in achievingdiagnostic success during troubleshooting: “The current keyareas for NFF mitigation are focused around understandingtest coverage represented by Built in Test (BIT)/AutomaticTest Equipment (ATE) deficiencies, development of new main-tenance troubleshooting tools, techniques and concepts as well

JOURNAL OF AEROSPACE AND ELECTRONIC SYSTEMS, VOL. XX, NO. X, MAY XX 3
as changes to management processes. Accurate fault models,fault/event trees and system understanding, are paramount torecognizing false alarms (caused by such things as a sensorsystem synchronization). Also, new systematic tests should beidentified in the product design.”Therefore, a test methodology is explored in this paper.
2) Model development - Design software: For Fault Iden-tification and Isolation (FDI) during operations and mainte-nance, there are several software tools available for systemdesign. Each tool is different in terms of techniques and meth-ods for system representation and diagnostic development (see[14] for a review). In order to achieve diagnostic success, thedesign analysis tool should enable studying the diagnostic am-biguity and help optimise test regimes for accuracy/sensitivity[14]. eXpressTM is a fully-featured, off-the-shelf softwareapplication providing an environment for the design, capture,integration, evaluation and optimization of System Diagnos-tics, Prognostics Health Management, and holistic SystemsTestability engineering. Such testability software can also offerthe possibility to provide a diagnostic analysis and a FailureModes Effects and Criticality Analysis (FMECA).For the purpose of this work, eXpressTM has been used for:
• Dependency model development: Modelling the systemis the first step; the different components are representedwith their causal relationship to each other and theirattributes.
• Test definition: It is possible to create several types oftests which run as it is in the real system and measure theability of the system to test at each maintenance level. Thedetection and isolation of faults do not necessarily requireall types of test because the only difference between testsis its coverage.
• Diagnostic analysis: This option represents the capabilityfor the tool to do fault detection and fault isolation. Adiagnostic flow diagram representing the test sequenceand many reports on fault detection and fault isolation areprovided by the tool. It allows studying the diagnosticsand finding actions to implement on the system.
• Failure Mode Effects and Criticality Analysis: This toolbuilds FMECAs using the diagnostic analysis capabilityto identify the effects of failure modes and the criticalityof the effects.
IV. UAV FUEL SYSTEM - MODEL OVERVIEW
The fuel system is one of the most important and complexsystems in an aircraft [23]. A top level diagram of the fuelrig is shown in Figure 1. In addition to its main functionsof storing fuel, feeding the engines with the required flowand pressure; it is used for other external applications likemanagement of the centre of gravity of the plane and the wingloading relief. That is why the fuel flow into various differenttanks (especially in the wing tanks) has to be managedefficiently and effectively. Any failure of the system has tobe avoided to fulfil the safety requirements which result froma continuous feeding of the engines throughout the flight.
eXpressTM is used to model a variety of subsystems com-posed by several components. There are several sub-systemsin the aircraft fuel system that can be seen on Figure 2:
Left AuxiliaryTank
Right AuxiliaryTank
Left WingTank
Right WingTank
Left Engine Right Engine
Fig. 1. Top level diagram [24].
Fig. 2. Design of the fuel system model in eXpressTM .
• Filling sub-system: Normally there are several fillers butin the model one filler is used to fill the wing andauxiliary tanks.
• Feeding sub-system: This sub-system is made withvalves, pump, filter and also sensors and transfers thefuel from one tank to another when it is necessary (e.g.auxiliary tank ’ wing tank).
• Transfer sub-system: It is used to transfer fuel frombetween both wing tanks to control the centre of gravityand keep the stability. The flow and pressure is controlledby a transfer pump and two two-ways valves.
• Refuel sub-system: For example, when too much fluidflow arrives in the left hand side engine this sub-systemtransfers surplus to the left wing tank. It is made with acooler and a check valve. An assumption to simply themodel has been made by removing the cross feed sub-system. Each sub-system is composed from a single toseveral components that are all linked with pipes.
Some components have an interface between the model andthe outside world represented by Input/Output flags. To make

JOURNAL OF AEROSPACE AND ELECTRONIC SYSTEMS, VOL. XX, NO. X, MAY XX 4
clearer, some of them are on the side of the model. Table Isummarises these different Input/Output flags:
TABLE IDIFFERENT ICONS REPRESENTING COMPONENTS IN THE MODEL
Icon ComponentTransfer pump, Auxliary pump or Low pres-sure pump
Vent valve
Fill Valve or Drain valve
Relief valve
Check valve
2 Way valve
Pressure sensor
Flow sensor, Temperature sensor or levelsensorAuxiliary tank, Wing tank or Engine tank
Filter
CoolerControl monitoringSource of powerOutput values for the sensorsInput/output for the flow
The developed model is composed of four mains types ofcomponents: the fuel tanks, pumps, sensors and valves.
3) Fuel tanks: In each aircraft there are dedicated spacesfor storing fuel. Generally, the main fuel tank is located intothe wing structures due to some benefits saw in the overviewpart. This eXpressTM model has got three different types offuel tank located in different places of the UAV. There issymmetry for each type of tank: one for the left hand sideand one for the right hand side.
• First, the auxiliary tank is used to balance the plane andto gain more stability but also to store the fuel to feed thewing tanks throughout the flight. It holds vent and drainvalves to prevent against the accumulation of vapours butalso sensor to measure its fuel level.
• The second type of tank is the wing tank. The weight ofthe fuel tanked in the wings is used to balance the lifteffect so the bending moment is reduced. However, thedrawback is that the wings have to create more lift effectsto support the extra load applied on the fuselage.
• Finally, the engine tank that is fed by the wing tankis located just before the transformation of fuel intopropulsion [17,20].
4) Pumps: In the fuel system model, several types of pumpsare used. Each pump is specific for a sub-system and play arole in the non-gravity feed designs because the fuel has tomove from one of the different fuel tanks to both engines. Thedifferent pumps are:
• The transfer pump is to move the fuel between the twowing tanks in order to manage the center of gravity.
• The auxiliary pump is used to feed the wing tank be-cause it hasn’t to be dry for the reason of stability andmanagement of center of gravity.
• The low pressure pump is integrating in the engine feedsub-system. It provides the fuel at the required pressureand flow to the engine.
5) Sensors: To detect and identify critical failures, thesensors are the key components. The model integrates fourtypes of sensors which have to be placed at the right place:
• The level sensors are located in the two wing tanks andtwo auxiliary tanks. It continuously controls the level offuel in the different tank to inform on an eventually fueltransfer from one tank to another.
• The temperature sensor measures the fuel temperature inthe wing tank because the fuel may be hotter than normalif the cooler does not work well.
• The flow and pressure sensors are integrated in the enginefeed sub-system to control the flow and the pressure ofthe fuel after the low pressure pump.
6) Valves: Along the pipe system there are valves con-trolled by monitoring to stop the fuel flow. In this model thereare four main types of valves:
• The shutoff valve is used to fill the tanks but also to drainthe tanks. It is a simple valve which is controlled to beopen or closed.
• The vent valve is fixed to the two wing tanks and twoauxiliary tanks and balances the pressure in the differenttanks. An assumption has been made because the modeldesign is composed with only one vent valve for eachtank whereas in reality there are always two vent valvesto cope with of the obstruction issue.
• The relief valve is also a valve for the pressure but itallows protecting and limiting tanks against pressure thatcould exceed their design limits.
• The check valve controls the direction of the fuel flowat the exit of pumps or coolers. It works automaticallywithout being controlled by any external control.
A. Attributes
In order to develop and simulate the system componentattribute data is required. In this case, three main attributeshave been considered that have greater impact on maintenancedecisions:
• Reliability: representing the failure rate of the componentexpressed in Mean Time Between Failure (MTBF)
• Time-to-change: represents the time to replace a unit andhas an impact upon the time to repair
• Cost: changing a unit has an impact on the cost to repairReliability data was provided by component suppliers, or
taken from existing models made by Spherea T&S. The time-to-repair and costs estimates were mostly taken from existingmodels and research publications [24], [25]. A summary ispresented in Table II.
B. Failure modes
Failure modes describe the observable behaviours in whichan item can fail. These are essential to build a diagnostic as ithelps to provide much more detailed visibility of componentactivity. For the fuel system model, failure modes have been

JOURNAL OF AEROSPACE AND ELECTRONIC SYSTEMS, VOL. XX, NO. X, MAY XX 5
TABLE IIATTRIBUTES OF THE DIFFERENT COMPONENTS
Component Reliability Time-to-change Cost(MTBF) (Minutes) ($)
Auxiliary tank 1.01 decades 600 2000
Wing tank 1.01 decades 600 2000
Engine tank 2.8 decades 600 2000
Transfer pump 2.11 decades 120 202
Auxiliary pump 1.14 decades 120 202
Low pressure pump 2.11 decades 120 202
Fill valve 4.21 decades 30 137
Drain valve 4.21 decades 90 137
Vent valve 2.85 decades 30 137
Relief valve 1.56 decades 30 137
2-way valve 1.56 decades 30 137
Check valve 4.09 decades 30 57
Filter 2.74 years 10 21
Cooler 11.4 centuries 60 300
Pressure sensor 3.54 decades 30 250
Flow sensor 6.47 years 30 250
Temperature sensor 1.75 decades 30 40
Level sensor 1.75 decades 30 40
TABLE IIIFAILURE MODES OF THE FUEL SYSTEM MODEL
Component Failure mode OccurrenceAuxiliary tank Tank failed 1%
Wing tank Tank failed 1%
Engine tank Tank level low 99%
Transfer pump Pump failed 50%
Auxiliary pump Pump failed 50%
Low pressure pump Pump flow incorrect 50%
Fill valve Leakage, stuck open 50%
Drain valve Leakage 35%
Vent valve Vent in/out failed 50%
Relief valve Stuck open 20%
2-way valve Clogged 10%
Check valve Stuck open 35%
Filter Clogged filter (partly/fully) 80% (partly)20% (fully)
Cooler Cooler blocked, leakage 50%
Pressure sensor Out of calibration 95%
Flow sensor Out of calibration 95%
Temperature sensor Sensor failure 5%
Level sensor Out of calibration 95%
defined for each component with a value representing thatfailure mode’s percentage of the object’s total failures. Whenthe percentages of occurrence for object failure modes add upto 100%, that means that all the ways in which an object canfail have been taken into account. A summary of failure modesis presented in Table III.
C. Failure effects
The attributes and the failure modes are not the only dataadded to complete the model. It is also necessary to add failure
effects. These represent the consequences of the failures modesand can be defined in two ways with eXpressTM - objectfailure effects and design failure effects. Object failure effectsrepresent how failure modes on an object manifest themselves,whereas design failure effects are the representation of how theobject failure effects manifest themselves at the design level.The failure modes defined before and the failure effects areessential to build a diagnostic analysis and a FMECA. For thefuel system model, the design failures effects are listed andexplained below:
• False alarms: There are two types of false alarm: falsepositive is when the system detects a failure, however, thisis none. The other, a false negative, is when the systemdoes not detect a failure where in fact there was one.
• Fuel flow incorrect: This failure effect appears when thefuel flow is incorrect in the system due to a component(e.g. a pump).
• Fuel level low: This means that the level of fuel is lowinside the fuel system.
• Fuel not flowing: This design failure design is whenthe fuel is not slowing due to a component or severalcomponents (e.g. filter clogged).
• Hydraulic leak: This is related to leakage of the compo-nents.
• Sensor failure warning: Indicates sensor failure.• Tank not equally filled: This is indicates incorrect balance
between the right and left side tanks.• Tank pressure incorrect: This indicates that the pressure
inside the tank is incorrect.
V. DIAGNOSTIC STUDY
After model development, a reference diagnostic studywill be used to allow comparisons. eXpressTM generates adiagnostic study that represents the test sequence composedby tests and fault groups. It indicates the ambiguity group sizeof the analysis. This allows the designer to concentrate effortson particular fault group that have the highest ambiguity (15 inthe fuel system case study) and understand which modificationworks, or fails to isolate failures. After identifying the faultgroup new sensors placement or tests can be identified to helpthe detection of failures.
Table IV summarises the main statistics provided by thediagnostic study for the “reference” model; summarising theprobability of detection, the probability of isolation and theaverage fault group size number (average ambiguity). Thishelps to investigate improvements in any new sensors (or tests)can detect and isolate faults. The table also lists the differentambiguities with the associated number of fault groups. Forthis reference model, the highest ambiguity is 15, with 4 faultgroups. The aim of adding any new sensors (or tests) willbe to to remove these 4 fault groups. The diagnostic studycan provide a lot of information to develop a strategy on theimplementation of new sensors.
The number of NFF events can be reduced by focusing onthe fault groups with higher ambiguity. A diagnostic study isgenerated, followed by the trade-off between the ambiguity

JOURNAL OF AEROSPACE AND ELECTRONIC SYSTEMS, VOL. XX, NO. X, MAY XX 6
TABLE IVDETECTION AND ISOLATION STATISTICS FOR THE “REFERENCE” MODEL
OF FUEL SYSTEM WITHOUT ADDING NEW SENSORS
Prob of detection 99.1%Prob of isolation 57.09%
Average fault group size 3.97
Fault group Fault Fault Cumulativesize count percentage (%) (%)
1 44 57.09 57.09
2 5 1.56 58.65
3 15 5.94 64.59
4 6 3.51 68.09
5 15 5.27 73.37
6 14 4.68 78.05
7 6 3.28 81.33
8 4 2.02 83.35
9 5 7.22 90.58
11 1 1.97 92.55
15 4 7.45 100
and the criticality of the large fault groups sizes3. Afteridentifying the essential components, new sensors are selectedand added accordingly. After this step, a new diagnostic studyis generated that can provide revised diagnostic statistics.Finally, these results are compared with the reference modelresults. Figure 3 summarises the strategy to reach the aim (e.g.ambiguity=1) by reducing the average size group.
It should be noted that there are various diagnostic al-gorithms that can influence the order of testing for faultdetection or fault isolation [26], and eXpressTM providesa number of them. Each algorithm (available in the soft-ware) is comprised of a set of test candidate groupings, testweighting and test cut-offs. These groupings and weightingdefined for each algorithm are the result of a sophisticatedunderstanding of the test selection criteria that, as a rule ofthumb, tend to produce “good” diagnostics in a variety ofdiagnostic situations (production testing, regular maintenance,trouble-shooting, damage assessment, etc.). Such algorithmsare not meant to be definitive diagnostic methodologies thatcan handle any contingency, but to rather act as baselineapproaches that can be modified to customize diagnostics tothe task at hand. In fact, none of the predefined detection orisolation algorithms initially take into consideration attributessuch as cost or time. These are added by the authors to provethe concept. Therefore, it is assumed that a designer will addadditional weighting as necessary to accommodate the specificneeds of a particular diagnostic requirements/study.
VI. ALTERNATE MODELS
Following the strategy established in the previous section,a new model can now been created to compare potential im-provements between the initial model and the new alternativemodels.
3Instead of reducing the fault groups with the highest ambiguity, thecriticality of the fault groups must also influence decision-making.
Creating and generating the diagnostic analysis
Trade-off between ambiguity and criticality: selecting
fault group with highest amibuguty and checking the
relative impact on criticality
Selecting new sensors and their locations
Making changes for the new design
Creating and generating the new diagnostics
Comparing statistics
Ambiguity = 1
Am
big
uity >
1
Fig. 3. Strategy to decide on new sensor locations.
This section details the three different fuel system modelsredesigned with the diagnostic analysis and STAGE simula-tions. For each model, there is an alternative way of sensorsplacement.
A. Design 1
The first alternative model has been done according to theresults generated from the diagnostic analysis of the referencemodel. After analysing those results and following the strategyexplained in the previous section, efforts are focussed on thefour fault groups with 15 items (because this is the highestambiguity). The new design of the fuel system is displayed inFigure 4. The additional sensors are circled in red.
The diagnostic study generated four faults groups high-lighted in the upper part of the fuel system. This is presentedin Table V. Moreover, the FMECA revealed two failures ofthe left and right hand side of the relief valves that are notbeing detected.
In conclusion, the extra sensors have an impact on somefeatures for the model in terms of faults isolation. However,it does not solve the problem of ambiguity.
To complete this analysis, STAGETM is used. STAGETM
is an add-on simulation package that can provide a range ofstatistical charts representing total costs and reliability of thedeveloped eXpress model over a period of time. These chartsinclude the:
• Average removals over time• Extra cost due to false removals over time• Fault isolation over time

JOURNAL OF AEROSPACE AND ELECTRONIC SYSTEMS, VOL. XX, NO. X, MAY XX 7
Fig. 4. Alternative Design 1.
TABLE VDIAGNOSTIC STUDY FOR THE ALTERNATIVE DESIGN 1 MODEL
Prob of detection 99.21%Prob of isolation 62.04%
Average fault group size 3.64
Fault group Fault Fault Cumulativesize count percentage (%) (%)
1 56 62.04 62.04
2 11 4.1 66.14
3 16 4.81 70.95
4 6 2.76 73.71
5 14 4.19 77.9
6 16 4.98 82.88
7 6 2.81 85.69
8 4 1.74 87.43
9 5 5.34 92.77
11 1 1.58 94.35
15 4 5.65 100
The metrics produced in the STAGE simulation allow for anycommon metric to be viewed in an assortment of graphs,and many described using stochastic values. The metrics thatcan be generated from the pulling of the functional or failureattributes contained within the diagnostic design do not needto be limited.
The model time period has been set at 20000 hours (accountto approximately 22.8 years)
1) Average component removal charts: The comparisonbetween the reference model and the first alternative modelbegins with a chart that is relevant for the NFF phenomenon -the “Average removal over time”. This is illustrated in Figure14, representing all removed units for maintenance againsttime (22.8 years). The grey area accounts for total removals,whereas the yellow area accounts for false removals due tolarge ambiguity groups.
Figure 5 is the original model and shows that the compo-nents removed without being faulty represent approximately70% of all removals. Without new sensors, the No Fault Found
Fig. 5. Average removals over time for the “reference” model.
Fig. 6. Average removals over time for the Alternative Design 1 model.
phenomenon is prevalent over the specified time period. Figure6 shows the average removals for the alternative model. It canbe seen, analytically, that by adding new sensors to the originaldesign (after the auxiliary pump) has changed the proportionof the false removals from that section of the fuel rig design.
These charts maintain the conclusions made in the previoussection that placing new sensors in the design improve faultisolation.
2) Cost analysis charts: eXpressTM allows the designer toput a price tag on each component, time taken for maintenanceand labour costs. This can be useful in predicting a cost

JOURNAL OF AEROSPACE AND ELECTRONIC SYSTEMS, VOL. XX, NO. X, MAY XX 8
Fig. 7. Extra costs due false removals over time for the “reference” model.
Fig. 8. Extra costs due false removals over time for the Alternative Design1 model.
estimate for overall cost on false removals. As an exampleto demonstrate the concept, the authors have used fictitiouscost values in the model. The following chart accounts thecumulative cost of false removals over the 20000 hours. Thecomparison between both models is done with the chart calls“extra cost due to false removals over time”.
The y-axis in Figure 7 and 8 represents the cumulativereplacement cost for the reference and Design 1 models.The dark green palette is used to represent total wastage- labour, maintenance, etc, whereas, the light green paletterepresents the cost of additional component replacements - dueto false removals. Comparing the total costs between the twodeveloped models shows a slight difference; with a reductionof the cost by 18%. In fact, the cost of extra replacementsfor the initial model is approximately $6917 whereas for thefirst alternative model it is around $5663. These costs onlyrepresent the cost of the repair, not the cost of consequently
Fig. 9. Fault isolation over time for the “reference” model.
Fig. 10. Fault isolation over time for the Alternative Design 1 model.
diagnosing a good unit (which would be extra time and effort).Therefore, the addition of sensors has an impact on overallfalse removal costs.
3) Fault isolation charts: The last type of charts, (Figure 9and 10), represent the fault isolation over the model life-cycleand aims to study the progression of different fault group size.
The y-axis represents the number of isolations (in otherwords, the number of the different size of fault groups). These
JOURNAL OF AEROSPACE AND ELECTRONIC SYSTEMS, VOL. XX, NO. X, MAY XX 9
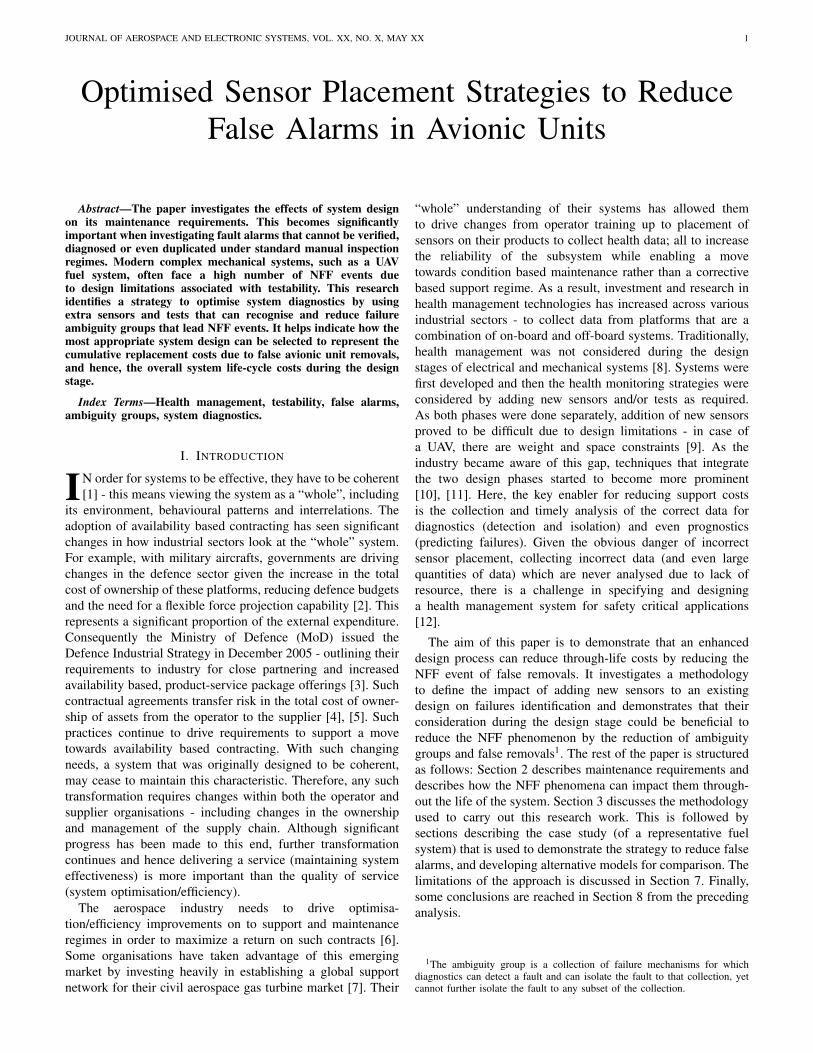
charts use four different colours:• Green for fault groups = 1 item• Blue for fault groups = 2 items• Pink for fault groups = 3 items• Yellow for fault groups ≥ 4 items
Examining the two model chart results, there can be seen anincreasing proportion of green and pink lines in the alternativemodel. This is because; with new sensors the model reducesthe number of fault groups with 4 or more items. The faultisolation is better because the number of fault groups with1 and 3 items increases. Also, the addition of new sensorsbetween auxiliary tanks and wing tanks has a significantinfluence on the fault group size. However the 4 fault groupswith an ambiguity of 15 are not removed.
Overall, the addition of new sensors between the auxiliarytanks and the wing tanks improves the model by reducingthe cost and getting a better isolation. However, the highestambiguity is still 15 so the results might be better by changingthe sensors placement. Therefore, the next design developsanother strategy using a second alternative model of fuelsystem.
B. Design 2
After the first exercise, a new design for the fuel system willnow be simulated using the same strategy. According to the di-agnostic analysis of the original model, the highest ambiguityis fifteen (in four faults groups), including components on thetransfer way. The transfer way is a critical path within the fuelrig as it helps an aircraft to keep its stability by transferringfuel from a wing tank to another. Therefore, the additionalsensors will be placed on the transfer way between the checkvalve and the right hand side two way valves to control theflow and the pressure after the transfer pump. By adding thesenew sensors in this area, improvements in terms of isolationof failures are expected. The choice for the type of additionalsensors is the same as the choice made in the first alternativemodel. The two additional sensors are a pressure transducerand flow metre with the same features than the others pressureand flow sensors.
Figure 11 presents the second alternative design of the fuelsystem.
The diagnostic study for the Alternative Design 2 model ispresented in Table VI. Comparing these results to the previousalternative model, the results have worsened because:
• The probability of isolation has decreased• The average fault group size is higher• The highest ambiguity is still 15 with 4 fault groups
So, the changes brought by this design, in terms of faultdetection and isolation, are not an improvement.
1) Average fault removal charts: As compared to Design 1in Figure 5, Figure 12 of Design 2 shows almost no difference.Although there is some improvement in the number of falseremovals over time.
2) Cost analysis charts: Figure 13 illustrates the costresulting for the model. There is a higher cumulative cost ofextra sensor placements - $7167. Adding extra sensors canbe expensive at the end of the system system life cycle even
Fig. 11. Alternative Design 2 model.
TABLE VIDIAGNOSTIC STUDY FOR THE SECOND ALTERNATIVE MODEL
Prob of detection 99.16%Prob of isolation 59.25%
Average fault group size 3.77
Fault group Fault Fault Cumulativesize count percentage (%) (%)
1 48 59.25 59.25
2 13 2.03 61.28
3 25 6.67 67.96
4 5 3.14 71.09
5 21 5.71 76.8
6 8 2.29 79.1
7 6 2.64 81.74
8 4 1.68 83.42
9 5 6.83 90.25
11 1 1.76 92.01
12 2 1.33 93.34
15 4 5.65 100
though they might help to increase isolation, as can be seenin the following analysis.
3) Fault isolation charts: The last exercise for Design 2is for fault isolation over the life-cycle. The results in Figure14 remains similar to Design 1. The only difference noticeabledifference is the number of fault groups with one item is higherfor Design 2.
The three charts confirm that Design 2, with extra sensors onthe transfer way, is not necessarily an effective one. However,there is slight improvement within the diagnostic study whichindicates that a combination of Design 1 and Design 2 modelscan help reduce false removals. The next section goes throughthis idea to build the final model.
C. Design 3
The two prior alternative models show some improvementsin the diagnostic analysis. The third model combines both

JOURNAL OF AEROSPACE AND ELECTRONIC SYSTEMS, VOL. XX, NO. X, MAY XX 10
Fig. 12. Average removals over time for the Alternative Design 2 model.
Fig. 13. Extra cost due false removals over time for the Alternative Design2 model.
previous models by adding extra sensors after the auxiliarypumps and the transfer pump. As before, the new sensors inFigure 15, are circled in red.The diagnostic study in Table VII shows improvements com-pared to the two alternative models:
• The probabilities for the fault detection and isolationincreases as well as the number of the average fault groupsize.
• The probability of isolation increases by 11%• The average fault group size decreases by 34%• The removal of the 4 fault groups of 15 items. The highest
ambiguity is 11 for only one fault group Reduction in thenumber of fault groups with an ambiguity greater than 1
It is evident that adding extra sensors has improved thefault detection and isolation aspect of the model. Furthermore,
Fig. 14. Fault isolation over time for the Alternative Design 2 model.
Fig. 15. Alternative Design 3 model.
the simulations confirm the results obtained of the diagnosticanalysis.
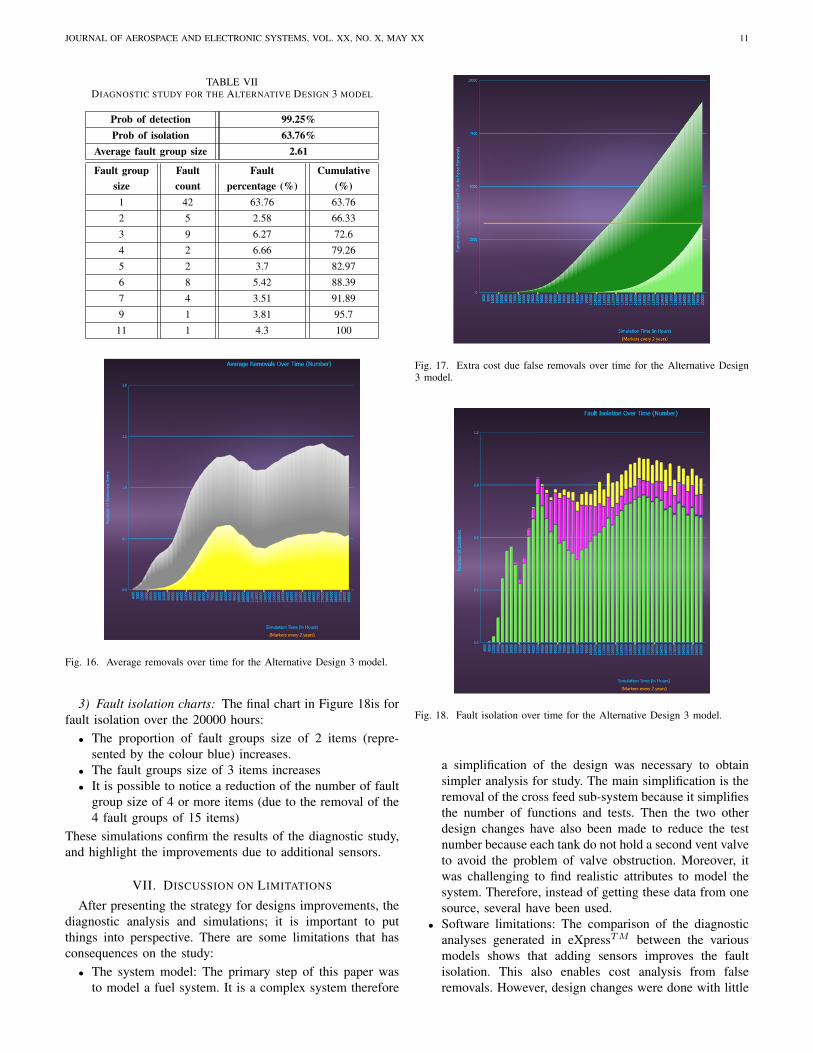
1) Average fault removal charts: Figure 24 shows thecharts of the average removals of the original model andthe final model. By comparison, it is visible that the extrasensors placements have made differences. The percentage offalse removals is around 70% of the total removal for theinitial model whereas with the new design, this percentage isapproximately less than 50%.
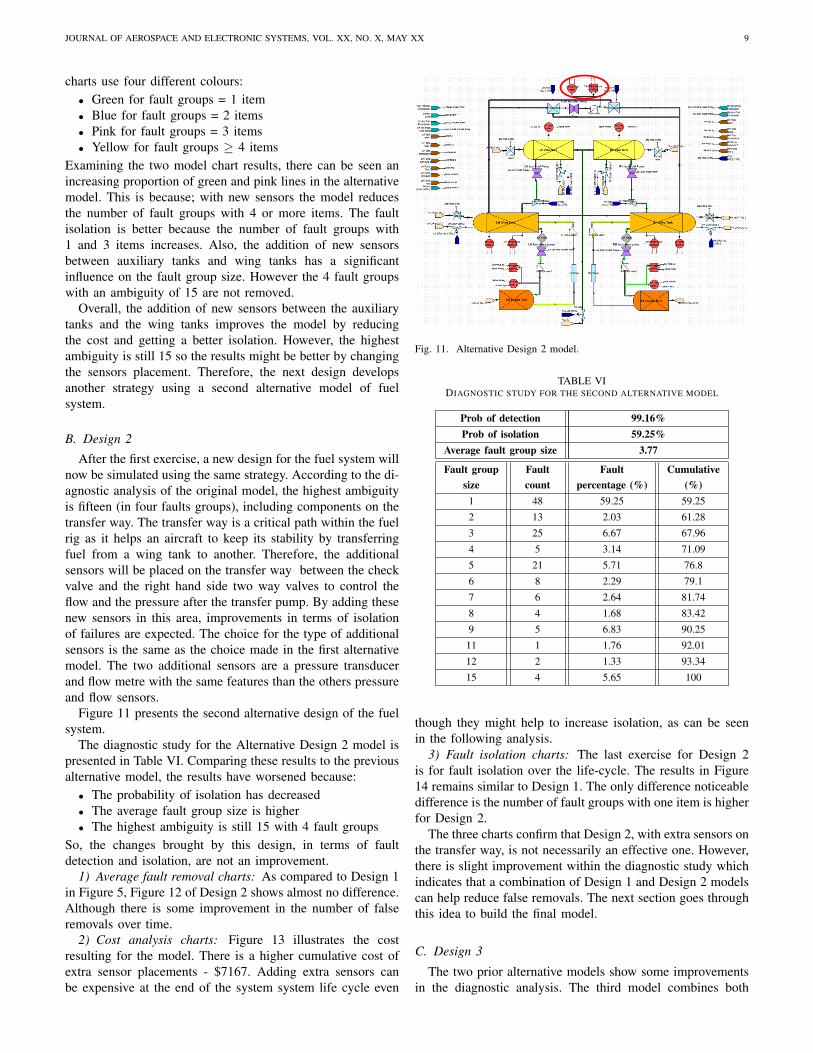
2) Cost analysis charts: Figure 17 presents the extra costsdue to false removals for the model. More sensors results inmore improvements and hence the reduction in the “whole”system cost. The original model is $6917, whereas for the finalone it is $3260. Concerning the wasted item cost, there is alsoa reduction of approximately 30% between both models.
JOURNAL OF AEROSPACE AND ELECTRONIC SYSTEMS, VOL. XX, NO. X, MAY XX 11
TABLE VIIDIAGNOSTIC STUDY FOR THE ALTERNATIVE DESIGN 3 MODEL
Prob of detection 99.25%Prob of isolation 63.76%
Average fault group size 2.61
Fault group Fault Fault Cumulativesize count percentage (%) (%)
1 42 63.76 63.76
2 5 2.58 66.33
3 9 6.27 72.6
4 2 6.66 79.26
5 2 3.7 82.97
6 8 5.42 88.39
7 4 3.51 91.89
9 1 3.81 95.7
11 1 4.3 100
Fig. 16. Average removals over time for the Alternative Design 3 model.
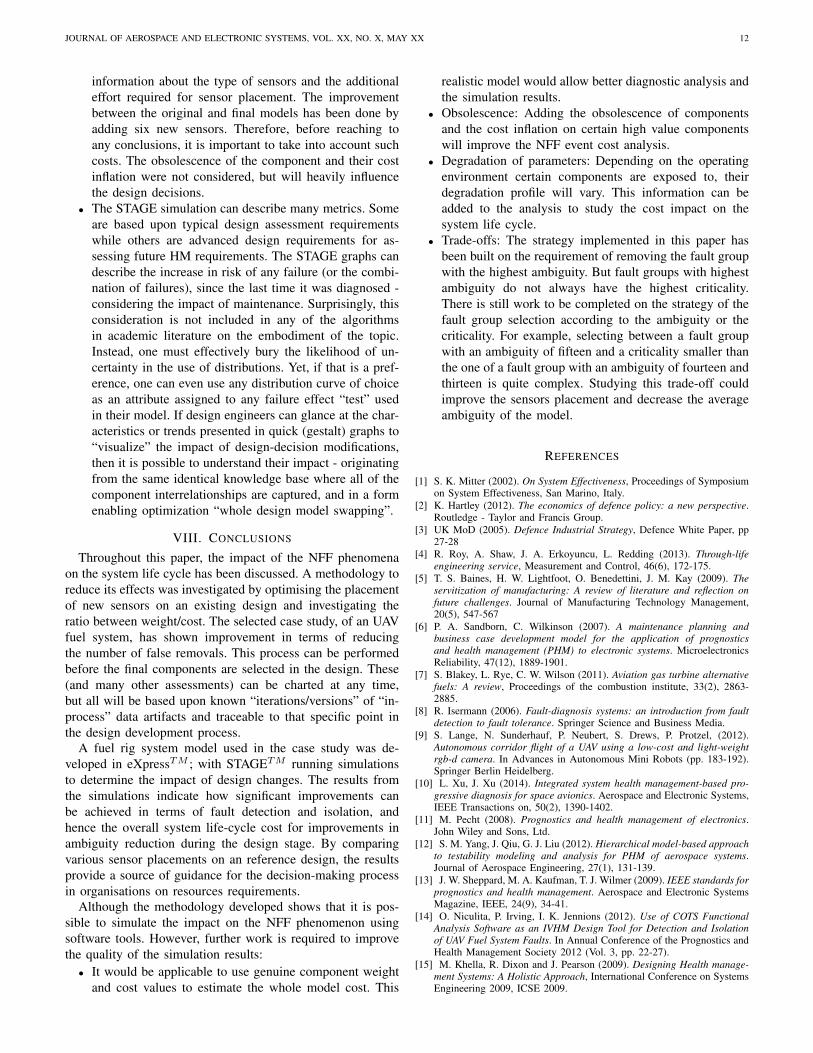
3) Fault isolation charts: The final chart in Figure 18is forfault isolation over the 20000 hours:
• The proportion of fault groups size of 2 items (repre-sented by the colour blue) increases.
• The fault groups size of 3 items increases• It is possible to notice a reduction of the number of fault
group size of 4 or more items (due to the removal of the4 fault groups of 15 items)
These simulations confirm the results of the diagnostic study,and highlight the improvements due to additional sensors.
VII. DISCUSSION ON LIMITATIONS
After presenting the strategy for designs improvements, thediagnostic analysis and simulations; it is important to putthings into perspective. There are some limitations that hasconsequences on the study:
• The system model: The primary step of this paper wasto model a fuel system. It is a complex system therefore
Fig. 17. Extra cost due false removals over time for the Alternative Design3 model.
Fig. 18. Fault isolation over time for the Alternative Design 3 model.
a simplification of the design was necessary to obtainsimpler analysis for study. The main simplification is theremoval of the cross feed sub-system because it simplifiesthe number of functions and tests. Then the two otherdesign changes have also been made to reduce the testnumber because each tank do not hold a second vent valveto avoid the problem of valve obstruction. Moreover, itwas challenging to find realistic attributes to model thesystem. Therefore, instead of getting these data from onesource, several have been used.
• Software limitations: The comparison of the diagnosticanalyses generated in eXpressTM between the variousmodels shows that adding sensors improves the faultisolation. This also enables cost analysis from falseremovals. However, design changes were done with little
JOURNAL OF AEROSPACE AND ELECTRONIC SYSTEMS, VOL. XX, NO. X, MAY XX 12
information about the type of sensors and the additionaleffort required for sensor placement. The improvementbetween the original and final models has been done byadding six new sensors. Therefore, before reaching toany conclusions, it is important to take into account suchcosts. The obsolescence of the component and their costinflation were not considered, but will heavily influencethe design decisions.
• The STAGE simulation can describe many metrics. Someare based upon typical design assessment requirementswhile others are advanced design requirements for as-sessing future HM requirements. The STAGE graphs candescribe the increase in risk of any failure (or the combi-nation of failures), since the last time it was diagnosed -considering the impact of maintenance. Surprisingly, thisconsideration is not included in any of the algorithmsin academic literature on the embodiment of the topic.Instead, one must effectively bury the likelihood of un-certainty in the use of distributions. Yet, if that is a pref-erence, one can even use any distribution curve of choiceas an attribute assigned to any failure effect “test” usedin their model. If design engineers can glance at the char-acteristics or trends presented in quick (gestalt) graphs to“visualize” the impact of design-decision modifications,then it is possible to understand their impact - originatingfrom the same identical knowledge base where all of thecomponent interrelationships are captured, and in a formenabling optimization “whole design model swapping”.
VIII. CONCLUSIONS
Throughout this paper, the impact of the NFF phenomenaon the system life cycle has been discussed. A methodology toreduce its effects was investigated by optimising the placementof new sensors on an existing design and investigating theratio between weight/cost. The selected case study, of an UAVfuel system, has shown improvement in terms of reducingthe number of false removals. This process can be performedbefore the final components are selected in the design. These(and many other assessments) can be charted at any time,but all will be based upon known “iterations/versions” of “in-process” data artifacts and traceable to that specific point inthe design development process.
A fuel rig system model used in the case study was de-veloped in eXpressTM ; with STAGETM running simulationsto determine the impact of design changes. The results fromthe simulations indicate how significant improvements canbe achieved in terms of fault detection and isolation, andhence the overall system life-cycle cost for improvements inambiguity reduction during the design stage. By comparingvarious sensor placements on an reference design, the resultsprovide a source of guidance for the decision-making processin organisations on resources requirements.
Although the methodology developed shows that it is pos-sible to simulate the impact on the NFF phenomenon usingsoftware tools. However, further work is required to improvethe quality of the simulation results:
• It would be applicable to use genuine component weightand cost values to estimate the whole model cost. This
realistic model would allow better diagnostic analysis andthe simulation results.
• Obsolescence: Adding the obsolescence of componentsand the cost inflation on certain high value componentswill improve the NFF event cost analysis.
• Degradation of parameters: Depending on the operatingenvironment certain components are exposed to, theirdegradation profile will vary. This information can beadded to the analysis to study the cost impact on thesystem life cycle.
• Trade-offs: The strategy implemented in this paper hasbeen built on the requirement of removing the fault groupwith the highest ambiguity. But fault groups with highestambiguity do not always have the highest criticality.There is still work to be completed on the strategy of thefault group selection according to the ambiguity or thecriticality. For example, selecting between a fault groupwith an ambiguity of fifteen and a criticality smaller thanthe one of a fault group with an ambiguity of fourteen andthirteen is quite complex. Studying this trade-off couldimprove the sensors placement and decrease the averageambiguity of the model.
REFERENCES
[1] S. K. Mitter (2002). On System Effectiveness, Proceedings of Symposiumon System Effectiveness, San Marino, Italy.
[2] K. Hartley (2012). The economics of defence policy: a new perspective.Routledge - Taylor and Francis Group.
[3] UK MoD (2005). Defence Industrial Strategy, Defence White Paper, pp27-28
[4] R. Roy, A. Shaw, J. A. Erkoyuncu, L. Redding (2013). Through-lifeengineering service, Measurement and Control, 46(6), 172-175.
[5] T. S. Baines, H. W. Lightfoot, O. Benedettini, J. M. Kay (2009). Theservitization of manufacturing: A review of literature and reflection onfuture challenges. Journal of Manufacturing Technology Management,20(5), 547-567
[6] P. A. Sandborn, C. Wilkinson (2007). A maintenance planning andbusiness case development model for the application of prognosticsand health management (PHM) to electronic systems. MicroelectronicsReliability, 47(12), 1889-1901.
[7] S. Blakey, L. Rye, C. W. Wilson (2011). Aviation gas turbine alternativefuels: A review, Proceedings of the combustion institute, 33(2), 2863-2885.
[8] R. Isermann (2006). Fault-diagnosis systems: an introduction from faultdetection to fault tolerance. Springer Science and Business Media.
[9] S. Lange, N. Sunderhauf, P. Neubert, S. Drews, P. Protzel, (2012).Autonomous corridor flight of a UAV using a low-cost and light-weightrgb-d camera. In Advances in Autonomous Mini Robots (pp. 183-192).Springer Berlin Heidelberg.
[10] L. Xu, J. Xu (2014). Integrated system health management-based pro-gressive diagnosis for space avionics. Aerospace and Electronic Systems,IEEE Transactions on, 50(2), 1390-1402.
[11] M. Pecht (2008). Prognostics and health management of electronics.John Wiley and Sons, Ltd.
[12] S. M. Yang, J. Qiu, G. J. Liu (2012). Hierarchical model-based approachto testability modeling and analysis for PHM of aerospace systems.Journal of Aerospace Engineering, 27(1), 131-139.
[13] J. W. Sheppard, M. A. Kaufman, T. J. Wilmer (2009). IEEE standards forprognostics and health management. Aerospace and Electronic SystemsMagazine, IEEE, 24(9), 34-41.
[14] O. Niculita, P. Irving, I. K. Jennions (2012). Use of COTS FunctionalAnalysis Software as an IVHM Design Tool for Detection and Isolationof UAV Fuel System Faults. In Annual Conference of the Prognostics andHealth Management Society 2012 (Vol. 3, pp. 22-27).
[15] M. Khella, R. Dixon and J. Pearson (2009). Designing Health manage-ment Systems: A Holistic Approach, International Conference on SystemsEngineering 2009, ICSE 2009.

JOURNAL OF AEROSPACE AND ELECTRONIC SYSTEMS, VOL. XX, NO. X, MAY XX 13
[16] S. Khan, P. Phillips, I. Jennions, C. Hockley (2014). No Fault Foundevents in maintenance engineering Part 1: Current trends, implicationsand organisational pratices. Reliability engineering and system safety,123, 183-195.
[17] P. Soderholm (2006). A system view of the No Fault Found (NFF)phenomenon. Reliability Engineering and System Safety, 92(1), 1-14.
[18] J. A. Rosero, J. A. Ortega, E. Aldabas, L. A. Romeral (2007). Movingtowards a more electric aircraft. Aerospace and Electronic SystemsMagazine, IEEE, 22(3), 3-9.
[19] W. R. Simpson, J. W. Sheppard (1992). Analysis of false alarms duringsystem design. In Aerospace and Electronics Conference, 1992. NAECON1992., Proceedings of the IEEE 1992 National (pp. 657-660). IEEE.
[20] N. B. Holzel, T. Schilling, T. Neuheuser, V. Gollnick, A G. LufthansaTechnik (2012). System Analysis of Prognostics and Health Manage-ment Systems for Future Transport Aircraft. In Proceedings of the 28thCongress of the International Council of the Aeronautical Sciences(ICAS) (pp. 23-28).
[21] S. Khan (2015). Research study from industry-university collaborationon ‘no fault found’ events. Journal of Quality in Maintenance Engineering,21(2).
[22] S. Khan, P. Phillips, C. Hockley, I. Jennions (2014). No Fault Foundevents in maintenance engineering Part 2: Root causes, technical devel-opments and future research. Reliability Engineering and System Safety,123, 196-208.
[23] J. D. Mattingly (2002). Aircraft engine design. AIAA education series- American Institute of Aeronautics and Astronautics.
[24] P. J. Bennett (2010). Fault detection on an experimental aircraft fuelrig using a Kalman filter based FDI screen. Loughborough Universitydoctoral dissertation.
[25] E. M. Kelly, L. M. Bartlett (2007). Aircraft fuel rig system fault diagnos-tics based on the application of digraphs. Proceedings of the Institutionof Mechanical Engineers, Part O: Journal of Risk and Reliability, 221(4),275-284.
[26] I. Hwang, S. Kim, Y. Kim, C. E. Seah (2010). A survey of fault detection,isolation, and reconfiguration methods. Control Systems Technology,IEEE Transactions on, 18(3), 636-653.