journal of al-azhar university engineering sector
TRANSCRIPT
513
Journal Of Al-Azhar University Engineering Sector
Vol.15, No. 55, April, 2020, 513-526
VERIFICATION OF A THREE DIMENSIONAL NUMERICAL MODEL FOR A MECHANICALLY STABILIZED EARTH WALL
Abdelwahab Tahsin*1, Rami El-Sherbiny2 and Abdelsalam Salem2
1 Arab Consulting Engineers Office, Dokki, , Giza, Egypt 2Geotechnical and Foundations Engineering, Department of Public Works,
Faculty of Engineering, Cairo University, Giza, Egypt. *Corresponding Author Email: [email protected]
ABSTRACT In comparison to traditional retaining wall systems, Mechanically Stabilized Earth Walls (MSEW) provide advantages of cost savings, relatively easy and fast construction, and good performance with regard to differential settlements. Behavior of MSEW is complicated due to the mechanical complexity of the component materials, interactions, and unquantifiable effects of construction method. Current design standards are based primarily on understand-ing of two-dimensional plane-strain behavior regardless of the 3D behavior and associated mechanisms. The objective of this research is to develop and verify a 3D numerical model that can be later adopted for studying the 3D behaviour of MSEWs of different geometries using PLAXIS 3D. The numerical model was verified against the monitoring records of Wall 1 reported by Hatami & Bathurst (2005) at the Royal Military College of Canada. The model verification shows that the modeling technique used in Plaxis 3D is capable of captur-ing qualitative trends of the instrumented MSEW response, and in most cases quantitative values are in agreement with the monitoring records and predictions by Hatami and Bathurst (2005, 2006). Hardening Soil (HS) constitutive model would better simulate the stress- strain relationship for sand derived/ calibrated from tri-axial test. The linear Elasto-Plastic anisotropic geogrid model with secant modulus at 1.5% strain is found appropriate. Plate elements used to model the facing are found suitable to simulate discrete facing blocks, as an alternative to solid elements to reduce complexity of the model and computation time. KEYWORDS: Mechanically Stabilized Earth (MSE) Wall; 3D Numerical Modeling; Plaxis, Hardening Soil Model, Strain; Strain Gauge; Verification; Secant Modulus; Finite Element Method, Constant Strain Rate Test.
تحقیق لنموذج تحلیل عددي ثلاثي الإبعاد للحوائط من التربة المسلحة
٢السلام سالم و عبد٢ و رامي الشربیني١*الوھاب تحسین عبد . مصرالجیزة،،الدقي ، مكتب المھندسون الاستشاریون العرب ١
مصرالجیزة، ،الھندسة الجیوتقنیھ والأساسات ، قسم الإشغال العامة ،كلیھ الھندسة ،جامعھ القاھرة قسم ٢ : [email protected] Email : البرید الالیكترونى للباحث الرئیسى*
ملخص ال واسع الانتشار نظرا لفوائده الاقتصادیھ بالضافھ الي لبولیمراتأصبح استخدام نظام الحوائط السانده من التربھ المسلحھ با
تعتبر اسالیب التحلیل العددي ثلاثي الابعاد وسیلھ فعالھ لدراسھ السلوك المعقد لتلك الحوائط . سھولھ وسرعھ التنفیذبین مكونات نظام الحائط من تربھ وشبك تسلیح وبلوكات وجھ الحائط وبالتالي تم تصمیم والتمثیل الدقیق للتأثیر التفاعلي
نموذج تحلیل عددي ثلاثي الابعاد باستخدام طریقة العناصر المحدودة عن طریق برنامج متخصص في التحلیل الجیوتقني . التاثیر التفاعلي بین التربھ والحائطلتمثیل سلوك تلك الحوائط مع استخدام نموذج محاكاه غیر خطي لتمثیل) بلاكسیس(
VERIFICATION OF A THREE DIMENSIONAL NUMERICAL MODEL FOR A MECHANICALLY STABILIZED EARTH WALL
JAUES,15,55,2020
514
وقد تم عمل تحقیق لنموذج التحلیل ثلاثي الابعاد بالرجوع الي قیاسات الرصد الحقلي الخاصھ بحائط الكلیھ الملكیھ الكندیھ وتبین حدوث توافق بدرجھ مقبولھ بین نتائج الرصد ) .٢٠٠٦و٢٠٠٥(|تم رصده عن طریق ھاتامي وباثرست عام
.بین ما تم حسابھ بنموذج المحاكاهالحقلي و
حوائط التربة المسلحة ، البولیمرات ، مصنعات جیوتقنیھ للتربة ، أزاحھ واجھة الحائط ، التحلیل : الكلمات المفتاحیھ العددي ثلاثي الإبعاد ، طریقھ العناصر المحدودة
. 1. INTRODUCTION Behavior of Mechanically Stabilized Earth Wall MSEW is complicated due to the mechanical complexity of the component materials, interactions, and unquantifiable effects of construction method. Current design methods in North America for internal stability are based on limit-equilibrium tie-back wedge methods of analysis that were adapted from steel reinforced soil re-taining wall design (AASHTO 2002). These methods established primarily on understanding of two-dimensional plane-stain behavior regardless of the 3D behavior and mechanisms associated particularly: (a) discontinuous reinforcement; (b) Pullout tests and (c) wall corners. Due to a lack of theoretical understanding or proper 3D modeling, the authorized inaccuracy has led to signifi-cant conservatism or on other certain instance leads to underestimated or inconsistent design. Numerical modeling of geo-synthetic reinforced soil systems is now widely used for the design of field structures, prediction of measured responses, and in research to generate synthetic data for the purpose of filling in knowledge gaps on the behavior of these systems. (Yan Yu and Richard J. Bathurst, 2016). Model validation is necessary to ensure that the developed analytical 3D Plaxis model could capture properly the real behavior and to identify the model key input parameters to be applied to get worthy agreement among model findings and measurements. In order to validate the nu-merical model, a comparison was carried out between the predicted and the measured results of a full-scale modular block facing wall (Wall 1) of 3.60m height, built at the Royal Military Col-lege of Canada (RMC), developed by Hatami and Bathurst (2005, 2006), and with its numerical predictions using FLAC2D (Huang et al. 2009). RMC wall W1 shall be the main reference for numerical model validation r both End Of Construction (EOC) and End of Loading (EOL) stages. Principally, such physical models offer numerous advantages including more uniformity in material properties, improved instrumentation placement and results, accurate incremental surcharge loading, and simple boundary conditions. For EOC and EOL stages; the analytical output findings of :(a) Facing relative facing displace-ment, (b) foundation vertical pressure, (c) Geo-grid connection loads and (d) geogrid strain were validated versus corresponding monitoring records and other numerical predictions. In this research work, we are focused on verification of 3D numerical model simulations that can be used to predict operational (working stress) conditions rather than incipient wall collapse.
2. REFERENCE INSTRUMENTED FULL SCALE MSE MODEL Full-scale physical tests of 3.6 m height geo-synthetic reinforced retaining walls with modular block facing at a batter of 8 degrees from vertical, carried out by the Geotechnical Research Group at the Royal Military College (RMC) of Canada (Bathurst et al. 2000), were used to vali-date the simulation for both End Of Construction (EOC) and End Of Loading (EOL). Full-scale laboratory testing such as the experiments conducted by Hatami and Bathurst (2005) offer nu-merous advantages including more uniformity in material properties, improved instrumentation placement and results, accurate incremental surcharge loading, and simple boundary conditions.
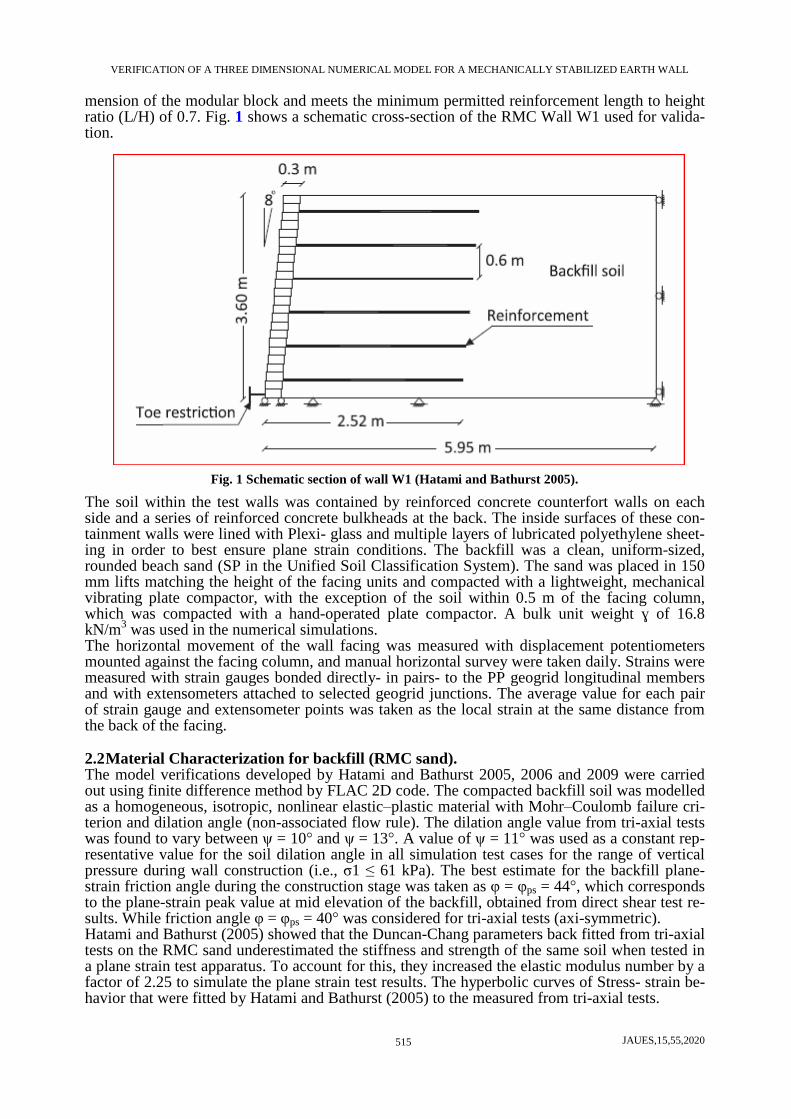
2.1 MSE geometry, configuration and test setup. The wall facing consisted of a column of discrete, dry-stacked, solid masonry concrete blocks with continuous concrete shear keys. Each unit was 300 wide (toe to heel) × 150 high × 200 mm long. The facing units were placed in a staggered joint configuration conforming to the used in the field. The reference wall (Wall 1) was used for performance validation in this study. The wall was constructed on a structural concrete laboratory floor, which determine the rigid foundation con-dition. Wall 1 was constructed with six layers of a weak biaxial polypropylene (PP) geogrid. The length and the vertical spacing of the geogrid were 2.52 and 0.6 m, respectively. Wall 1 satisfies the AASHTO requirement that the reinforcement spacing not exceed twice the toe to heel di-
VERIFICATION OF A THREE DIMENSIONAL NUMERICAL MODEL FOR A MECHANICALLY STABILIZED EARTH WALL
JAUES,15,55,2020
515
mension of the modular block and meets the minimum permitted reinforcement length to height ratio (L/H) of 0.7. Fig. 1 shows a schematic cross-section of the RMC Wall W1 used for valida-tion.
Fig. 1 Schematic section of wall W1 (Hatami and Bathurst 2005).
The soil within the test walls was contained by reinforced concrete counterfort walls on each side and a series of reinforced concrete bulkheads at the back. The inside surfaces of these con-tainment walls were lined with Plexi- glass and multiple layers of lubricated polyethylene sheet-ing in order to best ensure plane strain conditions. The backfill was a clean, uniform-sized, rounded beach sand (SP in the Unified Soil Classification System). The sand was placed in 150 mm lifts matching the height of the facing units and compacted with a lightweight, mechanical vibrating plate compactor, with the exception of the soil within 0.5 m of the facing column, which was compacted with a hand-operated plate compactor. A bulk unit weight ɣ of 16.8 kN/m3 was used in the numerical simulations. The horizontal movement of the wall facing was measured with displacement potentiometers mounted against the facing column, and manual horizontal survey were taken daily. Strains were measured with strain gauges bonded directly- in pairs- to the PP geogrid longitudinal members and with extensometers attached to selected geogrid junctions. The average value for each pair of strain gauge and extensometer points was taken as the local strain at the same distance from the back of the facing.
2.2 Material Characterization for backfill (RMC sand). The model verifications developed by Hatami and Bathurst 2005, 2006 and 2009 were carried out using finite difference method by FLAC 2D code. The compacted backfill soil was modelled as a homogeneous, isotropic, nonlinear elastic–plastic material with Mohr–Coulomb failure cri-terion and dilation angle (non-associated flow rule). The dilation angle value from tri-axial tests was found to vary between ψ = 10° and ψ = 13°. A value of ψ = 11° was used as a constant rep-resentative value for the soil dilation angle in all simulation test cases for the range of vertical pressure during wall construction (i.e., σ1 ≤ 61 kPa). The best estimate for the backfill plane-strain friction angle during the construction stage was taken as φ = φps = 44°, which corresponds to the plane-strain peak value at mid elevation of the backfill, obtained from direct shear test re-sults. While friction angle φ = φps = 40° was considered for tri-axial tests (axi-symmetric). Hatami and Bathurst (2005) showed that the Duncan-Chang parameters back fitted from tri-axial tests on the RMC sand underestimated the stiffness and strength of the same soil when tested in a plane strain test apparatus. To account for this, they increased the elastic modulus number by a factor of 2.25 to simulate the plane strain test results. The hyperbolic curves of Stress- strain be-havior that were fitted by Hatami and Bathurst (2005) to the measured from tri-axial tests.

VERIFICATION OF A THREE DIMENSIONAL NUMERICAL MODEL FOR A MECHANICALLY STABILIZED EARTH WALL
JAUES,15,55,2020
516
2.3 Geogrid properties. Weak biaxial Poly Propylene (PP) geogrid was utilized, where the strength and stiffness of the PP geogrid are load, time, and temperature dependent. It is clear from Fig. 2 and the literature (Yeo 1985; Walters et al. 2002), that polypropylene geogrid is affected by strain rate. ASTM D4595 standard prescribes a 10%/min strain rate. The yield strength of the polypropylene used in Limit Equilibrium was taken from the 10%/ min strain test (after Hatami and Bathurst 2005).
Fig. 2 In-isolation Load- Strain response of Polypropylene geogrid specimens from Constant Rate of Strain
(CRS) tests results (Hatami and Bathurst 2005). In order to better match the realistic (slower) loading conditions of all during construction, the data from the 0.01 %/min Constant Rate of Strain (CRS) test was used for Calibration. The con-stant elastic modulus used in the model was calibrated to the initial tangent stiffness of the 0.01 %/min CRS test, after it was adjusted to match the 1000 hour creep data from Walters et al. (2002). Since the strain in the Geogrid remained below 1.5% through the End Of Construction (EOC), linear elastic model was considered an appropriate approximation served to reduce nu-merical issues and computation time. Fig. 3 illustrates the adjusted curve to match 1000 hours creep.
Fig. 3 In-isolation Load- Strain response of Polypropylene geogrid specimens from Constant Rate of Strain
(CRS) tests results (Hatami and Bathurst 2005).
• Axial load T=119x0.015-1469(0.015) ^2=1.45 KN/m • Secant stiffness J (EA) = T/ε = 1.45/0.015=97 KN/m • Tf(t)=stress @ rupture= 7.7 KN/m; • Jo(t)=initial tangent stiffness = 115 KN/m; • Ultimate strength Ty = 14 KN/m.
VERIFICATION OF A THREE DIMENSIONAL NUMERICAL MODEL FOR A MECHANICALLY STABILIZED EARTH WALL
JAUES,15,55,2020
517
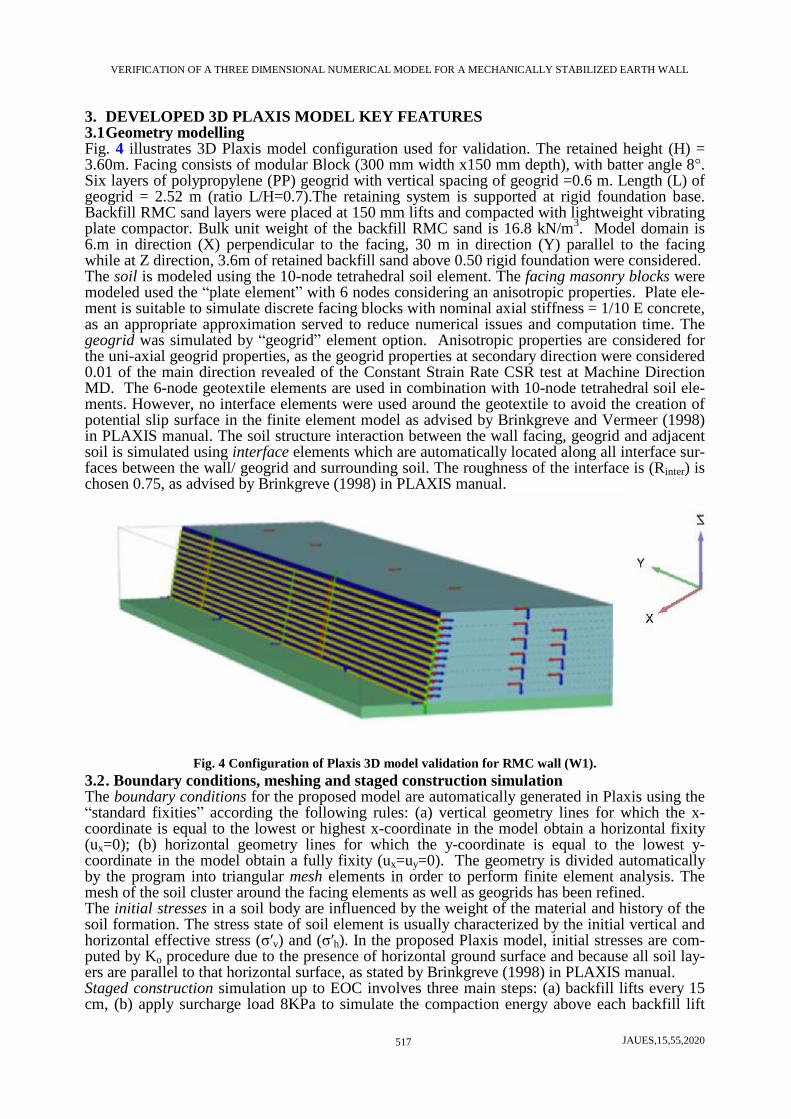
3. DEVELOPED 3D PLAXIS MODEL KEY FEATURES 3.1 Geometry modelling Fig. 4 illustrates 3D Plaxis model configuration used for validation. The retained height (H) = 3.60m. Facing consists of modular Block (300 mm width x150 mm depth), with batter angle 8°. Six layers of polypropylene (PP) geogrid with vertical spacing of geogrid =0.6 m. Length (L) of geogrid = 2.52 m (ratio L/H=0.7).The retaining system is supported at rigid foundation base. Backfill RMC sand layers were placed at 150 mm lifts and compacted with lightweight vibrating plate compactor. Bulk unit weight of the backfill RMC sand is 16.8 kN/m3. Model domain is 6.m in direction (X) perpendicular to the facing, 30 m in direction (Y) parallel to the facing while at Z direction, 3.6m of retained backfill sand above 0.50 rigid foundation were considered. The soil is modeled using the 10-node tetrahedral soil element. The facing masonry blocks were modeled used the “plate element” with 6 nodes considering an anisotropic properties. Plate ele-ment is suitable to simulate discrete facing blocks with nominal axial stiffness = 1/10 E concrete, as an appropriate approximation served to reduce numerical issues and computation time. The geogrid was simulated by “geogrid” element option. Anisotropic properties are considered for the uni-axial geogrid properties, as the geogrid properties at secondary direction were considered 0.01 of the main direction revealed of the Constant Strain Rate CSR test at Machine Direction MD. The 6-node geotextile elements are used in combination with 10-node tetrahedral soil ele-ments. However, no interface elements were used around the geotextile to avoid the creation of potential slip surface in the finite element model as advised by Brinkgreve and Vermeer (1998) in PLAXIS manual. The soil structure interaction between the wall facing, geogrid and adjacent soil is simulated using interface elements which are automatically located along all interface sur-faces between the wall/ geogrid and surrounding soil. The roughness of the interface is (Rinter) is chosen 0.75, as advised by Brinkgreve (1998) in PLAXIS manual.
Fig. 4 Configuration of Plaxis 3D model validation for RMC wall (W1).
3.2 . Boundary conditions, meshing and staged construction simulation The boundary conditions for the proposed model are automatically generated in Plaxis using the “standard fixities” according the following rules: (a) vertical geometry lines for which the x-coordinate is equal to the lowest or highest x-coordinate in the model obtain a horizontal fixity (ux=0); (b) horizontal geometry lines for which the y-coordinate is equal to the lowest y-coordinate in the model obtain a fully fixity (ux=uy=0). The geometry is divided automatically by the program into triangular mesh elements in order to perform finite element analysis. The mesh of the soil cluster around the facing elements as well as geogrids has been refined. The initial stresses in a soil body are influenced by the weight of the material and history of the soil formation. The stress state of soil element is usually characterized by the initial vertical and horizontal effective stress (σ′v) and (σ′h). In the proposed Plaxis model, initial stresses are com-puted by Ko procedure due to the presence of horizontal ground surface and because all soil lay-ers are parallel to that horizontal surface, as stated by Brinkgreve (1998) in PLAXIS manual. Staged construction simulation up to EOC involves three main steps: (a) backfill lifts every 15 cm, (b) apply surcharge load 8KPa to simulate the compaction energy above each backfill lift
VERIFICATION OF A THREE DIMENSIONAL NUMERICAL MODEL FOR A MECHANICALLY STABILIZED EARTH WALL
JAUES,15,55,2020
518
and (c) installation of the geogrid at spacing 60 cm. For EOL phase, surcharge loading was in-crementally applied of value 40, 50, 60 and 70 KPa to simulate the RMC wall test procedures. 3.3 Material characterization for backfill sand PLAXIS provides different soil models to simulate soil structure interaction including Mohr-Coulomb (MC) and Hardening Soil (HS). Each model represents the soil behavior throughout a set of parameters. HS model is selected to better simulate the proposed problem. The HS model parameters to be derived/ calibrated based on the tri-axil test developed by Hatami & Bathurst, 2005:
• ɸ' (deg.) = 40° (measured tri-axial friction angle). • ψ ' (deg.) =11° (dilation, measured tri-axial - range 10° to 13°). • c (kPa) 1.0 (assumed)
E50= Eref
50 ((c cos Ø – σ3' sin Ø)/ (c cos Ø + pref sin Ø)) m Equation 1
where: • E50 measured from Tri-axial test results. • Pref = σ3' (assumed) • m power factor shall be predicted by changing its order to get minimum (least) square of
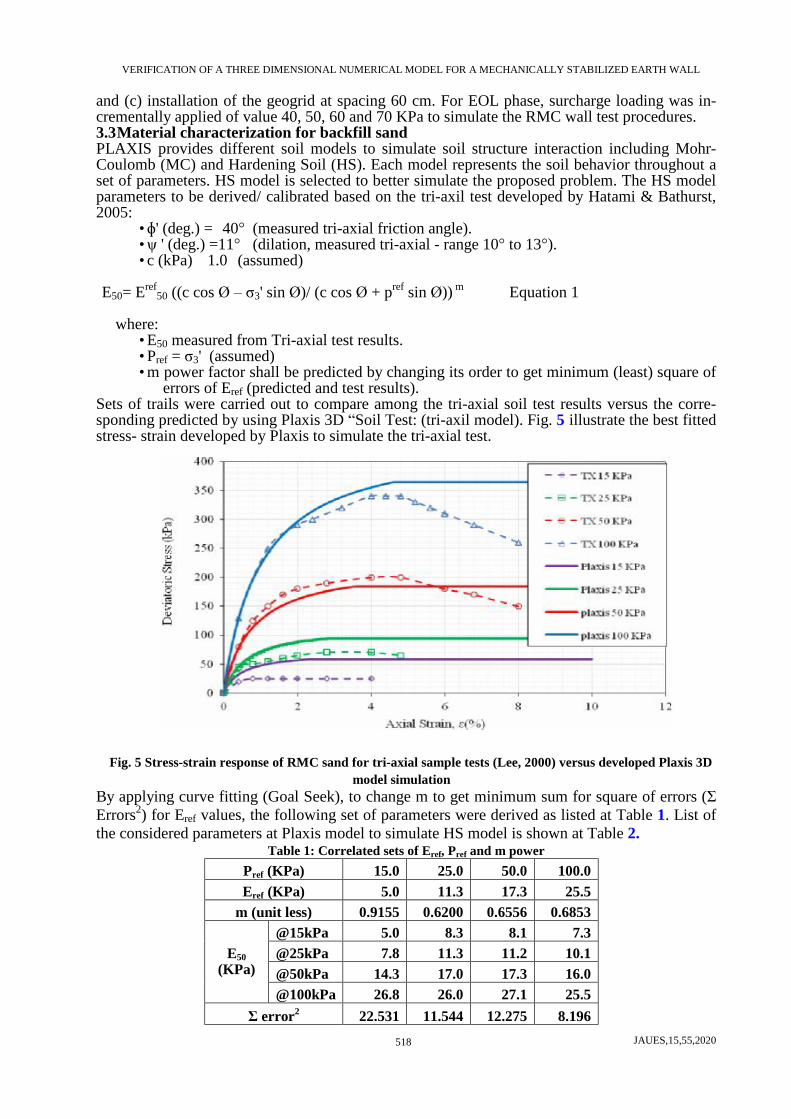
errors of Eref (predicted and test results). Sets of trails were carried out to compare among the tri-axial soil test results versus the corre-sponding predicted by using Plaxis 3D “Soil Test: (tri-axil model). Fig. 5 illustrate the best fitted stress- strain developed by Plaxis to simulate the tri-axial test.
Fig. 5 Stress-strain response of RMC sand for tri-axial sample tests (Lee, 2000) versus developed Plaxis 3D model simulation
By applying curve fitting (Goal Seek), to change m to get minimum sum for square of errors (Σ Errors2) for Eref values, the following set of parameters were derived as listed at Table 1. List of the considered parameters at Plaxis model to simulate HS model is shown at Table 2.
Table 1: Correlated sets of Eref, Pref and m power Pref (KPa) 15.0 25.0 50.0 100.0 Eref (KPa) 5.0 11.3 17.3 25.5
m (unit less) 0.9155 0.6200 0.6556 0.6853 @15kPa 5.0 8.3 8.1 7.3 @25kPa 7.8 11.3 11.2 10.1 @50kPa 14.3 17.0 17.3 16.0
E50 (KPa)
@100kPa 26.8 26.0 27.1 25.5 Σ error2 22.531 11.544 12.275 8.196

VERIFICATION OF A THREE DIMENSIONAL NUMERICAL MODEL FOR A MECHANICALLY STABILIZED EARTH WALL
JAUES,15,55,2020
519
Table 2: List of considered parameters for HS model based on best fitting of tri-axial test
Parameter unit value Parameter unit value
γunsat kN/m3 16.8 φ (phi) ° 40
γsat kN/m3 16.8 ψ (psi) ° 11
E50ref
kN/m2 1.13E+04 νur Unit less 0.2
Eoedref kN/m2 1.13E+04 pref kN/m2 25
Eurref kN/m2 3.39E+04 K0,x = K0,y Unit less 0.35
power (m) Unit less 0.62 Rf Unit less 0.85
cref kN/m2 1 Rinter Unit less 0.75 4. MODEL VERIFICATION RESULTS AND ANALYSIS The following sub-clauses are summary of the results of the model verification results. Fig. 6 presented global view of the induced displacement at Cartesian direction X and Z, respectively.
Fig. 6 General view of displacement (a) at Z direction and (b) at X direction.
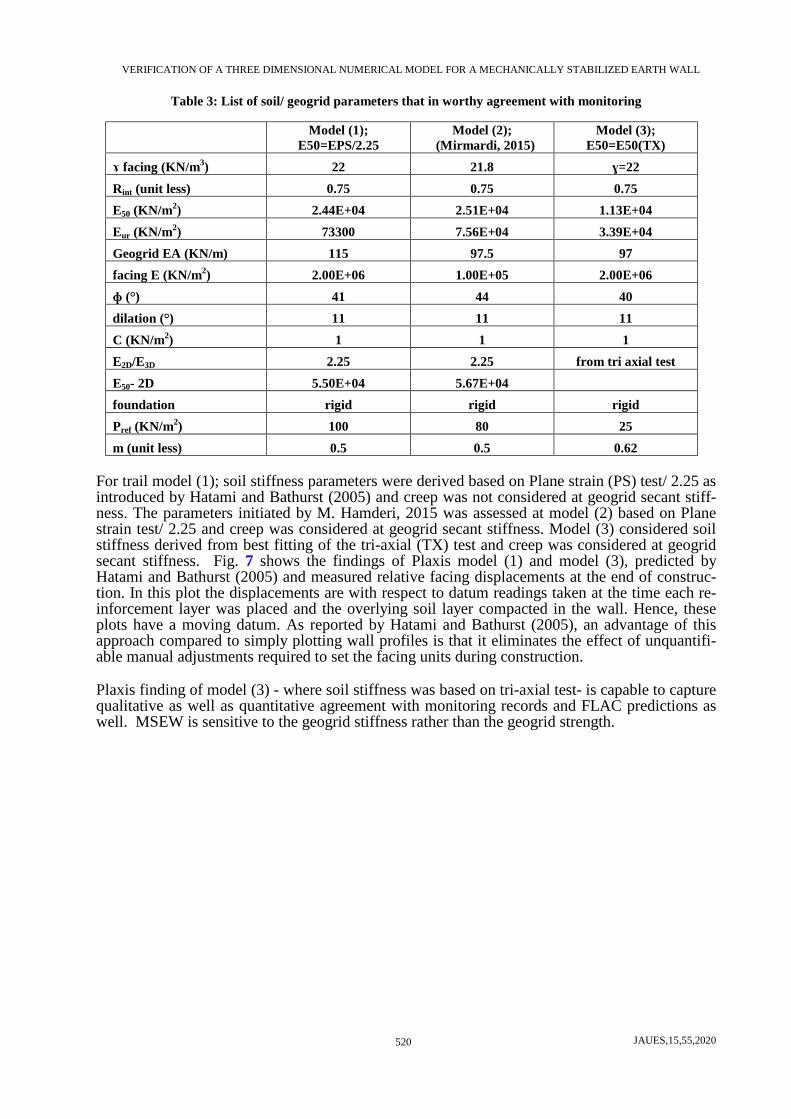
3.4 . Sensitivity study for relative displacement EOC. To get the numerical findings at worthy agreement with the monitoring records, some iterations were developed to study the sensitivity of some model features as: (a) Soil Constitutive models; Hardening Soil model HS and Mohr Coulomb MC, (b) ranges of Soil shear strength parameters, (c) ranges of Geo grid axial stiffness, (d) Interface coefficients, (e) Connection between succes-sive blocks, (f) Boundary conditions, Discretization aspects and mesh coarseness/ fineness and (g) Shear Strength and modulus of Sands in Tri-axial Compression / Plane Strain. List of the considered parameters for trails that provide agreement with the monitoring is shown at Table 3.
a b
VERIFICATION OF A THREE DIMENSIONAL NUMERICAL MODEL FOR A MECHANICALLY STABILIZED EARTH WALL
JAUES,15,55,2020
520
Table 3: List of soil/ geogrid parameters that in worthy agreement with monitoring
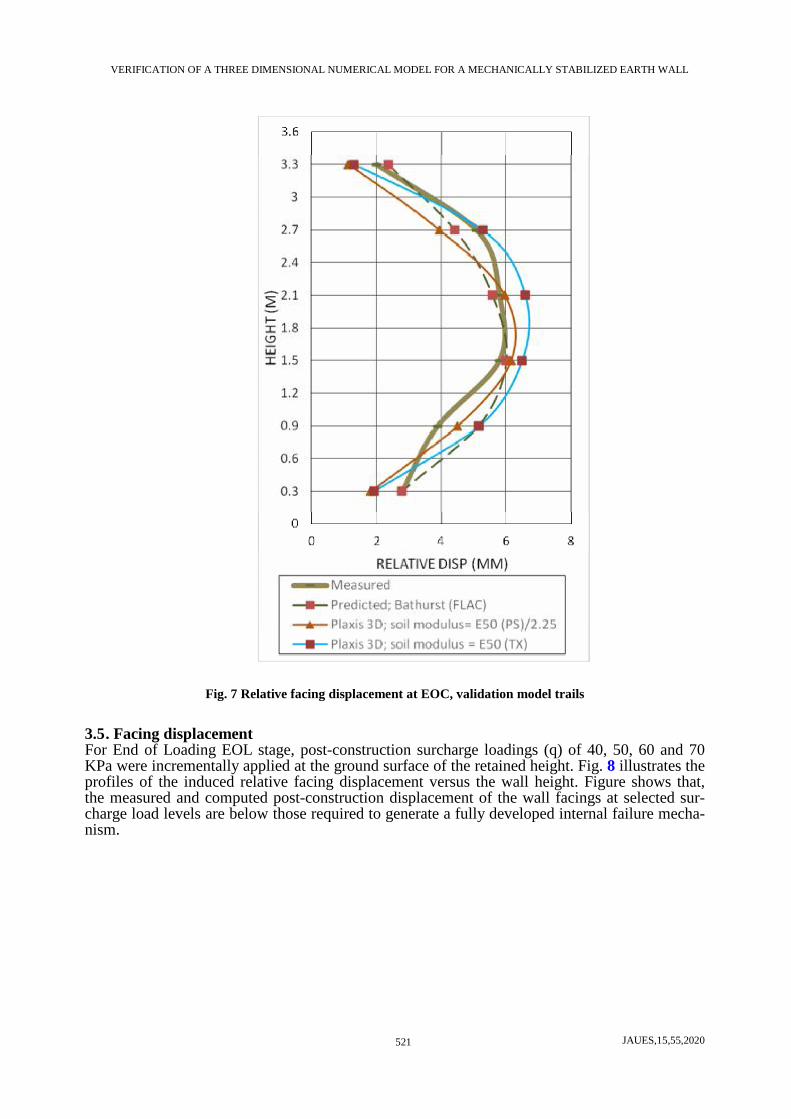
For trail model (1); soil stiffness parameters were derived based on Plane strain (PS) test/ 2.25 as introduced by Hatami and Bathurst (2005) and creep was not considered at geogrid secant stiff-ness. The parameters initiated by M. Hamderi, 2015 was assessed at model (2) based on Plane strain test/ 2.25 and creep was considered at geogrid secant stiffness. Model (3) considered soil stiffness derived from best fitting of the tri-axial (TX) test and creep was considered at geogrid secant stiffness. Fig. 7 shows the findings of Plaxis model (1) and model (3), predicted by Hatami and Bathurst (2005) and measured relative facing displacements at the end of construc-tion. In this plot the displacements are with respect to datum readings taken at the time each re-inforcement layer was placed and the overlying soil layer compacted in the wall. Hence, these plots have a moving datum. As reported by Hatami and Bathurst (2005), an advantage of this approach compared to simply plotting wall profiles is that it eliminates the effect of unquantifi-able manual adjustments required to set the facing units during construction.
Plaxis finding of model (3) - where soil stiffness was based on tri-axial test- is capable to capture qualitative as well as quantitative agreement with monitoring records and FLAC predictions as well. MSEW is sensitive to the geogrid stiffness rather than the geogrid strength.
Model (1);
E50=EPS/2.25 Model (2);
(Mirmardi, 2015) Model (3);
E50=E50(TX) ɤ facing (KN/m3) 22 21.8 ɣ=22 Rint (unit less) 0.75 0.75 0.75 E50 (KN/m2) 2.44E+04 2.51E+04 1.13E+04 Eur (KN/m2) 73300 7.56E+04 3.39E+04 Geogrid EA (KN/m) 115 97.5 97 facing E (KN/m2) 2.00E+06 1.00E+05 2.00E+06 ɸ (°) 41 44 40 dilation (°) 11 11 11 C (KN/m2) 1 1 1 E2D/E3D 2.25 2.25 from tri axial test E50- 2D 5.50E+04 5.67E+04 foundation rigid rigid rigid Pref (KN/m2) 100 80 25 m (unit less) 0.5 0.5 0.62
VERIFICATION OF A THREE DIMENSIONAL NUMERICAL MODEL FOR A MECHANICALLY STABILIZED EARTH WALL
JAUES,15,55,2020
521
Fig. 7 Relative facing displacement at EOC, validation model trails
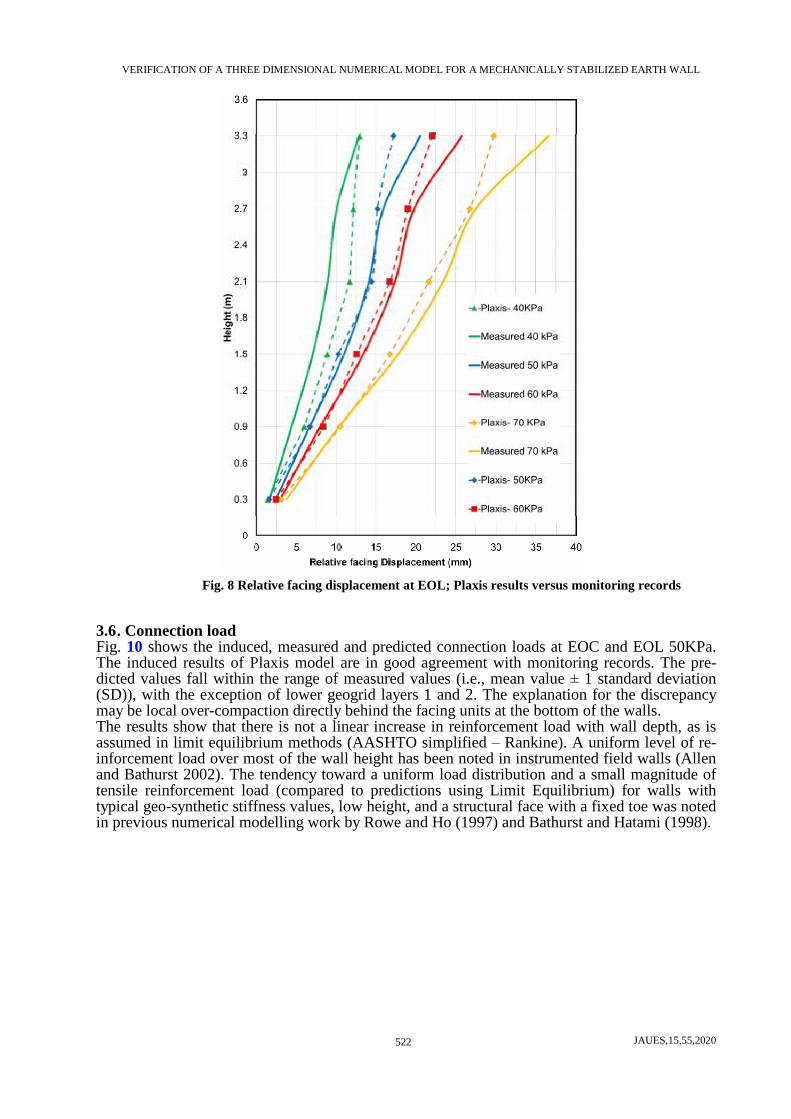
3.5 . Facing displacement For End of Loading EOL stage, post-construction surcharge loadings (q) of 40, 50, 60 and 70 KPa were incrementally applied at the ground surface of the retained height. Fig. 8 illustrates the profiles of the induced relative facing displacement versus the wall height. Figure shows that, the measured and computed post-construction displacement of the wall facings at selected sur-charge load levels are below those required to generate a fully developed internal failure mecha-nism.
VERIFICATION OF A THREE DIMENSIONAL NUMERICAL MODEL FOR A MECHANICALLY STABILIZED EARTH WALL
JAUES,15,55,2020
522
Fig. 8 Relative facing displacement at EOL; Plaxis results versus monitoring records
3.6 . Connection load Fig. 10 shows the induced, measured and predicted connection loads at EOC and EOL 50KPa. The induced results of Plaxis model are in good agreement with monitoring records. The pre-dicted values fall within the range of measured values (i.e., mean value ± 1 standard deviation (SD)), with the exception of lower geogrid layers 1 and 2. The explanation for the discrepancy may be local over-compaction directly behind the facing units at the bottom of the walls. The results show that there is not a linear increase in reinforcement load with wall depth, as is assumed in limit equilibrium methods (AASHTO simplified – Rankine). A uniform level of re-inforcement load over most of the wall height has been noted in instrumented field walls (Allen and Bathurst 2002). The tendency toward a uniform load distribution and a small magnitude of tensile reinforcement load (compared to predictions using Limit Equilibrium) for walls with typical geo-synthetic stiffness values, low height, and a structural face with a fixed toe was noted in previous numerical modelling work by Rowe and Ho (1997) and Bathurst and Hatami (1998).

VERIFICATION OF A THREE DIMENSIONAL NUMERICAL MODEL FOR A MECHANICALLY STABILIZED EARTH WALL
JAUES,15,55,2020
523
Fig. 10 Connection loads for EOC and EOL- 50KPa; Plaxis results versus monitoring records
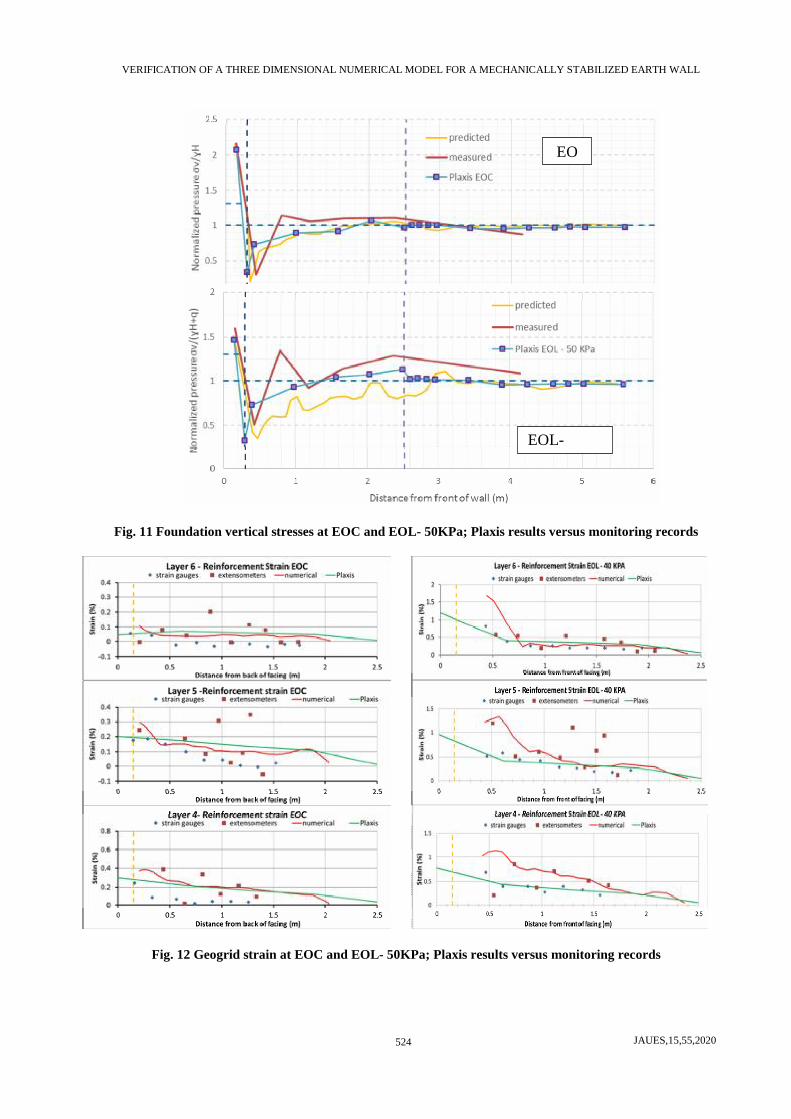
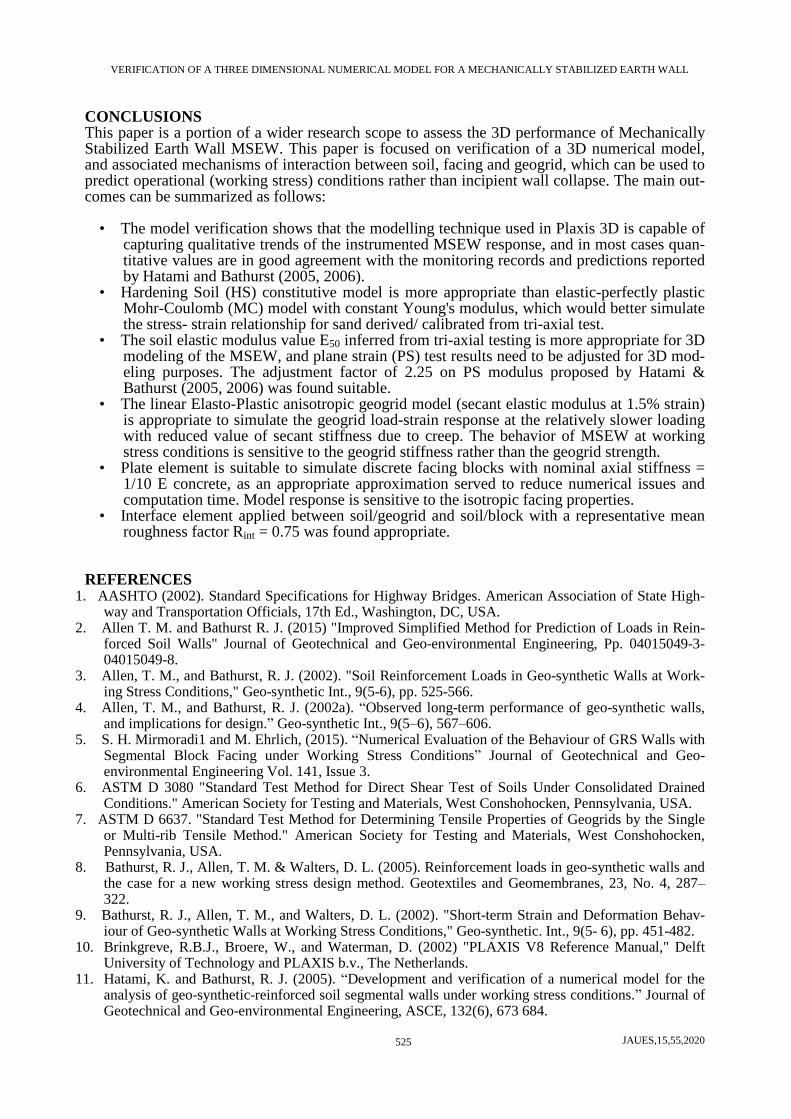
3.7 . Foundation vertical pressure Fig. 11 presents the induced, measured and predicted distributions of vertical contact pressures at the base of the soil backfill for EOC and EOL-50 KPa. Measured and predicted values of base pressure (σv) have been normalized against the vertical pressure due to soil self-weight, γsH. The facing column zone revealed measured loads were higher as a result of the greater unit weight of the facing units (γb) versus the backfill soil (γs) and down-drag forces mobilized by differential settlements between wall facing elements (resting on rigid foundation pad) and backfill soil, as stated by Hatami and Bathurst 2005. The physical test results show a local peak vertical stress in excess of the reference pressure (γsH) 1 m behind the facing that was not properly captured by the numerical results. The physi-cal test results may have been affected by a soil–instrumentation interaction that resulted in a soil arching mechanism between the back of the facing and the rigid foundation base. Except for a local reduction immediately outside the reinforced zone, the foundation contact pressure is es-sentially constant throughout the retained zone, with a magnitude corresponding to the soil depth. A local drop in the magnitude of the vertical earth pressure at the foundation immediately behind the reinforced zone was also reported by Ho and Rowe (1996), who attributed it to the action of lateral thrust behind the reinforced soil block. 3.8 . Geogrid strain Fig. 12 plotted the geogrid induced strains versus the monitoring records (strain gauges & exten-someter), predictions and PLAXIS for sample layers 4, 5 & 6 at EOC and EOL- 40KPa.
VERIFICATION OF A THREE DIMENSIONAL NUMERICAL MODEL FOR A MECHANICALLY STABILIZED EARTH WALL
JAUES,15,55,2020
524
Fig. 11 Foundation vertical stresses at EOC and EOL- 50KPa; Plaxis results versus monitoring records
Fig. 12 Geogrid strain at EOC and EOL- 50KPa; Plaxis results versus monitoring records
EO
EOL- 50KPA
VERIFICATION OF A THREE DIMENSIONAL NUMERICAL MODEL FOR A MECHANICALLY STABILIZED EARTH WALL
JAUES,15,55,2020
525
CONCLUSIONS This paper is a portion of a wider research scope to assess the 3D performance of Mechanically Stabilized Earth Wall MSEW. This paper is focused on verification of a 3D numerical model, and associated mechanisms of interaction between soil, facing and geogrid, which can be used to predict operational (working stress) conditions rather than incipient wall collapse. The main out-comes can be summarized as follows:
• The model verification shows that the modelling technique used in Plaxis 3D is capable of capturing qualitative trends of the instrumented MSEW response, and in most cases quan-titative values are in good agreement with the monitoring records and predictions reported by Hatami and Bathurst (2005, 2006).
• Hardening Soil (HS) constitutive model is more appropriate than elastic-perfectly plastic Mohr-Coulomb (MC) model with constant Young's modulus, which would better simulate the stress- strain relationship for sand derived/ calibrated from tri-axial test.
• The soil elastic modulus value E50 inferred from tri-axial testing is more appropriate for 3D modeling of the MSEW, and plane strain (PS) test results need to be adjusted for 3D mod-eling purposes. The adjustment factor of 2.25 on PS modulus proposed by Hatami & Bathurst (2005, 2006) was found suitable.
• The linear Elasto-Plastic anisotropic geogrid model (secant elastic modulus at 1.5% strain) is appropriate to simulate the geogrid load-strain response at the relatively slower loading with reduced value of secant stiffness due to creep. The behavior of MSEW at working stress conditions is sensitive to the geogrid stiffness rather than the geogrid strength.
• Plate element is suitable to simulate discrete facing blocks with nominal axial stiffness = 1/10 E concrete, as an appropriate approximation served to reduce numerical issues and computation time. Model response is sensitive to the isotropic facing properties.
• Interface element applied between soil/geogrid and soil/block with a representative mean roughness factor Rint = 0.75 was found appropriate.
REFERENCES 1. AASHTO (2002). Standard Specifications for Highway Bridges. American Association of State High-
way and Transportation Officials, 17th Ed., Washington, DC, USA. 2. Allen T. M. and Bathurst R. J. (2015) "Improved Simplified Method for Prediction of Loads in Rein-
forced Soil Walls" Journal of Geotechnical and Geo-environmental Engineering, Pp. 04015049-3- 04015049-8.
3. Allen, T. M., and Bathurst, R. J. (2002). "Soil Reinforcement Loads in Geo-synthetic Walls at Work-ing Stress Conditions," Geo-synthetic Int., 9(5-6), pp. 525-566.
4. Allen, T. M., and Bathurst, R. J. (2002a). “Observed long-term performance of geo-synthetic walls, and implications for design.” Geo-synthetic Int., 9(5–6), 567–606.
5. S. H. Mirmoradi1 and M. Ehrlich, (2015). “Numerical Evaluation of the Behaviour of GRS Walls with Segmental Block Facing under Working Stress Conditions” Journal of Geotechnical and Geo-environmental Engineering Vol. 141, Issue 3.
6. ASTM D 3080 "Standard Test Method for Direct Shear Test of Soils Under Consolidated Drained Conditions." American Society for Testing and Materials, West Conshohocken, Pennsylvania, USA.
7. ASTM D 6637. "Standard Test Method for Determining Tensile Properties of Geogrids by the Single or Multi-rib Tensile Method." American Society for Testing and Materials, West Conshohocken, Pennsylvania, USA.
8. Bathurst, R. J., Allen, T. M. & Walters, D. L. (2005). Reinforcement loads in geo-synthetic walls and the case for a new working stress design method. Geotextiles and Geomembranes, 23, No. 4, 287–322.
9. Bathurst, R. J., Allen, T. M., and Walters, D. L. (2002). "Short-term Strain and Deformation Behav-iour of Geo-synthetic Walls at Working Stress Conditions," Geo-synthetic. Int., 9(5- 6), pp. 451-482.
10. Brinkgreve, R.B.J., Broere, W., and Waterman, D. (2002) "PLAXIS V8 Reference Manual," Delft University of Technology and PLAXIS b.v., The Netherlands.
11. Hatami, K. and Bathurst, R. J. (2005). “Development and verification of a numerical model for the analysis of geo-synthetic-reinforced soil segmental walls under working stress conditions.” Journal of Geotechnical and Geo-environmental Engineering, ASCE, 132(6), 673 684.

VERIFICATION OF A THREE DIMENSIONAL NUMERICAL MODEL FOR A MECHANICALLY STABILIZED EARTH WALL
JAUES,15,55,2020
526
12. Hatami, K. and Bathurst, R. J. (2006). “Numerical model for reinforced soil segmental walls under surcharge loading.” Canadian Geotechnical Journal, 67(4), 1066 1085.
13. Huang, B., Bathurst, R.J., and Hatami K. (2009). "Numerical Study of Reinforced Soil Segmental Walls Using Three Different Constitutive Soil Models," Journal of Geotechnical and Geo-environmental Engineering, Vol. 135, No. 10, 0ctober 1.
14. Lee, W. F., Holtz, R.D., and Allen, T. M. (1999). "Full Scale Geo-synthetic Reinforced Retaining Walls: A Numerical Parametric Study," Proceedings of Geosynthetics'99, Boston, Vol. 2, pp. 935-948.