journal of american science 2017;13(9) ... of american science 2017;13(9) 83 rapidly growing...
TRANSCRIPT

Journal of American Science 2017;13(9) http://www.jofamericanscience.org
82
Long Term Measurements Of Ambient Air Pollutants Near A Developing Industrial Township Of District Haridwar, India
Sadhna Awasthi, P. C. Joshi, Chhavi P. Pandey1, Narendra Singh2, Hemwati Nandan3
Department of Zoology & Environmental Sciences, Gurukula Kangri University, Haridwar, India -249404 1Department of Physics, Kanya Gurukula Campus, Gurukula Kangri University, Haridwar, India-249404
2Aryabhatta Research Institute of Observational Sciences, Manora Peak, Nainital, India -263002 3Department of Physics, Gurukula Kangri University, Haridwar, India -249404
Phone: +91-9012677665; [email protected]; [email protected]
Abstract: The aim of the present investigation is to elucidate the persistent increase in the concentration of particulate matter and gaseous pollutants in an area fastly developing as an industrial belt in district Haridwar after the development of State Industrial Development Corporation of Uttarakhand (SIDCUL) in 2002. An attempt is made to analyze the increase in the level of ambient air pollutants such as suspended particulate matter (SPM), respirable suspended particulate matter (RSPM) and the concentration of gaseous pollutants (SO2 and NOX), during a period of six consecutive years (2003-2009) at Bahadarabad, this area is located in close vicinity of Haridwar city on Delhi-Haridwar National Highway (NH-58) in Uttarakhand. The concentration of these parameters is found to increase significantly by manifold over a period of six years of measurements. The concentrations of SPM and RSPM are compared with the concentration of gaseous pollutants SO2 and NOX. A detailed statistical analysis has been carried out on the basis of monthly average values of the observed pollutants and it is observed that the SPM and RSPM show significant positive correlation with SO2 and NOx concentration. The values of the correlation coefficient for all possible correlations among the particulate matter and the gaseous pollutants are found to be in the range 0.86 to 0.77. [Sadhna Awasthi, P. C. Joshi Chhavi P. Pandey, Narendra Singh, Hemwati Nandan. Long Term Measurements Of Ambient Air Pollutants Near A Developing Industrial Township Of District Haridwar, India. J Am Sci 2017;13(9):82-89]. ISSN 1545-1003 (print); ISSN 2375-7264 (online). http://www.jofamericanscience.org. 10. doi:10.7537/marsjas130917.10. Keywords: Gaseous pollutants (GPs), Particulate Matter (PM), Industrial Emissions, Statistical Analysis.
1. Introduction
Any physical, biological or chemical alteration of air present in the Earth's atmosphere is in general termed as ‘air pollution’. The air pollutants are usually categorized as primary pollutants and secondary pollutants. The presence of such pollutants makes a disturbance in Earth's own natural ecosystem, which turns into harmful effects. Air pollution may therefore directly affect the humans and even plants via leaves or indirectly via soil acidification (Steubing et al. 1989; Chauhan and Joshi, 2008; Joshi et al. 2009) and is, therefore, a global issue. In particular, the study of SPM in the air which is termed as aerosols is one of the important issues in current research in the environmental sciences mainly due to their effects on local weather and global climate. Aerosols not only cause the air pollution but are also believed to affect the earth’s climate system in a diversified manner since they are involved in the cloud formation and precipitation as cloud condensation and ice nuclei. The impacts of aerosols do not remain really confined to source regions and national boundaries; the problem thus turns to be a matter of global interest
(Mitra and Sharma 2002; Nair et al. 2006). In addition to this, the aerosols also pose a serious problem for
the human health mainly in the form of respiratory, circulatory and allergic diseases, which are increasing day by day. The aerosols are also responsible for poor visibility, which can be easily noticed in hazy view of highly polluted areas mainly located near the industrial sites. The aerosols in the environment originate mainly from natural and anthropogenic sources available around. The aerosols have been called the particulate matter is sized mainly in two categories as PM10 and PM2.5. The study of aerosol particle size distribution and their chemical composition in the urban areas in the different parts of the world is an important issue since it affects the radiation budget of the earth as well. In fact, the chemical properties of aerosols may vary depending on sources of particles and it is worth noticing that the particulates are not one particular chemical substance, but a classification of particles in view of their size rather than chemical properties (Stern 1976; Godish 1985; Takemura et al. 2007).
The primary aim of this study is to provide the status of air pollution in Bahadrabad area of Haridwar city located in the Indo-Gangetic plain in North India. The air quality has also badly been affected mainly due to the emission of different air pollutants in the
Journal of American Science 2017;13(9) http://www.jofamericanscience.org
83
rapidly growing industrial area of State Industrial Development Corporation of Uttarakhand (SIDCUL) after the emergence of the Uttarakhand state in 2000 and subsequently the industrial set up established in 2002. The industrial pollutants such as SPM, RSPM, SOx, and NOx have been regularly monitored in the SIDCUL area during the period of six years using a Respirable Dust sampler (RDS) APM-460 under the field program of Gurukul Kangri University, Haridwar.
In fact, Haridwar is a very crowded city throughout the year and millions of pilgrims every year visit the place, hence it becomes essential to have measurements of hazardous substances both gaseous and particulate in a long term. For the first time, after the establishment of SIDCUL, such a long-term study is being carried out. In the present paper, the data of the concentration of NOx, SOx, SPM and RSPM over a period of six consecutive years (2003-2009) in the State Industrial Development Corporation Limited (SIDCUL) which is an Industrial area in Haridwar, Uttarakhand, India is analyzed statistically with air mass back trajectories.
2. Materials and Methods 2.1 Site description and synoptic atmospheric features
The present study was conducted in the SIDCUL area (Bahadarabad) of Haridwar district in Uttarakhand, India. The city of Haridwar is situated between 29°30´ N to 30°15´ N latitude and 78° 43´ E to 78° 20´ E longitudes and is about 60 km in length from east to west and about 80 km in width from north to south at an altitude of 294.7 m. The census conducted in 2002 indicates the total population of Haridwar district as 14, 47, 187 (Joshi and Swami 2007) and which must have now been multiplied during past years.
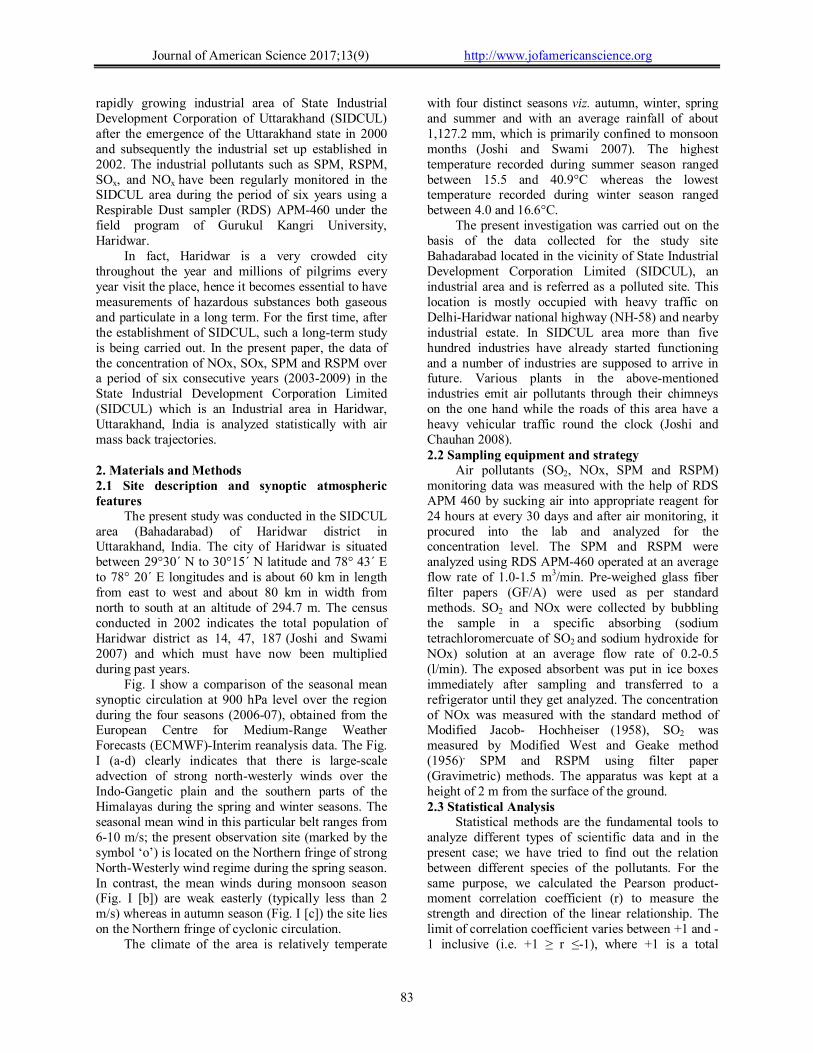
Fig. I show a comparison of the seasonal mean synoptic circulation at 900 hPa level over the region during the four seasons (2006-07), obtained from the European Centre for Medium-Range Weather Forecasts (ECMWF)-Interim reanalysis data. The Fig. I (a-d) clearly indicates that there is large-scale advection of strong north-westerly winds over the Indo-Gangetic plain and the southern parts of the Himalayas during the spring and winter seasons. The seasonal mean wind in this particular belt ranges from 6-10 m/s; the present observation site (marked by the symbol ‘o’) is located on the Northern fringe of strong North-Westerly wind regime during the spring season. In contrast, the mean winds during monsoon season (Fig. I [b]) are weak easterly (typically less than 2 m/s) whereas in autumn season (Fig. I [c]) the site lies on the Northern fringe of cyclonic circulation.
The climate of the area is relatively temperate
with four distinct seasons viz. autumn, winter, spring and summer and with an average rainfall of about 1,127.2 mm, which is primarily confined to monsoon months (Joshi and Swami 2007). The highest temperature recorded during summer season ranged between 15.5 and 40.9°C whereas the lowest temperature recorded during winter season ranged between 4.0 and 16.6°C.
The present investigation was carried out on the basis of the data collected for the study site Bahadarabad located in the vicinity of State Industrial Development Corporation Limited (SIDCUL), an industrial area and is referred as a polluted site. This location is mostly occupied with heavy traffic on Delhi-Haridwar national highway (NH-58) and nearby industrial estate. In SIDCUL area more than five hundred industries have already started functioning and a number of industries are supposed to arrive in future. Various plants in the above-mentioned industries emit air pollutants through their chimneys on the one hand while the roads of this area have a heavy vehicular traffic round the clock (Joshi and Chauhan 2008). 2.2 Sampling equipment and strategy
Air pollutants (SO2, NOx, SPM and RSPM) monitoring data was measured with the help of RDS APM 460 by sucking air into appropriate reagent for 24 hours at every 30 days and after air monitoring, it procured into the lab and analyzed for the concentration level. The SPM and RSPM were analyzed using RDS APM-460 operated at an average flow rate of 1.0-1.5 m3/min. Pre-weighed glass fiber filter papers (GF/A) were used as per standard methods. SO2 and NOx were collected by bubbling the sample in a specific absorbing (sodium tetrachloromercuate of SO2 and sodium hydroxide for NOx) solution at an average flow rate of 0.2-0.5 (l/min). The exposed absorbent was put in ice boxes immediately after sampling and transferred to a refrigerator until they get analyzed. The concentration of NOx was measured with the standard method of Modified Jacob- Hochheiser (1958), SO2 was measured by Modified West and Geake method (1956), SPM and RSPM using filter paper (Gravimetric) methods. The apparatus was kept at a height of 2 m from the surface of the ground. 2.3 Statistical Analysis
Statistical methods are the fundamental tools to analyze different types of scientific data and in the present case; we have tried to find out the relation between different species of the pollutants. For the same purpose, we calculated the Pearson product-moment correlation coefficient (r) to measure the strength and direction of the linear relationship. The limit of correlation coefficient varies between +1 and -1 inclusive (i.e. +1 ≥ r ≤-1), where +1 is a total

Journal of American Science 2017;13(9) http://www.jofamericanscience.org
84
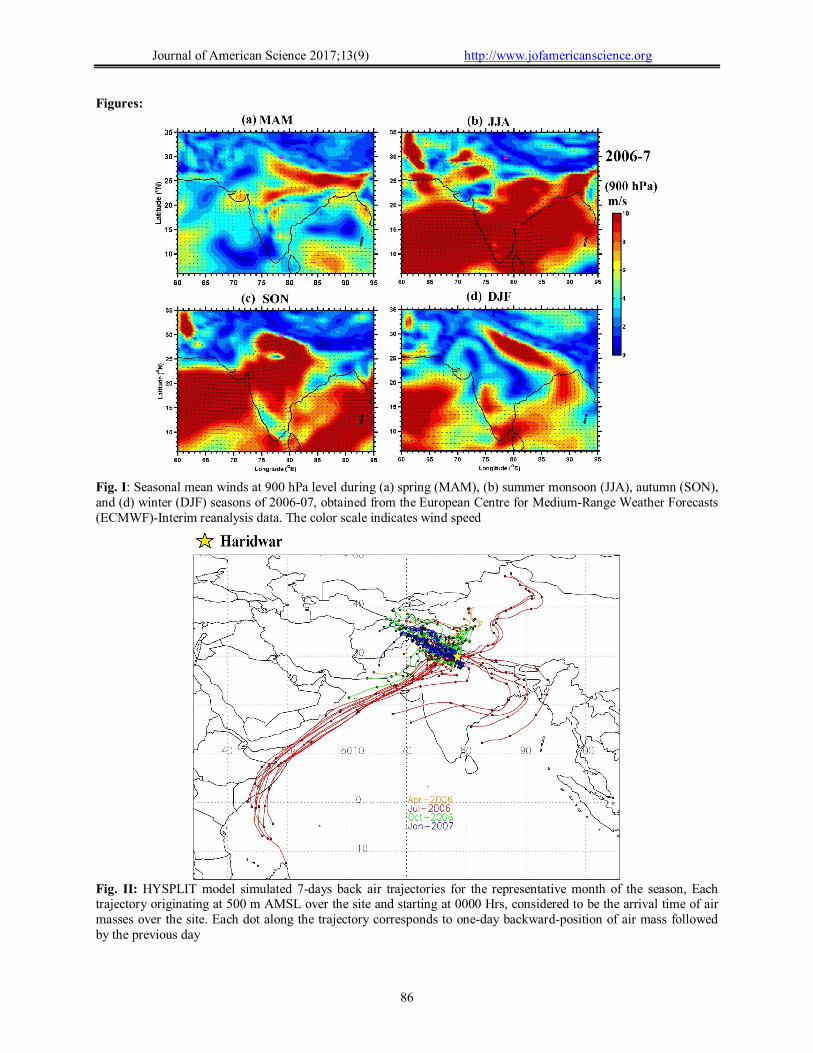
positive correlation, 0 is no correlation and -1 is a total negative correlation. The correlation is only applicable to the linear relationships. But before analyzing the correlation between the variables, it is important to know the linearity of the data set and one of the best ways for this task is to analyze scattergram. It may suggest various kinds of correlations between variables with a certain confidence level. The Fig. III represents the scatter plot between time (single observation per month) and concentration (μg/m3) for different pollutant species.
By applying the well-known method of least square the regression parameters A and B of the straight line Y=AX+B were computed. The correlation coefficient (r) and regression coefficients (A and B) between gaseous pollutants and particulate matter are presented in Tables I and II respectively. The statistical software R (R Core Team, 2013) is used to compute the correlation for all possible combination among SO2, NOX, SPM and RSPM and for a graphical presentation we have used GNUPLOT
(Williams and Kelley, 2011). 2.4Air mass back trajectory analysis
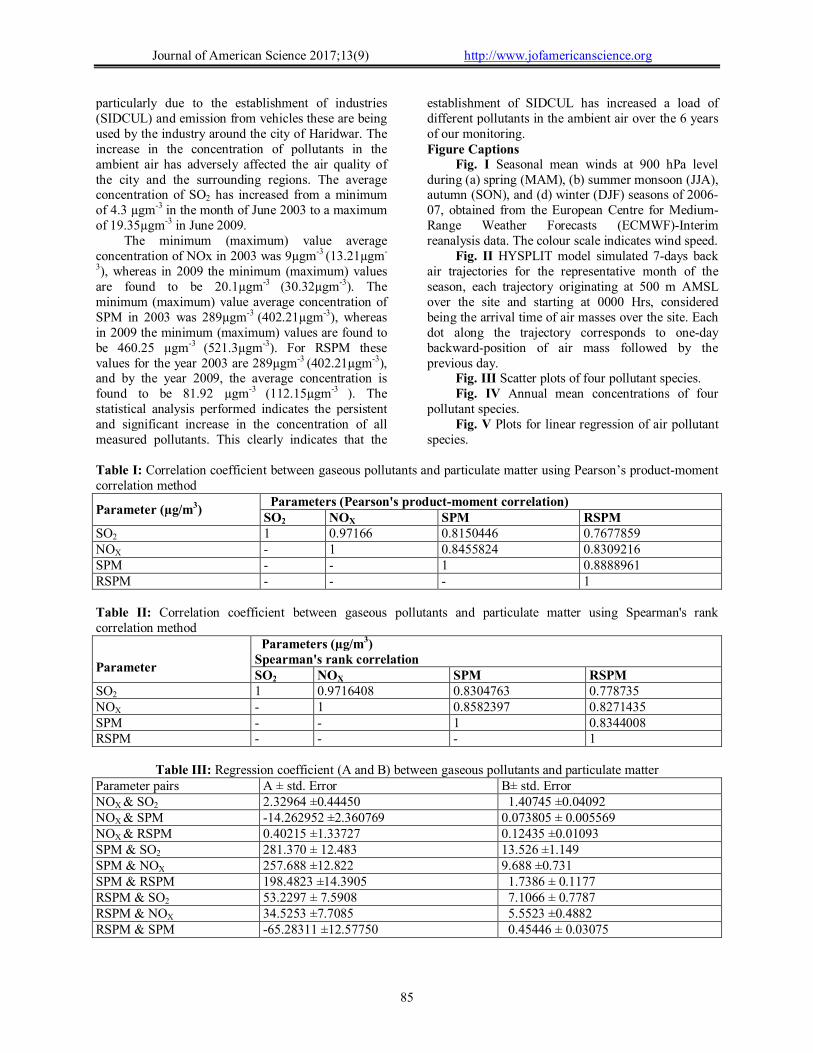
In order to attribute the possible sources of aerosol over the site, we have analyzed 7-day iso-sigma back air trajectory simulated using the Hybrid Single Particle Lagrangian Integrated Trajectory (HYSPLIT) model (Draxler and Rolph,2003) for different seasons during the representative months for each season (April, July, October and January) of the year 2006-07. NCEP reanalysis data (2.5º x 2.5º spatial and 6 Hour temporal resolution) has been utilized as input for the model. Fig. II shows the back air trajectory originating from the site at 500 m AMSL. The trajectories depict maximum spread in the monsoon season when the air mass arrives from Saudi Arabia and the Bay of Bengal. However, in other representative months of spring autumn and winter season, the air mass generally arrives from the northwest direction traveling through Northern Pakistan, Punjab, and Haryana, with least spread in the month of January-2007.
3. Results and Discussion
It is observed that over the years particularly after the industrial era, the concentration of SO2 has almost become double; NOx has increased 2-2.5 times, while RSPM & SPM have increased 1.5-1.7 times, during all seasons over the period of study. However, all species witnesses the highest concentration during spring months of every year. This may be due to the long range transport of pollutants as may be understood through the general patterns of the winds during different seasons of the year, given by Fig. I. This is also corroborated by the back air trajectory analysis depicted by Fig. II. In the
spring and summer seasons the pollutants are convectively lifted up into the higher altitudes in the atmosphere and advected in the horizontal with the winds, and contributing to the regional scale. However, the contribution from long-range transport is supposed to be very less in comparison to that by industries.
In order to understand the relation between gaseous and particulate matter correlation coefficient have been derived using Pearson’s product-moment method, and the details are given in Table I. It is found that SO2 and NOx are highly correlated (0.97), whereas the correlation between SO2 and RSPM, SO2
and SPM is between 0.76 and 0.84. A similar correlation is found between NOx and RSPM, NOx and SPM, indicating that increase in one species is associated with an increase of the other. Similar analysis has been carried out by using Spearman's rank correlation method and the correlations are found to be slightly better than the Pearson’s method. Regression analysis among the gaseous and particulate pollutants has been carried out and results within the error are given in Table II.
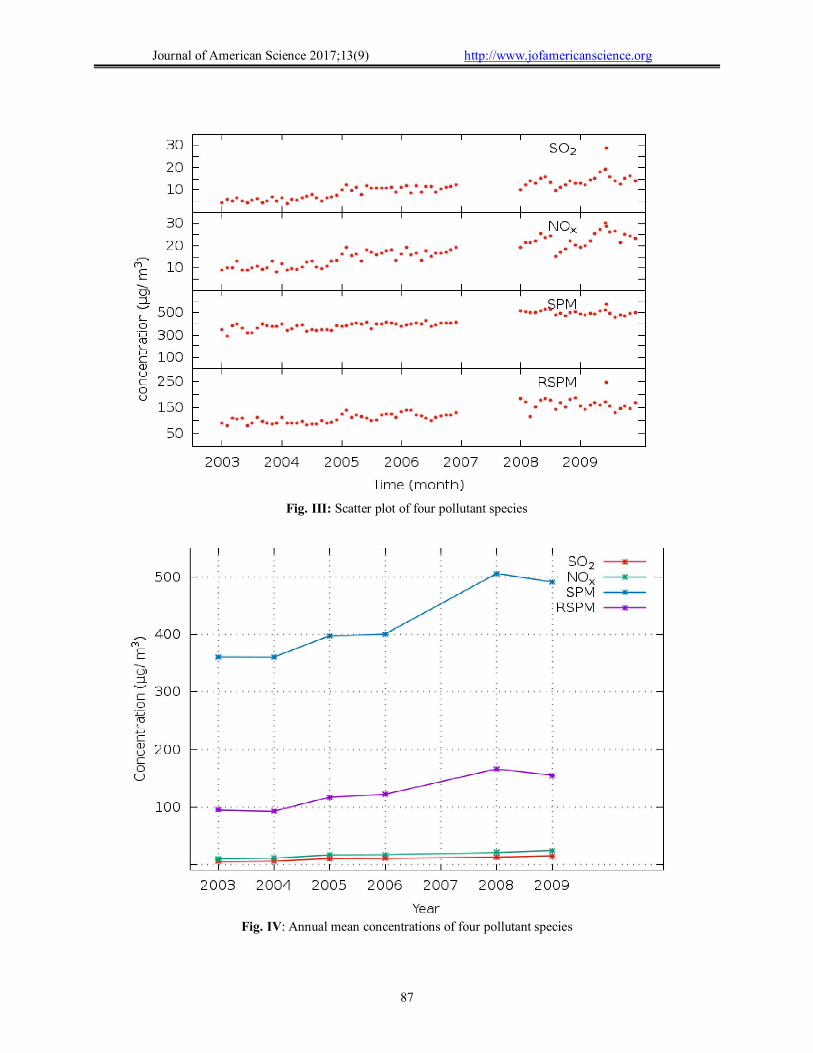
Fig. III represents the scatter plot for all four species and indicates that there is a consistent increase in the four pollutant species during 2003-09; however, occasionally very high values are also seen. The concentration of RSPM has increased from about 100 to 200 µg/m3, the concentration of SPM from about 300 to 500 µg/m3. In Fig. IV, the annual mean concentration of the pollutants is given, and it is evident from the figure that average concentration of SO2 and NOx has increased from 10 to about 20 µg/m3 over six years. Between 2006 and 2008 the maximum rise in the concentration of SPM and RSPM is found, indicating the excessive loading of particulate matter in the lower atmosphere.
Linear regression analysis is presented in Fig. V which clearly indicates that high values of the coefficients A and B (2.33) are observed NOx vs. SO2.
However, for NOx versus RSPM and SPM coefficient B has got negative values. For SPM vs. rest of the species, the y-intercept is positive and significantly high in all cases. Similarly, RSPM is also having a positive intercept with NOx and SO2 and negative intercept with SPM, indicating that the initial concentration of SPM relative to SPM is relatively higher. The pollutants are displaying a linear growth over the period of time, however, interdependence is also seen among the particulate and gaseous pollutants, indicating that the source of the particulate matter (RSPM and SPM) are most likely to be located in the same region. The six years of measurements on the gaseous and particulate matter are presented and found to show the significant increase in the concentration of these pollutants in the ambient air,
Journal of American Science 2017;13(9) http://www.jofamericanscience.org
85
particularly due to the establishment of industries (SIDCUL) and emission from vehicles these are being used by the industry around the city of Haridwar. The increase in the concentration of pollutants in the ambient air has adversely affected the air quality of the city and the surrounding regions. The average concentration of SO2 has increased from a minimum of 4.3 µgm-3 in the month of June 2003 to a maximum of 19.35µgm-3 in June 2009.
The minimum (maximum) value average concentration of NOx in 2003 was 9µgm-3 (13.21µgm-
3), whereas in 2009 the minimum (maximum) values are found to be 20.1µgm-3 (30.32µgm-3). The minimum (maximum) value average concentration of SPM in 2003 was 289µgm-3 (402.21µgm-3), whereas in 2009 the minimum (maximum) values are found to be 460.25 µgm-3 (521.3µgm-3). For RSPM these values for the year 2003 are 289µgm-3 (402.21µgm-3), and by the year 2009, the average concentration is found to be 81.92 µgm-3 (112.15µgm-3 ). The statistical analysis performed indicates the persistent and significant increase in the concentration of all measured pollutants. This clearly indicates that the
establishment of SIDCUL has increased a load of different pollutants in the ambient air over the 6 years of our monitoring. Figure Captions
Fig. I Seasonal mean winds at 900 hPa level during (a) spring (MAM), (b) summer monsoon (JJA), autumn (SON), and (d) winter (DJF) seasons of 2006-07, obtained from the European Centre for Medium-Range Weather Forecasts (ECMWF)-Interim reanalysis data. The colour scale indicates wind speed.
Fig. II HYSPLIT model simulated 7-days back air trajectories for the representative month of the season, each trajectory originating at 500 m AMSL over the site and starting at 0000 Hrs, considered being the arrival time of air masses over the site. Each dot along the trajectory corresponds to one-day backward-position of air mass followed by the previous day.
Fig. III Scatter plots of four pollutant species. Fig. IV Annual mean concentrations of four
pollutant species. Fig. V Plots for linear regression of air pollutant
species. Table I: Correlation coefficient between gaseous pollutants and particulate matter using Pearson’s product-moment correlation method
Parameter (µg/m3) Parameters (Pearson's product-moment correlation) SO2 NOX SPM RSPM
SO2 1 0.97166 0.8150446 0.7677859 NOX - 1 0.8455824 0.8309216 SPM - - 1 0.8888961 RSPM - - - 1
Table II: Correlation coefficient between gaseous pollutants and particulate matter using Spearman's rank correlation method
Parameter
Parameters (µg/m3) Spearman's rank correlation SO2 NOX SPM RSPM
SO2 1 0.9716408 0.8304763 0.778735 NOX - 1 0.8582397 0.8271435 SPM - - 1 0.8344008 RSPM - - - 1
Table III: Regression coefficient (A and B) between gaseous pollutants and particulate matter
Parameter pairs A ± std. Error B± std. Error NOX & SO2 2.32964 ±0.44450 1.40745 ±0.04092 NOX & SPM -14.262952 ±2.360769 0.073805 ± 0.005569 NOX & RSPM 0.40215 ±1.33727 0.12435 ±0.01093 SPM & SO2 281.370 ± 12.483 13.526 ±1.149 SPM & NOX 257.688 ±12.822 9.688 ±0.731 SPM & RSPM 198.4823 ±14.3905 1.7386 ± 0.1177 RSPM & SO2 53.2297 ± 7.5908 7.1066 ± 0.7787 RSPM & NOX 34.5253 ±7.7085 5.5523 ±0.4882 RSPM & SPM -65.28311 ±12.57750 0.45446 ± 0.03075
Journal of American Science 2017;13(9) http://www.jofamericanscience.org
86
Figures:
Fig. I: Seasonal mean winds at 900 hPa level during (a) spring (MAM), (b) summer monsoon (JJA), autumn (SON), and (d) winter (DJF) seasons of 2006-07, obtained from the European Centre for Medium-Range Weather Forecasts (ECMWF)-Interim reanalysis data. The color scale indicates wind speed
Fig. II: HYSPLIT model simulated 7-days back air trajectories for the representative month of the season, Each trajectory originating at 500 m AMSL over the site and starting at 0000 Hrs, considered to be the arrival time of air masses over the site. Each dot along the trajectory corresponds to one-day backward-position of air mass followed by the previous day
Journal of American Science 2017;13(9) http://www.jofamericanscience.org
87
Fig. III: Scatter plot of four pollutant species
Fig. IV: Annual mean concentrations of four pollutant species

Journal of American Science 2017;13(9) http://www.jofamericanscience.org
88
Fig. V: Plots for linear regression of air pollutant species.
4. Acknowledgments
The authors are thankful to the University Grants Commission, New Delhi for providing financial support to carry out the present work.
Corresponding Author Sadhna Awasthi C/O Prof. P.C. Joshi Department of Zoology & Environmental Science, Gurukula Kangri University, Haridwar, India -249404 Phone: +91-9012677665 [email protected]; [email protected] References 1. Chauhan, A. and Joshi, P. C. (2008). Air quality
index and its variation in Haridwar. Journal of Environment and Biosciences. 22 (2), 171-176.
2. Draxler, R.R., Rolph GD. (2003) HYSPLIT (Hybrid Single-Particle Lagrangian Integrated Trajectory) model, Air Resour. Lab., NOAA, Silver Spring, Md.
(http://www.arl.noaa.gov/ready/ hysplit4.html). 3. Godish, T. (1985) Air Quality. Chelsea, Ml:
Lewis Publishers, Inc. 4. Jacob, M.B., Hochheiser, S. (1958) Continuous
sampling and ultra-micro determination of nitrogen dioxide in the air. Anal Chem 32:426. doi: 10.1021/ac60135a032.
5. Joshi, N., Chauhan, A, Joshi, P.C. (2009) Impact of industrial air pollutants on some biochemical parameters and yield in wheat and mustard plants. Environmentalist, 29(4): 398–404, doi: 10.1007/s10669-009-9218-4.
6. Joshi, P.C., Chauhan, A. (2008) Performance of locally grown rice plants (Oryza sativa L.) exposed to air pollutants in a rapidly growing industrial area of district Haridwar, Uttarakhand, India. Life Science Journal, 5(3): 41-45.
7. Joshi, P.C., Swami, A. (2007) Physiological responses of some tree species under roadside automobile pollution stress around city of

Journal of American Science 2017;13(9) http://www.jofamericanscience.org
89
Haridwar, India. Environmentalist, 27:365–374. doi:10.1007/s10669-007-9049-0.
8. Mitra, A.P., Sharma, C. (2002) Indian aerosols: present status. Chemosphere 49:1175–1190.
9. Nair, P.R., George, S.K., Kumar, S.V., Parameswaran, K., Jocab, S., Abraham, A. (2006) Chemical composition of aerosols over peninsular India during winter. Atmos Environ 40:6477–6493.
10. R Development Core Team (2013) R: A language and environment for statistical computing. R Foundation for Statistical Computing, Vienna, Austria. ISBN 3-900051-07-0, URL http://www.R-project.org/.
11. Stern, A.C. (1976) Air Pollution. Academic Press, 4, 3rd edn., New York, USA.
12. Steubing, L., Fangmier, A., Both, R. (1989) Effects of SO2, NO2, and O3 on Population
Development and Morphological and Physiological parameters of Native Herb Layer Species in a Beech Forest. Environmental Pollution, 58: 281-302.
13. Takemura, T., Kaufman, Y.J., Remer, L.A., Nakajima, T. (2007) Two competing pathways of aerosol effects on cloud and precipitation formation. Geophys. Res. Lett. 34: L04802. doi: 10.1029/2006GL028349.
14. West, P. W., Gaeke, G. C. Fixation of sulphur dioxide as sufitomercurate III and subsequent colorimetric determination. Analyt. Chem, 28, 1816 (1956).
15. Williams, T., Kelley, C. (2011), Gnuplot 4.5: an interactive plotting program. (http://gnuplot.info).
9/22/2017