journal of applied biomechanics - human kinetics€¦ · “batting cage performance of wood and...
TRANSCRIPT
“Batting Cage Performance of Wood and Non-Wood Youth Baseball Bats” by Crisco JJ, Rainbow MJ, jSchwartz JB, Wilcox BJ
Journal of Applied Biomechanics
© 2013 Human Kinetics, Inc.
Note. This article will be published in a forthcoming issue of
the Journal of Applied Biomechanics. The article appears here in
its accepted, peer-reviewed form, as it was provided by the
submitting author. It has not been copyedited, proofread, or
formatted by the publisher.
Section: Original Research
Article Title: Batting Cage Performance of Wood and Non-Wood Youth Baseball Bats
Authors: Joseph J. Crisco, Michael J. Rainbow, Joel B. Schwartz, and Bethany J. Wilcox
Affiliations: Bioengineering Laboratory, Department of Orthopaedics, The Warren Alpert
Medical School of Brown University and Rhode Island Hospital, Providence, RI.
Journal: Journal of Applied Biomechanics
Acceptance Date: August 30, 2013
©2013 Human Kinetics, Inc.

“Batting Cage Performance of Wood and Non-Wood Youth Baseball Bats” by Crisco JJ, Rainbow MJ, jSchwartz JB, Wilcox BJ
Journal of Applied Biomechanics
© 2013 Human Kinetics, Inc.
Batting Cage Performance of Wood and Non-Wood Youth Baseball Bats
Joseph J. Crisco, Michael J. Rainbow, Joel B. Schwartz, Bethany J. Wilcox
Bioengineering Laboratory, Department of Orthopaedics, The Warren Alpert Medical School of
Brown University and Rhode Island Hospital, Providence, RI, USA
Funding: National Operating Committee on Standards for Athletic Equipment (NOCSAE) and
USA Baseball. We gratefully acknowledge the manufacturers (Louisville Slugger, Mattingly,
Miken, Mizuno USA, Rawlings and Reebok) that supplied the baseball bats and balls used in this
study. The opinions expressed in this paper are solely those of the authors and may not reflect
the opinions of the entities that provided support.
Conflict of Interest Disclosure: The authors have no financial interest in this work
Corresponding Author:
Joseph J. Crisco, Ph.D.
Bioengineering Laboratory, Department of Orthopaedics
Alpert Medical School of Brown University and Rhode Island Hospital
CORO West, Suite 404
1 Hoppin Street
Providence, Rhode Island, 02903
Phone: 401-444-4231
Fax: 401-444-4418
Email: [email protected]
“Batting Cage Performance of Wood and Non-Wood Youth Baseball Bats” by Crisco JJ, Rainbow MJ, jSchwartz JB, Wilcox BJ
Journal of Applied Biomechanics
© 2013 Human Kinetics, Inc.
Abstract
The purpose of this study was to examine the batting cage performance of wood and non-wood
baseball bats used at the youth level. Three wood and ten non-wood bats were swung by 22
male players (13-18 yr.) in a batting cage equipped with a 3-D motion capture (300 Hz) system.
Batted ball speeds were compared using a one-way ANOVA and bat swing speeds were
analyzed as a function of bat moment of inertia by linear regression. Batted ball speeds were
significantly faster for three non-wood bat models (p < 0.001), significantly slower for one non-
wood model, and not different for six non-wood bats when compared with wood bats. Bat
impact speed significantly (p < 0.05) decreased with increasing bat moment of inertia for the 13,
14, and 15 yr. age groups, but not for the other age groups. Ball-bat coefficient of restitution
(BBCOR) for all non-wood were greater than wood but this factor alone did not correlate with
bat performance. Our findings indicate that increases in BBCOR and swing speed were not
associated with faster batted ball speeds for the bats studied whose moment of inertia was
substantially less than that of a wood bat of similar length.
Key Words: Baseball, bat, wood, performance
Word Counts: Abstract = 200, Manuscript = 4,377
“Batting Cage Performance of Wood and Non-Wood Youth Baseball Bats” by Crisco JJ, Rainbow MJ, jSchwartz JB, Wilcox BJ
Journal of Applied Biomechanics
© 2013 Human Kinetics, Inc.
Introduction
Since the first non-wood bats were introduced to baseball in the early 1970s as an
inexpensive and durable approach to address the cost and fragility of wood bats, there have been
concerns with the effects of increased bat performance on safety and the balance between offense
and defense 1. To address these concerns, governing bodies such as the National Collegiate
Athletic Association (NCAA) and the National Federation of State High School Associations
(NFHS) have a bat certification process that requires standardized laboratory testing.
Standardized laboratory testing of baseball bats consists of measuring several physical
properties, including weight, length, and the ball-bat coefficient of restitution (BBCOR) 2–4
.
BBCOR is defined as the ratio of the relative ball–bat velocity after the collision to that before
the collision and it is used to quantify what is commonly referred to as the “trampoline effect”.
The trampoline effect is commonly used to describe the effectiveness of the bat-ball energy
transfer, using a solid wood bat as the baseline. Therefore, if the BBCOR of a given bat is greater
than the BBCOR of a solid wood bat, it is said to exhibit the trampoline effect, and will
theoretically produce higher batted ball speed 4, if all other factors are equal.
In addition to BBCOR, other factors that determine the speed of the batted ball include
the swing speed just prior to ball impact, the location of the ball impact on the bat, and the
weight and moment of inertia (MOI) of the bat. Interestingly, these factors are not necessarily
independent. Increases in swing speed have been found to be more closely related to MOI about
the knob of the bat than to weight 5,6
and has been attributed to increases in performance when
compared to wooden bats 5,7
. Decreases in bat MOI are also associated with higher BBCOR
values because thinner barrel walls can result in less deformation of the ball, the greatest source
of energy loss in the ball-bat collision. Composite materials provide manufacturers with even
“Batting Cage Performance of Wood and Non-Wood Youth Baseball Bats” by Crisco JJ, Rainbow MJ, jSchwartz JB, Wilcox BJ
Journal of Applied Biomechanics
© 2013 Human Kinetics, Inc.
more control over the design of a bat’s properties, allowing composite bats to have a low barrel
stiffness (and possibly higher BBCOR values) and high flexural stiffness, which may play a role
in further increasing bat performance. At the collegiate and high school levels, MOI and “weight
drop” (bat length in inches minus bat weight in oz.) are tightly regulated, and therefore BBCOR
becomes the primary factor affecting bat performance 3,7
. Presently, the collegiate and high
school rules require the weight drop to be no less than -3, but a bat with a drop of -3 is generally
considered too heavy to be swung well by youth players. Many youth governing bodies do not
regulate the weight drop and MOI with the intent that lighter bats (e.g. with weight drops of -12)
are easier to swing by youth players and thus provide greater participation in play. With so little
momentum to transfer to the ball, the batting performance of these substantially lighter bats is
postulated to be adversely affected, regardless of their BBCOR value. These complex
relationships between BBCOR, MOI and bat performance at the youth level have not been
previously reported in an experimental setting.
The aim of this study was to determine the batting cage performance of wood and non-
wood baseball bats at the youth level among various age groups. Specifically, we sought to test
the hypothesis that the performance of non-wood bats was greater than wood bats. We
quantified bat performance by batted ball speeds, and analyzed batted ball speeds as a function of
bat model and player age. We note that batted ball speeds can be highly dependent on the cohort
of players studied, so in order to provide a more specific measure of bat performance we utilized
our previously established approach that computes ideal batted ball speeds by taking into account
the swing speed of the bat and the impact location of the ball on the bat7. We also examined the
ability of lab measurements of BBCOR to predict the measured batted ball speeds.
“Batting Cage Performance of Wood and Non-Wood Youth Baseball Bats” by Crisco JJ, Rainbow MJ, jSchwartz JB, Wilcox BJ
Journal of Applied Biomechanics
© 2013 Human Kinetics, Inc.
Methods
Twenty two (n = 22) right-handed male players (mean age: 16, range 13-18) representing
two different skill levels (little league and high school) participated in a batting cage study after
IRB approval and informed written consent/assent were obtained. Thirteen bat models from six
different manufacturers were used in this study (Table 1). The non-wood bats are used in league
play that presently do not regulate bat specifications. Five bats of each model were prepared for
testing by applying square markers (13 mm × 13 mm (0.5 in × 0.5 in)) of retro-reflective tape
(3M Scotchlite High Gain Reflective Sheeting 7610) along the length of the bat. Four markers
were evenly-spaced circumferentially at approximately 0, 9, 28, 38 and 76 cm (0, 3.5, 11, 15, and
30 inches) from the tip. Baseballs (R100, Rawlings, St. Louis, MO, n = 300) were prepared with
six uniformly arranged square retro-reflective markers (13 mm × 13 mm (0.5 in × 0.5 in)).
Testing was held indoors in the Brown University Athletic Center (Providence, RI) over a
two-day session. A portable batting cage was assembled (15.2 m × 3.0 m × 4.3 m (50 ft ×10 ft ×
14 ft)) on the gymnasium floor. The pitching machine (Iron Mike MP5, Master Pitching Machine
Kansas City, MO) was positioned within the cage 12.2 m (40 ft) from the hitter. Balls were
pitched at a speed comfortable to the hitter (range 21.5 – 26 m/s (48-58 mph)) to maximize the
number of hits. Players participated in multiple batting sessions consisting of approximately
twenty-five pitches with a single bat. The order of bat models swung by players was selected
randomly. Not all bat models were swung by all players.
Data Collection and Analysis
The pitched ball, batted ball and bat swing were tracked at 300 Hz using an eight-camera
Oqus 5-series infrared sensing system (Qualisys, Gothenburg, Sweden). The cameras were
mounted on tripods approximately 2.4 m (8 ft) high and positioned behind and to the right side of
“Batting Cage Performance of Wood and Non-Wood Youth Baseball Bats” by Crisco JJ, Rainbow MJ, jSchwartz JB, Wilcox BJ
Journal of Applied Biomechanics
© 2013 Human Kinetics, Inc.
the batter. Pitched and batted balls were tracked within 3 m (6 ft) of the front of home plate. The
system was recalibrated following every 100 pitches, resulting in calibration tolerances less than
0.7 mm. Ball and bat markers were identified within Qualisys Track Manager and exported to
Matlab (Mathworks Inc., Natick MA) for subsequent analysis.
Ball and bat positions and velocities were calculated using previously developed
algorithms 7. Briefly, pitched and batted ball velocity were determined component-wise by a
linear least-squares fit to the 3-D ball coordinates as a function of time. Batted ball speed (BBS)
was computed as the magnitude of the batted ball velocity. Ball speed error was defined as the
standard error of these linear fits and had a mean value of 0.6 m/s (1.3 mph) for the hits
analyzed. Bat position was determined by fitting a least-squares 3-D vector to the bat markers at
each time point. This approach does not permit the tracking of the rotations of the bat about its
long axis7.
The impact location of the ball on the bat was determined by intersecting the incoming
pitch vector with the bat vector at the impact frame. The variation in computing impact location
was defined as the orthogonal distance between the bat vector and the pitch vector and had a
mean value of 0.02 m (0.78 in) for the hits analyzed. The sweet spot for each bat was defined as
the average impact location of the top 10% batted ball speeds.
Bat swing speed was computed as the speed of the bat at the impact location. The impact
location was tracked from the impact frame backwards to the frame at which the bat speed first
exceeded 8.9 m/s (20 mph). The 3D path of the impact location was fit with a second-order
polynomial, and then differentiated to obtain the bat swing speed at the instant of impact. As an
estimate of error in bat swing speed, we computed bat speed one frame prior to, and one frame
“Batting Cage Performance of Wood and Non-Wood Youth Baseball Bats” by Crisco JJ, Rainbow MJ, jSchwartz JB, Wilcox BJ
Journal of Applied Biomechanics
© 2013 Human Kinetics, Inc.
after, the selected impact frame. The mean difference in these speeds was 1.3 m/s (2.8 mph) for
the hits analyzed.
The angular swing speed of the bat was computed as the time derivative of the helical
rotation8 (also referred to as the screw rotation) for the two frames prior to ball impact. To
examine the validity of this calculation of angular swing speed, bat swing speed was recomputed
as the product of angular swing speed and the distance from the impact location to the closest
point on the helical axis. A linear regression analysis compared these two, independent bat
swing speed calculations. The regression line had an R2 and slope of 0.94 and 0.9 ± 0.005
respectively.
Ideal batted ball speed (BBS) is defined as the maximum possible batted ball speed at a
given bat swing speed and was computed in three steps for each bat model at a selected bat
swing speed of 24.6 m/s (55 mph). First, the 98th
percentile value of the batted ball speeds were
computed for each bat swing speed bin of 0.22 m/s (0.5 mph). Then, a linear regression was
performed on these 98th
percentile batted ball speed values as a function of bat swing speed.
Finally, at the specified bat swing speed of 24.6 m/s (55 mph) the regressed batted ball speed
was computed along with its 95% confidence interval.
BBCOR, MOI and vf
For each bat model, the laboratory BBCOR value was measured using the standardized
ball velocity of 51.4 m/s (115 mph) and impact location of 0.13 m (5 in.) for the certification of
baseball bats by sports governing bodies9,10
. Moment of inertia of the bat was measured using
standard laboratory procedures 11
and then computed about the knob (MOI). Using equations
derived by Nathan et al. 3, we computed the predicted batted ball speed (vf) for each bat using its
measured BBCOR and MOI, a baseball pitched at 23.7 m/s (53 mph), an impact location at 12.7

“Batting Cage Performance of Wood and Non-Wood Youth Baseball Bats” by Crisco JJ, Rainbow MJ, jSchwartz JB, Wilcox BJ
Journal of Applied Biomechanics
© 2013 Human Kinetics, Inc.
cm (5 in.) from the tip, and a bat swing speed of 24.6 m/s (55 mph). These values were chosen
as representative values of our dataset.
Number of Hits Analyzed
A total of 1,638 hits were analyzed from 3,405 pitches. All hits that were visually noted
as clearly being foul tips were excluded from the analysis. Not all players successfully hit with
all bat models (Table 2) and there was a protocol bias in which 17 and 18 yr. players did not
swing bat model H because it was found to be quickly damaged by these older players.
Statistical Analysis
Consistent with our previous study7, we did not find any significant differences among
the various wood bat models, so the data from the three wooden bats were pooled and referred to
as Wood. Differences in batted ball speed, bat impact speed, and angular speed of all non-wood
bat models were first compared to Wood without considering any other factors using three
separate one-way ANOVAs with a Dunnett’s multiple comparison test (Wood as control) in
Prism (V5, GraphPad, La Jolla, CA). Significance was set at a P < 0.05.
Differences in batted ball speed, bat impact speed, and angular speed between all non-
wood and Wood bat models within each age group were analyzed with unpaired t-tests.
Significance was set at a P < 0.00625 (0.05/8), to account for multiple comparisons among age
groups.
Bat linear and angular swing speeds were analyzed as a function of bat MOI by first
regressing each player’s hits. These values were then grouped by the player’s age group and
subsequent linear regression was used to examine any correlation with bat MOI by age group.
Sweet spots and BBCORs were compared using a one-way ANOVA with a post-hoc Dunnett’s
multiple comparison test using Wood as the control. Comparison among all bat models was

“Batting Cage Performance of Wood and Non-Wood Youth Baseball Bats” by Crisco JJ, Rainbow MJ, jSchwartz JB, Wilcox BJ
Journal of Applied Biomechanics
© 2013 Human Kinetics, Inc.
performed with post-hoc Bonferroni’s multiple comparison. The ability of the MOI and BBCOR
values to predict ideal BBS and vf were examined using linear regression. All analyses were
performed in Prism (GraphPad Software, Inc., La Jolla, CA).
Results
Across all players, batted ball speed (BBS), bat impact speed, and angular speed for bat
models A and K were significantly faster (p < 0.001) than for Wood (Figure 1). Mean
differences were 4.0 and 3.6 m/s (8.9 and 8.1 mph), 1.4 and 2.5 m/s (3.1 and 5.6 mph), and 166
and 309 deg/s, respectively. BBS for model J were also significantly faster by a mean of 1.5 m/s
(3.4 mph), while batted ball speeds for model H were significantly slower than Wood by a mean
of 2.0 m/s (4.5 mph). Bat impact speeds for models D and L were also significantly faster when
compared with Wood by a mean difference of 1.1 and 1.7 m/s (2.5 and 3.8 mph), respectively,
but there were no differences in angular speed among these bat models.
Within age groups, there were significant increases in the non-wood BBS, bat impact
speed, and angular rate when compared to Wood (Figure 2). Mean BBS was significantly (P <
0.001) faster with non-wood than Wood by 1.8, 2.5, 3.5, and 3.5 m/s (4.0, 5.6, 7.8, and 7.8 mph)
in the 13, 14, 17, and 18 yr. age groups, respectively. Mean speed at the impact location was
significantly (P < 0.001) faster by 1.5, 2.2, 0.9, and 2.1 m/s (3.3, 4.9, 2.0, and 4.7 mph) in the 13,
14, 16, and 17 yr. age groups, respectively. The angular swing speed was significantly (P <
0.001) faster for non-wood than Wood by 152, 252, and 128 deg/s in the 13, 14 and 16 yr. age
group, respectively.
Across all bat models, BBS increased by 1.5 ± 0.3 m/s (3.4 ± 0.7 mph) (R2 = 0.87, P <
0.005) with each increasing year of player age. The differences in mean batted ball speed among
non-wood bat models compared to Wood were fairly consistent within each age group (1.4 ± 1.0
“Batting Cage Performance of Wood and Non-Wood Youth Baseball Bats” by Crisco JJ, Rainbow MJ, jSchwartz JB, Wilcox BJ
Journal of Applied Biomechanics
© 2013 Human Kinetics, Inc.
m/s). The largest increases in mean BBS over Wood within each age group were for model A
with values of 3.3, 4.8, 3.9, and 5.2 m/s (7.4, 10.7, 8.7, and 11.6 mph) for the 13, 14, 17, and 18
yr. age groups, respectively.
Bat impact speed significantly (P < 0.05) decreased with increasing MOI for the 13, 14
and 15 yr. age groups (Figure 3). The slopes of the regression for each of these age groups was -
24.4 ± 1.4, -28.3 ± 7.7, and -28.7 ± 4.3 m/s per kgm2 (54.6 ± 3.1, 63.3 ± 17.2, and 64.2 ± 9.6
mph per kgm2), respectively. There was no significant change in bat impact speed with bat MOI
for 16, 17, and 18 yr. age groups (slope = 7.6 ± 12.5 m/s per kgm2 , P = 0.56). Angular swing
speed decreased significantly (slope = -3807±507 deg/s per kgm2, P < 0.001) with increasing
MOI only for the 14 yr. age group.
The sweet spot on the Wood bat models was located a mean (± 1 SD) of 13.4 ± 3.2 cm
(5.3 ± 1.3 in.) from the tip of the bat. The location of the sweet spot on the non-wood bat models
did not differ significantly from Wood (P = 0.196). However, the sweet spot of model C (10.7 ±
2.8 cm (4.2 ± 1.1 in.)) was significantly (P = 0.008) closer to the tip of the bat then model H
(15.6 ± 2.0 cm (6.1 ± 0.8 in.)).
The ideal BBS at a bat swing speed of 24.6 m/s (55 mph) were 34.7 ± 0.1, 34.4 ± 0.2,
32.7 ± 0.4, 33.8 ± 0.3, 33.9 ± 0.3, 31 ± 0.3, 33 ± 0.3, 35.4 ± 0.2, 34.8 ± 0.2, 32.8 ± 0.2, and 33.8
± 0.2 m/s for Wood, A, C, D, G, H, I, J, K, L and M, respectively. These ideal BBS increased
significantly (slope = 41.0 ± 8.7 m/s per kgm2, R
2 = 0.71, P = 0.001) with increasing MOI
(Figure 4). The relationship between ideal BBS and bat impact speed was explored further by a
regression model based on Wood, and it was found that the envelope of ideal BBS increased
linearly with swing speed by a factor 1.4 ± 0.02 (R2 = 0.98, P < 0.001) (Figure 5).
“Batting Cage Performance of Wood and Non-Wood Youth Baseball Bats” by Crisco JJ, Rainbow MJ, jSchwartz JB, Wilcox BJ
Journal of Applied Biomechanics
© 2013 Human Kinetics, Inc.
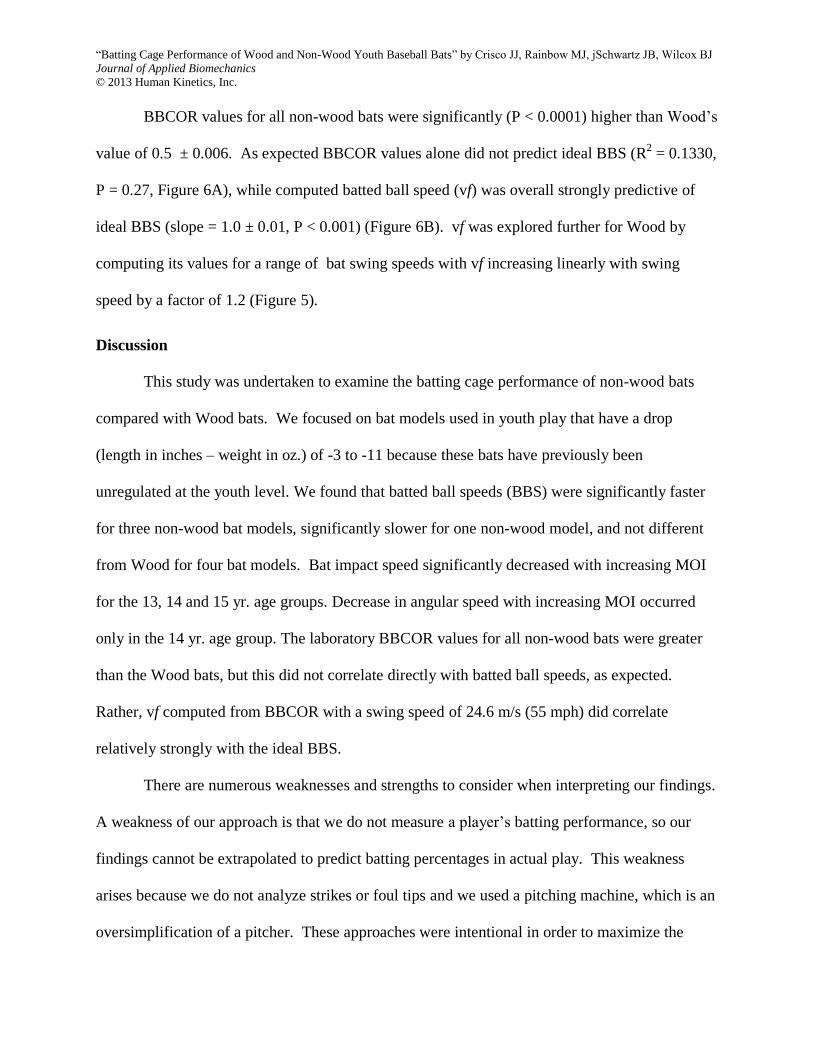
BBCOR values for all non-wood bats were significantly (P < 0.0001) higher than Wood’s
value of 0.5 ± 0.006. As expected BBCOR values alone did not predict ideal BBS (R2 = 0.1330,
P = 0.27, Figure 6A), while computed batted ball speed (vf) was overall strongly predictive of
ideal BBS (slope = 1.0 ± 0.01, P < 0.001) (Figure 6B). vf was explored further for Wood by
computing its values for a range of bat swing speeds with vf increasing linearly with swing
speed by a factor of 1.2 (Figure 5).
Discussion
This study was undertaken to examine the batting cage performance of non-wood bats
compared with Wood bats. We focused on bat models used in youth play that have a drop
(length in inches – weight in oz.) of -3 to -11 because these bats have previously been
unregulated at the youth level. We found that batted ball speeds (BBS) were significantly faster
for three non-wood bat models, significantly slower for one non-wood model, and not different
from Wood for four bat models. Bat impact speed significantly decreased with increasing MOI
for the 13, 14 and 15 yr. age groups. Decrease in angular speed with increasing MOI occurred
only in the 14 yr. age group. The laboratory BBCOR values for all non-wood bats were greater
than the Wood bats, but this did not correlate directly with batted ball speeds, as expected.
Rather, vf computed from BBCOR with a swing speed of 24.6 m/s (55 mph) did correlate
relatively strongly with the ideal BBS.
There are numerous weaknesses and strengths to consider when interpreting our findings.
A weakness of our approach is that we do not measure a player’s batting performance, so our
findings cannot be extrapolated to predict batting percentages in actual play. This weakness
arises because we do not analyze strikes or foul tips and we used a pitching machine, which is an
oversimplification of a pitcher. These approaches were intentional in order to maximize the

“Batting Cage Performance of Wood and Non-Wood Youth Baseball Bats” by Crisco JJ, Rainbow MJ, jSchwartz JB, Wilcox BJ
Journal of Applied Biomechanics
© 2013 Human Kinetics, Inc.
number of hits. It must also be appreciated that the batted ball speeds we recorded (Figures 1
and 2) are specific to the cohort of the players participating in this study and may not reflect the
batted ball speeds across a different cohort of players. Moreover, not all players swung all bats
because of external time constraints on the subjects’ participation. This limitation may have
influenced our values for absolute batted ball speed and swing speed (Figure 1). The influence
of the cohort of player on the absolute batted ball speeds values will always be a factor in studies
where human performance is a factor. Analyzing all non-wood bats as a group (Figure 2)
partially addresses this limitation because it increases the sample size, but then limits analysis by
bat models. Both of these limitations are however addressed in our approach that computes and
analyzes ideal BBS and vf because the influence of player age, strength, and skill are removed.
In our previous study we found that the center of rotations of the bat, at the instant of impact,
was located fairly consistently near the knob of the bat7. At this instant, linear speed would be
directly proportional to the rotational speed. In present study we found weak correlations
between linear and rotational bat speeds, and further analysis demonstrated a substantially higher
variation in the center of rotation than we previously observed. We conjecture that the swing
kinematics in this study were far more varied across subjects than in the previous study. To
demonstrate this an analysis of all six degrees of freedom of the bat throughout the entire swing
would be required, but such an analysis is beyond the scope of this manuscript.
We have previously established that ideal batted ball speed increases linearly with
increasing bat impact speed and that relationship is independent of the skill level of the player 7 .
The data collected in this study further confirms these findings. Using Wood as the example
(Figure 5), as bat swing speed increases the envelope of ideal batted ball speed at each bat swing
speed increases linearly. These batted ball speeds at each bat swing speed are referred to as
“Batting Cage Performance of Wood and Non-Wood Youth Baseball Bats” by Crisco JJ, Rainbow MJ, jSchwartz JB, Wilcox BJ
Journal of Applied Biomechanics
© 2013 Human Kinetics, Inc.
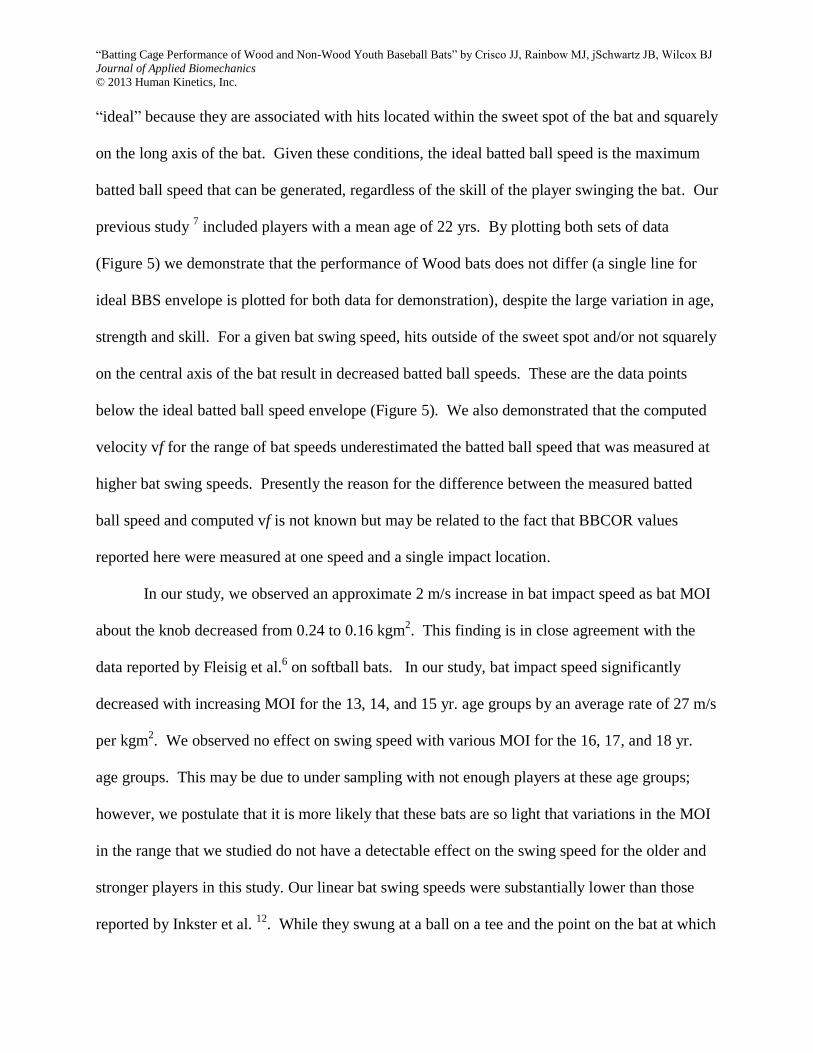
“ideal” because they are associated with hits located within the sweet spot of the bat and squarely
on the long axis of the bat. Given these conditions, the ideal batted ball speed is the maximum
batted ball speed that can be generated, regardless of the skill of the player swinging the bat. Our
previous study 7 included players with a mean age of 22 yrs. By plotting both sets of data
(Figure 5) we demonstrate that the performance of Wood bats does not differ (a single line for
ideal BBS envelope is plotted for both data for demonstration), despite the large variation in age,
strength and skill. For a given bat swing speed, hits outside of the sweet spot and/or not squarely
on the central axis of the bat result in decreased batted ball speeds. These are the data points
below the ideal batted ball speed envelope (Figure 5). We also demonstrated that the computed
velocity vf for the range of bat speeds underestimated the batted ball speed that was measured at
higher bat swing speeds. Presently the reason for the difference between the measured batted
ball speed and computed vf is not known but may be related to the fact that BBCOR values
reported here were measured at one speed and a single impact location.
In our study, we observed an approximate 2 m/s increase in bat impact speed as bat MOI
about the knob decreased from 0.24 to 0.16 kgm2. This finding is in close agreement with the
data reported by Fleisig et al.6 on softball bats. In our study, bat impact speed significantly
decreased with increasing MOI for the 13, 14, and 15 yr. age groups by an average rate of 27 m/s
per kgm2. We observed no effect on swing speed with various MOI for the 16, 17, and 18 yr.
age groups. This may be due to under sampling with not enough players at these age groups;
however, we postulate that it is more likely that these bats are so light that variations in the MOI
in the range that we studied do not have a detectable effect on the swing speed for the older and
stronger players in this study. Our linear bat swing speeds were substantially lower than those
reported by Inkster et al. 12
. While they swung at a ball on a tee and the point on the bat at which
“Batting Cage Performance of Wood and Non-Wood Youth Baseball Bats” by Crisco JJ, Rainbow MJ, jSchwartz JB, Wilcox BJ
Journal of Applied Biomechanics
© 2013 Human Kinetics, Inc.
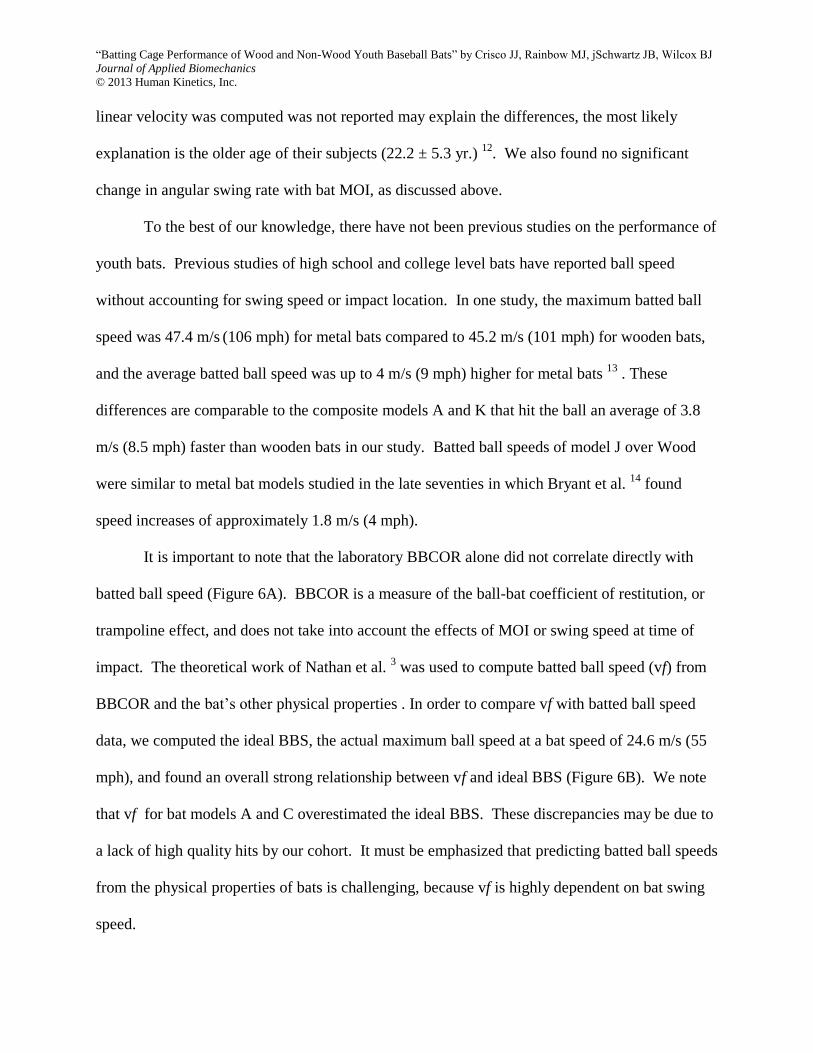
linear velocity was computed was not reported may explain the differences, the most likely
explanation is the older age of their subjects (22.2 ± 5.3 yr.) 12
. We also found no significant
change in angular swing rate with bat MOI, as discussed above.
To the best of our knowledge, there have not been previous studies on the performance of
youth bats. Previous studies of high school and college level bats have reported ball speed
without accounting for swing speed or impact location. In one study, the maximum batted ball
speed was 47.4 m/s (106 mph) for metal bats compared to 45.2 m/s (101 mph) for wooden bats,
and the average batted ball speed was up to 4 m/s (9 mph) higher for metal bats 13
. These
differences are comparable to the composite models A and K that hit the ball an average of 3.8
m/s (8.5 mph) faster than wooden bats in our study. Batted ball speeds of model J over Wood
were similar to metal bat models studied in the late seventies in which Bryant et al. 14
found
speed increases of approximately 1.8 m/s (4 mph).
It is important to note that the laboratory BBCOR alone did not correlate directly with
batted ball speed (Figure 6A). BBCOR is a measure of the ball-bat coefficient of restitution, or
trampoline effect, and does not take into account the effects of MOI or swing speed at time of
impact. The theoretical work of Nathan et al. 3 was used to compute batted ball speed (vf) from
BBCOR and the bat’s other physical properties . In order to compare vf with batted ball speed
data, we computed the ideal BBS, the actual maximum ball speed at a bat speed of 24.6 m/s (55
mph), and found an overall strong relationship between vf and ideal BBS (Figure 6B). We note
that vf for bat models A and C overestimated the ideal BBS. These discrepancies may be due to
a lack of high quality hits by our cohort. It must be emphasized that predicting batted ball speeds
from the physical properties of bats is challenging, because vf is highly dependent on bat swing
speed.
“Batting Cage Performance of Wood and Non-Wood Youth Baseball Bats” by Crisco JJ, Rainbow MJ, jSchwartz JB, Wilcox BJ
Journal of Applied Biomechanics
© 2013 Human Kinetics, Inc.
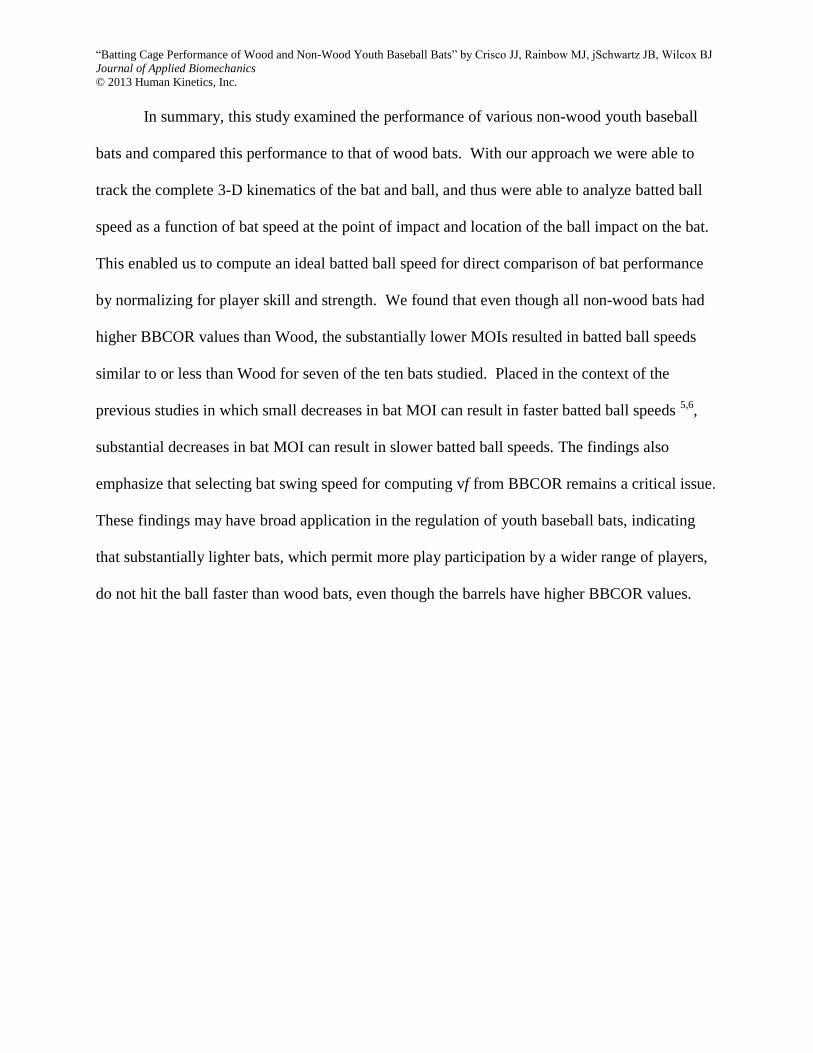
In summary, this study examined the performance of various non-wood youth baseball
bats and compared this performance to that of wood bats. With our approach we were able to
track the complete 3-D kinematics of the bat and ball, and thus were able to analyze batted ball
speed as a function of bat speed at the point of impact and location of the ball impact on the bat.
This enabled us to compute an ideal batted ball speed for direct comparison of bat performance
by normalizing for player skill and strength. We found that even though all non-wood bats had
higher BBCOR values than Wood, the substantially lower MOIs resulted in batted ball speeds
similar to or less than Wood for seven of the ten bats studied. Placed in the context of the
previous studies in which small decreases in bat MOI can result in faster batted ball speeds 5,6
,
substantial decreases in bat MOI can result in slower batted ball speeds. The findings also
emphasize that selecting bat swing speed for computing vf from BBCOR remains a critical issue.
These findings may have broad application in the regulation of youth baseball bats, indicating
that substantially lighter bats, which permit more play participation by a wider range of players,
do not hit the ball faster than wood bats, even though the barrels have higher BBCOR values.
“Batting Cage Performance of Wood and Non-Wood Youth Baseball Bats” by Crisco JJ, Rainbow MJ, jSchwartz JB, Wilcox BJ
Journal of Applied Biomechanics
© 2013 Human Kinetics, Inc.
REFERENCES
1. Council on Sports Medicine and Fitness. Baseball and softball. Pediatrics. 2012;129(3):e842–
856. doi:10.1542/peds.2011-3593.
2. Nathan AM. Characterizing the performance of baseball bats. American Journal of Physics.
2003;71(2):134–143.
3. Nathan A, Crisco J, Greenwald R, Russell D, Smith L. A comparative study of baseball bat
performance. Sports Engineering. 2011;13(4):153–162. doi:10.1007/s12283-011-0065-4.
4. Smith L, Nathan A, Duris J. A determination of the dynamic response of softballs. Sports
Engineering. 2010;12(4):163–169. doi:10.1007/s12283-010-0041-4.
5. Nicholls RL, Miller K, Elliott BC. Numerical analysis of maximal bat performance in
baseball. J Biomech. 2006;39(6):1001–1009. doi:10.1016/j.jbiomech.2005.02.020.
6. Fleisig GS, Zheng N, Stodden DF, Andrews JR. Relationship between bat mass properties and
bat velocity. Sports Engineering. 2002;5(1):1–8. doi:10.1046/j.1460-2687.2002.00096.x.
7. Crisco JJ, Greenwald RM, Blume JD, Penna LH. Batting performance of wood and metal
baseball bats. Med Sci Sports Exerc. 2002;34(10):1675–84.
doi:10.1249/01.MSS.0000031320.62025.57.
8. Panjabi MM, Krag MH, Goel VK. A technique for measurement and description of three-
dimensional six degree-of-freedom motion of a body joint with an application to the
human spine. J Biomech. 1981;14:447–60.
9. Drane P, Sherwood J. Baseball studies: Baseball bat testing protocol development. Procedia
Engineering. 2010;2(2):2681–2686. doi:10.1016/j.proeng.2010.04.051.
10. ASTM Standard F2219-11. Test Methods for Measuring High-Speed Bat Performance.
ASTM International. 2011;15.07. doi:10.1520/F2219-11.
11. ASTM Standard F2398-11. Test Method for Measuring Moment of Inertia and Center of
Percussion of a Baseball or Softball Bat. ASTM International. 2011;15.07.
doi:10.1520/F2398-11.
12. Inkster B, Murphy A, Bower R, Watsford M. Differences in the kinematics of the baseball
swing between hitters of varying skill. Med Sci Sports Exerc. 2011;43(6):1050–1054.
doi:10.1249/MSS.0b013e318203626a.
13. Greenwald RM, Penna LH, Crisco JJ. Differences in batted ball speed with wood and
aluminum baseball bats: A batting cage study. J. Applied Biomechanics. 2001;17:241–
252.
14. Bryant FO, Burkett LN, Chen SS, Krahenbuhl GS, Lu P. Dynamic and performance
characteristics of baseball bats. Res Quarterly. 1977;48(3):505–10.

“Batting Cage Performance of Wood and Non-Wood Youth Baseball Bats” by Crisco JJ, Rainbow MJ, jSchwartz JB, Wilcox BJ
Journal of Applied Biomechanics
© 2013 Human Kinetics, Inc.
Figure 1. Batted ball speed, bat impact speed and angular speed computed across all age groups
for each bat model. Significant differences (P < 0.001) when compared to wood bat models are
noted (*). Box denotes median and interquartile range, whiskers denote minimum and maximum
values.
“Batting Cage Performance of Wood and Non-Wood Youth Baseball Bats” by Crisco JJ, Rainbow MJ, jSchwartz JB, Wilcox BJ
Journal of Applied Biomechanics
© 2013 Human Kinetics, Inc.
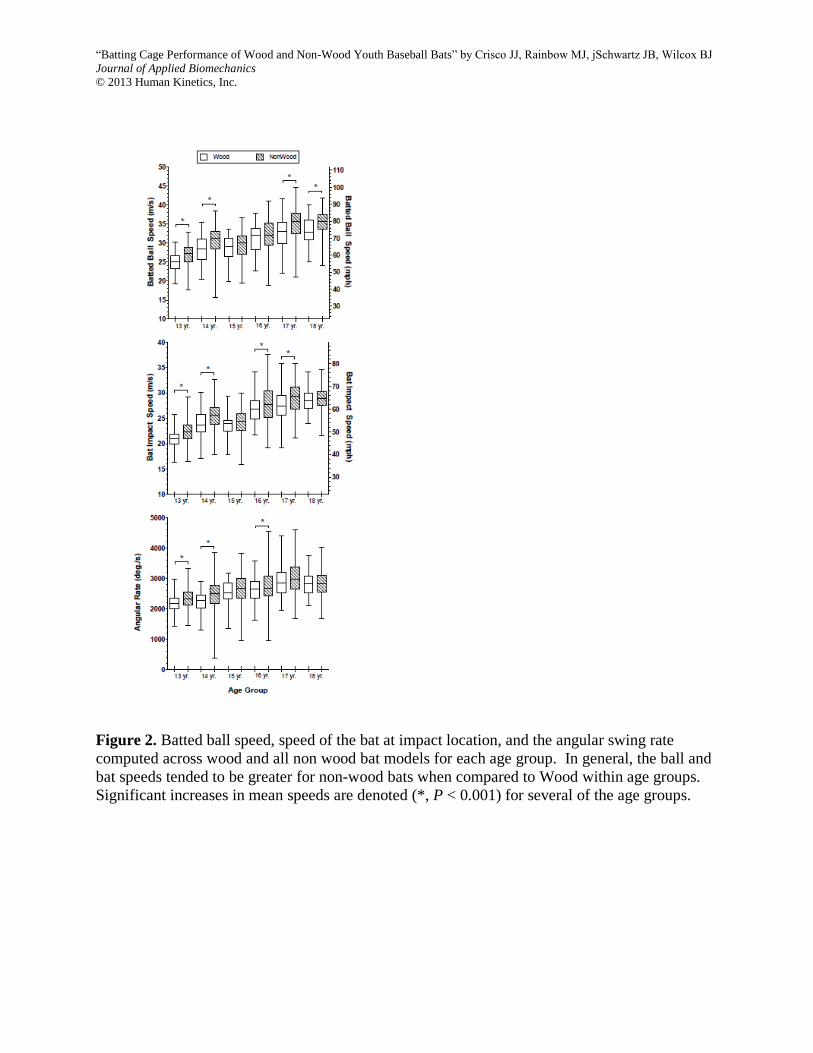
Figure 2. Batted ball speed, speed of the bat at impact location, and the angular swing rate
computed across wood and all non wood bat models for each age group. In general, the ball and
bat speeds tended to be greater for non-wood bats when compared to Wood within age groups.
Significant increases in mean speeds are denoted (*, P < 0.001) for several of the age groups.
“Batting Cage Performance of Wood and Non-Wood Youth Baseball Bats” by Crisco JJ, Rainbow MJ, jSchwartz JB, Wilcox BJ
Journal of Applied Biomechanics
© 2013 Human Kinetics, Inc.
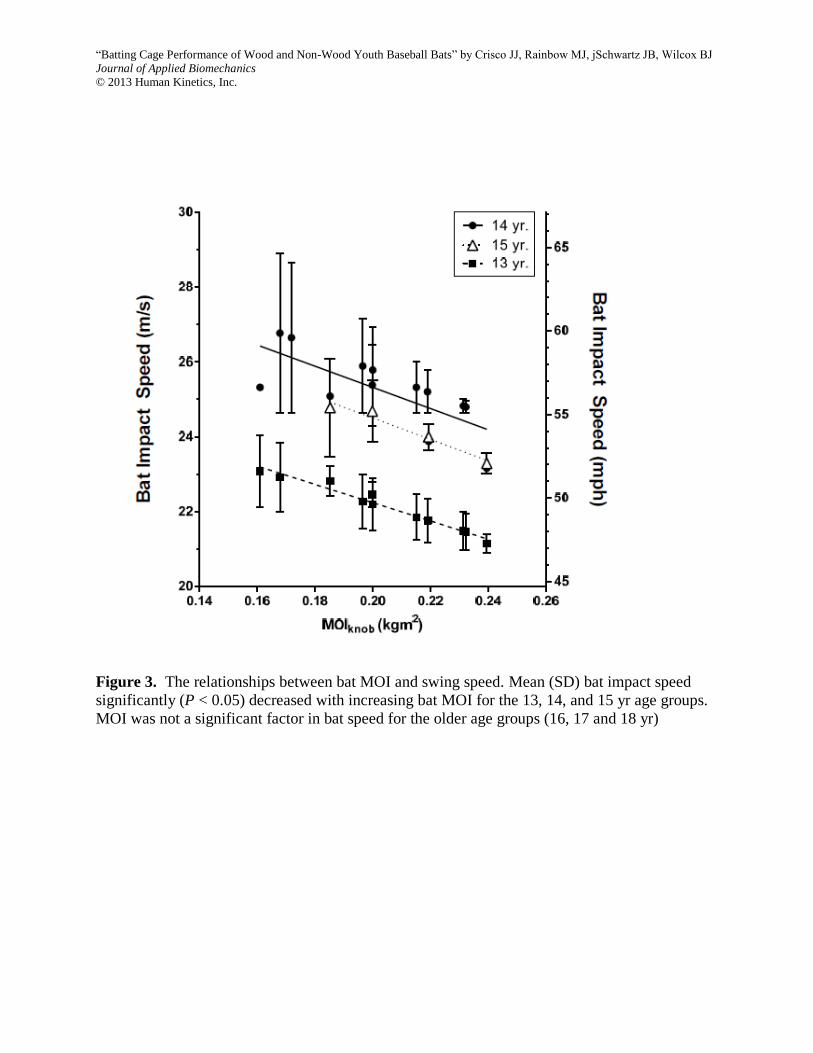
Figure 3. The relationships between bat MOI and swing speed. Mean (SD) bat impact speed
significantly (P < 0.05) decreased with increasing bat MOI for the 13, 14, and 15 yr age groups.
MOI was not a significant factor in bat speed for the older age groups (16, 17 and 18 yr)

“Batting Cage Performance of Wood and Non-Wood Youth Baseball Bats” by Crisco JJ, Rainbow MJ, jSchwartz JB, Wilcox BJ
Journal of Applied Biomechanics
© 2013 Human Kinetics, Inc.
Figure 4. The ideal BBS computed at a constant swing speed of 24.6 m/s (55 mph) increased
significantly (slope = 41.0 ± 8.7 m/s per kgm2, R
2 = 0.71, P = 0.001) with increasing bat MOI.
“Batting Cage Performance of Wood and Non-Wood Youth Baseball Bats” by Crisco JJ, Rainbow MJ, jSchwartz JB, Wilcox BJ
Journal of Applied Biomechanics
© 2013 Human Kinetics, Inc.
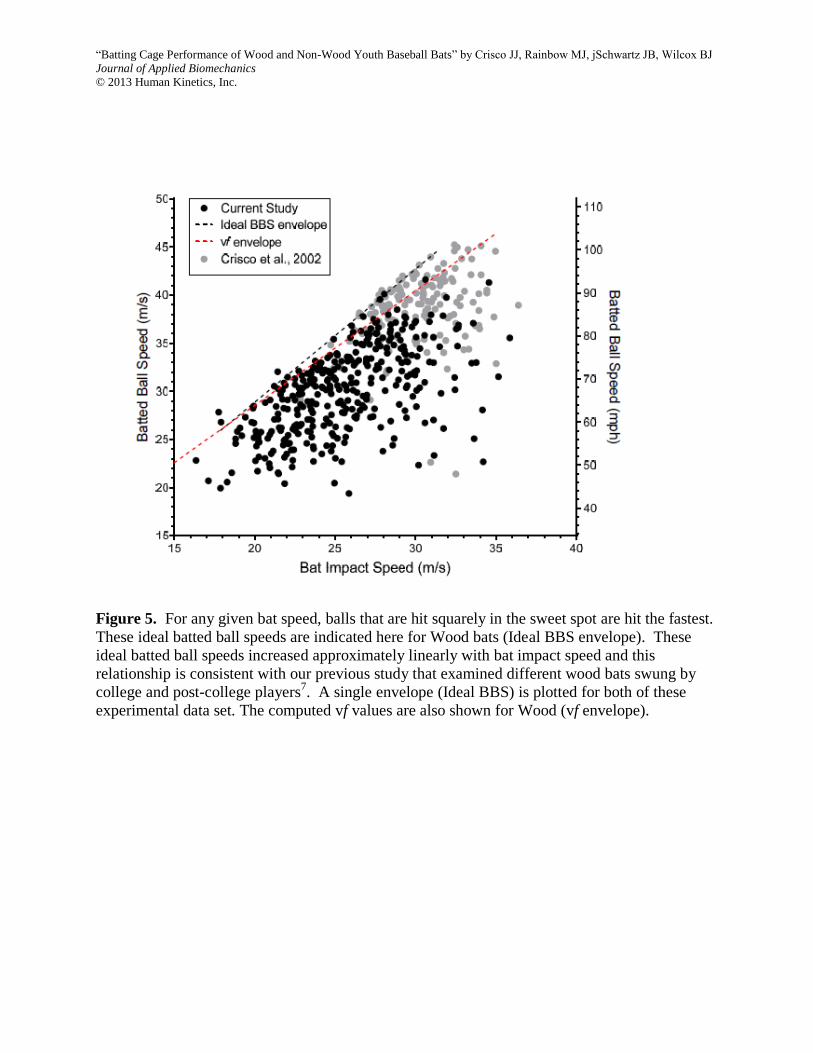
Figure 5. For any given bat speed, balls that are hit squarely in the sweet spot are hit the fastest.
These ideal batted ball speeds are indicated here for Wood bats (Ideal BBS envelope). These
ideal batted ball speeds increased approximately linearly with bat impact speed and this
relationship is consistent with our previous study that examined different wood bats swung by
college and post-college players7. A single envelope (Ideal BBS) is plotted for both of these
experimental data set. The computed vf values are also shown for Wood (vf envelope).
“Batting Cage Performance of Wood and Non-Wood Youth Baseball Bats” by Crisco JJ, Rainbow MJ, jSchwartz JB, Wilcox BJ
Journal of Applied Biomechanics
© 2013 Human Kinetics, Inc.
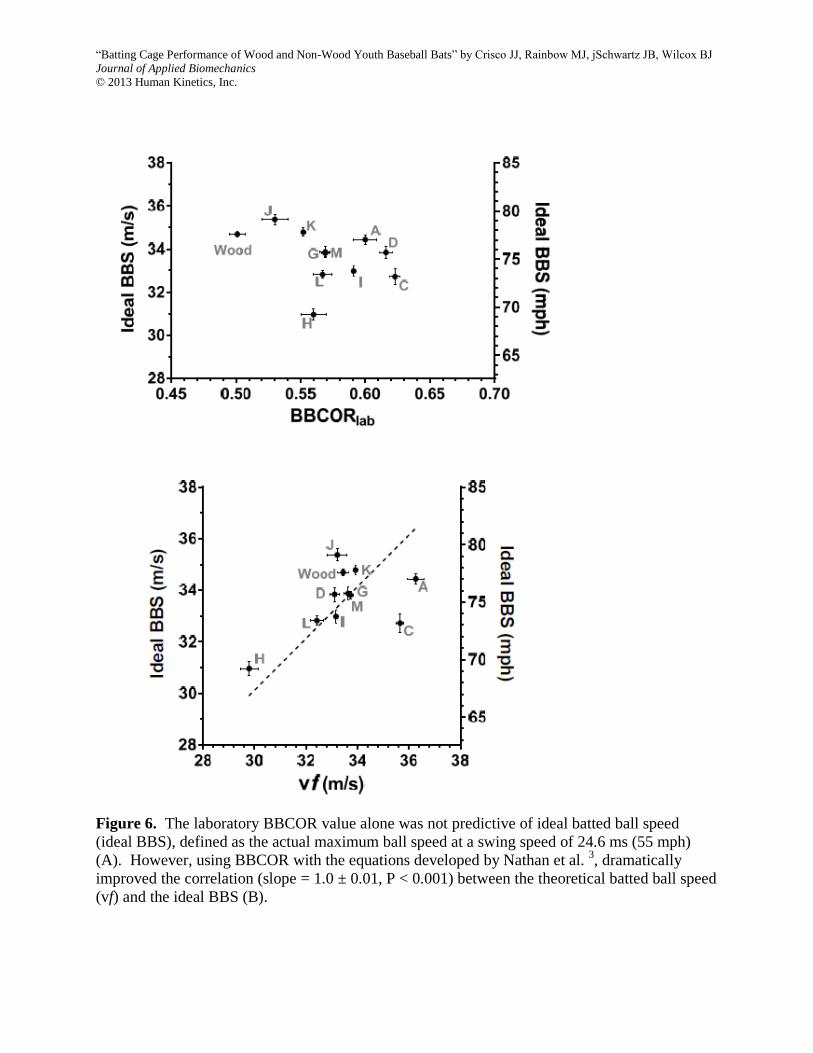
Figure 6. The laboratory BBCOR value alone was not predictive of ideal batted ball speed
(ideal BBS), defined as the actual maximum ball speed at a swing speed of 24.6 ms (55 mph)
(A). However, using BBCOR with the equations developed by Nathan et al. 3, dramatically
improved the correlation (slope = 1.0 ± 0.01, P < 0.001) between the theoretical batted ball speed
(vf) and the ideal BBS (B).

“Batting Cage Performance of Wood and Non-Wood Youth Baseball Bats” by Crisco JJ, Rainbow MJ, jSchwartz JB, Wilcox BJ
Journal of Applied Biomechanics
© 2013 Human Kinetics, Inc.
Table 1. Physical properties of the bat models tested (values listed are the averages of 5 bats per
model). The “drop” is a term used in baseball bat regulation and refers to the difference between
bat length (defined in in.) and bat weight (defined in oz.). . The center of gravity (C.G.) is
measured from the tip of the bat. The MOI is computed about the bat’s knob. The center of
gravity (C.G.) is measured from the tip of the bat.
Bat Model Material /
Construction
Max.
Barrel
Diam.
(cm (in))
Length
(cm (in))
Weight
(kg (oz)) Drop
C.G.
(cm (in))
MOI
(kgm2
(ozin2))
A Composite 7.0 (2.8) 78.7 (31) 0.74 (26) -5 29.3
(11.5)
0.2190
(11,992)
B (Wood) Maple 5.7 (2.3) 78.7 (31) 0.74 (26) -5 27.5
(10.8)
0.2193
(12,014)
C Composite 7.0 (2.8) 78.7 (31) 0.62 (22) -9 27.4
(10.8)
0.1965
(10,764)
D Composite 6.7 (2.6) 78.7 (31) 0.60 (21) -10 30.7
(12.1)
0.1718
(9,409)
E (Wood) Bamboo 6.4 (2.5) 76.2 (30) 0.77 (27) -3 26.0
(10.2)
0.2314
(12,673)
F (Wood) Maple 6.4 (2.5) 76.2 (30) 0.77 (27) -3 25.3 (9.9) 0.2322
(12,719)
G Composite 7.0 (2.8) 78.7 (31) 0.64 (22.5) -8.5 28.2
(11.1)
0.1998
(10,944)
H Composite 5.7 (2.3) 78.7 (31) 0.57 (20) -11 30.9
(12.2)
0.1609
(8,815)
I Composite 6.7 (2.6) 76.2 (30) 0.57 (20) -10 27.7
(10.9)
0.1678
(9,192)
J Composite 6.7 (2.6) 81.3 (32) 0.57 (27) -5 30.3
(11.9)
0.2395
(13,117)
K Composite 6.7 (2.6) 78.7 (31) 0.74 (26) -5 30.9
(12.2)
0.2151
(11,781)
L Composite 6.7 (2.6) 78.7 (31) 0.60 (21) -10 28.2
(11.1)
0.1852
(10,144)
M Aluminum 6.7 (2.6) 78.7 (31) 0.61 (21.5) -9.5 28.5
(11.2)
0.2000
(10,952)

“Batting Cage Performance of Wood and Non-Wood Youth Baseball Bats” by Crisco JJ, Rainbow MJ, jSchwartz JB, Wilcox BJ
Journal of Applied Biomechanics
© 2013 Human Kinetics, Inc.
Table 2. Number of hits analyzed by age group and bat model.
Age Group Wood A C D G H I J K L M Sum by Age
13 60 20 23 0 34 24 25 30 30 34 29 309
14 44 20 22 35 40 32 25 11 21 17 37 304
15 41 0 0 0 41 0 0 43 0 35 0 160
16 74 0 9 58 29 41 23 25 83 77 12 431
17 100 41 22 5 0 0 29 38 49 13 16 313
18 34 9 11 14 0 0 13 10 19 0 11 121
Sum by Model 353 90 87 112 144 97 115 157 202 176 105 1638