journal of avian biology jav-01456 · journal of avian biology jav-01456 peneaux, c., ......
TRANSCRIPT

Journal of Avian Biology JAV-01456Peneaux, C., Machovsky-Capuska, G. E., Raubenheimer, D., Lermite, F., Rousseau, C., Ruhan, T., Rodger, J. C. and Griffin, A. S. 2017. Tasting novel foods and selecting nutrient content in a highly successful ecological invader, the common myna. – J. Avian Biol. doi: 10.1111/jav.01456
Supplementary material

25
Appendix 1
Fig. A1. Photos of the experimental setup for experiment 1 and 2. On the left: wooden board with the
three small dishes used for experiment 1 (photo courtesy of Charlotte Rousseau). On the right: the
three plastic bottles for HP, HL and HC foods used for experiment 2 (photo courtesy of Chloe
Peneaux).

26
Fig. A2. Schematic of the extractive problem-solving tasks. All containers were glued to an identical
sized piece of wood. During the innovation test, each petri dish contained a dog pellet as a reward.
The petri dishes (with lids) were presented either: right way up, so the lid could be removed by either
levering or pushing the lid upwards, or by grabbing a small piece of tape attached to the edge and
pulling; or upside down (i.e. the edges of the top smaller container were contained within the larger
bottom container), so the lid had to be removed by grabbing a small hook attached to its surface.

27
Fig. A3. Plan of exploration room (1.7m x 2.80 m x 2.70 m). The room contained five wooden
artificial trees of 1.5 m high. Each tree had four lateral branches of 20 cm long. The upper branches
were positioned 5 cm below the top (also considerate as a perch) and perpendicular to the lower
branches, which were located 30 cm from the top.
28
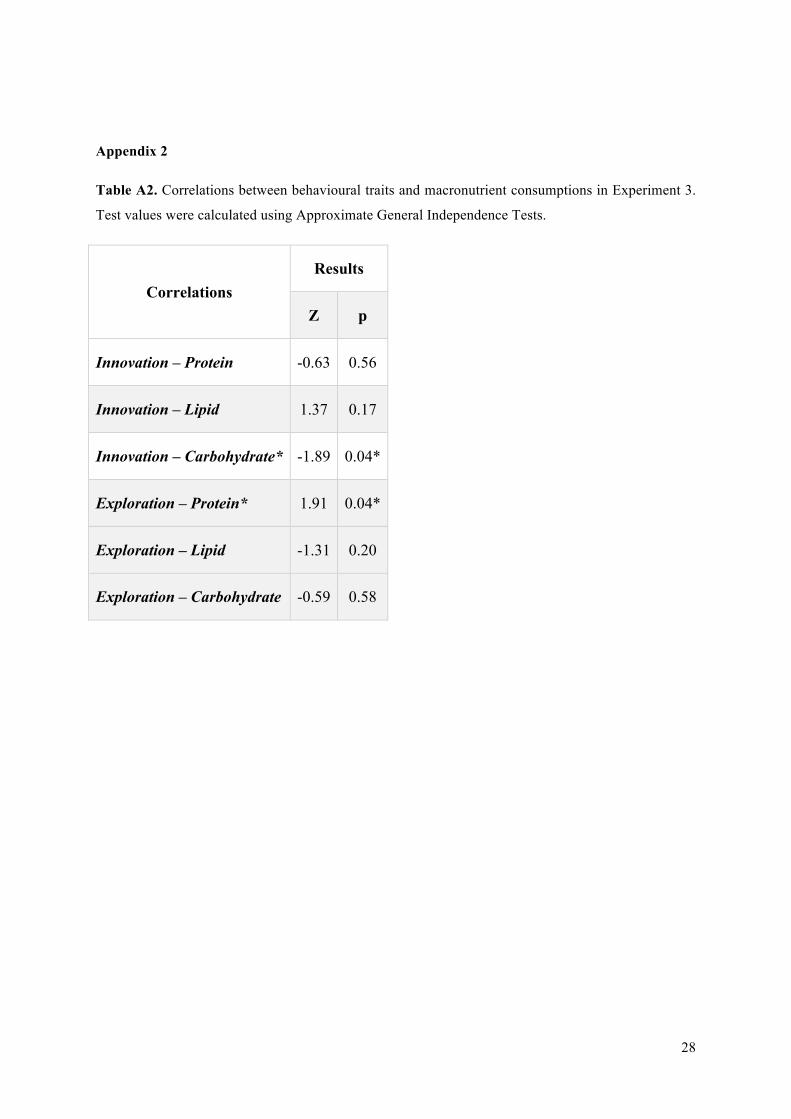
Appendix 2
Table A2. Correlations between behavioural traits and macronutrient consumptions in Experiment 3.
Test values were calculated using Approximate General Independence Tests.
Correlations Results
Z p
Innovation – Protein -0.63 0.56
Innovation – Lipid 1.37 0.17
Innovation – Carbohydrate* -1.89 0.04*
Exploration – Protein* 1.91 0.04*
Exploration – Lipid -1.31 0.20
Exploration – Carbohydrate -0.59 0.58

29
Fig. A2. Scatter plot panel of the correlation analysis between behavioural traits and consumption in
macronutrients in Experiment 3.
Quantity
consumed