journal of business venturing insights -...
TRANSCRIPT

Contents lists available at ScienceDirect
Journal of Business Venturing Insights
Journal of Business Venturing Insights 3 (2015) 16–23
http://d2352-67
n CorrE-m
1 Fax:2 Fax:
journal homepage: www.elsevier.com/locate/jbvi
Investment and returns in successful entrepreneurial sell-outs
Robert Wiltbank a,1, Nicholas Dewb,2, Stuart Read a,n
a Willamette University, Atkinson Graduate School of Management, Salem, OR 97301, USAb Naval Postgraduate School, 1 University Circle, Monterey, CA 93943, USA
a r t i c l e i n f o
Article history:Received 22 November 2014Received in revised form5 February 2015Accepted 11 February 2015Available online 10 April 2015
Keywords:New ventureLiquidityInvestmentAcquisitionCapitalEntrepreneur
x.doi.org/10.1016/j.jbvi.2015.02.00234/& 2015 Elsevier Inc. All rights reserved.
esponding author. Fax: þ1 503 370 3011.ail addresses: [email protected] (R.þ1 503 370 3011.þ1 831 656 3407.
a b s t r a c t
This paper examines returns to capital invested in new ventures. Across theoretical linesof inquiry, outcomes of new venture growth, valuation, and consequent return to en-trepreneurs are generally assumed to be a function of access to equity capital. Drawing ona hand-gathered dataset comprising the universe of 3160 private firms acquired by U.S.publicly-traded firms during the years 1996–2006, we analyze a population of hetero-geneous investment profiles with clear terminal valuations, lifespans, and distributions toentrepreneurs. The results paint a picture of steeply diminishing returns to invested ca-pital, where the primary benefit of equity investment is accelerated liquidity, not terminalvalue of the venture or entrepreneur returns.
& 2015 Elsevier Inc. All rights reserved.
1. Introduction
The assumption of capital constraints on entrepreneurs frames much entrepreneurship research (Holtz-Eakin et al., 1994)with the general expectation that in a new venture more cash is better. But owing to limited availability of data on theterminal liquidity value of new ventures, empirical examinations of the ultimate merits of this assumption are scarce. Re-searchers have far more knowledge about the start-up process and ongoing maintenance of ventures than they have aboutthe eventual harvested value (DeTienne, 2010; Mason and Harrison, 2006). In a recent review Carter (2011) concludes that,“[F]ew entrepreneurship scholars have focused on the individual financial rewards and consequences of venture creation…”
(p.40), and “Despite theoretical interest in the returns to entrepreneurship, there has been little supporting empiricism.”(p.41).
2. Literature
This study is most directly related to a very small set of empirical papers that deal with the financial rewards to en-trepreneurship at exit. Hall and Woodward (2010) analyzed the returns to entrepreneurship for the minority class of en-trepreneurs who receive venture capital financing. Using a remarkable dataset that captures virtually all the VC investmentsmade in the U.S. over a 20 year period, they find that approximately three quarters of VC-funded entrepreneurs make
Wiltbank), [email protected] (N. Dew), [email protected] (S. Read).

R. Wiltbank et al. / Journal of Business Venturing Insights 3 (2015) 16–23 17
nothing at exit, while a few make very large returns, resulting in a mean reward of around $6million at exit. The dis-advantage of studying VC-backed firms is evident in that ventures selected for VC investment are atypical of the generalpopulation and further skewed by the strategies VCs use to reach exit (Arora and Nandkumar, 2011). Related work focusingon liquidity through IPO (ex: Stuart et al., 1999) is narrower still, offering insights to that class of firm that (a) typicallyreceives venture financing and (b) goes on to issue a public equity offering. This represents about .05% of all new ventures(Rao, 2013). Two papers by Brau et al. (2003; 2010) stand out as they investigate primarily non-VC-funded ventures. In onestudy, Brau et al. (2003) relate the determinants of the decision to IPO a venture versus conduct a private sale and in follow-on research Brau et al. (2010) study harvesting strategies of ventures that simultaneously pursue IPO and private sale versusonly one or the other. Neither study considers the rewards to entrepreneurs at exit or the financial strategies used to achievethem.
Investigations that consider dependent variables beyond new venture valuation at liquidity frequently also adopt acapital constrained perspective. Work related to new venture growth benefits from a wider range of available dependentvariable constructs, connecting capital access with new firm scaling along measures such as turnover, assets (Desai et al.,2003) and employees (Davila et al., 2003). Although the relationship between capital and growth is generally positive, thereis no work that closes the loop to determine whether the capital used to drive growth is meaningful in the ultimatevaluation of the venture, or the eventual returns to the entrepreneur (Davidsson et al., 2009).
Work seeking to understand the overall rewards to entrepreneurship is also incomplete. Attributable in part to limiteddata availability, Moskowitz and Vissing-Jorgensen (2002:745) state that “[E]ntrepreneurial investment, which represents asubstantial fraction of many investors' portfolios, is relatively understudied and not well understood. Specifically, little isknown about the aggregate return to entrepreneurs' equity investments.” Of the two monetary components of rewards,earnings from trading (including personal remuneration) has been explored in the economics literature usually in com-parison to wage work (Åstebro, 2013; Hamilton, 2000). The second component – harvesting ownership in an enterprise atexit – has received less research attention and is focused on VC funded firms (Hall and Woodward, 2010).
3. Data
To investigate the relationship between capital constraints and the ultimate rewards to entrepreneurship we assembleda unique hand-gathered dataset comprising the entire universe of 3160 private firms acquired by U.S. publicly-traded en-tities during the years 1996–2006. The full inventory of sources and model variables is presented in Table 1.
The Thomson & Reuter's transaction data were complemented with details relevant to this study extracted from othersources. Capturing data on invested capital required analyzing the SEC filings associated with each and every acquisition.One of the authors, a former professional accountant, reviewed the financial statements of the sellers in those filings,separating the retained earnings and paid in capital details from the balance sheet. These data offered sufficient detail on2579 of the ventures that we could include them in our study. From the individual state business databases, we identified aseller incorporation date for 2125 of the ventures. We thus performed our analyses on the 1847 ventures for which we couldidentify both financial data and incorporation date. Finally, we gathered contextual data regarding VC activity in the sellers'
Table 1Variables.
Name Definition Data Source
Exit year Year seller acquired Thomson & Reuter's done deals database (www.donedeals.com)Valuation Total value of acquisitionShareholder equity Total shareholder equity of seller acquisition SEC 8K filings (http://edgar.sec.gov)Assets Total assets of seller at acquisitionRevenue Annual revenue of seller at acquisitionRetained earnings Accumulated surplus (deficit) of the seller from in-
corporation to acquisitionPaid in capital Total invested capital received by seller prior to
acquisitionTotal cash out Total cash received by seller at acquisitionInc year Year seller incorporated State Databases (MN ex: mblsportal.sos.state.mn.us)Seller population Seller state population at incorporation Longitudinal business database (www.census.gov)Exit VC activity VC disbursements in the buyer state in the acquisition year PriceWaterhouseCoopers Moneytree and NVCA database (www.
pwcmoneytree.com)Founding VC activity Average VC disbursements in the seller state over3 years around incorporation year
Industry SIC code of seller Environment, health and safety (www.ehso.com)Years Years from incorporation to acquisition CalculatedAverage growth rate Revenue of seller at acquisition divided by yearsDeal profit dollars Total cash out-paid in capitalReturn on capital Total cash out/paid in capital as a function of yearsSame state Binary: 1¼buyer & seller in same stateTech bubble Binary: 1¼tech firm between 98 and 00
R. Wiltbank et al. / Journal of Business Venturing Insights 3 (2015) 16–2318
and acquirers' states at incorporation year and acquisition year, state population, and industry SIC codes, merging all thedata together into a single dataset.
4. Analyses
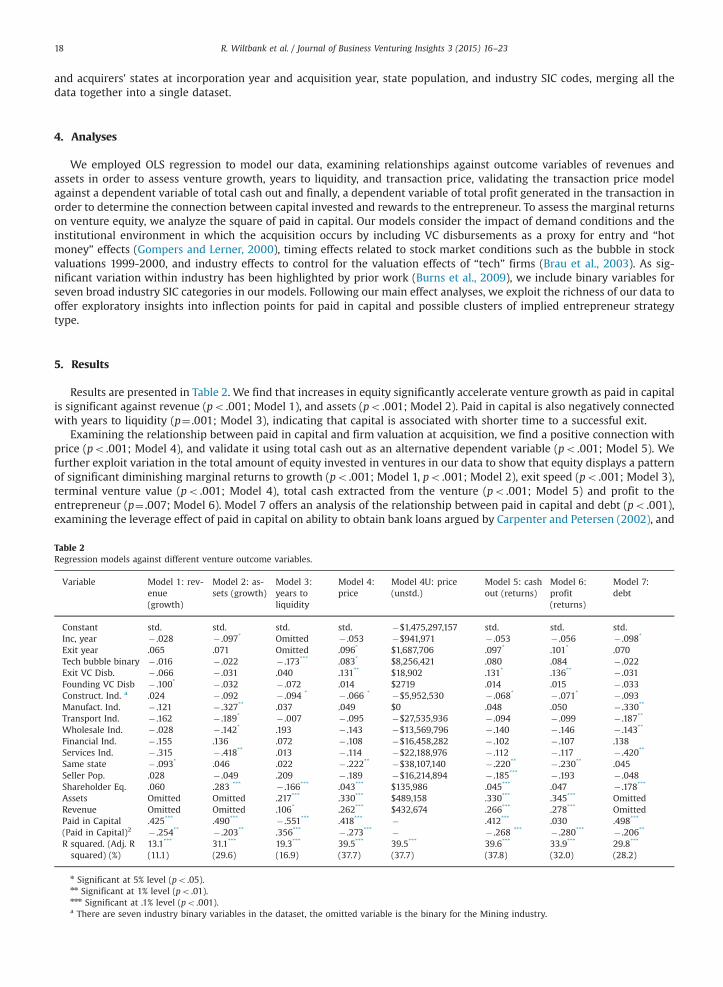
We employed OLS regression to model our data, examining relationships against outcome variables of revenues andassets in order to assess venture growth, years to liquidity, and transaction price, validating the transaction price modelagainst a dependent variable of total cash out and finally, a dependent variable of total profit generated in the transaction inorder to determine the connection between capital invested and rewards to the entrepreneur. To assess the marginal returnson venture equity, we analyze the square of paid in capital. Our models consider the impact of demand conditions and theinstitutional environment in which the acquisition occurs by including VC disbursements as a proxy for entry and “hotmoney” effects (Gompers and Lerner, 2000), timing effects related to stock market conditions such as the bubble in stockvaluations 1999-2000, and industry effects to control for the valuation effects of “tech” firms (Brau et al., 2003). As sig-nificant variation within industry has been highlighted by prior work (Burns et al., 2009), we include binary variables forseven broad industry SIC categories in our models. Following our main effect analyses, we exploit the richness of our data tooffer exploratory insights into inflection points for paid in capital and possible clusters of implied entrepreneur strategytype.
5. Results
Results are presented in Table 2. We find that increases in equity significantly accelerate venture growth as paid in capitalis significant against revenue (po .001; Model 1), and assets (po .001; Model 2). Paid in capital is also negatively connectedwith years to liquidity (p¼ .001; Model 3), indicating that capital is associated with shorter time to a successful exit.
Examining the relationship between paid in capital and firm valuation at acquisition, we find a positive connection withprice (po .001; Model 4), and validate it using total cash out as an alternative dependent variable (po .001; Model 5). Wefurther exploit variation in the total amount of equity invested in ventures in our data to show that equity displays a patternof significant diminishing marginal returns to growth (po .001; Model 1, po .001; Model 2), exit speed (po .001; Model 3),terminal venture value (po .001; Model 4), total cash extracted from the venture (po .001; Model 5) and profit to theentrepreneur (p¼ .007; Model 6). Model 7 offers an analysis of the relationship between paid in capital and debt (po .001),examining the leverage effect of paid in capital on ability to obtain bank loans argued by Carpenter and Petersen (2002), and
Table 2Regression models against different venture outcome variables.
Variable Model 1: rev-enue(growth)
Model 2: as-sets (growth)
Model 3:years toliquidity
Model 4:price
Model 4U: price(unstd.)
Model 5: cashout (returns)
Model 6:profit(returns)
Model 7:debt
Constant std. std. std. std. �$1,475,297,157 std. std. std.Inc, year � .028 � .097* Omitted � .053 �$941,971 � .053 � .056 � .098*
Exit year .065 .071 Omitted .096* $1,687,706 .097* .101* .070Tech bubble binary � .016 � .022 � .173*** .083* $8,256,421 .080 .084 � .022Exit VC Disb. � .066 � .031 .040 .131** $18,902 .131* .136** � .031Founding VC Disb � .100* � .032 � .072 .014 $2719 .014 .015 � .033Construct. Ind. a .024 � .092 � .094 * � .066 * �$5,952,530 � .068* � .071* � .093Manufact. Ind. � .121 � .327** .037 .049 $0 .048 .050 � .330**
Transport Ind. � .162 � .189* � .007 � .095 �$27,535,936 � .094 � .099 � .187**
Wholesale Ind. � .028 � .142* .193 � .143 �$13,569,796 � .140 � .146 � .143**
Financial Ind. � .155 .136 .072 � .108 �$16,458,282 � .102 � .107 .138Services Ind. � .315 � .418** .013 � .114 �$22,188,976 � .112 � .117 � .420**
Same state � .093* .046 .022 � .222** �$38,107,140 � .220** � .230** .045Seller Pop. .028 � .049 .209 � .189 �$16,214,894 � .185*** � .193 � .048Shareholder Eq. .060 .283 *** � .166*** .043*** $135,986 .045*** .047 � .178***
Assets Omitted Omitted .217*** .330*** $489,158 .330*** .345*** OmittedRevenue Omitted Omitted .106* .262*** $432,674 .266*** .278*** OmittedPaid in Capital .425*** .490*** � .551*** .418*** � .412*** .030 .498***
(Paid in Capital)2 � .254** � .203** .356*** � .273*** � � .268 *** � .280*** � .206**
R squared. (Adj. Rsquared) (%)
13.1*** 31.1*** 19.3*** 39.5*** 39.5*** 39.6*** 33.9*** 29.8***
(11.1) (29.6) (16.9) (37.7) (37.7) (37.8) (32.0) (28.2)
n Significant at 5% level (po .05).nn Significant at 1% level (po .01).nnn Significant at .1% level (po .001).a There are seven industry binary variables in the dataset, the omitted variable is the binary for the Mining industry.

R. Wiltbank et al. / Journal of Business Venturing Insights 3 (2015) 16–23 19
consistent with funding gaps research more generally (Colombo and Grilli, 2007; Cressy, 1996; Stiglitz and Weiss, 1981).The regressions we report in Table 2 were run on a subset of the data in which we removed outliers beyond three
standard deviations above and below the mean so our primary results would reflect the general population, not the extremevalues on both ends of the distribution. We validated the results without outliers, comparing them with those of thecomplete dataset and found the them substantially similar, with the exception of our findings regarding the impact of paidin capital squared on revenue and on assets (our models of growth: Models 1 & 2), where the coefficients move fromnegative and significant without outliers to positive and significant with outliers. These findings, summarized in Table 3,suggest that a power law (Crawford et al., 2014) may exist – i.e. the impact of paid in capital on growth diminishes for thecentral 6 standard deviations, but that for the outliers with the most successful exits, more cash meaningfully fuels evenmore extraordinary growth. Table 3 presents the coefficients of paid-in-capital squared with and without outliers for thetwo models in which the results were changed.
Table 3Comparison of regression coefficients without outliers and with outliers.
Model coefficient fromsample with outliersremoved (model Rsquared)
Model coefficientfrom full sample(model R squared)
(Paid in capital)2
on revenue(Model 1:growth)
� .254nn (12.3%) .69nnn
(69.7%)
(Paid in capital)2
on assets(Model 2:growth)
� .203nn .364nnn
(20.3%) (53.0%)
Some 415 of the ventures in our dataset were acquired for an amount less than the total paid-in-capital the venture hadreceived over its existence. As these observations may represent graceful exit instead of profitable harvest, we validated ourresults against a model that excluded these “graceful exit” observations. A number of our findings regarding the diminishingreturns on capital significantly changed when we analyzed only profitable harvest ventures. The paid-in-capital squaredterm for Price (Model 4), Cash Out (Model 5) and Profit (Model 6) lost significance, and significantly reversed sign forGrowth (Model 1). From these differences, we make the inference that for ventures that are ultimately acquired at a profit,the diminishing return to additional paid-in-capital is not as strong as for the population of private firms acquired by publicfirms, and capital significantly accelerates growth in one of our two models that analyze growth (Note: we appreciate areviewer calling this analysis to our attention).
Ventures with smaller amounts of equity invested made up an important subset of our sample (Fig. 1). Data indicate that 33% ofentrepreneurs in our sample founded ventures with $50,000 or less in total paid in capital and successfully harvested theirventures through a private sale to a public firm. This is consistent with prior work showing that in the U.S., new ventures arefounded with a median investment of $37,000 (Hurst and Lusardi, 2004 Table A4) and empirical data which indicate that businessowners and the self-employed report a relatively high median net worth of $176,000 (Cagetti and De Nardi, 2006:840 Table 4).
Fig. 1. Distribution of paid in capital.

Table 4Comparison of paid-in-capital coefficients with and without “Graceful Exits”.
Variable Model 1: revenue (growth) Model 4: price Model 5: cash out (returns) Model 6: profit (returns)
Reported Model (paid in capital)2 � .254nn � .273nnn � .268nnn � .280nnn
No “Graceful Exits” (paid in capital)2 .241nn � .131 � .140 � .155
R. Wiltbank et al. / Journal of Business Venturing Insights 3 (2015) 16–2320
Mean exit valuation (Fig. 2) was $48 M. The bottom 31% of our sample were acquired for less than $5 M with more thanhalf of those garnering valuations of more than $2 M. Bringing price, paid in capital and venture lifetime together in Fig. 3,we provide a visual summary of the complete set of exits observed in our sample. These findings suggest an importanttrade-off in financing strategy for entrepreneurial firms between the acceleration effects of equity (i.e. the rate of revenuegrowth, increase in speed to exit, and exit price) and the rate of return upon exit (which decreases as more equity is investedin these ventures). We split our data using the Retained Earnings and Paid in Capital variables to contrast the high equitystrategy (which we refer to as “Burners”, using capital in order to achieve growth and exit) against the low equity strategy(referred to as “Earners”, focusing on revenue growth, asset growth and exit value over the long run).
Table 5 provides detail on the differences between Earners and Burners for the variables of this study. Earners fundgrowth with money from sales revenue, rather than equity capital investment. Earners produce a mean of $3.9 M in retainedearnings prior to being acquired, and raise a mean of only $95,001 in invested capital, while burners accumulated lossesaveraging $15.6 M prior to being acquired, and raised $25.1 M of invested capital. The consequences of invested capital arematerial and significant. First, the burners took only 7 years from incorporation to acquisition, while the earners took 13.4years, but revenues of the two groups at the point of acquisition were comparable (not statistically different) at $25.5 M and$20.3 M respectively. Thus, invested capital accelerated burners' growth and time to exit, without positive impact on returnsor profit to the entrepreneur.
Burners grew and exited faster, but their overall use of capital significantly reduced their rate of return. As a group,Burners produced an ROIC of 12.6% relative to Earners at 50.7%. This ROIC calculation accounts for the difference in time toexit, higher level of total cash out at exit (Burners: $58 M vs. Earners: $24 M), and paid in capital. It assumes that all cashreturned from a venture goes equally to the providers of the invested capital, and does not account for special distributionsto ‘sweat equity’ holders, or debt repayments, which likely overestimates the returns to Burners relative to the Earners.
We analyzed average deal profit dollars (net of sales price less paid in capital) for each year the venture existed to gaugethe net profit to the entrepreneur for each year participating in the venture. In nominal terms, Burners averaged $8.3 M/year, reflecting their quicker pace to exit, compared to Earners at $1.8 M/year. However, with Burners' average paid in capitalof $25 M, we assume the presence of outside investors such as business angels and VC, which reduce the entrepreneur shareof proceeds based on post-financing equity share. Data on the equity share of entrepreneurs in each venture was notavailable for our data. We therefore assumed that the post-money share of the entrepreneur (or founding team) is 20%, inwhich case Burners delivered around $1.7 M/year to the entrepreneur, less than what Earners achieved in nominal terms.More conservative assumptions about the final payout of entrepreneurs in Burners would further reduce the annualnominal return to Burners relative to Earners (Hall and Woodward, 2010).
6. Discussion
A great deal of prior research on entrepreneurship has focused on venture growth as a key dependent variable of interest– it represents one of our most common measures of “success”. Davidsson et al. (2009) argue that an unintended con-sequence of the focus on growth is that it contributes towards a presumption that growth is a good thing in itself, and
Fig. 2. Distribution of exit value.

Fig. 3. Exit value with respect to paid in capital and years of venture life.
Table 5Group comparisons of burners and earners.
N¼598 Burners N¼552 Earners Test of sig-nificantdifference
Inc year 1994 1986 .000Seller population 16,919,799 11,163,727 .000Exit year 2001 2000 .000Tech bubble .25 .12 .000Exit VC activity (Ms) 289.0 155.0 .000Founding VC activity (Ms) 240.7 114.6 .000Same state .31 .27 .110Shareholder's equity (Ms) �6.69 4.07 .000Assets (Ms) 17.90 15.80 .660Revenue (Ms) 25.65 20.25 .270Retained earnings �15,580,381.00 3,851,361.30 .000Paid in capital 25,122,311 95,001 .000Total cash out 58,161,202 23,538,437 .000Years 7.0 13.4 .000Avg. growth rate (%) 365.9 150.7 .040Deal profit dollars 31,309,470 23,444,675 .160Return on capital (%) 12.6 50.7 .020
R. Wiltbank et al. / Journal of Business Venturing Insights 3 (2015) 16–23 21
therefore to a presumption in favor of variables that contribute to venture growth, including large influxes of investmentcapital, frequently channeled through venture capital firms. Our study confirms that equity investment is a significant driverof growth (Fig. 4).
However, by examining exit valuations with respect to incremental infusions of equity, we highlight the diminishingreturns to equity and encourage researchers to develop a more complete understanding of the returns among ventures thatare not funded with large capital injections, those enterprises that grow at a slower pace than the more prominent “ga-zelles” (Acs and Mueller, 2008). While research investigating growth would tend to encourage entrepreneurs to seek outventure capitalists and fund acceleration with equity capital, our study highlights questions about optimal strategies forentrepreneurs concerned with total rewards over the long run. We already know that over 75% of venture capital fundedentrepreneurs end up with nothing (Hall and Woodward, 2010). But after accounting for the closures/failures is the en-trepreneur better off with VC financing? In a success sample of IPOs, Florin (2005) found that VC financed entrepreneurs

$0
$200,000,000
$400,000,000
$600,000,000
$800,000,000
$1,000,000,000
$1,200,000,000
$1,400,000,000
$1,600,000,000
$1,800,000,000
$0 $300,000,000 $600,000,000 $900,000,000 $1,200,000,000
Pai
d In
Cap
ital I
n D
olla
rs
Exit Value in Dollars
Fig. 4. Plot of paid in capital against acquisition value (with regression line overlay).
R. Wiltbank et al. / Journal of Business Venturing Insights 3 (2015) 16–2322
generated, on average, significantly less wealth for themselves and were much more likely to be fired from the ventures theystarted. Our work, together with these prior studies, exposes a need to paint a more complete picture of the rewards todifferent entrepreneurial financing strategies. We highlight that a set of firms in our sample (Earners) appear to follow astrategy of patient entrepreneurship, perhaps akin to the quintessential patient investor-Warren Buffett. These “Earning”ventures grow over time through revenue and retained earnings instead of outside money. This “Earning” strategy, re-gardless of whether it is motivated by sociocultural or economic factors (Osei-Assibey, 2010) has several potential benefits –control being a key example – as described in the strategies of the fat or sleek (Hvide and Møen, 2010). Developing this lineof work and connecting it back into the economics stream that posited the connections between equity capital and en-trepreneurial value in the first place offers excellent potential for improving the conversation in the field.
7. Conclusion
Our main limitation forms the basis of conclusion. We acknowledge that analyses of private ventures that successfullysold out to public acquirers may not generalize outside that class of ventures. However, given the level of conjecture,assumption and real economic activity around equity capital and entrepreneurial ventures, combined with the dearth ofdata on entrepreneurial exit and the great difficulty in gathering a substantial dataset, our data add much to the currentstate of the conversation. Specifically, our data point to areas where future research might focus on a more detailed un-derstanding of the financing strategies of ventures, in particular the trade-off between speed to exit and return on equityinvested, and the instrumental relationship between financing strategy and the objectives of entrepreneurs. The implica-tions of these findings therefore touch entrepreneurs seeking to optimize the return on their equity invested, new ventureinvestors, policy makers seeking to influence venture growth, and researchers working at the intersection of startups andfinance.
Acknowledgement
The authors express their gratitude to the Atkinson Graduate School of Management at Willamette University for pro-viding support and funding for the extensive data collection associated with this project.
References
Acs, Z.J., Mueller, P., 2008. Employment effects of business dynamics: mice, gazelles and elephants. Small Bus. Econ. 30.1, 85–100.Arora, A., Nandkumar, A., 2011. Cash-out or flameout! opportunity cost and entrepreneurial strategy: theory, and evidence from the information security
industry. Manag. Sci. 57.10, 1844–1860.Åstebro, T., 2013. The economic returns to entrepreneurship–implications for stimulating entrepreneurship. Les Cah. Rech., 977.Brau, J.C., Francis, B., Kohers, N., 2003. The choice of IPO versus takeover: empirical evidence. J. Bus. 76.4, 583–612.Brau, J.C., Sutton, N.K., Hatch, N.W., 2010. Dual-track versus single-track sell-outs: an empirical analysis of competing harvest strategies. J. Bus. Ventur. 25.4,
389–402.Burns, L.R., Housman, M.G., Robinson, C.A., 2009. Market entry and exit by biotech and device companies funded by venture capital. Health Aff. 28 (1),
76–86.Cagetti, M., De Nardi, M., 2006. Entrepreneurship, frictions and wealth. J. Polit. Econ. 114.5, 835–870.Carpenter, R.E., Petersen, B.C., 2002. Capital market imperfections, high‐tech investment, and new equity financing. Econ. J. 112.477, F54–F72.Carter, S., 2011. The rewards of entrepreneurship: exploring the incomes, wealth, and economic well-being of entrepreneurial households. Entrep. Theory
Pract. 35 (1), 39–55.Crawford, G.C., McKelvey, B., Lichtenstein, B., 2014. The empirical reality of entrepreneurship: how power law distributed outcomes call for new theory and
method. J. Bus. Ventur. Insights. (accessed online January 2015).Colombo, M.G., Grilli, L., 2007. Funding gaps? Access to bank loans by high-tech start-ups. Small Bus. Econ. 29.1, 25–46.Cressy, R., 1996. Are business start-ups debt-rationed? Econ. J. 106.438, 1253–1270.

R. Wiltbank et al. / Journal of Business Venturing Insights 3 (2015) 16–23 23
Davidsson, P., Steffens, P., Fitzsimmons, J., 2009. Growing profitable or growing from profits: putting the horse in front of the cart? J. Bus. Ventur. 24.4,388–406.
Davila, A., Foster, G., Gupta, M., 2003. Venture capital financing and the growth of startup firms. J. Bus. Ventur. 18.6, 689–708.Desai, M., Gompers, P., Lerner, J., 2003. Institutions, Capital Constraints and Entrepreneurial Firm Dynamics: Evidence from Europe (No. w10165). NBER.DeTienne, D.R., 2010. Entrepreneurial exit as a critical component of the entrepreneurial process: theoretical development. J. Bus. Ventur. 25.2, 203–215.Florin, J., 2005. Is venture capital worth it? Effects on firm performance and founder returns. J. Bus. Ventur. 20.1, 113–135.Gompers, P., Lerner, J., 2000. Money chasing deals? The impact of fund inflows on private equity valuation. J. Financ. Econ. 55.2, 281–325.Hall, R.E., Woodward, S.E., 2010. The burden of the nondiversifiable risk of entrepreneurship. Am. Econ. Rev. 100, 1163–1194.Hamilton, B.H., 2000. Does entrepreneurship pay? An empirical analysis of the returns to self-employment. J. Polit. Econ. 108.3, 604–631.Holtz-Eakin, D., Joulfaian, D., Rosen, H.S., 1994. Sticking it out: entrepreneurial survival and liquidity constraints. J. Polit. Econ. 102.1, 53–75.Hurst, E., Lusardi, A., 2004. Liquidity constraints, household wealth, and entrepreneurship. J. Polit. Econ. 112.2, 319–347.Hvide, H.K., Møen, J., 2010. Lean and hungry or fat and content? Entrepreneurs' wealth and start-up performance. Manag. Sci. 56.8, 1242–1258.Mason, C.M., Harrison, R.T., 2006. After the exit: acquisitions, entrepreneurial recycling and regional economic development. Reg. Stud. 40.1, 55–73.Moskowitz, T.J., Vissing-Jorgensen, A., 2002. The returns of entrepreneurial investment: a private equity premium puzzle? Am. Econ. Rev. 92.4, 745–799.Osei-Assibey, E., 2010. Choosing not to borrow: an evaluation of perception and sociocultural factors underlying voluntary self-exclusion. IUP J. Financ.
Econ. 8.1/2, 36–66.Rao, D., 2013. Why 99.95% of Entrepreneurs Should Stop Wasting Time Seeking Venture Capital. Forbes (online, accessed September 2014).Stiglitz, J.E., Weiss, A., 1981. Credit rationing in markets with imperfect information. Am. Econ. Rev. 1981, 393–410.Stuart, T.E., Hoang, H., Hybels, R.C., 1999. Interorganizational endorsements and the performance of entrepreneurial ventures. Admin. Sci. Q. 44.2, 315–349.